
International Outsourcing, Labor Unions, and Job Stability ... · PDF filefindings suggested...
25
Journal of Applied Economics and Business Research JAEBR, 4 (4): 210-234 (2014) Copyright © 2014 JAEBR ISSN 1927-033X International Outsourcing, Labor Unions, and Job Stability: Evidence from U.S. Manufacturing in the 1980s Kuang-Chung Hsu 1 Department of Economics, University of Central Oklahoma, USA, Yungho Weng Department of Economics, National Chengchi University, Taiwan Abstract After the results from Feenstra and Hanson (1999) and Diebold et al. (1997) are combined, three questions arise: Did international outsourcing lead to a deterioration in the job stability of workers in manufacturing industries in the 1980s? What was the impact on workers of different skill levels? Can labor unions moderate the impact of international outsourcing on workers? This study employs CPS data, the NBER Manufacturing Productivity Database (Bartelsman and Gray, 1996), and the outsourcing data in Feenstra and Hanson (1999) to analyze the impact of international outsourcing, labor unions, and the interaction between outsourcing and labor unions on workers’ job retention rates. The results of this study show that international outsourcing decreases blue-collar but not white-collar workers’ job retention rates. Unions, however, can mitigate the negative impact of international outsourcing on the loss of blue-collar workers’ job stability. An increase in R&D expenditure enhances the job stability of white-collar workers. Jel codes: F16, J51, J63 Copyright © 2014 JAEBR Key words: International Outsourcing, Labor Union, Job Stability. 1. Introduction In recent years, a great deal of concern has been raised regarding the negative impact of international outsourcing on less-skilled labor. Debates such as whether international outsourcing causes wage inequality between less-skilled workers and skilled workers have attracted economists’ attention. 2 In comparison with the effects on wage inequality, however, the issue of job security or stability has been 1 Correspondence to Kuang-Chung Hsu, Email: [email protected] 2 See, e.g., Lawrence and Slaughter (1993), Berman et. al. (1994), Slaughter (1995), Feenstra and Hanson (1996, 1999), Jones and Kierzkowski (2001), Egger and Kreickemeier (2008), Sayek and Sener (2006), Hsu (2011), and Hsu and Chiang (2014).
Transcript of International Outsourcing, Labor Unions, and Job Stability ... · PDF filefindings suggested...

Journal of Applied Economics and Business Research JAEBR, 4 (4): 210-234 (2014)
Copyright © 2014 JAEBR ISSN 1927-033X
International Outsourcing, Labor Unions, and Job Stability:
Evidence from U.S. Manufacturing in the 1980s
Kuang-Chung Hsu1
Department of Economics, University of Central Oklahoma, USA,
Yungho Weng
Department of Economics, National Chengchi University, Taiwan
Abstract After the results from Feenstra and Hanson (1999) and Diebold et al. (1997) are combined, three
questions arise: Did international outsourcing lead to a deterioration in the job stability of workers
in manufacturing industries in the 1980s? What was the impact on workers of different skill levels?
Can labor unions moderate the impact of international outsourcing on workers? This study employs
CPS data, the NBER Manufacturing Productivity Database (Bartelsman and Gray, 1996), and the
outsourcing data in Feenstra and Hanson (1999) to analyze the impact of international outsourcing,
labor unions, and the interaction between outsourcing and labor unions on workers’ job retention
rates. The results of this study show that international outsourcing decreases blue-collar but not
white-collar workers’ job retention rates. Unions, however, can mitigate the negative impact of
international outsourcing on the loss of blue-collar workers’ job stability. An increase in R&D
expenditure enhances the job stability of white-collar workers.
Jel codes: F16, J51, J63 Copyright © 2014 JAEBR
Key words: International Outsourcing, Labor Union, Job Stability.
1. Introduction In recent years, a great deal of concern has been raised regarding the negative impact of international outsourcing on less-skilled labor. Debates such as whether international outsourcing causes wage inequality between less-skilled workers and skilled workers have attracted economists’ attention.2 In comparison with the effects on wage inequality, however, the issue of job security or stability has been
1Correspondence to Kuang-Chung Hsu, Email: [email protected] 2 See, e.g., Lawrence and Slaughter (1993), Berman et. al. (1994), Slaughter (1995), Feenstra and Hanson (1996, 1999), Jones and Kierzkowski (2001), Egger and Kreickemeier (2008), Sayek and Sener (2006), Hsu (2011), and Hsu and Chiang (2014).

Hsu & Weng 211
Copyright © 2014 JAEBR ISSN 1927-033X
less mentioned. Most studies agree that it takes less time to see the effects of a structural change on workers’ jobs than on their wages.3 Therefore, the first form of adversity that less-skilled workers are likely to encounter after their employers outsource their jobs to foreign countries is unemployment and job turnover.
Job stability has always been a frequently discussed topic in labor economics literature.4 Concerns over the influence of international outsourcing on workers’ jobs also have been the focus of much discussion, but the conclusions are mixed. Some empirical studies such as Egger et al. (2007),5 Geishecker (2008),6 and Munch (2010) have concluded that international outsourcing does have a negative impact on workers.7 All these three papers look at the adjustment process in employment in response to international outsourcing. The differences between Munch (2010), Egger et al. (2007), and Geishecker (2008) are with respect to the country considered, the methodology (single risk vs. competing risk models), and the modeling of unobserved heterogeneity. Geishecker (2008) found international outsourcing measured narrowly has a negative impact on all workers’ employment security, but the results of Munch (2010) indicated that international outsourcing, when broadly defined, increases only less-skilled workers’ unemployment risk.
Some research papers, however, have found evidence for a positive impact of internationalization on workers’ jobs. Becker and Muendler (2008) analyzed the impact of foreign direct investment (FDI) on job security and found that multinational enterprises (MNEs) that expand abroad retain more domestic jobs than competitors without foreign expansion. Maertz et al. (2010) investigated the reactions of survivors of downsizing through layoffs, offshoring, and outsourcing and found that layoffs and offshoring lowered organizational performance, reduced job security, lowered affective and calculative attachment, and raised turnover intention in remaining employees more than outsourcing did. Their explanation is that survivors of outsourcing feel that they could potentially work with outsourcing recipients.
Relevant topics such as globalization have also been addressed in relation to the issue of job stability. Kletzer (2001) examined the relationship between
3 See, e.g., Geishecker (2008). 4 See, e.g., Hall (1982), Leighton and Mincer (1982), Ureta (1992), Diebold et al. (1997), Farber (1998), Marcotte (1999), Bernhardt et al. (1999), and Heisz (2005). 5 Egger et al. (2007) analyzed the impact of international forces, including trade and outsourcing, on employment based on a sample of individual Austrian male workers over the period 1988-2001. By employing dynamic fixed effects multinomial logit models proposed by Honoré and Kyriazidou (2000), they found a significant negative impact of international outsourcing on the labor market turnover in manufacturing sectors with a comparative disadvantage. 6 Geishecker (2008) criticized Egger et al. (2007) for controlling only age as the time-varying individual characteristic in their analysis. Geishecker (2008) advanced the work performed by Munch (2010) and Egger et al. (2007) by adding a wider range of time-varying individual and workplace-related characteristics and by using monthly data instead of yearly data. The main finding of Geishecker (2008) was that international outsourcing, when narrowly defined, has a significant negative impact on individual employment security, regardless the level of skill of the workers. 7 Munch (2010) employed Danish manufacturing data covering the period 1990-2003 to estimate the impact of international outsourcing on individual job separation risk. Based on an individual-level empirical model with a distinction between job-to-job and job-to-unemployment transitions, his findings suggested that outsourcing, measured broadly, increased the unemployment risk of low-skilled workers, but that the quantitative impact was limited. The probability of the job-to-job changes has been raised for all education groups by international outsourcing.

International Outsourcing, Labor Unions, and Job Stability
Copyright © 2014 JAEBR ISSN 1927-033X
212
increasing foreign competition and job displacement in U.S. manufacturing over the 1975-94 period.8 They found strong positive relationships between increasing foreign competition and job displacement for some industries that compete with imports, but overall only a small share of job displacement can be explained by increased foreign competition.
In addition to the mixed results in the literature, the role of labor unions or trade unions has not been considered in discussions of the impact of outsourcing on job stability. Previous studies agree that unions decrease the layoff rate (Tinsley, 2003) and unemployment rate (Allen, 1988), as well as enhance job security (Bryson and White, 2006). It is also argued that labor unions motivate outsourcing: studies such as Abraham and Taylor (1996) have argued that since labor unions raise workers’ wages, they increase the probability of firms outsourcing their activities. Their argument is supported by the evidence from a survey of 2,700 establishments. However, Braun and Scheffel (2007) concluded that labor unions’ collective bargaining leads to a decline in outsourcing.9 Similarly, Lommerud et al. (2009) concluded that labor unions can make international outsourcing less profitable by increasing the wage rate of in-house production. Therefore, the ability of labor unions to moderate the negative impact of foreign outsourcing on job stability is also a topic of this study.
For the reasons just stated, we propose two questions. First, how job security is measured plays an important role in the discussion of the impact of international outsourcing on workers’ job security. Job retention rate, which is an important measure of workers’ job security and stability, has not been measured in the previous studies. Diebold et al. (1997) found that job retention rates were higher for white-collar workers but were lower for blue-collar workers in the U.S. during the 1980s. Studying that same period of time, Feenstra and Hanson (1999) found that international outsourcing decreased the relative wage of production workers to that of non-production workers. Based on the results of Diebold et al. (1997) and Feenstra and Hanson (1999), we infer that international outsourcing deteriorated blue-collar workers’ job retention rates in the 1980s. If our inference is true, this is one more finding in the literature that international outsourcing has a negative impact on unskilled workers. The present study tries to provide empirical evidence for our inference.
Second, we are interested in the function and role of labor unions when firms outsource in-house production overseas. Whether labor unions can moderate the impact of international outsourcing on workers’ job security is the second focus of our paper.
This study uses a sample period from 1980 to 1990 for two reasons. First, international outsourcing of U.S. manufacturing grew rapidly in the 1980s. This is the same sample period chosen by Feenstra and Hanson (1999) and Diebold et al. 8 International trade and international competition are two important factors that induce international outsourcing. See the discussions in McLaren (2000), Grossman and Helpman (2002), Görg and Hanley (2004), and Dіaz-Mora (2008). 9 The positive effect of labor unions on outsourcing is direct: it induces more outsourcing. An indirect effect, which reduces outsourcing, is based on the premise that the higher wage rate of the remaining in-house workers decreases the marginal benefit from outsourcing. Thus, if the indirect effect suppresses the direct effect, labor unionization can lead to a decline in outsourcing.
Hsu & Weng 213
Copyright © 2014 JAEBR ISSN 1927-033X
(1997). Second, labor union membership dramatically changed during the 1980s. The union membership density of U.S. manufacturing began declining in the 1950s. According to the CPS,10 private sector union density dropped dramatically during the 1970s and 1980s. In the 1990s, union density still declined, but at a slower pace. Although international outsourcing became more widespread during the 1990s and 2000s, unions in U.S. manufacturing industries became less influential.
The main contribution of this paper is that it is the first of its kind to empirically examine the effects of international outsourcing on workers’ job retention rates. Secondly, it also discusses whether labor unions can moderate the impact of international outsourcing on workers’ job stability.
The remainder of this paper is organized as follows: Section 2 states how job retention rates are measured. Section 3 describes the data and regression models in our study. In section 4 we present and discuss our regression results. Section 5 concludes our findings.
2. Measuring Job Stability and International Outsourcing
Hall (1982), Ureta (1992), and Diebold et al. (1997) evaluated workers’ job stability using the Current Population Survey (CPS) data to compute job retention rates. According to Hall (1982), to obtain a clear picture of the duration of workers’ jobs, it is necessary to know the projected likely additional time that a worker expects to spend in his current job. Job retention rates for a particular period provide us with an expected probability that a worker will retain his or her current job for a specific number of years. In Hall (1982), a job retention rate or probability is measured by a survival rate from one age-tenure category to another higher age-tenure category.
There are two ways to compute the job retention fraction. The first method uses cross-sectional data. If the number of people working in a calendar year t is 𝑁!, the number of workers in a calendar year s with at least τ years seniority is 𝑁!(𝜏). Then, if the focus is on workers with the 𝑖th skill level in the 𝑗th industry, the basic s-year estimated job retention rate for workers with τ years of tenure is computed as the ratio of the number of workers with at least τ years seniority in the tenure supplement s+τ years, 𝑁!!!,!"(𝜏), to the total number of workers in the tenure supplement s+τ years, 𝑁!!!,!". Formally,
𝑅!, !"! 𝜏 = !!!!, !" !!!!!, !"
, (1)
where 𝑅!, !"! 𝜏 represents the cross-sectional τ-year estimated job retention rate with s years as basic years for workers with the 𝑖th skill level in the 𝑗th industry. Job retention probabilities can also be obtained by employing multiple historical CPS tenure supplements. Following the notation used earlier, the historical calculation of the job retention rate for workers with the 𝑖th skill level in the 𝑗th industry, 𝑅!, !"! 𝜏 , is
10 This argument is made based on the data collected and estimated by Barry T. Hirsch and David A. Macpherson. See unionstats.com for details.

International Outsourcing, Labor Unions, and Job Stability
Copyright © 2014 JAEBR ISSN 1927-033X
214
𝑅!, !"! 𝜏 = !!!!, !" !!!, !"
. (2)
As discussed in Ureta (1992) and Diebold et al. (1997), the cross-sectional calculation requires that the number of beginners to be constant or at least remain similar across years. The historical calculation requires a stable survival function.11 In this paper, because of the limitations of the data, we employ the cross-sectional approach after assuming that the participation rates between arrivals in different cohorts, i.e., the gender and race that Ureta (1992) argued about, are no different across industries.12 The regression results for historical job retention rates are presented in the Appendix for the purpose of the robustness check.
This paper estimates international outsourcing by following the method in Feenstra and Hanson (1996, 1999). Outsourcing proportions are measured as the share of imported intermediate inputs in the total purchases of non-energy intermediates. There are two measures of imported intermediate inputs introduced in Feenstra and Hanson (1999). The first one considers all intermediate inputs that each manufacturing industry purchased from every other standard industrial classification (SIC) manufacturing industry.13 Some intermediate input purchases, however, may not involve outsourcing. For instance, the computer industry purchases plastic boxes. Hence, the second measure of international outsourcing only takes into account those intermediate inputs that are purchased from the same two-digit SIC manufacturing industry as the producing industry. Feenstra and Hanson (1999) referred to the first measure of international outsourcing as a broad measure of foreign outsourcing and the second as a narrow measure of outsourcing. Since the real foreign outsourcing ratio could fall between (or on either of) the broad and narrow measures, this study includes both of them.
3. Data and Regression Equation
The Current Population Survey (CPS) data are employed to calculate the job retention rate to proxy job stability. The CPS data also contain information regarding the union membership ratio, the union coverage ratio and individual characteristics. During the 80s, four tenure supplements were available. This study chooses CPS tenure supplements for 1983, 1987 and 1991 to compute four-year retention rates in each industry type for each of the two skill levels (i.e., blue-collar and white-collar workers). There are two reasons for doing that. First, the tenure questionnaire in 1981 was different from that in 1983, 1987 and 1991. Second, outsourcing data has been computed from the Economic Census published in 1982 and 1987. Since the job tenure supplements are included in the January CPS, the 1983 CPS is more reliable.
Although the historical job retention rate can be measured under an unstable survival function and nonconstant arrival rate, the use of multiple CPS supplements carries the risk of inaccuracy because of the variety of sampling sizes.14 This
11 Diebold et al. (1997) avoid the requirement of a stable function by adopting longer sequence CPS tenure supplements. See Diebold et al. (1997) for the details. 12 Section 4 provides the detailed reasons for the data restrictions in this study. 13 See equation (9) in Feenstra and Hanson (1999). 14 Some adjustments were made to this issue. The Annual Survey of Manufactures (ASM), which could give us the number of employed workers, and the CPS data, which can indicate the total number

Hsu & Weng 215
Copyright © 2014 JAEBR ISSN 1927-033X
drawback is especially considerable in an industrial-level study. In order to coordinate the two sets of data on international outsourcing, this study organizes data by manufacturing industries, and some industries have only a limited number of responses. After workers are grouped by skill level, the influence of different sample sizes becomes even more crucial. Therefore, cross-sectional job retention rates (hereafter: job retention rates) are employed in this study, based on the assumption that survival functions are unstable over time, although those determinants of survival functions besides the independent variables in our regression are similar across all manufacturing industries. The same assumption is also applied to overall arrival rates, which were not found to be constant, but were similar across all manufacturing industries.
Following Feenstra and Hanson (1999), there are two variables related to outsourcing in the regression equations. The first is the narrow measure of foreign outsourcing and the second is the difference between the broad measure and the narrow measure of international outsourcing. Data on international outsourcing and trade are obtained by the same sources in Feenstra and Hanson (1999).15 Based on the discussion in Section 2, Munch (2010), Egger et al. (2007), and Geishecker (2008) found a negative and significant effect on blue-collar workers’ job stability, but if international outsourcing (horizontal outsourcing) was caused by MNEs engaging in horizontal FDI mainly in the 1980s, a positive impact as in the results of Becker and Muendler (2008) is expected. The effect on white-collar workers’ job stability could be either positive or have no significant impact. It depends on whether foreign outsourcing caused serious job-to-job turnover in skilled workers. The overall effects are the sum of the effect of outsourcing on blue-collar workers and white-collar workers. It can be negative or have no significant effect.
Unionization can be measured by computing how many workers are union members (membership) and what percentage of workers are union members (coverage), as described in Freeman and Medoff (1979). This study takes both membership and coverage into consideration. An interaction term for international outsourcing and unionization can reveal whether labor unions can moderate the impact of foreign outsourcing on workers. A significant positive coefficient of the interaction term means that an increase in unionization can release the negative impact of foreign outsourcing on the workers’ job stability. We also construct a dummy variable that represents comparative labor union power. One industry’s unionism dummy variable equals 1 if the industry’s union coverage ratio is greater than the average ratio of all manufacturing industries.16 The coefficient of the interaction term of the measure of international outsourcing and the dummy variable denotes the impact of foreign outsourcing on the workers’ job stability in more unionized industries. On the contrary, the coefficient of the interaction term of international outsourcing and one minus the dummy variable denotes the impact of foreign outsourcing on the workers’ job stability in less unionized industries.
In addition to international outsourcing and unions, determinants such as the
of respondents in the sample, are employed in the adjustment. The after-adjustment job retention rates, however, are still unsatisfactory; some of them are still greater than one. 15 The authors would like to thank Dr. Hanson for providing outsourcing data. 16 Since some industries do not have data for the union membership of white-collar workers in some years, this study uses union coverage only in analyzing skilled workers.

International Outsourcing, Labor Unions, and Job Stability
Copyright © 2014 JAEBR ISSN 1927-033X
216
real output, number of employees, research and development (R&D) expenditure share, skilled to less-skilled workers ratio, average age, and average income per person in each industry are also included in the regressions. Real output and the number of employees are indicators of the industries’ economic activities. A straightforward example is that a decrease in output and employment means a decrease in labor demand which should lead to a deterioration in the workers’ job stability. However, because the hiring and laying off policy is part of the negotiation and bargaining process between the employer and the labor union, the real effect could be complicated.
An increase in the share of R&D expenditure, which shows the willingness of employers to improve their technology, should be of benefit to skilled workers but not to less-skilled workers. Munch (2010) found that R&D intensity reduces the probability of job separation, as well as the job change hazard rate and unemployment hazard rate.17 However, the results of Geishecker (2008) showed that the share of R&D expenditure in total output increase the employment hazard rate, especially for less-skilled workers. Thus, the effects of the R&D expenditure share should be negative to blue-collar workers’ job stability but positive to white-collar workers’ job stability.
The skilled to less-skilled workers ratio may be viewed as an indicator of the average educational level or technology level of an industry. If the results reveal a positive relationship between the ratio and the workers’ job stability, the employers who prefer to hire higher quality workers are also willing to retain their workers. A stable working environment provides workers with a chance to accumulate their job seniority. We expect there to be a positive relationship between the workers’ average age and their job retention rate. The average income per person denotes how much the employers are willing to pay to retain their workers. We also expect there to be a positive relationship between income and job stability.
Since the dependent variable is the 4-year retention rate, all explanatory variables take the form of the changes over a period of 4 years. However, only considering the effect of the changes in independent variables on job stability might be problematic. For instance, the percentage of union membership might be stable in an industry with a higher percentage of union membership, but its unions will play a more important role in wage bargaining and job retention compared to an industry with a small percentage of union workers. Larger industries and smaller industries might also be affected differently by international outsourcing. Thus, the 4-year average of real output, the number of employees, the skilled to unskilled labor ratio, and the percentage of union membership or coverage are also included in the regression equations.
Since the job retention rate ijR̂ is bounded between zero and one, a general logit specification is used.18 Variables preceded by a delta are the change in the variable during the 4-year span. The rest of the variables represent the averages for those variables in the 4-year period. For each category of workers, namely, All 17 The explanation in Munch (2010) is that since the industries with higher R&D intensity provide more training in firm-specific skills, they also wish to retain their workers. 18 Instead of using this log-adds ratio, one can use quasi-likelihood estimation method. See Papke and Wooldridge (1996) for details.
Hsu & Weng 217
Copyright © 2014 JAEBR ISSN 1927-033X
workers, Blue-collar workers, and White-collar workers, the regression equation is as follows:
)3(,
/&)ˆ1
ˆlog(
12111098
7654321
ijtijtjtN
jtD
ijtijt
ijtjtjtijtijtijtijttijt
ijt
eUnSoSoSoAgeAge
IpBWDRUnUnSScRR
+∗Δ+Δ+Δ++Δ+
Δ++++Δ++Δ+=−
βββββ
βββββββ
where i represents the type of workers that belong to one of All workers, Blue-collar workers, and White-collar workers; j stands for each of the 77 manufacturing industries;19 t indicates the year that belongs to one of 1983-1987 and 1987-1991; ijR̂ are the estimated job retention rates of each type of worker i in industry j; 𝑆!" is the measurement of the scale of industry j, which can be the logarithm of the number of type i workers employed in industry j, ijE or the
logarithm of real output of industry j, 𝑌!; ijUn stands for the labor union power of type i workers in industry j and is represented by the percentage of either union membership ( mem
ijUn ) or union coverage ( covijUn ); 𝑅&𝐷! is the average share of R&D
expenditure to the total value of shipments in industry j; jBW / is the white-collar
to blue-collar ratio of industry j;20 ijIp is the income per person of type i workers in industry j; 𝐴𝑔𝑒!" is the average age of the ith workers employed in industry j; jSo is the proportion of the production line outsourced, which includes the narrow definition of outsourcing ( j
NSo ) and is the difference between the broad definition
and the narrow definition ( jDSo ); ijUnSo∗Δ is the interaction term between
international outsourcing and the unionization variable.
R&D data are collected from the National Science Foundation (NSF).21 Industry-level data such as those for total output and employment can be found in the NBER Manufacturing Productivity Database (Bartelsman and Gray, 1996). Combining information from different datasets is an issue in this study. The NBER Manufacturing Productivity Database and the data on international outsourcing are obtained from the Annual Survey of Manufactures (ASM), whose industrial classification system is SIC for 1972 and 1987, but CPS data employs the census industrial classification system (CIC). By using the conversion bridge between 1972
19 There are 83 manufacturing industries in the CPS industrial code. Six of them do not have corresponding SIC codes and have thus had to be omitted. They are: not specified food industries (122); not specified metal industries (301); not specified machinery (332); not specified electrical machinery, equipment, and supplies (350); not specified professional equipment (382); and not specified manufacturing industries (392). 20 In the results that are not shown, we also included the change in the R&D variable and the change in the white-collar to blue-collar ratio in our regressions, but the results are not significant for all kinds of workers. 21 Total industrial R&D expenditure is recorded using two-digit SIC data. A part of the data in some years is being withheld to avoid the disclosure of information. We use the predicted values form simple regression estimation to fill out those blanks.

International Outsourcing, Labor Unions, and Job Stability
Copyright © 2014 JAEBR ISSN 1927-033X
218
SIC and 1980 CIC data, this study converts all data classified by SIC into 1980 CIC data.
Table 1a summarizes the mean, standard deviation, and minimum and maximum values of the change in all variables during 1983-1987 and 1987-1991, and Table 1b the average value from 1982 to 1987 (or 1983 to 1987) and 1987 to 1991 (or 1987 to 1992). The corresponding industrial codes are presented in the Appendix.22 Job retention rates for all workers from 1983 to 1987 were about 54%. Tobacco manufactures had the highest job retention rate during 1983-1987. White-collar workers had a higher job retention rate than blue-collar workers during that period. The job retention rate for all workers was lower after 4 years. From 1987 to 1991, the job retention rate for all workers was below 50%. Tires and inner tubes had the highest job retention rate during 1987 -1991.
Generally speaking, blue-collar workers had higher ratios of both labor union membership and union coverage than white-collar workers. Household appliances had the highest labor union membership and coverage ratio in 1983-1987, while if you only consider blue-collar workers during the same time, Watches, clocks, and clockwork operated devices had the highest union membership ratio and Engines and turbines had the highest union coverage ratio. Labor union membership and coverage ratios in Dyeing & finishing textiles, except wool & knit goods became the highest for both all workers and blue-collar workers during 1987-1991. From 1983-1991, both the ratio of labor union membership and the union coverage ratio fell. During 1983-1987, the average for workers in manufacturing industries with labor union membership was 5.2% and the ratio declined to 4.7% in 1987-1991. Structural clay products suffered the most both in terms of union membership and the coverage ratio in 1983-1987. Watches, clocks, and clockwork operated devices lost the most labor union membership and coverage for both all workers and blue-collar workers in 1987-1991.
The average share of R&D expenditure in total output decreased slightly in the 1980s. Guided missiles, space vehicles, and parts and photographic equipment and supplies were characterized by the highest investment in R&D compared to their output value share in 1982-1987 and 1987-1992, respectively. For most of the 1980s, the white-collar to blue-collar ratio was increasing for workers as a whole. Newspaper publishing and printing had the highest white-collar to blue-collar ratios in both 1982-1987 and 1987-1992, while Yarn, thread, and fabric mills had the lowest white-collar to blue-collar ratios during the same periods of time. Electronic computing equipment and Guided missiles, space vehicles, and parts saw their white-collar to blue-collar ratios increase the most in 1982-1987 and 1987-1992, respectively.
Although the average increment of the international outsourcing share decreased slightly from 1982-1987 to 1992-1987, the change in the portion of outsourcing (based on both the difference between the broad and narrow definitions and the narrow definition) was still increasing from 1982-1987 to 1987-1992 in the industry that had the fastest rate of increase. Watches, clocks, and clockwork-operated devices saw their proportion of outsourcing (narrowly measured) increase the most in both 1982-1987 and 1987-1992. The growth rate of real output 22 See Table A-1 in the Appendix for a detailed description of industrial codes.

Hsu & Weng 219
Copyright © 2014 JAEBR ISSN 1927-033X
went down over the two consecutive periods. The real output of Motor vehicles and motor vehicle equipment had the biggest increase in both 1982-1987 and 1987-1992.
Table 1a. Summaries of the Changes in All Variables
Variable Period Mean Std Dev Min Cod
e Max Code
sWorAllR kerˆ (%)
83-87 54.27 10.99 25.93 230 82.93 130 87-91 49.51 10.95 18.18 220 78.05 210
collarBlueR −ˆ (%)
83-87 52.31 11.91 22.22 230 83.33 130 87-91 47.67 12.36 10.00 220 78.57 210
collarWhiteR −ˆ (%)
83-87 58.30 15.61 0.00 220 100.00 261, 361 87-91 54.78 13.86 16.67 361 100.00 381, 220
memsWorAllUn kerΔ (%)
83-87 -1.07 3.79 -11.54 252 14.29 140 87-91 0.03 3.64 -10.53 381 11.62 190
memcollarBlueUn −Δ (%)
83-87 -0.69 6.49 -16.15 321 25.64 381 87-91 -1.67 6.52 -33.33 381 23.02 190
covker sWorAllUnΔ (%)
83-87 -1.19 3.82 -11.54 252 14.29 140 87-91 0.07 3.55 -10.53 381 11.62 190
covcollarBlueUn −Δ (%)
83-87 -0.68 6.50 -16.15 321 25.64 381 87-91 0.03 6.59 -33.33 381 23.02 190
covcollarWhiteUn −Δ (%)
83-87 -1.60 3.80 -14.29 381 10.00 361 87-91 0.03 2.77 -10.00 361 6.67 310
sWorAllAge kerΔ 83-87 0.77 2.10 -5.16 381 5.69 140 87-91 0.44 0.17 -17.93 220 20.34 381
collarBlueAge −Δ 83-87 0.69 2.67 -12.82 381 7.27 252 87-91 0.06 3.67 -9.64 201 20.67 381
collarWhiteAge −Δ 83-87 0.62 3.82 -7.00 150 14.6 361 87-91 0.19 3.72 -12.1 140 7.56 152
SoDΔ (%) 82-87 0.04 0.10 -0.28 391 0.43 151 87-92 0.04 0.11 -0.19 130 0.56 391
SoNΔ (%) 82-87 0.05 0.16 -0.41 112 0.58 381 87-92 0.03 0.14 -0.41 162 0.77 381
yΔ ( billions in 1987) 82-87 1925 5907 -3813 312 35410 351 87-92 827 2926 -881 261 18133 351
sWorAllE kerΔ (in 1000s) 82-87 121 2303 -5845 312 14316 341 87-92 -327 1102 -7552 341 1631 212
collarBlueE −Δ (in 1000s) 82-87 17 1234 -3416 312 5920 212 87-92 -225 646 -3814 341 1118 212
collarWhiteE −Δ (in 1000s) 82-87 104 1256 -2428 312 9337 341 87-92 -102 517 -3738 341 825 372
sWorAllIp kerΔ (in $1000) 82-87 5.11 1.82 0.74 100 10.76 130 87-92 4.94 1.77 2.01 100 10.29 200
collarBlueIp −Δ (in $1000) 82-87 4.31 1.78 -0.02 100 10.25 130 87-92 3.73 1.56 -0.22 321 8.99 200
collarWhiteIp −Δ (in $1000) 82-87 7.03 1.56 3.50 111 10.67 130 87-92 7.39 2.02 3.21 152 13.01 181

International Outsourcing, Labor Unions, and Job Stability
Copyright © 2014 JAEBR ISSN 1927-033X
220
Table 1b. Summaries of the Average of Variables in 1982, 1983, and 1987
Variable Year Mean Std Dev Min Code Max Code
memsWorAllUn ker (%)
83-87 5.21 3.13 0
220,38
0 13.27 340
87-91 4.69 3.29 0 a 15.48 140
memCollarBlueUn − (%)
83-87 7.29 4.37 0 b 20.51 381
87-91 6.86 4.66 0 c 22.65 140
covker sWorAllUn (%)
83-87 5.63 3.29 0
380,22
0 14.22 340
87-91 5.07 3.33 0
201,22
0 15.48 140
covCollarsBlueUn − (%)
83-87 7.62 4.49 0 b 21.26 310
87-91 7.29 4.60 0
201,22
0 22.65 140
covcollarWhiteUn − (%)
83-87 2.33 2.29 0 d 8.33 292
87-91 1.55 1.73 0 e 6.62 111
sWorAllAge ker 83-87 38.70 1.84 31.38 171 42.43 291
87-91 39.17 1.85 33.99 100 43.38 381
collarBlueAge − 83-87 38.31 1.89 33.14 370 41.86 291
87-91 38.69 2.15 31.94 370 43.27 140
collarWhiteAge − 83-87 39.83 2.62 29.81 171 45.50 150
87-91 40.24 2.37 33.46 171 46.47 221
DR& (%) 82-87 29.65 4.12 0.14 142 14.45 362
87-92 26.80 3.15 0.16 132 9.15 380
BW / (%) 82-87 47.96 34.03 12.59 142 182.74 171
87-92 49.47 37.38 12.37 142 200.46 171
y ( billions in 1987) 83-87 680 1234 6 261 9505 351
87-91 817 1554 5 261 11436 351
sWorAllE ker (in 1000s) 83-87 5189 7747 68 220 42057 342
87-91 5086 7777 62 220 39757 342
collarBlueE − (in 1000s) 83-87 3448 5146 57 220 29554 351
87-91 3343 5087 51 220 29542 351
collarWhiteE − (in 1000s) 83-87 1741 2925 12 220 14716 341
87-91 1742 3097 12 220 17515 341
a: 141, 201, 220, 232, 370. b: 370,220, 380. c: 220, 232, 141, 370, 201. d:110, 130, 132, 140, 141, 150, 181, 190, 191, 201, 220, 221, 222, 230, 231, 232, 241, 252, 261, 281, 380, 390. e:101, 102, 121, 130, 132, 140, 141, 150, 152, 161, 180, 201, 211, 220, 221, 222, 230, 231, 232, 241, 252, 261, 270, 280, 281, 290, 320, 370, 381, 391.

Hsu & Weng 221
Copyright © 2014 JAEBR ISSN 1927-033X
In 1987-1992, the number of employed workers, both blue-collar and white-collar, decreased. The Radio, TV, and communication equipment industries saw their numbers of both blue-collar and white-collar employees decrease the most in 1987-1992. The number of employed workers in Construction and material handling machines, both blue collar and white collar, decreased the most in 1982-1987. The demand for blue-collar labor in Miscellaneous plastics products increased the most in both 1982-1987 and 1987-1992. Although average income per person also decreased from 1982-1987 to 1987-1992, the income per person of white-collar workers was greater in 1987-1992 than in 1982-1987. The Drugs industry was the industry whose income per person for white-collar workers increased the most in 1987-1992. Tobacco manufactures saw both its blue-collar and white-collar workers’ income per person increase the most in 1982-1987.
4. Empirical Results
The regression estimation results are organized and analyzed according to the workers’ skill levels. All workers are considered first to see the overall effects, and then Blue-collar workers and White-collar workers are considered separately. The regression settings for All workers and Blue-collar workers are the same. The correlation coefficients between all independent variables show that the number of employed workers is highly correlated with real output, and the labor union membership ratio is correlated with the union coverage ratio.23 Thus, as shown in Tables 2 and 3, only regression 2 uses real output, and the rest of the regressions use the number of employed workers. Similarly, only regressions 3 and 5 have the union membership ratio as an explanatory variable. The union coverage ratio will be discussed with the rest of the regressions. Regression equations 4 and 5 have the interaction term for international outsourcing and unionization.
The difference in the regression setting of White-collar to All workers and Blue-collar workers is that there is no union membership ratio in the regressions. As shown in Table 4, there are three regressions instead of five. Again, the real output is still highly correlated with the number of white-collar workers employed. Thus, regression 2 takes real output into consideration and employment will be discussed in the rest of the regressions, i.e., regressions 1, and 3. Regression equation 3 has the interaction term for international outsourcing and unionization. DR& is included in the regressions and has important implications behind the results.24
4.1 All Workers
The results for all workers are presented in Table 2. Both the changes in and value of real output and employment have no significant effect on workers’ job retention rates. Although the change in labor union membership and the coverage ratio had no significant effect on the job retention rate for all workers in the 1980s, this study still found a support to the claim that labor unions enhance the workers’
23 The correlation coefficients for all workers, blue-collar workers, and white-collar workers are available from the authors upon request. 24 In unreported results, we found that the coefficients of R&D are statistically insignificant when data of All workers and Blue-collar workers are employed. Regression results of Blue-collar workers and All workers’ equation contains R&D as a independent variable are available from the authors upon request.

International Outsourcing, Labor Unions, and Job Stability
Copyright © 2014 JAEBR ISSN 1927-033X
222
job stability since the average level of labor union membership and the coverage ratio had a significant positive impact on labor’s job retention rate.
Table 2. Regression Results of All Workers’ Job Retention Rates
Independent Variable 1 2 3 4 5
sWorAllE kerΔ -0.168 -0.176 -0.476** -0.474** (1.50) (1.59) (3.09) (3.06)
sWorAllE ker 0.000 0.000 0.027 0.026 (0.01) (0.00) (0.96) (0.93)
yΔ 0.025 (0.29)
y 0.025 (1.29)
covker sWorAllUnΔ
1.347* 1.425* 0.629 (1.85) (1.94) (0.50)
covker sWorAllUn
3.536** 3.154** (3.89) (3.29)
memsWorAllUn kerΔ
1.242 0.537 (1.59) (0.44)
memsWorAllUn ker
3.592** (3.99)
BW / 0.216** 0.212** 0.229** (3.66) (4.13) (3.99)
sWorAllIp kerΔ 1.414** 1.015** 1.362** 1.963** 1.988** (2.48) (9.76) (2.40) (2.33) (2.35)
sWorAllAge kerΔ 1.121** 1.258** 1.059** (2.33) (2.71) (2.17)
sWorAllAge ker 4.290** 4.538** 4.299** (8.83) (9.69) (9.01)
100×Δ SoD -0.712** -0.636** -0.710** -2.194** -2.227** (3.12) (2.69) (3.10) (2.71) (2.80)
100×Δ SoN -0.255 -0.135 -0.274 -0.331 -0.334 (1.35) (0.80) (1.45) (1.20) (1.21)
covker sWorAll
D UnSo ∗Δ 26.253 (1.40)
memsWorAll
D UnSo ker∗Δ 28.902 (1.47)
Constant -16.270*** -17.423** -16.289** -0.607** -0.604** (9.60) (10.41) (9.76) (2.19) (2.18)
R-Squared 0.650 0.649 0.649 0.279 0.281 Note: N=154 in each specification and standard errors in all regressions are robust to heteroskedasticity. All regressions include a time dummy variable and are weighted by the average employment share of all manufacturing industries. The figures in parentheses are absolute values of t-statistics. The superscripts over the coefficient values indicate the levels of statistical significance as follows: **, at 5% or higher; *, 10%.
The main focus of this paper is international outsourcing. Outsourcing (narrowly measured) was found to have no significant effect on job retention rates, but outsourcing (difference), which is the difference between the broad and narrow

Hsu & Weng 223
Copyright © 2014 JAEBR ISSN 1927-033X
measures of outsourcing, had a significantly negative impact on the workers’ job retention rates. Although the coefficient of the interaction term for international outsourcing and labor unions is insignificant,25 it could be a mixed result from both blue-collar workers and white-collar workers.
Labor in the industries that have higher white-collar to blue-collar ratios had higher job retention rates in the 1980s, which implies that workers have better job security if they work for the industries that adopt higher technology and have higher average education levels. As we expected, average income per person and average age had a positive and significant effect on the workers’ job stability.
4.2 Blue-Collar Workers
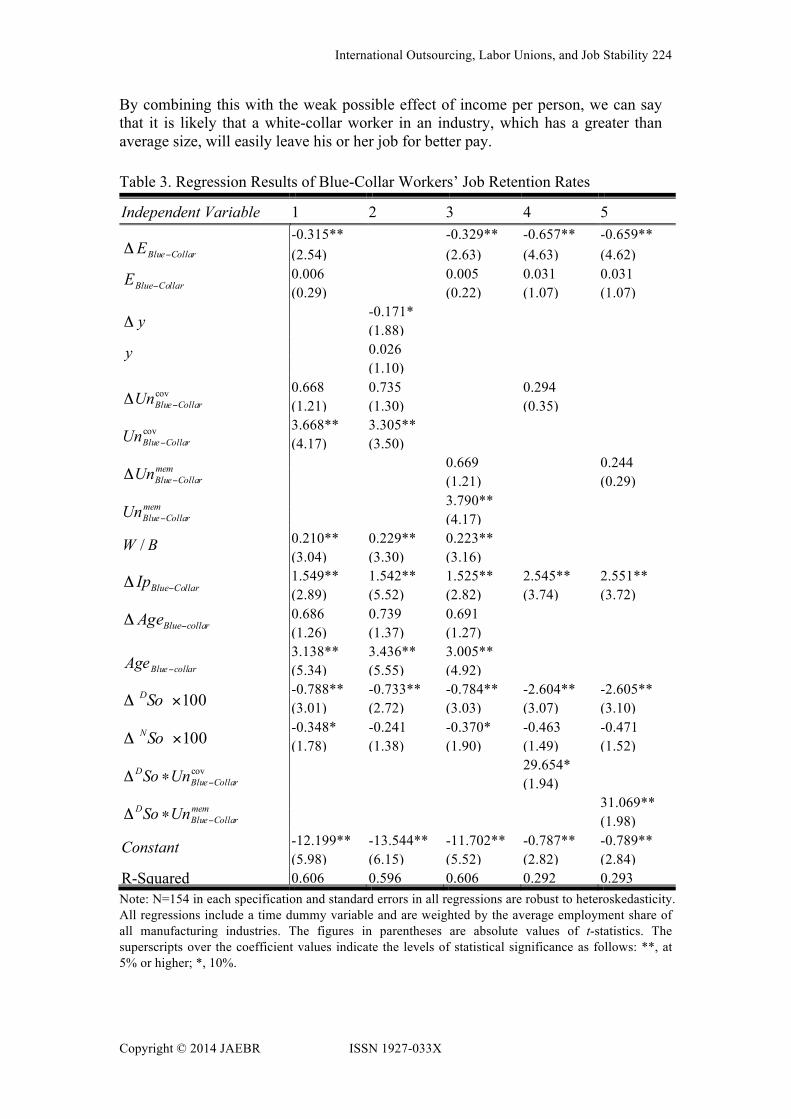
After checking the correlation coefficients between all independent variables using blue-collar workers only, this study has the same regression settings for blue-collar workers as for all workers.
Table 3 presents the results of regressions employing data only for blue-collar workers. Similar to the results in Table 2, the change in real output had no effect on the workers’ job stability. Surprisingly there was a significantly negative relationship between the change in employment and job retention rates for blue-collar workers. This result implies that when employers lay off their employees, the workers’ stability will not be reduced. One explanation for this is that because unions follow the “last-in, first-out” or “last hired, first fired” rule, the workers who have a higher likelihood of being laid off are those who are new hires.
International outsourcing (difference) decreased the number of blue-collar workers’ jobs in the 1980s. Labor unions, however, increased blue-collar workers’ job retention rates and reduced the negative impact of international outsourcing on blue-collar workers’ job stability. Blue-collar workers in industries with higher ratios of white-collar to blue-collar workers and higher incomes had higher job retention rates in the 1980s.
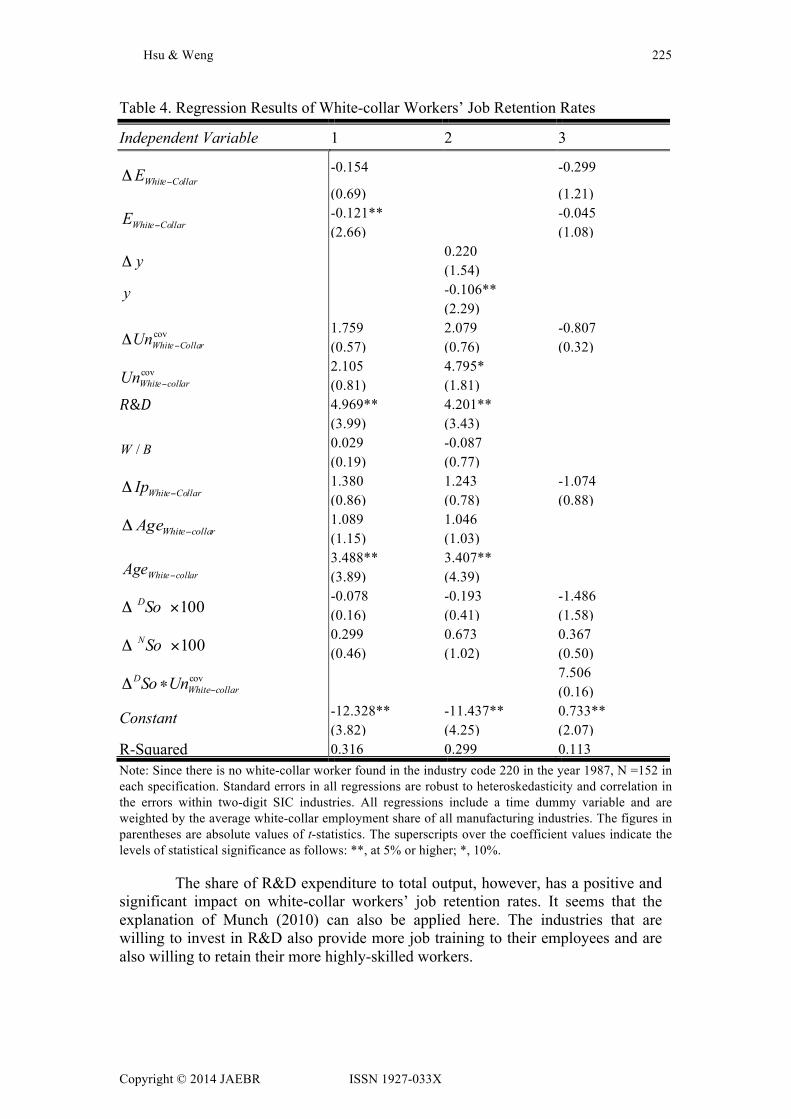
4.3 White-Collar Workers
Table 4 shows the regression equations in regard to white-collar workers. White-collar workers’ job retention rates, unlike blue-collar workers’ job retention rates, were not affected by international outsourcing (both narrowly measured and different), income, and labor unions. We did not find any evidence to support the view that job-to-job changes or reemployment caused by international outsourcing among white-collar workers is important enough to affect white-collar workers’ job stability. Our results of white-collar workers are in line with Munch (2010) but not Geishecker (2008). The average employment and output of industries has a surprisingly negative effect on white-collar workers’ job retention rates. One possible explanation is that larger industries provide larger job markets which provide more chances of reemployment and job matching to white-collar workers.
25 Since the average and not the change in labor union membership and the coverage ratio had a significant impact on labor’s job retention rate, the interaction term between foreign outsourcing and unionization only employs average unionization ratios.
International Outsourcing, Labor Unions, and Job Stability
Copyright © 2014 JAEBR ISSN 1927-033X
224
By combining this with the weak possible effect of income per person, we can say that it is likely that a white-collar worker in an industry, which has a greater than average size, will easily leave his or her job for better pay.
Table 3. Regression Results of Blue-Collar Workers’ Job Retention Rates
Independent Variable 1 2 3 4 5
CollarBlueE −Δ -0.315** -0.329** -0.657** -0.659** (2.54) (2.63) (4.63) (4.62)
CollarBlueE − 0.006 0.005 0.031 0.031 (0.29) (0.22) (1.07) (1.07)
yΔ -0.171* (1.88)
y 0.026 (1.10)
covCollarBlueUn −Δ
0.668 0.735 0.294 (1.21) (1.30) (0.35)
covCollarBlueUn −
3.668** 3.305** (4.17) (3.50)
memCollarBlueUn −Δ
0.669 0.244 (1.21) (0.29)
memCollarBlueUn −
3.790** (4.17)
BW / 0.210** 0.229** 0.223** (3.04) (3.30) (3.16)
CollarBlueIp −Δ 1.549** 1.542** 1.525** 2.545** 2.551** (2.89) (5.52) (2.82) (3.74) (3.72)
collarBlueAge −Δ 0.686 0.739 0.691 (1.26) (1.37) (1.27)
collarBlueAge − 3.138** 3.436** 3.005** (5.34) (5.55) (4.92)
100×Δ SoD -0.788** -0.733** -0.784** -2.604** -2.605** (3.01) (2.72) (3.03) (3.07) (3.10)
100×Δ SoN -0.348* -0.241 -0.370* -0.463 -0.471 (1.78) (1.38) (1.90) (1.49) (1.52)
covCollarBlue
D UnSo −∗Δ 29.654* (1.94)
memCollarBlue
D UnSo −∗Δ 31.069** (1.98)
Constant -12.199** -13.544** -11.702** -0.787** -0.789** (5.98) (6.15) (5.52) (2.82) (2.84)
R-Squared 0.606 0.596 0.606 0.292 0.293 Note: N=154 in each specification and standard errors in all regressions are robust to heteroskedasticity. All regressions include a time dummy variable and are weighted by the average employment share of all manufacturing industries. The figures in parentheses are absolute values of t-statistics. The superscripts over the coefficient values indicate the levels of statistical significance as follows: **, at 5% or higher; *, 10%.
Hsu & Weng 225
Copyright © 2014 JAEBR ISSN 1927-033X
Table 4. Regression Results of White-collar Workers’ Job Retention Rates
Independent Variable 1 2 3
CollarWhiteE −Δ -0.154 -0.299
(0.69) (1.21)
CollarWhiteE − -0.121** -0.045 (2.66) (1.08)
yΔ 0.220 (1.54)
y -0.106** (2.29)
covCollarWhiteUn −Δ
1.759 2.079 -0.807 (0.57) (0.76) (0.32)
covcollarWhiteUn −
2.105 4.795* (0.81) (1.81)
𝑅&𝐷 4.969** 4.201** (3.99) (3.43)
BW / 0.029 -0.087 (0.19) (0.77)
CollarWhiteIp −Δ 1.380 1.243 -1.074 (0.86) (0.78) (0.88)
collarWhiteAge −Δ 1.089 1.046 (1.15) (1.03)
collarWhiteAge − 3.488** 3.407** (3.89) (4.39)
100×Δ SoD -0.078 -0.193 -1.486 (0.16) (0.41) (1.58)
100×Δ SoN 0.299 0.673 0.367 (0.46) (1.02) (0.50)
covcollarWhite
D UnSo −∗Δ 7.506 (0.16)
Constant -12.328** -11.437** 0.733** (3.82) (4.25) (2.07)
R-Squared 0.316 0.299 0.113 Note: Since there is no white-collar worker found in the industry code 220 in the year 1987, N =152 in each specification. Standard errors in all regressions are robust to heteroskedasticity and correlation in the errors within two-digit SIC industries. All regressions include a time dummy variable and are weighted by the average white-collar employment share of all manufacturing industries. The figures in parentheses are absolute values of t-statistics. The superscripts over the coefficient values indicate the levels of statistical significance as follows: **, at 5% or higher; *, 10%.
The share of R&D expenditure to total output, however, has a positive and significant impact on white-collar workers’ job retention rates. It seems that the explanation of Munch (2010) can also be applied here. The industries that are willing to invest in R&D also provide more job training to their employees and are also willing to retain their more highly-skilled workers.
International Outsourcing, Labor Unions, and Job Stability
Copyright © 2014 JAEBR ISSN 1927-033X
226
5. Concluding Remarks
The study of the impact of international outsourcing on job security or job stability has been one of the fastest growing areas in economic research in recent decades. For instance, Munch (2010) employed Danish manufacturing data, Egger et al. (2007) analyzed Austrian male workers over the period 1988-200, and Geishecker (2008) employed German data in the 1990s. Most of them found that international outsourcing more or less led to a deterioration in the job security of unskilled labor.
Apart from the previous literature, this paper uses another measure, which is the worker’s job retention rate, to evaluate the impact of international outsourcing on the worker’s job stability. Diebold et al. (1997) found that the job stability of blue-collar workers in the U.S. tended to decrease in the 1980s. Combining the effects of international outsourcing on wage inequality, which are analyzed along with the results of Diebold et al. (1997), raises the question of whether international outsourcing should be responsible for the decrease in the blue-collar workers’ job retention rate in the 1980s. In addition, assessing whether labor unions can moderate the effects of international outsourcing on workers’ job stability is another issue in this study.
This study employs CPS data, the NBER Productivity Database, and the outsourcing data in Feenstra and Hanson (1999) to perform the analysis. The results show that the broad measure of international outsourcing decreases blue-collar workers’ job retention rates. This part of our results is in line with the results in Munch (2010). Labor unions not only have a positive impact on the blue-collar workers’ job stability, but moderate the negative impact of foreign outsourcing on the blue-collar workers’ job stability. Workers in the industries with higher average income and age also are also characterized by higher job retention rates. There is no effect of international outsourcing on the white-collar workers’ job stability but the industries with higher shares of expenditure on R&D in relation to their output are more willing to retain their white-collar workers.
The analyses in this study are based on industry-level data. Future studies could employ plant-level or establishment-level data to analyze this issue. At the firm level, the impact of outsourcing on employees can be analyzed from one decision to another. In particular, the negotiations that take place between employers and labor unions give rise to an interesting topic to study.
Acknowledgements
Financial support by Ministry of Science and Technology, grant number MOST NSC 102-2410-H-004 -015, is gratefully acknowledged. The usual disclaimer applies.
Appendix: Robustness Check
As introduced in the paper, the historical job retention rate can be used under an unstable survival function and nonconstant arrival rate. Because the sampling error is noticeable in this study, cross-sectional computation is employed instead. Here we still report the regression results for equation (3) with a historical job

Hsu & Weng 227
Copyright © 2014 JAEBR ISSN 1927-033X
retention rate for All workers and Blue-collar workers.26
Table A-2 reports the regression results for the All workers’ historical job retention rate. The setting of Table A-2 is the same as the one in Table 2 for the purpose of comparison. The change in unionization has a positive and significant effect on All workers’ job retention rates but the effect of the average unionization is positive but not significant. Average age and outsourcing (difference) still have a strong influence on All workers’ job stability. Workers in industries with comparatively weak unionization have lower job security than those in industries with strong unionization. Thus, the main results in Table 2 still hold.
The regression results for the Blue-collar workers’ historical job retention rate are presented in Table A-3. Similar to the results in Table 3, the average unionization has a positive and significant impact on the blue-collar workers’ job retention rates. Slightly different from the results for the international outsourcing effect in Table 3, both the broad measure of outsourcing and the narrow measure of outsourcing have a negative impact on the blue-collar workers’ job stability. Although unionization cannot moderate the negative impact of foreign outsourcing, workers in industries that have comparatively strong unionization have better job stability. Increasing personal income and working for an industry with a higher average age can significantly enhance the blue-collar workers’ job stability. By contrast, the ratio of white-collar to blue-collar workers has no significant effect on the workers’ job retention rate.
To sum up, the conclusions based on the results of using the historical job retention rate are in essence similar to those obtained from using cross-sectional job retention rates. International outsourcing when at least broadly measured has a negative impact on the blue-collar workers’ job stability. The other determinants such as income per person and average age still give rise to similar results.
26 Due to the incompleteness and inconsistency of the historical retention rate for white-collar workers, there is little reason to report the results here. Basically, the share of R&D expenditure in total output still has a positive effect on the white-collar workers’ job stability, while the impact of international outsourcing is negative but is sensitive to the setting of the regressions.

International Outsourcing, Labor Unions, and Job Stability
Copyright © 2014 JAEBR ISSN 1927-033X
228
References
Abraham, K.G., Taylor, S.K., 1996. Firms' use of outside contractors: theory and evidence. Journal of Labor Economics 14 (3), 394-424.
Allen, S.G., 1988. Unions and job security in the public sector, In: R.B., Freeman & C. Ichniowski (Eds.), When public sector workers unionize. National Bureau of Economic Research Project Report series, Chicago, 271-296.
Bartelsman, E.J., Gray, W., 1996. The NBER manufacturing productivity database. National Bureau of Economic Research, Inc, NBER Technical Working Paper: 205.
Becker, S.O., Muendler, M.A., 2008. The effect of FDI on job security. The B.E. Journal of Economic Analysis and Policy: Advances 8 (1), 1-45.
Berman, E., Bound, J., Griliches, Z., 1994. Changes in the demand for skilled labor within U.S. manufacturing: Evidence from the annual survey of manufactures. Quarterly Journal of Economics 109 (2), 367-397.
Bernhardt, A., Morris, M., Handcock, M.S., Scott, M.A., 1999. Trends in job instability and wages for young adult men. Journal of Labor Economics 17 (4), S65-90.
Braun, S., Scheffel, J., 2007. Does international outsourcing depress union wages? Sonderforschungsbereich 649, Humboldt University, Berlin, Germany, SFB 649 Discussion Papers: SFB649DP2007-033.
Bryson, A., White, M., 2006. Unions, within-workplace job cuts and job security guarantees. Centre for Economic Performance, LSE, CEP Discussion Papers.
Diaz-Mora, C., 2008. What factors determine the outsourcing intensity? A dynamic panel data approach for manufacturing industries. Applied Economics 40 (19-21), 2509-2521.
Diebold, F.X., Neumark, D., Polsky, D., 1997. Job stability in the United States. Journal of Labor Economics 15 (2), 206-233.
Egger, H., Kreickemeier, U., 2008. International fragmentation: Boon or bane for domestic employment? European Economic Review 52 (1), 116-132.
Egger, P., Pfaffermayr, M., Weber, A., 2007. Sectoral adjustment of employment to shifts in outsourcing and trade: Evidence from a dynamic fixed effects multinomial

Hsu & Weng 229
Copyright © 2014 JAEBR ISSN 1927-033X
logit model. Journal of Applied Econometrics 22 (3), 559-580.
Farber, H., 1998. Mobility and stability: The dynamics of job change in labor markets. Princeton University, Department of Economics, Industrial Relations Section., Working Papers: 400.
Feenstra, R.C., Hanson, G.H., 1996. Globalization, outsourcing, and wage inequality. American Economic Review 86 (2), 240-245.
Feenstra, R.C., Hanson, G.H., 1999. The impact of outsourcing and high-technology capital on wages: Estimates for the United States, 1979-1990. Quarterly Journal of Economics 114 (3), 907-940.
Freeman, R.B., Medoff, J.L., 1979. New estimates of private sector unionism in the United States. Industrial and Labor Relations Review 32 (2), 143-174.
Geishecker, I., 2008. The impact of international outsourcing on individual employment security: A micro-level analysis. Labour Economics 15 (3), 291-314.
GÖrg, H., Hanley, A., 2004. Does outsourcing increase profitability? Economic and Social Review 35 (3), 267-287.
Grossman, G.M., Helpman, E., 2002. Integration versus outsourcing in industry equilibrium. Quarterly Journal of Economics 117 (1), 85-120.
Hall, R.E., 1982. The importance of lifetime jobs in the U.S. economy. American Economic Review 72 (4), 716-724.
Heisz, A., 2005. The evolution of job stability in Canada: Trends and comparisons with U.S. results. Canadian Journal of Economics 38 (1), 105-127.
Honoré, B.E., Kyriazidou, E., 2000. Panel data discrete choice models with lagged dependent variables. Econometrica 68 (4), 839-874.
Hsu, K-C., 2011. Does outsourcing always benefit skilled labor?, Review of International Economics 19, 539-554.
Hsu, K-C., Chiang, H-C., 2014, The impact of international outsourcing on U.S. workers’ wage: Rethinking the role of innovation. International Journal of Economics and Finance 6 (5), 1-16.

International Outsourcing, Labor Unions, and Job Stability
Copyright © 2014 JAEBR ISSN 1927-033X
230
Jones, R.W., Kierzkowski, H., 2001. Globalization and the consequences of international fragmentation, In: G.A. Calvo, R. Dornbusch & M. Obstfeld (Eds.), Money, capital mobility, and trade: Essays in honor of Robert A. Mundell, MIT Press, Cambridge, 365-383.
Kletzer, L.G., 2001. International trade and job displacement in U.S. manufacturing, 1979-1991, In: D. Greenaway & D.R. Nelson (Eds.), Globalization and labour markets. Volume 2: Elgar Reference Collection. Globalization of the World Economy, vol. 10, Cheltenham, U.K., 88-122.
Lawrence, R.Z., Slaughter, M.J., 1993. International trade and american wages in the 1980s: Giant sucking sound or small hiccup? Brookings Papers on Economic Activity, 161-210.
Leighton, L.S., Mincer, J., 1982. Labor turnover and youth unemployment. National Bureau of Economic Research, Inc, NBER Working Papers: 0378.
Lommerud, K.E., Meland, F., Straume, O.R., 2009. Can deunionization lead to international outsourcing? Journal of International Economics 77 (1), 109-119.
Maertz, C.P. Jr., Wiley, J.W., LeRouge, C., Campion, M.A., 2010. Downsizing effects on survivors: Layoffs, offshoring, and outsourcing. Industrial Relations 49 (2), 275-285.
Marcotte, D.E., 1999. Has job stability declined? Evidence from the panel study of income dynamics. American Journal of Economics and Sociology 58 (2), 197-216.
McLaren, J., 2000. Globalization and vertical structure. American Economic Review 90 (5), 1239-1254.
Munch, J.R., 2010. Whose job goes abroad? International outsourcing and individual job separations. Scandinavian Journal of Economics 112 (2), 339-360.
Papke, L.E., Wooldridge, J M. 1996. Econometric methods for fractional response variables with an application to 401(k) plan participation rates. Journal of Applied Econometrics 11 (6), 619-632.
Sayek, S., Sener, F., 2006. Outsourcing and wage inequality in a dynamic product cycle model. Review of Development Economics 10 (1), 1-19.
Slaughter, M.J., 1995. Multinational corporations, outsourcing, and American wage

Hsu & Weng 231
Copyright © 2014 JAEBR ISSN 1927-033X
divergence. National Bureau of Economic Research, Inc, NBER Working Papers: 5253.
Tinsley, V.V., 2003. Firms and Layoffs: The impact of unionization on involuntary job loss. Center for Economic Studies, U.S. Census Bureau, Working Papers.
Ureta, M., 1992. The importance of lifetime jobs in the U.S. economy, revisited. American Economic Review 82 (1), 322-335.

International Outsourcing, Labor Unions, and Job Stability
Copyright © 2014 JAEBR ISSN 1927-033X
232
Appendix Table A-1. Industrial Codes
Meat products 100 Printing, publishing, & allied industries, except newspapers
172 Miscellaneous wood products 241 Metalworking
machinery 320
Dairy products 101 Plastics, synthetics, and resins 180 Furniture and fixtures 242 Office and accounting
machines 321
Canned and preserved fruits and vegetables 102 Drugs 181 Glass and glass
products 250 Electronic computing equipment 322
Grain mill products 110 Soaps and cosmetics 182 Cement, concrete, gypsum, and plaster products
251 Machinery, except electrical, n.e.c. 331
Bakery products 111 Paints, varnishes, and related products 190 Structural clay
products 252 Household appliances 340
Sugar and confectionery products
112 Agricultural chemicals 191 Pottery and related
products 261 Radio, T.V., and communication equipment
341
Beverage industries 120 Industrial and miscellaneous chemicals
192 Miscellaneous nonmetallic mineral & stone products
262 Electrical machinery, equipment, and supplies, n.e.c.
342
Miscellaneous food preparations & kindred products
121 Petroleum refining 200 Blast furnaces, steelworks, rolling & finishing mills
270 Motor vehicles and motor vehicle equipment
351
Tobacco manufactures 130
Miscellaneous petroleum and coal products
201 Iron and steel foundries 271 Aircraft and parts 352
Knitting mills 132 Tires and inner tubes 210 Primary aluminum industries 272 Ship and boat
building and repairing 360
Dyeing & finishing textiles, except wool & knit goods
140 Other rubber products, and plastics footwear and belting
211 Other primary metal industries 280 Railroad locomotives
and equipment 361
Floor coverings except hard surface 141 Miscellaneous
plastics products 212 Cutlery, hand tools, and other hardware 281
Guided missiles, space vehicles, and parts
362
Yarn, thread, and fabric mills 142 Leather tanning and
finishing 220 Fabricated structural metal products 282
Cycles and miscellaneous transportation equipment
370
Miscellaneous textile mill products 150 Footwear, except
rubber and plastic 221 Screw machine products 290
Scientific and controlling instruments
371
Apparel and accessories, except knit
151 Leather products, except footwear 222 Metal forgings and
stampings 291 Optical and health services supplies 372
Miscellaneous fabricated textile products
152 Logging 230 Ordnance 292 Photographic equipment and supplies
380
Pulp, paper, and paperboard mills 160 Sawmills, planning,
mills, and millwork 231 Miscellaneous fabricated metal products
300 Watches, clocks, and clockwork operated devices
381
Miscellaneous paper and pulp products 161 Wood buildings and
mobile homes 232 Engines and turbines 310 Toys, amusement, and sporting goods 390
Paperboard containers and boxes 162
Farm machinery and equipment 311
Miscellaneous manufacturing industries
391
Newspaper publishing and printing 171
Construction and material handling machines
312
Note: n.e.c. is an abbreviation for not elsewhere classified.

Hsu & Weng 233
Copyright © 2014 JAEBR ISSN 1927-033X
Table A-2. Regression Results of All Workers’ Historical Job Retention Rates
Independent Variable 1 2 3 4 5
sWorAllE kerΔ 0.088 0.081 -0.222 -0.219
(0.37) (0.35) (0.96) (0.94)
sWorAllE ker 0.031 0.029 0.060 0.058 (0.98) (0.92) (1.44) (1.39)
yΔ 0.097 (0.81)
y 0.063* (1.93)
covker sWorAllUnΔ
3.676** 3.706** 2.714 (2.25) (2.32) (1.61)
covker sWorAllUn 3.485* 2.747
(1.78) (1.51) mem
sWorAllUn kerΔ 3.226** 2.287 (2.04) (1.44)
memsWorAllUn ker 3.503*
(1.70)
BW / 0.158 0.122 0.180 (1.12) (0.94) (1.28)
sWorAllIp kerΔ 2.459* 2.106** 2.373* 2.737** 2.756** (1.91) (4.06) (1.82) (2.58) (2.60)
sWorAllAge kerΔ -0.017 0.130 -0.131 (0.02) (0.14) (0.14)
sWorAllAge ker 4.366** 4.381** 4.388** (3.75) (4.08) (3.70)
100×Δ SoD -0.858** -0.749** -0.831** -2.173** -2.170** (2.75) (2.37) (2.62) (2.21) (2.21)
100×Δ SoN -0.420 -0.427 -0.442 -0.551 -0.556 (1.02) (1.10) (1.09) (1.26) (1.28)
covker sWorAll
D UnSo ∗Δ 21.064 (0.89)
memsWorAll
D UnSo ker∗Δ 22.928 (0.89)
Constant -16.978**
**
-17.513**
*
-17.028**
*
-1.050**
*
-1.038**
* (4.12) (4.59) (4.06) (2.52) (2.48) R-Squared 0.382 0.397 0.376 0.176 0.172 Note: N=154 in each specification and standard errors in all regressions are robust to heteroskedasticity. All regressions include a time dummy variable and are weighted by the average employment share of all manufacturing industries. The figures in parentheses are absolute values of t-statistics. The superscripts over the coefficient values indicate the levels of statistical significance as follows: **, at 5% or higher; *, 10%.

International Outsourcing, Labor Unions, and Job Stability
Copyright © 2014 JAEBR ISSN 1927-033X
234
Table A-3. Regression Results of Blue-Collar Workers’ Historical Job Retention Rates
Independent Variable 1 2 3 4 5
CollarBlueE −Δ -0.076 -0.093 -0.364* -0.366*
(0.37) (0.46) (1.82) (1.83)
CollarBlueE − 0.036 0.034 0.065 0.064 (0.96) (0.90) (1.35) (1.34)
yΔ -0.080 (0.55)
y 0.062 (1.51)
covCollarBlueUn −Δ
1.091 1.115 0.932 (1.04) (1.06) (0.87)
covCollarBlueUn −
3.938** 3.286** (2.36) (2.07)
memCollarBlueUn −Δ
1.020 0.780 (0.96) (0.72)
memCollarBlueUn −
4.102** (2.35)
BW / 0.141 0.110 0.141 (0.96) (0.74) (0.93)
CollarBlueIp −Δ 2.608** 2.585** 2.585** 3.212** 3.225** (2.61) (2.56) (2.56) (3.67) (3.67)
collarBlueAge −Δ -0.558 -0.515 -0.566 (0.56) (0.52) (0.56)
collarBlueAge − 2.436** 2.609** 2.280** (2.57) (2.71) (2.30)
100×Δ SoD -0.967** -0.885** -0.956** -2.159* -2.236* (2.94) (2.69) (2.92) (1.85) (1.90)
100×Δ SoN -0.663* -0.654** -0.686* -0.810* -0.815* (1.85) (1.96) (1.93) (1.93) (1.95)
covCollarBlue
D UnSo −∗Δ 17.730 (0.86)
memCollarBlue
D UnSo −∗Δ 20.153 (0.92)
Constant -10.073** -11.171** -9.489** -1.199** -1.196** (2.98) (3.18) (2.69) (2.51) (2.50)
R-Squared 0.319 0.327 0.320 0.172 0.172 Note: N=154 in each specification and standard errors in all regressions are robust to heteroskedasticity. All regressions include a time dummy variable and are weighted by the average employment share of all manufacturing industries. The figures in parentheses are absolute values of t-statistics. The superscripts over the coefficient values indicate the levels of statistical significance as follows: **, at 5% or higher; *, 10%.