International Migration and Development - World...
57
International Migration and Development Gordon H. Hanson University of California, San Diego and NBER August 2007 Abstract . In this chapter, I selectively review academic literature on the causes and consequences of emigration from developing countries. My aim is to identify facts about international migration that are relevant to those concerned about why labor moves between countries and how these movements affect sending-country economies. Empirical work on global labor flows is still in an early state. As is often the case, the literature provides incomplete answers to some of the most urgent questions. Nevertheless, recent work yields a number of robust results and is helpful for identifying where future research should be directed.
Transcript of International Migration and Development - World...

International Migration and Development
Gordon H. Hanson University of California, San Diego and NBER
August 2007
Abstract. In this chapter, I selectively review academic literature on the causes and consequences of emigration from developing countries. My aim is to identify facts about international migration that are relevant to those concerned about why labor moves between countries and how these movements affect sending-country economies. Empirical work on global labor flows is still in an early state. As is often the case, the literature provides incomplete answers to some of the most urgent questions. Nevertheless, recent work yields a number of robust results and is helpful for identifying where future research should be directed.
1
1. Introduction
A decade ago, trade and investment liberalization dominated the global economic
policy agenda. The WTO had recently been created, the US, Mexico and Canada were
implementing NAFTA, and much of Southeast Asia and South America were near the
peak of an economic boom that was driven in part by greater openness to inflows of
foreign capital. In bilateral and multilateral discussions of economic integration, global
migration was often missing from the docket entirely.
Today, international labor flows are seen as an integral part of the process of
globalization. Between 1990 and 2005, the number of individuals residing outside of
their country of birth grew from 154 million to 190 million, reaching a level equivalent to
3% of the world population (United Nations, 2006). In many developing countries,
emigration rates have increased dramatically. Between 1990 and 2000, the fraction of the
adult population living in OECD countries rose from 30% to 35% in Jamaica, 14% to
20% in El Salvador, 8% to 13% in the Dominican Republic, 8% to 12% in Mexico, 7% to
12% in Haiti, 4% to 8% in Honduras, and 2% to 6% in Ecuador.1
The growth in labor flows from low-income to high-income countries has not
been greeted with universal enthusiasm, either by policy makers or academics. In theory,
international migration increases economic efficiency by shifting labor from low-
productivity to high-productivity environments. As workers move from Central America
to the US, North Africa to Europe, or Southeast Asia to Australia, the global labor supply
shifts from labor-abundant to labor-scarce economies, compressing international
differences in factor prices and raising global GDP. Migrants enjoy large income gains
(Rosenzweig, 2007), family members at home share in these gains through remittances 1 See Docquier and Marfouk (2006). Adults are those 25 years and older.

2
(Ozden and Schiff, 2006; Fajnzylber and Humberto Lopez, 2007), and non-migrating
workers in the sending country enjoy higher wages thanks to a drop in local labor supply
(Aydemir and Borjas, 2007). What is not to like?
One source of dissension is that international migration redistributes income
within and between countries. It thus comes as no shock that inflows of foreign labor
provoke political conflict and have become a frequent topic of debate in labor-importing
countries. More surprising, perhaps, is that economists are often among those criticizing
migration. In the literature, one finds two broad complaints. In low-income sending
countries, the concern has long been that the wrong individuals leave (e.g., Bhagwati and
Hamada, 1974). In most of the developing world, the more skilled have the highest
propensity to emigrate (see Figure 4). If there are positive spillovers associated with
accumulating human capital (Lucas, 1988) or education is public and financed through
taxes (Bhagwati and Rodriquez, 1975), then the emigration of skilled labor can
undermine economic development (Benhabib and Jovanovic, 2006). Possible corrections
include taxing the emigration of skilled labor (McHale, 2007) or having receiving
countries admit more unskilled workers from the developing world (Pritchett, 2006).
In high-income receiving countries, the complaint is that the wrong individuals
are arriving (Borjas, 1999a). In the US and Europe, the average immigrant has much less
schooling than the average native worker (Boeri, Hanson, and McCormick, 2002). If
immigrants have low income relative to natives, increased labor inflows may exacerbate
distortions created by social-insurance programs or means-tested entitlement programs
(Borjas and Hilton, 1996; Wellisch and Walz, 1998), fueling political opposition to
immigration (Hanson, Scheve, and Slaughter, 2007). Most rich receiving countries

3
tightly restrict immigrant admissions, in contrast to their pro-liberalization stances on
trade and investment (Hatton and Williamson, 2005).
To be sure, the claims made by both the emigration pessimists and the
immigration pessimists are controversial. On brain drain, recent literature counters
earlier arguments by suggesting that opportunities for emigration may increase the
incentive to acquire human capital by enough to create a brain gain (Stark, Helmenstein,
and Prskawetz, 1997; Stark and Wang, 2002). In receiving countries, especially the US,
some economists see the consequences of immigration for native workers as benign or
even positive (Card, 2005; Cortes, 2005; Ottaviano and Peri, 2006). Still, the literature
leaves one with the impression that the workers sending countries would most like to see
go are the ones receiving countries would least like to see come. No wonder there has
never been a Washington consensus on international migration. If economists cannot
agree on the benefits of open borders, surely policy makers will not either.
A further complication is that control over international migration is largely in the
hands of receiving countries. Labor flows between rich and poor nations tend to be
unidirectional, from the latter to the former. In 2005, just 12 higher income nations were
host to 51% of the global stock of international migrants (United Nations, 2006).2 The
US, alone, is home to 20% of the global migrant stock, but sends few migrants to
developing countries. Because high-income countries are able to set global migration
policy unilaterally, they have little incentive to address sending-country concerns.
The disconnect between sending and receiving-country perspectives on
international migration raises a host of important policy questions. Is emigration a viable
2 These 12 were the US, Russia, Germany, France, Canada, the UK, Spain, Australia, Hong, Kong, Israel, Italy, and Japan.

4
strategy for developing countries to raise living standards? Are there environments
where emigration may be particularly helpful or harmful? Is it possible to identify
policies on global migration that both low-income sending countries and high-income
receiving countries could embrace?
In this chapter, I selectively review academic literature on the causes and
consequences of emigration from developing countries. My aim is to identify facts about
international migration that are relevant to those concerned about why labor moves
between countries and how these movements affect sending-country economies.3
Empirical work on global labor flows is still in an early state. As is often the case, the
literature provides incomplete answers to some of the most urgent questions.
Nevertheless, recent work yields a number of robust results and is helpful for identifying
where future research should be directed.
In section 2, I begin by describing current trends in international migration.
Developing countries that are small, densely populated, and middle income tend to have
the highest emigration rates. In section 3, I move on to discuss the relationship between
skill and migration. In nearly all countries, the more skilled are those most likely to
emigrate. The positive selection of emigrants is consistent with international differences
in labor productivity – rather than international differences in inequality – being the
primary determinant of which types of workers leave. Emigrants sort themselves across
destination countries according to the reward to skill, in a manner consistent with income
3 While there are labor flows between low and middle-income countries, data constraints require me to focus on flows into high income countries. There appear to be sizable flows from the former Soviet Republics to Russia; Bangladesh to India; Egypt, India, Pakistan, and the Philippines to the Gulf States; Afghanistan to Iran; Iraq to Syria; other Southern African states to South Africa; Indonesia to Malaysia; Malaysia to Singapore; Guatemala to Mexico; and Nicaragua to Costa Rica (Ratha and Shaw, 2007).
5
maximization. In section 4, I discuss the contribution of migrant networks to lowering
migration costs, which for many countries appear to be substantial.
In section 5, I examine research on the impact of emigration on sending
countries.4 In the few cases that have been studied, labor outflows appear to help raise
sending-country wages, while having little impact on fiscal accounts. Though there has
been recent progress in the literature, the question of brain drain versus brain grain
remains unresolved. We still will do not know how opportunities for emigration affect
the stock of human capital in sending countries. Recently, migrant remittances have
grown rapidly, and their positive correlation with household consumption has lead some
to ascribe a causal role to remittances in development. A more reasoned view is that
remittances are simply a byproduct of intrahousehold specialization. There is some
evidence that labor outflows promote trade, technology diffusion, and political openness,
though the econometric identification of these impacts is not problem free.
By way of conclusion, in section 6, I summarize what appear to be the more
empirically robust findings (or nonfindings) in the literature.
4 Literature on impacts on receiving countries is much more developed. See Borjas (1999b, 2007).

6
2. The Dimensions of International Migration
International migration appears to be on the rise. Only recently have cross-
country data on emigrant stocks have become available. As a result, research on
international migration is still emerging. In this section, I discuss data sources on the
stock of international migrants and then move on to examine emigration rates in sending
countries, the distribution of migrants across receiving countries, the correlates of
bilateral migration flows, and the emigration of skilled labor.
2.1 Data and Recent Trends
There have been several recent attempts to measure international migration.
Carrington and Detragiache (1998) estimate emigration rates in 1990 for individuals with
tertiary education from 61 source countries to OECD destination countries. Adams
(2003) applies a similar methodology to estimate emigration rates for 24 large labor-
exporting countries in 2000. The OECD (2003) lists the foreign-born population 15 years
and older in 2000 by source country and education level (primary, secondary, tertiary,
unknown) for each OECD country. While these sources are welcome additions to the
literature, each has gaps in coverage regarding sending countries, migrant skill levels,
and/or time (Docquier and Marfouk, 2006; Hanson, 2007a).
In useful recent work, Docquier and Marfouk (2006) extend the OECD data by
constructing more complete estimates of the stocks of international migrants. They use
the population censuses for 30 OECD countries in 1990 and 2000 to obtain the count of
adult immigrants (25 years and older) by source country and level of education (primary,
secondary, or tertiary schooling). (Primary indicates 0-8 years of schooling, secondary
indicates 9-12 years of schooling, and tertiary indicates 13 or more years of schooling.)
7
They combine these counts with the size of adult populations and the fraction of adult
populations with different levels of schooling from Barro and Lee (2000) to obtain
emigration rates by education level and source country, yielding 174 source countries in
1990 and 192 in 2000. While the set of source countries is comprehensive, the coverage
of destination countries excludes those counties not in the OECD as of 2000.5
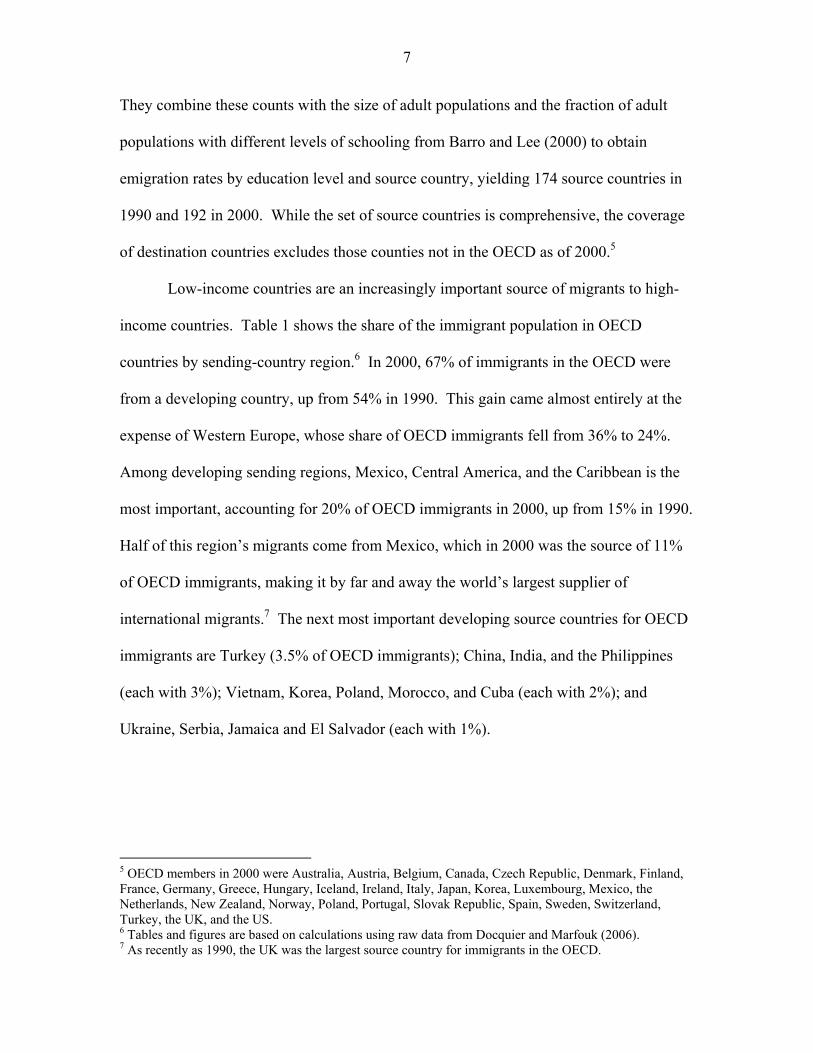
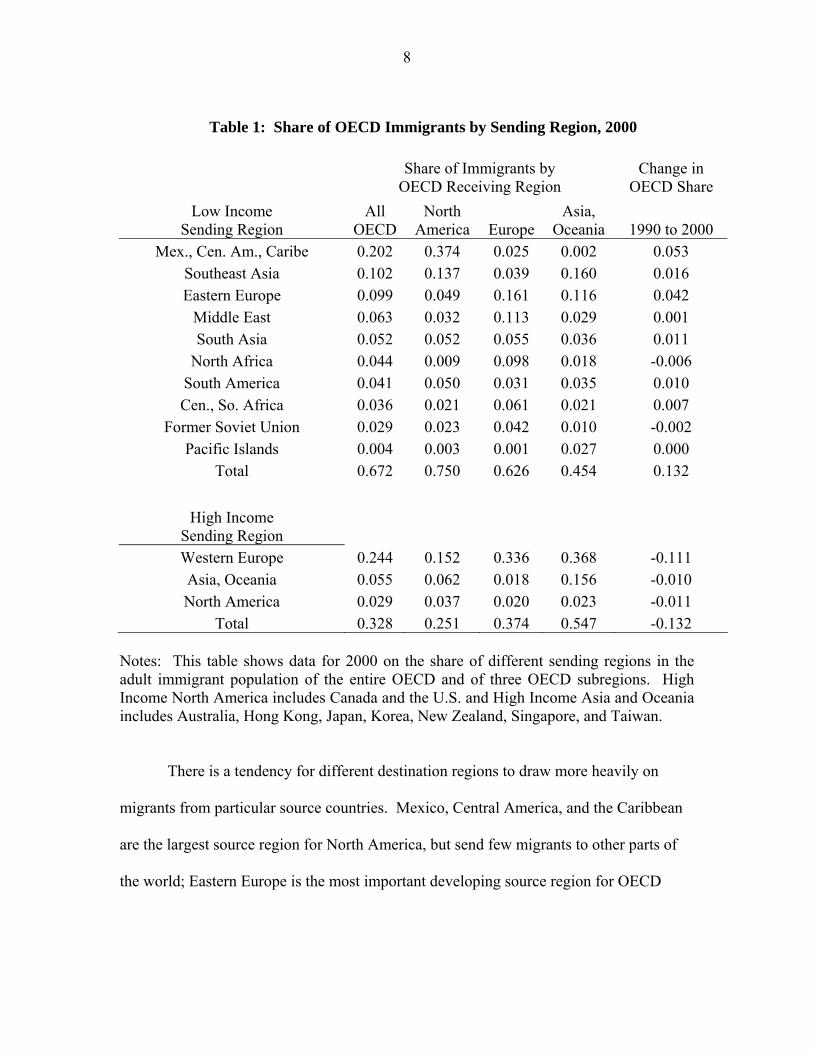
Low-income countries are an increasingly important source of migrants to high-
income countries. Table 1 shows the share of the immigrant population in OECD
countries by sending-country region.6 In 2000, 67% of immigrants in the OECD were
from a developing country, up from 54% in 1990. This gain came almost entirely at the
expense of Western Europe, whose share of OECD immigrants fell from 36% to 24%.
Among developing sending regions, Mexico, Central America, and the Caribbean is the
most important, accounting for 20% of OECD immigrants in 2000, up from 15% in 1990.
Half of this region’s migrants come from Mexico, which in 2000 was the source of 11%
of OECD immigrants, making it by far and away the world’s largest supplier of
international migrants.7 The next most important developing source countries for OECD
immigrants are Turkey (3.5% of OECD immigrants); China, India, and the Philippines
(each with 3%); Vietnam, Korea, Poland, Morocco, and Cuba (each with 2%); and
Ukraine, Serbia, Jamaica and El Salvador (each with 1%).
5 OECD members in 2000 were Australia, Austria, Belgium, Canada, Czech Republic, Denmark, Finland, France, Germany, Greece, Hungary, Iceland, Ireland, Italy, Japan, Korea, Luxembourg, Mexico, the Netherlands, New Zealand, Norway, Poland, Portugal, Slovak Republic, Spain, Sweden, Switzerland, Turkey, the UK, and the US. 6 Tables and figures are based on calculations using raw data from Docquier and Marfouk (2006). 7 As recently as 1990, the UK was the largest source country for immigrants in the OECD.
8
Table 1: Share of OECD Immigrants by Sending Region, 2000
Share of Immigrants by
OECD Receiving Region Change in
OECD Share Low Income
Sending Region All
OECD North
America Europe Asia,
Oceania 1990 to 2000 Mex., Cen. Am., Caribe 0.202 0.374 0.025 0.002 0.053
Southeast Asia 0.102 0.137 0.039 0.160 0.016 Eastern Europe 0.099 0.049 0.161 0.116 0.042
Middle East 0.063 0.032 0.113 0.029 0.001 South Asia 0.052 0.052 0.055 0.036 0.011
North Africa 0.044 0.009 0.098 0.018 -0.006 South America 0.041 0.050 0.031 0.035 0.010 Cen., So. Africa 0.036 0.021 0.061 0.021 0.007
Former Soviet Union 0.029 0.023 0.042 0.010 -0.002 Pacific Islands 0.004 0.003 0.001 0.027 0.000
Total 0.672 0.750 0.626 0.454 0.132
High Income Sending Region Western Europe 0.244 0.152 0.336 0.368 -0.111 Asia, Oceania 0.055 0.062 0.018 0.156 -0.010 North America 0.029 0.037 0.020 0.023 -0.011
Total 0.328 0.251 0.374 0.547 -0.132 Notes: This table shows data for 2000 on the share of different sending regions in the adult immigrant population of the entire OECD and of three OECD subregions. High Income North America includes Canada and the U.S. and High Income Asia and Oceania includes Australia, Hong Kong, Japan, Korea, New Zealand, Singapore, and Taiwan.
There is a tendency for different destination regions to draw more heavily on
migrants from particular source countries. Mexico, Central America, and the Caribbean
are the largest source region for North America, but send few migrants to other parts of
the world; Eastern Europe is the most important developing source region for OECD

9
Europe; and Southeast Asia is the most important developing source region for Australia
and Oceania. Unsurprisingly, geographic distance plays an important role in migration.
Table 2: Share of Foreign-Born Population in Total Population
Change 1995 2000 2002 2004 1995-2004 Australia 23.0 23.0 23.2 23.6 0.6 Austria 10.5 10.8 13.0 Belgium 9.7 10.3 11.1 Canada 16.6 17.4 17.7 18.0 1.4 Czech Republic 4.2 4.6 4.9 Denmark 4.8 5.8 6.2 6.3 1.6 Finland 2.0 2.6 2.8 3.2 1.2 France (a) 10.0 Germany (b) 11.5 12.5 12.8 12.9 1.4 Greece (c) 10.3 Hungary 2.8 2.9 3.0 3.2 0.4 Ireland (d) 6.9 8.7 10.0 11.0 4.0 Italy (c) 2.5 Luxembourg 30.9 33.2 32.9 33.1 2.2 Mexico 0.4 0.5 Netherlands 9.1 10.1 10.6 10.6 1.6 New Zealand (d) 16.2 17.2 18.4 18.8 2.6 Norway 5.5 6.8 7.3 7.8 2.3 Poland 1.6 Portugal 5.4 5.1 6.7 6.7 1.3 Slovak Republic (c) 2.5 3.9 Spain (c) 5.3 Sweden 10.5 11.3 11.8 12.2 1.7 Switzerland 21.4 21.9 22.8 23.5 2.2 Turkey 1.9 United Kingdom 6.9 7.9 8.6 9.3 2.3 United States 9.3 11.0 12.3 12.8 3.5 Notes: (a) 2000 value is from 1999; (b) 2004 value is from 2003; (c) 2000 value is from 2001; (d) 1995 value is from 1996. Source: International Migration Outlook, OECD, 2006.

10
The growing importance of lower-income countries in the supply of international
migrants has contributed to an overall increase in labor flows into rich countries. Table 2
shows the share of the population that is foreign born in select OECD members. The size
of the immigrant population varies across destinations, reflecting differences in both their
attractiveness and openness to international migrants. Aside from tiny Luxembourg, the
countries with the largest immigrant presence in 2004 are Australia (24%), Switzerland
(24%), New Zealand (19%), and Canada (18%). Next in line are the large economies of
Germany (13%), the US (13%), France (10%), and the UK (10%), with the US alone
hosting 40% of immigrants living in OECD countries. In the last decade, there have been
substantial increases in foreign-born population shares in a number of rich countries, with
the largest changes over 1995-2004 occurring in Ireland (4%), the US (3.5%), New
Zealand (2.6%), the U.K. (2.3%), Norway (2.3%), and Switzerland (2.2%).
There is strong evidence that a rising share of labor inflows in rich countries are
made up by illegal entrants, with data for the US being the most extensive. Passel (2006)
estimates that in 2005 illegal immigrants accounted for 35% of the US foreign-born
population, up from 28% in 2000 and 19% in 1996. Of the 2005 population of illegal
immigrants, 56% were from Mexico, implying that 60% of the population of Mexican
immigrants in the US was unauthorized (Hanson, 2006).
There is substantial variation across countries in the propensity to emigrate. As of
2000, there were 22 developing nations with 10% or more of their adult population
having migrated to the OECD, and 16 developing countries with emigration rates above
5%. At the other extreme, 52 developing countries had emigration rates below 1%.
Figure1 plots emigration rates for countries against their log population densities in 2000,

11
where the emigration rate is the fraction of a country’s adult population that has migrated
to an OECD country. There is a strong positive correlation between emigration rates and
population density, with more densely populated countries sending a higher fraction of
their population abroad. Countries with the highest emigration rates tend to be small,
poor countries that are relatively close to the US. Island economies in the Caribbean and
the South Pacific stand out for their high emigration rates.
Albania
AlgeriaAngola
ArgentinaArmenia
Australia
Austria
Azerbaijan
Bahamas, The
BahrainBangladesh
Barbados
BelarusBeninBhutan
Bolivia
Bosnia and Herzegovina
Botswana Brazil
Brunei
Bulgaria
Burkina Faso Burundi
Cambodia
Cameroon
Canada
Cape Verde
Central African RepublicChadChile
ChinaColombia Comoros
Congo, Dem. Rep.Congo, Rep. Costa Rica
Cote d'Ivoire
Croatia
Cuba
Cyprus
Czech RepublicDenmark
Djibouti
Dominican Republic
Ecuador
Egypt
El Salvador
Equatorial GuineaEritrea
Estonia
Ethiopia
Fiji
Finland
FranceGabonGambia, The
Georgia
GermanyGhana
GreeceGuatemala
GuineaGuinea-Bissau
Guyana
Haiti
Honduras
Hungary
Iceland
IndiaIndonesiaIran
Ireland
IsraelItaly
Jamaica
JapanJordan
KazakhstanKenya KoreaKuwait
Kyrgyzstan
Lao PDR
Latvia
Lebanon
Lesotho
LiberiaLibya
Lithuania
Macedonia
Madagascar MalawiMalaysiaMali
Malta
Mauritania
MauritiusMexico
MoldovaMongolia
Morocco
Mozambique MyanmarNamibia Nepal
Netherlands
New Zealand
Nicaragua
Niger Nigeria
Norway
Oman Pakistan
Panama
Papua New GuineaParaguayPeru
PhilippinesPoland
Portugal
Qatar
Romania
Russia RwandaSaudi ArabiaSenegal
Serbia
Sierra Leone Singapore
Slovenia
Solomon IslandsSomalia
South AfricaSpain Sri Lanka
Sudan
Suriname
SwazilandSweden Switzerland
Syrian Arab RepublicTajikistanTanzania ThailandTogo
Trinidad and Tobago
TunisiaTurkey
Turkmenistan
UK
US UgandaUkraineUnited Arab Emirates
UruguayUzbekistanVenezuela, RB
VietnamZambia Zimbabwe0
.1.2
.3.4
.5E
mig
ratio
n ra
te
-4 -2 0 2 4Log population density
Figure 1: Emigration Rates and Population Density, 2000
While emigration is rising over time, there is strong persistence in which
countries send more people abroad, as seen in Figure 2, which plots emigration rates in
1990 and against those in 2000. The countries with the largest increase in emigration
rates over 1990 to 2000 include neighbors of the US (the Caribbean, Central America,
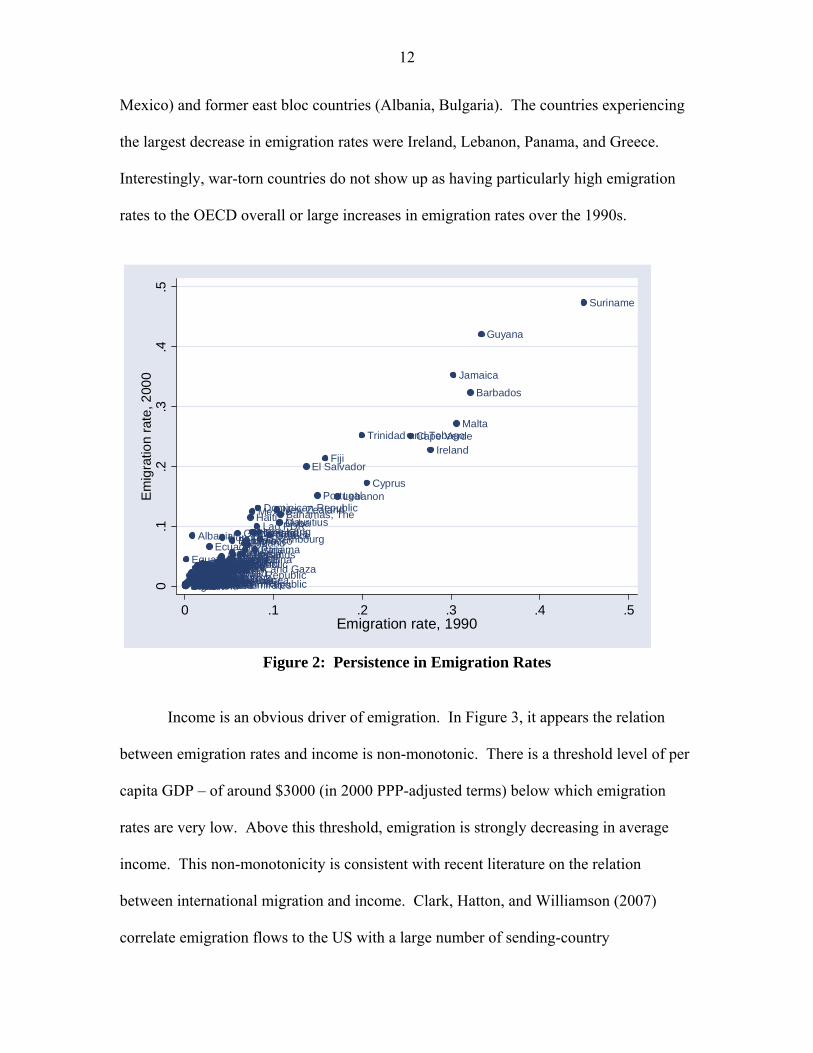
12
Mexico) and former east bloc countries (Albania, Bulgaria). The countries experiencing
the largest decrease in emigration rates were Ireland, Lebanon, Panama, and Greece.
Interestingly, war-torn countries do not show up as having particularly high emigration
rates to the OECD overall or large increases in emigration rates over the 1990s.
Afghanistan
Albania
AlgeriaAngola
ArgentinaAustralia
Austria
Bahamas, The
BahrainBangladesh
Barbados
Belgium
BeninBhutanBolivia
BotswanaBrazil
Brunei
Bulgaria
Burkina FasoBurundi
Cambodia
Cameroon
Canada
Cape Verde
Central African RepublicChadChile
ChinaColombiaComoros
Congo, Dem. Rep.Congo, Rep.Costa Rica
Cote d'Ivoire
Cuba
Cyprus
Czech RepublicDenmark
Djibouti
Dominican Republic
Ecuador
Egypt
El Salvador
Equatorial Guinea
Ethiopia
Fiji
Finland
FranceGabonGambia, TheGermanyGhana
GreeceGuatemala
GuineaGuinea-Bissau
Guyana
Haiti
HondurasHong Kong
Hungary
Iceland
IndiaIndonesiaIranIraq
Ireland
IsraelItaly
Jamaica
JapanJordan
KenyaKoreaKuwait
Lao PDR
Lebanon
Lesotho
LiberiaLibya
Luxembourg
Macao, China
MadagascarMalawiMalaysiaMali
Malta
Mauritania
MauritiusMexico
Mongolia
Morocco
MozambiqueMyanmarNamibiaNepal
Netherlands
New Zealand
Nicaragua
NigerNigeria
Norway
OmanPakistan
Panama
Papua New GuineaParaguayPeru
PhilippinesPoland
Portugal
Qatar
Romania
RussiaRwandaSaudi ArabiaSenegalSierra LeoneSingapore
Solomon IslandsSomalia
South AfricaSpainSri Lanka
Sudan
Suriname
SwazilandSwedenSwitzerlandSyrian Arab Republic
Taiwan
TanzaniaThailandTogo
Trinidad and Tobago
TunisiaTurkeyUK
USUgandaUnited Arab EmiratesUruguay
Venezuela, RBVietnamWest Bank and Gaza
ZambiaZimbabwe0.1
.2.3
.4.5
Em
igra
tion
rate
, 200
0
0 .1 .2 .3 .4 .5Emigration rate, 1990
Figure 2: Persistence in Emigration Rates
Income is an obvious driver of emigration. In Figure 3, it appears the relation
between emigration rates and income is non-monotonic. There is a threshold level of per
capita GDP – of around $3000 (in 2000 PPP-adjusted terms) below which emigration
rates are very low. Above this threshold, emigration is strongly decreasing in average
income. This non-monotonicity is consistent with recent literature on the relation
between international migration and income. Clark, Hatton, and Williamson (2007)
correlate emigration flows to the US with a large number of sending-country

13
characteristics in a panel of 81 countries over the period 1971-1998.8 They find an
inverted U in the relationship between sending-country average income and emigration.
Emigration rates are increasing in income at low income levels and decreasing in income
at higher income levels. They also find that migration flows to the US are higher for
countries that speak English, are geographically closer to the US, and have large existing
populations of U.S. immigrants. The elasticity of emigration flows with respect to
distance is -0.20 to -0.28, which would imply that in moving from El Salvador (3400 km.
from the US) to Brazil (7700 km. from the US) emigration to the US would fall by 20%.
Other research is consistent with this finding (Hanson, 2007a).
Albania
AlgeriaAngola
ArgentinaArmenia
Australia
Austria
Azerbaijan
Bahamas, The
BahrainBangladesh
Barbados
BelarusBelgium
BeninBolivia
Bosnia and Herzegovina
BotswanaBrazil
Bulgaria
Burkina FasoBurundi
Cambodia
Cameroon
Canada
Cape Verde
Central African RepublicChadChile
ChinaColombiaComoros
Congo, Dem. Rep.Congo, Rep. Costa Rica
Cote d'Ivoire
Croatia
Cyprus
Czech RepublicDenmark
Djibouti
Dominican Republic
Ecuador
Egypt
El Salvador
Equatorial GuineaEritrea
Estonia
Ethiopia
Fiji
Finland
FranceGabonGambia, The
Georgia
GermanyGhana
GreeceGuatemala
GuineaGuinea-Bissau
Guyana
Haiti
Honduras Hong Kong
Hungary
Iceland
IndiaIndonesiaIran
Ireland
IsraelItaly
Jamaica
JapanJordan
KazakhstanKenya KoreaKuwait
Kyrgyzstan
Lao PDR
Latvia
Lebanon
Lesotho
LithuaniaLuxembourg
Macao, China
Macedonia
MadagascarMalawiMalaysiaMali
Malta
Mauritania
MauritiusMexico
MoldovaMongolia
Morocco
Mozambique NamibiaNepal
Netherlands
New Zealand
Nicaragua
NigerNigeria
Norway
OmanPakistan
Panama
Papua New GuineaParaguayPeru
Philippines Poland
Portugal
Romania
RussiaRwanda Saudi ArabiaSenegalSierra Leone Singapore
Slovakia
Slovenia
Solomon Islands South AfricaSpainSri Lanka
Sudan SwazilandSwedenSwitzerland
Syrian Arab RepublicTajikistanTanzania ThailandTogo
Trinidad and Tobago
TunisiaTurkey
Turkmenistan
UK
USUganda Ukraine UruguayUzbekistan Venezuela, RB
VietnamZambia Zimbabwe0
.1.2
.3.4
.5E
mig
ratio
n ra
te
6 7 8 9 10 11Log per capita GDP (PPP)
Figure 3: Emigration Rates and Per Capita GDP, 2000
8 They calculate the emigration flow as the log ratio of US legal immigrants admitted to the source-country population, a measure which is problematic (see Hanson, 2007a).

14
In related work, Mayda (2005) examines bilateral migration between a large
number of source countries and 14 OECD destination countries over 1980-1995. She
regresses bilateral migration rates on income per capita in the source and destination
country and average income per capita in other OECD destinations, among other control
variables. Bilateral migration is increasing in destination-country income and decreasing
in the income of other destinations, consistent with the idea that better economic
conditions in third countries deflect migration away from a given destination.
2.2 Brain Drain
Much of the literature on international migration focuses on the movement of
skilled labor, whose departure may drain poor economies of scarce supplies of human
capital. Figure 3 shows the emigration rate for adults with a tertiary education against the
emigration rate for all adults. In 2000, there were 41 developing countries with
emigration rates for the tertiary educated above 20%.
Brain drain is a concern where there are distortions in the decision to acquire
human capital. Absent distortions, moving labor from a low-productivity to a high-
productivity economy unambiguously raises global income, though not necessarily global
welfare (Benhabib and Jovanovic, 2007). However, if there are positive externalities
associated with learning (e.g., Lucas, 1988), then the social product of human capital
exceeds its private product and the exodus of skilled labor from a country may have
adverse consequences for its economic development (Bhagwati and Hamada, 1974).
Another negative impact of brain drain is that many individuals have their education
subsidized by the state, meaning their emigration would deprive their origin country of
tax contributions to offset the cost of their schooling (McHale, 2007).

15
Afghanistan
AlbaniaAlgeria
Angola
Argentina
Armenia
Australia
Austria
Azerbaijan
Bahamas, The
BahrainBangladesh
Barbados
BelarusBelgium
Benin
BhutanBolivia
Bosnia and Herzegovina
BotswanaBrazil
Brunei
BulgariaBurkina Faso
Burundi
CambodiaCameroon
Canada
Cape Verde
Central African RepublicChad
ChileChina
Colombia
Comoros
Congo, Dem. Rep.
Congo, Rep.
Costa RicaCote d'Ivoire
CroatiaCuba
Cyprus
Czech RepublicDenmark
Djibouti
Dominican Republic
East TimorEcuador
Egypt
El Salvador
Equatorial Guinea
Eritrea
EstoniaEthiopia
Fiji
FinlandFrance
Gabon
Gambia, The
GeorgiaGermany
Ghana
Greece
Guatemala
Guinea
Guinea-Bissau
GuyanaHaiti
HondurasHong Kong
Hungary
Iceland
IndiaIndonesia
IranIraq
Ireland
IsraelItaly
Jamaica
Japan
Jordan
Kazakhstan
Kenya
KoreaKuwait
Kyrgyzstan
Lao PDR
Latvia
Lebanon
Lesotho
Liberia
Libya
LithuaniaLuxembourg
Macao, China
Macedonia
Madagascar
Malawi
MalaysiaMali
Malta
Mauritania
Mauritius
Mexico
MoldovaMongolia
Morocco
Mozambique
MyanmarNamibiaNepalNetherlands
New Zealand
Nicaragua
NigerNigeria
Norway
Oman
PakistanPanama
Papua New Guinea
ParaguayPeru
PhilippinesPolandPortugal
Qatar
Romania
Russia
Rwanda
Saudi Arabia
SenegalSerbia
Sierra Leone
SingaporeSlovakiaSlovenia
Solomon Islands
Somalia
South AfricaSpain
Sri Lanka
Sudan
Suriname
SwazilandSwedenSwitzerland
Syrian Arab Republic
Taiwan
Tajikistan
Tanzania
Thailand
Togo
Trinidad and Tobago
Tunisia
TurkeyTurkmenistan
UK
US
Uganda
UkraineUnited Arab Emirates
Uruguay
UzbekistanVenezuela, RB
Vietnam
West Bank and Gaza
ZambiaZimbabwe
0.1
.2.3
.4.5
.6.7
.8.9
1E
mig
ratio
n ra
te fo
r ter
tiary
edu
cate
d
0 .1 .2 .3 .4 .5 .6 .7 .8 .9 1Emigration rate for all adults
Figure 4: Emigration Rates for the More Educated, 2000
Recent literature explores the possibility that the opportunity for emigration may
actually increase the supply of human capital in a country, creating a brain gain (Stark
and Wang, 2002). With high incomes for skilled labor in rich countries and uncertainty
over who will succeed in emigrating, the option of moving abroad induces individuals to
accumulate enough additional human capital to compensate for the loss in skill to labor
outflows (Beine, Docquier and Marfouk, 2001).9 For this argument to go throw, the
probability of emigrating must be large enough to affect the expected return to investing
in skill. It must also be true that many people believe they have a non-trivial chance of
moving abroad. If, for most people, the expected probability of emigrating is small, the
brain-gain logic collapses. One environment where this might occur is countries in which
9 See Docquier and Rapoport (2007) for a survey of the theoretical literature on brain drain.

16
the distribution of wealth is highly unequal, such that few individuals can afford the up
front costs of either acquiring human capital (which may involve both direct costs for
schooling and indirect costs in terms of time out of the labor force) or moving abroad
(which may involve direct costs to acquire a visa and indirect time costs).
Only a handful of empirical papers examine the relationship between emigration
and human-capital accumulation. For a cross-section of countries, Beine, Docquier, and
Rapoport (2006b) report a positive correlation between emigration to rich countries
(measured by the fraction of the tertiary educated population living in OECD countries in
1990) and the increase in the stock of human capital (measured as the 1990 to 2000
change in the fraction of adults who have tertiary education). While this finding is
consistent with emigration increasing the incentive to acquire education, the cross-section
correlation between emigration and schooling is not well suited for causal inference about
the impact of brain drain on educational attainment. Education and migration decisions
are likely to be jointly determined, making each endogenous to the other. Valid
instruments for migration are very difficult to find. For causal analysis, one would need
to observe changes in human-capital accumulation in sending countries before and after
they experienced unexpected and exogenous shocks in the opportunity to emigrate. Such
experiments have yet to be found in the data. Despite four decades of research, we still
do not know how the opportunity to emigrate affects the supply of human capital in
sending countries, leaving the debate about brain drain unresolved.

17
Afghanistan
AlbaniaAlgeria
Angola
ArgentinaAustralia
Austria
Bahamas, The
BahrainBangladesh
Barbados
Belgium
Benin
BhutanBoliviaBotswanaBrazil
Brunei
BulgariaBurkina Faso
Burundi
CambodiaCameroon
Canada
Cape Verde
Central African RepublicChad
ChileChina
Colombia
Comoros
Congo, Dem. Rep.
Congo, Rep.
Costa RicaCote d'Ivoire
CubaCyprus
Czech RepublicDenmarkDjibouti
Dominican Republic
EcuadorEgypt
El Salvador
Equatorial GuineaEthiopia
Fiji
FinlandFrance
Gabon
Gambia, The
Germany
Ghana
Greece
Guatemala
Guinea
Guinea-Bissau
GuyanaHaiti
HondurasHong Kong
Hungary
Iceland
IndiaIndonesia
IranIraq
Ireland
IsraelItaly
Jamaica
Japan
Jordan
Kenya
KoreaKuwait
Lao PDR Lebanon
Lesotho
Liberia
LibyaLuxembourg
Macao, China
Madagascar
Malawi
MalaysiaMali
Malta
Mauritania
Mauritius
Mexico
Mongolia
Morocco
Mozambique
MyanmarNamibiaNepalNetherlands
New Zealand
Nicaragua
NigerNigeriaNorway
Oman
PakistanPanama
Papua New Guinea
ParaguayPeru
PhilippinesPolandPortugal
Qatar
Romania
Russia
Rwanda
Saudi Arabia
Senegal
Sierra Leone
Singapore
Solomon Islands
Somalia
South AfricaSpain
Sri Lanka
Sudan
Suriname
SwazilandSweden
SwitzerlandSyrian Arab Republic
TaiwanTanzania
Thailand
Togo
Trinidad and Tobago
Tunisia
Turkey
UK
US
Uganda
United Arab Emirates
UruguayVenezuela, RB
Vietnam
West Bank and Gaza
ZambiaZimbabwe
0.1
.2.3
.4.5
.6.7
.8.9
1E
mig
ratio
n ra
te fo
r hig
h ed
ucat
ed, 2
000
0 .1 .2 .3 .4 .5 .6 .7 .8 .9 1Emigration rate for high educated, 1990
Figure 5: Persistence in the Emigration of the Highly Educated
Finally, it is worth considering how emigration rates for the highly educated have
changed in recent decades. Figure 5 plots emigration rates for the tertiary educated
across countries in 1990 and 2000. The countries with the largest increase in emigration
rates for the highly educated are primarily countries that have experienced civil conflict,
such as Afghanistan, Angola, Congo, Haiti, Mozambique, Rwanda, Sierra Leone, and
Somalia. Thus, while civil conflict does not provoke a general flight to OECD countries
(see Figure 2), it does appear to provoke the flight of the more skilled. It has long been
recognized that the induced emigration of skilled labor may be an important cost of civil
war. Figure 5 is consistent with this perception, though careful research quantifying
these costs is difficult to find in the literature.
18
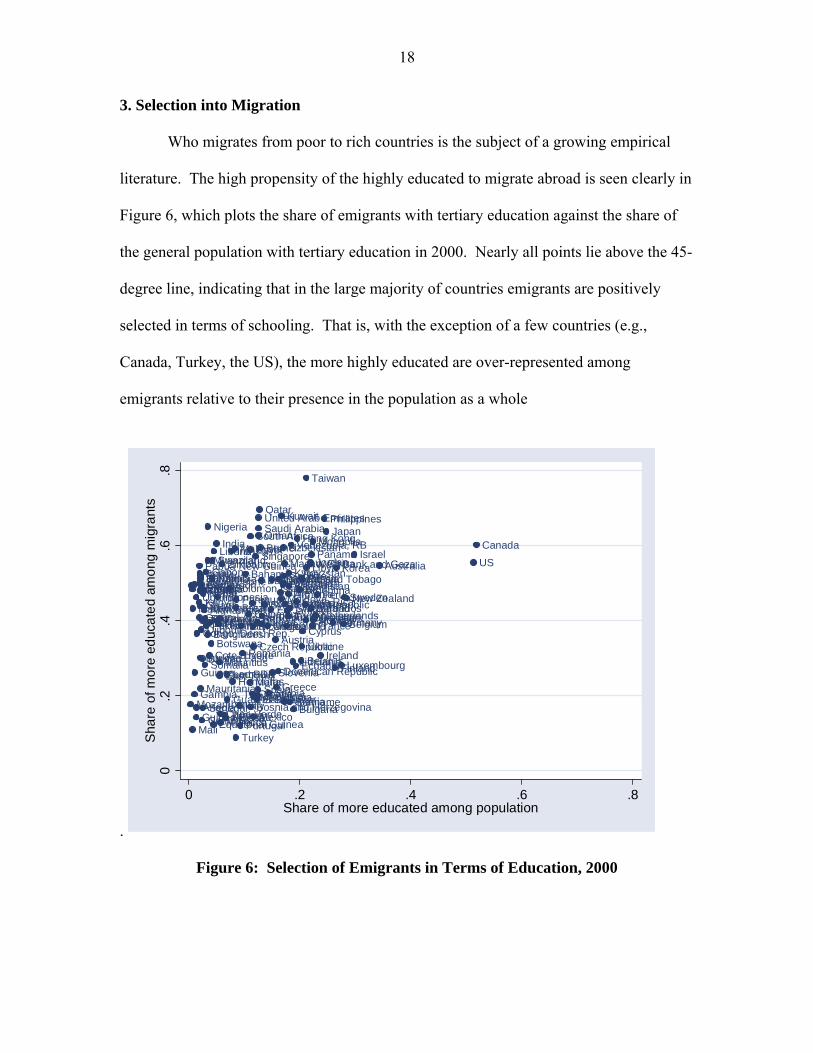
3. Selection into Migration
Who migrates from poor to rich countries is the subject of a growing empirical
literature. The high propensity of the highly educated to migrate abroad is seen clearly in
Figure 6, which plots the share of emigrants with tertiary education against the share of
the general population with tertiary education in 2000. Nearly all points lie above the 45-
degree line, indicating that in the large majority of countries emigrants are positively
selected in terms of schooling. That is, with the exception of a few countries (e.g.,
Canada, Turkey, the US), the more highly educated are over-represented among
emigrants relative to their presence in the population as a whole
.
Afghanistan
AlbaniaAlgeria
Angola
ArgentinaArmenia
Australia
Austria
AzerbaijanBahamas, TheBahrain
Bangladesh
Barbados
Belarus
Belgium
Benin
Bhutan
Bolivia
Bosnia and Herzegovina
Botswana
Brazil
Brunei
Bulgaria
Burkina Faso
Burundi
Cambodia
Cameroon
Canada
Cape Verde
Central African Republic
Chad ChileChina
Colombia
Comoros
Congo, Dem. Rep.Congo, Rep.
Costa Rica
Cote d'Ivoire
Croatia
Cuba CyprusCzech Republic
DenmarkDjibouti
Dominican RepublicEast TimorEcuador
Egypt
El Salvador
Equatorial Guinea
Eritrea Estonia
Ethiopia
Fiji
Finland
France
Gabon
Gambia, The
Georgia
GermanyGhana
GreeceGuatemala
Guinea
Guinea-Bissau
Guyana
Haiti
Honduras
Hong Kong
HungaryIceland
India
Indonesia
Iran
Iraq
Ireland
Israel
Italy
Jamaica
Japan
Jordan
KazakhstanKenya
Korea
Kuwait
Kyrgyzstan
Lao PDR
Latvia
Lebanon
Lesotho
LiberiaLibya
Lithuania Luxembourg
Macao, China
Macedonia
MadagascarMalawi
Malaysia
Mali
MaltaMauritania
Mauritius
Mexico
Moldova
Mongolia
Morocco
Mozambique
Myanmar
NamibiaNepal
NetherlandsNew Zealand
Nicaragua
Niger
Nigeria
Norway
Oman
Pakistan
PanamaPapua New Guinea
Paraguay Peru
Philippines
Poland
Portugal
Qatar
Romania
RussiaRwanda
Saudi Arabia
SenegalSerbia
Sierra Leone
Singapore
Slovakia
Slovenia
Solomon Islands
Somalia
South Africa
Spain
Sri Lanka
Sudan
Suriname
Swaziland
SwedenSwitzerlandSyrian Arab Republic
Taiwan
TajikistanTanzania
Thailand
Togo
Trinidad and Tobago
Tunisia
Turkey
Turkmenistan
UK
US
Uganda
Ukraine
United Arab Emirates
Uruguay
UzbekistanVenezuela, RB
Vietnam
West Bank and Gaza
Zambia
Zimbabwe
0.2
.4.6
.8S
hare
of m
ore
educ
ated
am
ong
mig
rant
s
0 .2 .4 .6 .8Share of more educated among population
Figure 6: Selection of Emigrants in Terms of Education, 2000

19
Interestingly, positive selection of emigrants is at odds with much recent
empirical literature on international migration. In an influential line of work, Borjas
(1987, 1991) uses the Roy (1951) model to show how migration costs and international
variation in the premium for skill affect the incentive to migrate. In countries with low
average wages and high wage inequality, as appears to be the case in much of the
developing world, there is negative selection of emigrants. Those with the greatest
incentive to relocate to rich countries (which tend to have high average wages and low
wage inequality) are individuals with below-average skill levels in their home countries.
Much of the recent empirical research on Borjas’ negative-selection hypothesis
examines labor movements either from Mexico to the US or Puerto Rico to the US
mainland. Puerto Rican outmigrants tend to have low education levels relative to non-
migrants (Ramos, 1992; Borjas, 2006), consistent with migrants being negatively selected
in terms of skill. Mexican emigrants, however, appear to be drawn more from the middle
of the country’s schooling distribution, consistent instead with intermediate selection.
Feliciano (2001), Chiquiar and Hanson (2005), Orrenius and Zavodny (2005), McKenzie
and Rapoport (2006), and Cuecuecha (2005), and find that emigrants from Mexico are
drawn from the middle of the wage or schooling distribution, while Ibarraran and
Lubotsky (2005) and Fernandez-Huertas (2006) find that Mexican emigrants are drawn
from the lower middle of the wage or schooling distribution.
Based on Figure 6, Mexico and Puerto Rico (and Turkey) would appear to be
exceptional cases. Positive selection of emigrants is a nearly universal phenomenon.
Despite strong evidence that emigrants are positively selected in terms of schooling, there
is confusion in the literature over the relationship between income inequality and the
20
incentive to emigrate. An empirical approach made popular by Borjas (1987) is to
explain bilateral migration using sending-country per capita GDP and income inequality
(e.g., as measured by the GINI coefficient) relative to the receiving country (e.g., Clark et
al., 2007; Mayda, 2005). A positive parameter estimate on the GINI coefficient is seen as
an indicator that migrants are negatively selected in terms of skill. However, this
approach characterizes selection into migration only under restrictive conditions.
To characterize the relationship between income inequality and migration, it is
useful to develop a simple model of the migration decision. Let the wage for individual i
from sending country s in receiving country r be
(1) ( )isr r r iW exp z= µ + δ ,
where µr is the return to raw labor in r, rδ is the return to an additional year of schooling
level in r, and zi is an individual i’s years of schooling. Let the cost of migrating from
country s to country r be given by,
(2) isr sr isrC f= + ε ,
where fsr is a fixed monetary cost common to all individuals that migrate from s to r and
εisr is an idiosyncratic migration cost term that has mean zero and an extreme value
distribution. Finally, let the utility associated with migrating from country s to country r
be a linear function of wages and migration costs, such that
(3) isr isr isrU W C= − .
where utility from not migrating equals the sending-country wage. If individuals make
the migration decision in order to maximize utility, then, given the error is extreme value,

21
the model is a logit. Consider the log odds of an individual with a college education
migrating from s to r, which, given the logit structure, can be written as,
(4) ( )c
c csrr s src
s
Eln W W fE
= − − ,
where csrE is the share of the college educated in s that migrate to r, c
sE is the share of
college educated that remain in s, and chW is the wage to college educated labor in
country for h=r,s. Equation (6) expresses the logic of the Roy model, in which income
maximization is the motivation for migration. More individuals will move from country
s to country r the larger is the wage differential between the two countries and the smaller
are fixed migration costs. Grogger and Hanson (2007) show that this setup can be
generalized to allow for migration costs specific to skill and correlation in idiosyncratic
migration costs across receiving countries.
To use this model to evaluate migrant selection in terms of skill, I follow Grogger
and Hanson (2007) and compare the log odds of emigrating for those with a college
education (c) relative to those with a primary education (p), which from (4) is given by,
(7) ( ) ( )c p
pc c psr srr s shc p
s s
E Eln ln W W W WE E
− = − − − ,
where fixed migration costs are differenced out of the expression. If the net gain to
emigrating for the college educated exceeds that for the primary educated, the expression
in (7) would be positive and emigrants from h would be positively selected in terms of
education. Using (1), this would require that
(8) s c
r s
r c
z
ze 1ee 1
δµ −µ
δ
−>
−,
22
where zc indicates years of schooling for a college educated worker and the return to
primary educated labor is normalized to equal µ. Under the convenient approximation
that exp(x)-1=x for small x, we can rewrite equation (8) as,
(9) p
srps r
WW
δ>δ
.10
On the left of (9) is the ratio of wages paid to raw labor (proxied here by the wage for
primary educated labor) in the receiving relative to sending country, which can be
thought of as the ratio of raw labor productivity in the two countries; on the right of (9) is
the ratio of the Mincerian return to schooling (the log wage gain from an additional year
of schooling) in the sending relative to the receiving country.
Equation (9) says that emigrants from sending country s will be positively
selected in terms of schooling as long as the gain in the productivity of raw labor from
moving abroad more than compensates educated workers for the loss in the return to
schooling.11 One can think of the ratio of the return to schooling on the right of (9) as
capturing wage inequality, since, all else equal, higher returns to schooling in country s
will imply greater wage inequality. Apparent in (9) is that higher wage inequality in a
country by no means guarantees more negative selection of emigrants. Other factors
come into play, namely labor productivity. Differences in labor productivity matter for
selection because more skilled workers have more productivity equivalent units of labor
to supply than unskilled workers. All else equal, higher labor productivity increases the
incentive to emigrate more for the more skilled. One way to explain positive selection of
10 See Grogger and Hanson (2007) for more details on this derivation. 11 A similar implication is present in Rosenzweig (2007), who derives a Roy model of migration with moving costs that include components that are fixed in monetary units and time-equivalent units.

23
emigrants in Figure 6 is that international differences in labor productivity are large
relative to international differences in the Mincerian return to schooling.
To interpret the condition in (9), note that when comparing poor sending countries
to rich receiving countries, it is usually the case that the raw wage is higher in the
receiver while the return to schooling is higher in the sender. Suppose that in Nigeria
someone with a primary education would earn $1,000 a year and someone with a college
education would earn $5,000 a year, while the comparable sums in the US are $20,000
and $40,000. Clearly, the implied return to schooling in Nigeria (log return to schooling
of 0.16) is higher than in the US (log return to schooling of 0.07). Yet, the higher
productivity of raw labor in the US (US/Nigerian raw wage ratio is 20) more than
compensates, making the net gain from emigrating from Nigeria greater for more
educated workers. Thus, when there are large differences in raw labor productivity
between countries, emigrants will tend to be positively selected in terms of skill.
Negative selection of workers by skill will obtain either where differences in labor
productivity across countries are small or migration costs are increasing in skill. The
latter feature is adopted by Borjas (1987), who assumes that migration costs are fixed in
units of time (such that more skilled workers pay more to migrate). As a result, in his
model (at least in its most simplified form—see Borjas (1991) for more elaborate models
with negative and positive selection) the pattern of migrant selection is determined
entirely by the relative return to skill across countries. However, once one introduces
large productivity differences between countries or migration costs that are fixed in
monetary units, the pattern of selection is indeterminant. Selection may be positive or
negative, depending on relative labor productivity, relative returns to skill, and skill-

24
specific migration costs. Even in the simple model of migration I develop here,
migration selection in terms of skill is not robust. While this may seem obvious once one
inspects the theory, it is perhaps a result that is underappreciated in the literature.
Credit constraints in sending countries could make migration costs decreasing in
skill, which would strengthen pressure for positive selection. Suppose, for instance, that
education and migration are subject to a fixed monetary cost and credit-market
imperfections make wealthier individuals subject to lower borrowing costs (e.g., Banerjee
and Newman, 1993; Rapoport, 2002). Then, the wealthier will be more likely to become
educated and more likely to migrate abroad (Assuncao and Carvalho, 2007). For Mexico,
McKenzie and Rapoport (2007) find an inverted U-shaped relationship between
migration and wealth, consistent with low-wealth individuals being too poor to afford
migration and high-wealth individuals having an incentive not to leave.
Rosenzweig (2007) examines migrant selectivity with data from the New
Immigrant Survey. The NIS reports the wage an individual earned in his last job before
coming to the US, which Rosenzweig uses to estimate the marginal product of labor by
source country. A country’s overall emigration rate to the US is decreasing in the
marginal product of labor, suggesting countries with higher labor productivity send fewer
migrants to the US. Rosenzweig estimates that raising a country’s marginal product of
labor by 10% relative to the US would reduce the number of emigrants obtaining US
employment-based visas by 8%. The average schooling of emigrants to the US is
increasing in the marginal product of labor, indicating that in countries with higher labor
productivity it is the more educated migrants who are most likely to leave.12
12 In related work, Rosenzweig (2006) finds that the numbers of students who come to the US for higher education and who stay in the US after completing their education are each decreasing in the marginal
25
Any analysis of migrant selection based on observed characteristics leaves open
the question of how migrants are selected on unobservables. McKenzie, Gibson,
Stillman (2006) examine this issue using data on Tonga, in which individuals may apply
to a lottery to obtain a visa to move to New Zealand. Comparing visa applicants who lost
the lottery (meaning they stayed in Tonga) with non-applicants, they find that those
desiring to migrate have higher earnings, controlling for observed characteristics,
suggesting prospective migrants from Tonga are positively selected in terms of
unobserved skill. McKenzie, Gibson, Stillman find that failing to account for selection
on unobservables leads to substantial overstatement of the gains to migration.
What does the simple model of income maximization in (7) imply about how
emigrants sort themselves across destination countries? Rewrite the expression as,
(10) ( )c p
c psr srr r s src p
s s
E Eln ln W WE E
− = − +α +η
where αs is a country fixed effect that absorbs sending country wages and srη is a
disturbance term capturing measurement error in migration flows. Equation (10) is a
regression specification which predicts that more skilled workers will flow in greater
numbers to receiving countries that have larger rewards to skill, expressed here by the
level difference in wages between high and low educated labor. Grogger and Hanson
(2007) develop a fixed-effects specification similar to (10) and, using data from Beine,
Docquier and Rapoport (2006a), find that the bilateral flow of more-educated migrants
(relative to less-educated migrants) is increasing in the destination-country earnings gap
between high-income and low-income workers.
product of labor in the source country, suggesting that low rewards to skill in a country induce students seeking university training to pursue their schooling abroad.

26
Their results can account for the observed pattern of emigrant sorting across
destinations, seen in Table 3. The US is by far and away the largest destination country
for international migrants, with Canada being the second largest. In 2000, 53% of the
foreign-born population in OECD countries resided in North America, while 36% resided
in the European Union and 10% resided in Asia and Oceania. The draw of the US and
Canada is strongest for the more educated. While North American attracts only 38% of
emigrants with primary education it attracts 66% of emigrants with tertiary education. In
Europe, the shares are flipped, as it attracts 22% of emigrants with tertiary schooling and
53% of emigrants with primary schooling.
Table 3: Share of OECD Immigrants by Receiving Region and Education, 2000
Education Group Destination Region All Primary Secondary Tertiary North America 0.514 0.352 0.540 0.655 Europe 0.384 0.560 0.349 0.236 Australia & Oceania 0.102 0.088 0.111 0.109 All OECD 0.355 0.292 0.353
Notes: This table shows the share of OECD immigrants by receiving region and education group in 2000. Source: Grogger and Hanson (2007).
The pattern of emigrant sorting in Table 3 is consistent with observed differences
in the reward to skill. Among OECD destinations, the level difference in income
between high-skill and low-skill labor is largest in the US, with Canada having the

27
fourth-largest difference (and the UK and Australia coming in at numbers two and three).
Continental Europe, on the other hand, has a relatively low income gap between high and
low-skill labor, consistent with relatively low income inequality. The consequence of
these income differences appears to be that North America and Australia attract a more-
skilled mix of immigrants, while Continental Europe attracts a less-skilled mix.

28
4. Networks and Migration Costs
Although the evidence in Table 2 points to growth in international migration, the
global stock of emigrants remains small, at around 3% of the world population. This is
surprising, given that the gains to international migration appear to be huge. Hanson
(2006) reports that in 2000 the average hourly wage for a male with nine years of
education was $2.40 in Mexico and $8.70 for recent Mexican immigrants in the US (in
PPP-adjusted prices). At the average labor supply for US adult male workers of 35 hours
per week, this would amount to an annual income gain of $12,000.
One way to reconcile large and persistent cross-country income differences with
small global labor movements is that receiving countries are successful in restricting
labor inflows. While long queues for immigration visas in receiving countries indicate
legal admission restrictions bind, rising levels of illegal immigration suggest that borders
are porous. Further, observed costs of illegal entry are small in comparison to estimated
income gains. In a sample of high migration-communities in Mexico during 2002 to 2004,
Cornelius (2005) finds the average price paid by migrants to be smuggled across the US
border was $1700, or one-seventh the apparent income gain.
Another explanation for small global labor flows is the existence of large
unobserved migration costs associated with credit constraints in financing migration,
uncertainty over economic opportunities abroad, the psychic cost of leaving home, or
other factors. There is considerable academic interest in the role of migration networks
in lowering such costs. Survey evidence suggests transnational migration networks
provide prospective migrants with information about economic conditions in destination
countries, support in managing the immigration process, and help in obtaining housing

29
and finding a job (Massey et al., 1994; Massey and Espinosa, 1997). Much of the
research on migration networks focuses on Mexico. On the process of crossing the
border, Orrenius and Zavodny (2005) report that among young males in Mexico the
probability of migrating to the US is higher for individuals whose fathers or siblings have
emigrated. Gathmann (2004) documents that migrants with family members in the US are
less likely to hire the services of a professional smuggler, and, among those that do, likely to
pay lower prices. And McKenzie and Rapoport (2005) find that average schooling is lower
among migrants from communities in Mexico with a stronger US presence. These results
are each consistent with networks lowering migration costs.
One might be concerned that the presence of migration networks reflects unobserved
characteristics of communities or families that are associated with a higher propensity to
migrate, making the correlation between migration behavior and networks difficult to
interpret. To address the issue of endogeneity in migration networks, Munshi (2003)
instruments for the size of the US population from a migrant’s origin community in Mexico
using lagged rainfall in the Mexican origin community. He finds that Mexican migrants in
the US are more likely to be employed and more likely to be employed in a higher-paying
nonagricultural job the larger is the US population of residents from their origin
community in Mexico. These results suggest that having a larger network improves a
migrant’s ability to assimilate economically in the US.
While we still know little about the magnitude of migration costs, research on
networks suggests that migrant flows are sensitive to changes in these costs. Other evidence
on the sensitivity of migration to migration costs comes from illegal crossings at the
Mexico-US border. For illegal migration, the intensity of border enforcement is an
30
important determinant of entry costs, which take the form of fees paid to smugglers.
Cornelius (2005) reports that smuggler prices to enter the U.S. illegally increased by 37%
between 1996-1998 and 2002-2004, which spans the period during which the United States
stepped up border enforcement efforts in response to the terrorist attacks of 9/11.
Gathmann (2004) examines the consequences of expanded border enforcement
for migration. She identifies the correlates of smuggler prices paid by migrants from
Mexico to the US and estimates the impact of smuggler prices on migrant demand for
smuggler services. The price a migrant pays to a smuggler is higher in years when border
enforcement is higher, but the elasticity of smuggler prices with respect to enforcement is
small, in the range of 0.2 to 0.5. During the sample period, a one-standard-deviation
increase in enforcement would have lead to an increase in smuggler prices of less than
$40. The demand for smuggler services and the probability of choosing to migrate to the
US are both responsive to changes in coyote prices. However, given the small
enforcement elasticity of coyote prices, the increase in US border enforcement over 1986
to 1998 (during which real spending on border enforcement increased by four times)
would have reduced the average migration probability in Mexico by only 10%.
In many destination countries, migrants reinforce networks by forming home-
town associations that help members of their home communities make the transition to
living in a new location. By creating links between the destination country and a specific
community in the source country, these associations may lower migration costs for
individuals linked by kinship or birthplace to migrants living abroad. Of 218 home-town
associations formed by Mexican immigrants enumerated in a 2002 survey in California,
87% were associated with one of the nine central and western states in Mexico that have

31
dominated migration to the US since the early 20th century (Cano, 2004), indicating that
migrant networks in Mexico are organized along regional lines.
Regional variation in migration networks creates regional variation in migration
dynamics. McKenzie and Rapoport (2007) show that in Mexican communities with
historically weak migration networks moderately more wealthy individuals are more
likely to migrate, though very high wealth individuals are not. Migrants are thus drawn
from the middle of the wealth distribution, meaning that migration increases inequality.
In communities with strong migration networks, however, lower wealth individuals can
afford to migrate, such that in these locations migration lowers inequality.

32
5. Impact of Emigration on Sending Countries
Emigration changes a country’s supply of labor, skill mix, and exposure to the
global economy. These effects may have important consequences for a sending country’s
aggregate output, structure of wages, fiscal accounts, and trade and investment flows,
among other outcomes. In this section, I discuss recent empirical research on the impact
of emigration on developing economies.
5.1 Labor Markets and Fiscal Accounts
Most research on the labor-market impacts of emigration focuses on Mexico.
Mishra (2007), applying the regression framework in Borjas (2003), examines the
correlation between emigration to the US and decadal changes in wages for cohorts in
Mexico defined by their years of schooling and labor-market experience. She estimates
that over the period 1970-2000 the elasticity of wages with respect to emigration in
Mexico is 0.4, implying a 10 percent reduction in labor supply due to emigration would
raise wages by 4 percent. Using a similar approach, Aydemir and Borjas (2007) estimate
a wage elasticity for emigration in Mexico of 0.6. Wage elasticities of this magnitude
suggest emigration has had a substantial impact on Mexico’s wage structure. Based on
her estimation results and that fact that between 1970 and 2000 13% of Mexico’s labor
force emigrated to the US, Mishra (2007) calculates that emigration has raised average
wages in the country by 8%. Upward wage pressure has been strongest for young adults
with above-average education levels (those with 9 to 15 years of schooling), who in the
1990s were those most likely to emigrate (Chiquiar and Hanson, 2005).
In response to changes in labor supply associated with emigration, one might
expect the supply of capital in Mexico to adjust, with the country becoming less attractive

33
to inward foreign direct investment. Alternatively, higher wages could erode Mexico’s
comparative advantage in labor-intensive industries, reducing the net exports of labor
services embodied in goods. Either change would tend to offset the effects of emigration
on wages in the country. Since the estimation approaches in Mishra (2007) and Aydemir
and Borjas (2007) are reduced form, they capture the wage impact of emigration, net of
these and other adjustments. Their results suggest that any response of capital
accumulation or trade to emigration is too slow or too small to undo the wage
consequences of labor outflows, at least over ten-year time intervals. Such a finding is
not all that surprising. Factor-price differences between the United States and Mexico
create an incentive for trade in goods, north-to-south flows of capital, and south-to-north
flows of labor. Despite dramatic reductions in barriers to trade and investment between
the two countries during the last two decades, US-Mexico wage differences remain large.
Since trade and investment are insufficient to equalize factor prices within North
America, theory would predict that migration from Mexico to the US would affect wages
in both countries, consistent with the evidence.
In many sending countries, the propensity to emigrate varies greatly across sub-
national regions. In Mexico, central and western states have long had the highest labor
flows abroad. The literature attributes regional variation in emigration to the emergence
of migration networks, which grew out of the hiring practices of US agriculture. In the
early 1900’s US labor contractors utilized Mexico’s railroad network to recruit workers
in the country’s interior (Cardoso, 1980). Communities close to rail lines have had the
34
highest emigration rates in the country since at least the 1920s.13 With the advent of
large-scale emigration from Mexico in the 1980s and 1990s, the historically high-
migration states have had relatively large labor outflows. Between 1990 and 2000, the
cohort of men in their twenties born in high-migration states declined by 33 log points,
while the number of similarly aged men born in low-migration states dropped by only 9
log points. Since mortality rates are relatively low for this age group, the relative decline
in the number of young men from high-migration states (of 24 log points) is most likely
due to emigration. Hanson (2007) finds that over this time period, wages in high-
migration states rose by 6-9% relative to wages in low-migration states, controlling for
regional shocks associated with globalization.
The Mexican emigration experience differs from other countries in terms of the
absence of positive selection, the high fraction of those leaving who enter the destination
country as illegal migrants, and the sheer scale of the exodus. The positive selection of
emigrants in most source countries raises the prospect of important fiscal impacts from
international migration. In countries with progressive income taxes, the loss of skilled
emigrants could adversely affect public budgets through a loss of future tax contributions.
These lost contributions are in part the returns to public investments in the education of
emigrating workers, which, after emigration, accrue to destination countries.
While there is a large body of theoretical literature on the taxation of skilled
emigration (e.g., Bhagwati and Hamada, 1974; Bhagwati and Wilson, 1989; Docquier
and Rapoport, 2007), empirical research on the subject is sparse. One recent contribution
is Desai, Kapur, and McHale (2003), who examine the fiscal effects of brain drain from
13 From the 1920s to the 1960s, the nine west-central states accounted for 44% to 56% of Mexican migration to the United States, but only 27% to 32% of Mexico’s total population (Durand, Massey, and Zenteno, 2001).
35
India. In 2000, individuals with tertiary education made up 61% of Indian emigrants but
just 5% of India’s total population. Between 1990 and 2000, the emigration rate for the
tertiary educated rose from 2.8% to 4.3%, compared to an increase of just 0.3% to 0.4%
for the population as a whole. Desai et al. examine Indian emigration to the US, which in
2000 was host to 65% of India’s skilled emigrants (and 49% of all Indian emigrants).
They begin by producing a counterfactual income series that gives emigrants the income
they would have earned in India based on their observed characteristics and the returns to
these characteristics in India (using a Mincer wage regression). On the tax side, they
calculate income tax losses by running the counterfactual income series through the
Indian income tax schedule and indirect tax losses using estimates of indirect tax
payments per unit of gross national income. On the spending side, they calculate
expenditure savings by identifying categories for which savings would exist – which are
most categories except interest payments and national defense – and then estimating
savings per individual. The results suggest Indian emigration to the US cost India net tax
contributions of 0.24% of GDP in 2000, which are partially offset by the tax take on
remittances of 0.1% of GDP. For India, is appears that the tax consequences of skilled
emigration are modest. For small countries with very high emigration rates (Figure 5),
the tax consequences would obviously be larger.
The research discussed so far address the static consequences of emigration for an
economy, ignoring dynamic considerations that may arise if skilled emigration raises the
incentive of unskilled workers to acquire human capital. In theory, feedback effects from
emigration to human-capital accumulation may change a country’s rate of economic
growth. Mountford (1997) shows that in the presence of human-capital externalities an

36
emigration-induced increase in the incentive to acquire skill can help an economy escape
a poverty trap, characterized by low investment in education and low growth, and move
to an equilibrium with high investment and high growth. Yet, it is entirely possible for
feedback effects to work in the opposite direction. Miyagiwa (1991) develops a model in
which, because of human capital spillovers, the migration of skilled labor from a low-
wage, skill-scare economy to a high-wage, skill-abundant economy reinforces the
incentive for brain drain, depleting the low-wage country of skilled labor. In Wong and
Yip (1999), the negative effects of brain drain on the stock of human capital reduce the
labor-exporting country’s growth rate.
Given that plausible theoretical models offer very different predictions for the
long-run consequences of skilled emigration, the effect of brain drain on an economy is
ultimately an empirical question. As mentioned in section 2, the literature on how
emigration affects the incentive to acquire skill has yet to produce conclusive results,
making it impossible to say whether the consequences of brain drain for growth are likely
to be positive or negative. Case-study evidence is similarly inconclusive. In China,
India, and Taiwan, the migration of skilled labor to Silicon Valley in the US – where
Indian and Chinese immigrants account for one third of the engineering labor force – has
been followed by increased trade with and investment from the US, helping foster the
creation of local high-technology industries (Saxenian, 2002). The recent rise in
educational attainment in China, India, and Taiwan may be partly a result of the lure of
working in the US and the domestic expansion of sectors intensive in the use of skilled
technicians.14 In Africa, however, the exodus of skilled professionals, many of whom
14 Between 1990 and 2000, the share of the adult resident population (i.e., net of brain drain) with a tertiary education rose from 2.0% to 2.7% in China, 4.1% to 4.8% in India, and 12.2% to 19.1% in Taiwan.
37
work in health care, may adversely affect living standards. Clemens (2006) reports that
in 25 out of 53 African nations at least 40% of native-born individuals practicing as
physicians were living and working abroad as of 2000. He finds a weak negative
correlation between child mortality and the share of the stock physicians (or nurses) that
has emigrated. Schiff (2006) offers further evidence that suggest pessimism about the
prospects for a beneficial brain drain.
5.2 Remittances and Return Migration
In a static setting, were the only effect of international migration to move labor
from one country to another, welfare in the sending country would decline (Hamilton and
Whalley, 1984). While the average incomes of migrants and destination-country natives
would rise, average income in the sending country would fall. Migrants, however, often
remit a portion of their income to family members at home, possibly reversing the
income loss in the sending country associated with the depletion of labor. In the last
several years, there has been substantial academic and policy interest in the consequences
of remittances for economic activity in sending countries.
Table 4 shows workers’ remittances received from abroad as a share of GDP by
geographic region. Remittances have increased markedly in East Asia and the Pacific,
Latin America and the Caribbean, South Asia, and Sub-Saharan Africa. As of 2004,
remittances exceeded official development assistance in all regions except Sub-Saharan
Africa and were greater than 65% of foreign direct investment inflows in all regions
except Europe and Central Asia. Among the smaller countries of Central America, the
Caribbean, and the South Pacific, remittances account for a large share of national
income, ranging from 10% to 17% of GDP in the Dominican Republic, Guatemala, El

38
Salvador, Honduras, Jamaica, and Nicaragua, and representing an astounding 53% of
GDP in Haiti (Acosta, Fajnzylber, and Lopez, 2007).
Table 4: Workers' Remittances and Compensation of Employees, % of GDP
Region 1992 1996 2000 2002 2004 2005 East Asia & Pacific 0.56 0.71 1.00 1.47 1.48 1.50 Europe & Central Asia 1.02 1.42 1.27 1.28 1.44 Latin America & Caribbean 0.70 0.79 1.04 1.67 2.06 1.98 Middle East & North Africa 8.31 3.69 3.07 3.76 4.31 4.13 South Asia 1.76 2.42 2.85 3.72 3.57 3.53 Sub-Saharan Africa 0.76 1.04 1.49 1.67 1.60 1.57 Source: World Development Indicators.
Reported remittances reflect those captured by the balance of payments, which
Freund and Spatafora (2007) suggest may understate actual remittances. Formal
remittance channels include banks and money transfer operators (e.g., Western Union)
for which service fees average 11% of the value of remittances. Informal remittances,
which are moved by couriers, relatives, or migrants themselves, tend to have lower fees,
but presumably higher risk. Formal remittances are negatively correlated with service
charges, with a 10% increase in fees being associated with a 1.5% reduction in transfers.
Fees are lower in economies that are dollarized and more developed financially (as
measured by the ratio of bank deposits to GDP).

39
Theoretical literature on migration models remittances as the outcome of a
dynamic contract between migrants and their families (e.g., Lucas and Stark, 1985). A
family helps finance migration costs for one of its members in return for a share of future
income gains associated with having moved to a higher wage location. Remittances are
the return on investments the family has made in the migrant. The prediction is that
remittances would rise following an increase in emigration and decline as existing
emigrants age and pay off debts to their families.
Having migrants abroad may also provide insurance for a family. To the extent
income shocks are imperfectly correlated across countries, migration helps families
smooth consumption over time by keeping remittances high when sending-country
income is low relative to the destination country and low when sending-country income
is relatively high (Rosenzweig and Stark, 1989). Yang (2007) examines changes in
remittances to households in the Philippines before and after the Asian financial crisis,
which he uses as a natural experiment to examine the impact of remittances on household
behavior. As of 1997, 6% of Philippine households had a member that had migrated
abroad. Some had gone to countries in the Middle East, whose currencies appreciated
sharply against the Philippine peso in 1997-1998, while others had gone to countries in
East Asia, whose currencies appreciated less sharply or even depreciated. Consistent
with consumption smoothing, remittances increased more for households whose migrants
resided in countries that experienced stronger currency appreciation against the peso.
Since income shocks associated with movements in exchange rates are largely transitory
in nature, the response of remittances reveals the extent to which migrants share

40
transitory income gains with family members at home. Yang finds that a 10%
depreciation of the Philippine peso is associated with a 6% increase in remittances.
Contrary to Yang’s results, remittances appear to be unresponsive to changes in
government transfers. In Mexico (Teruel and Davis, 2000) and Honduras and Nicaragua
(Olinto, 2007) remittances are uncorrelated with changes in rural household receipts from
conditional cash transfer programs, which were introduced into communities on a
randomized basis, permitting the experimental analysis of their impact on household
behavior. Were remittances a vehicle for consumption smoothing among rural
households, one would expect them to decline for a sending-country household,
following an exogenous increase in government income support.
There is some evidence that increases in remittances are associated with increased
expenditure on education and health. Cox Edwards and Ureta (2003) find that in El
Salvador households that receive remittances are more likely to allow children to stay in
school, with the effect being stronger in rural areas. Why should remittances be
correlated with school attendance? One possibility is that remittances allow credit-
constrained households to increase investments in productive activities that capital-
market imperfections prevent them from financing through borrowing. However, an
equally plausible explanation is that households that receive remittances are less credit
constrained to begin with and so more likely to invest in education, in which case the
correlation between remittances and educational investments may be the byproduct of
their correlation with some omitted variable, such as unobserved wealth.
To identify the impact of remittances on education, Yang (2007) examines
changes in household expenditure and labor supply in the Philippines before and after the

41
Asian financial crisis. Households with migrants in countries experiencing stronger
currency appreciation vis-à-vis the peso had larger increases in spending on child
education, spending on durable goods (televisions and motor vehicles), children’s school
attendance, and entrepreneurial investments. In these households, the labor supply of 10-
17 year old children fell by more, particularly for boys. In Mexico, Woodruff and
Zenteno (2007) also find a positive correlation between migration and sending-country
business formation. For a sample of small-scale enterprises, capital investment and
capital-output ratios are higher in firms where the owner was born in a state with higher
rates of migration to the United States. Woodruff and Zenteno instrument for current
state migration rates using proximity to the railroads along which Mexico’s initial
migration networks became established (Durand, Massey and Zenteno, 2001). Their
results are consistent with two different mechanisms for business formation: remittances
relax credit constraints on the creation of small enterprises, or return migrants – who may
have accumulated valuable work experience in the United States – are more likely to
launch new businesses upon returning to Mexico.
Remittances indicate migrants maintain contacts with family members at home.
They may do so in part because they anticipate returning home in the future, in which
case return migration may depend on their foreign earning opportunities. Yang (2006)
finds that an exchange rate shock that raises the peso-value of foreign earnings reduces
the likelihood a Philippine emigrant returns home, with 10% real appreciation being
associated with a one-year return rate that is 1.4% lower.
The use of a clear empirical identification strategy in Yang (2006, 2007) and
Woodruff and Zenteno (2007) is important, given the obvious concern that remittances

42
and household expenditures are jointly determined. Many recent papers report a positive
correlation between remittances and household spending on education, household
spending on health, children’s survival rates, or the likelihood a household is above the
poverty line, among other outcomes.15 Absent a natural experiment or valid instrument
for remittances, such correlations are difficult to interpret. Less credit constrained
households may be more likely to send migrants abroad and to invest in durable goods or
services (Assuncao and Carvalho, 2007). Remittances are the return to households from
having invested in sending a migrant abroad. Presumably, households invest in migration
for the purpose of enjoying higher spending in the future, meaning remittances are
evidence that a dynamic household contract has been fulfilled, not an independent causal
force. One would hope that the recent enthusiasm among international financial
institutions for the role of remittances in economic development (e.g., Inter-American
Development Bank, 2004) does not lead policy makers to ignore the economics of
migration in recommending policies related to labor outflows.
5.3 Information and the Flow of Ideas
The positive correlation between bilateral trade and migration has been
interpreted as evidence of a “diaspora externality,” in which previous waves of migration
create cross-national networks that facilitate exchange. Gould (1994) finds that bilateral
trade involving the US is larger with countries that have larger immigrant populations in
the US. Head and Reis (1998) find that a 10% increase in Canada’s immigrant
population from a particular country is associated with a 1% increase in bilateral
Canadian exports and a 3% increase in bilateral Canadian imports, with more recent
15 For a discussion of work in this literature, see Caglar and Ozden (2006) and Fajnzlber and Lopez (2007).
43
immigration having a stronger correlation with trade. It is difficult to draw causal
inferences from these results, since immigration may be correlated with unobserved
factors that also affect trade, such as the trading partners’ cultural similarity or bilateral
economic policies (e.g., preferential trade policies or investment treaties that raise the
return to both migration and trade).
Pushing the analysis a step further, Rauch and Trindade (2002) focus specifically
on networks associated with overseas Chinese populations. Successive waves of
emigration from southeastern China have created communities of ethnic Chinese
throughout Southeast Asia, as well as in South Asia and on the east cost of Africa. Rauch
and Trindade find that bilateral trade is positively correlated with the interaction between
the two countries’ Chinese populations (expressed as shares of the national population),
similar to the findings in Gould and Head and Ries. More interestingly, the correlation
between Chinese populations and trade is stronger for differentiated products than it is for
homogenous goods. To the extent differentiated products are more subject to
informational problems in exchange (Rauch, 1999), these are the goods one would expect
to be most sensitive to the presence of business networks.
Still unclear is whether greater trade is the natural outcome of increased migration
or a reflection of the types of individuals who select into migration. If more skilled and
more able individuals are more likely to migrate abroad and more likely to exploit
opportunities for commercial exchange, then the correlation between trade and migration
may be a byproduct of migrant self-selection. Subsequent policies to liberalize
immigration in destination countries would not necessarily increase trade with sending
countries, unless they allowed for the admission of individuals with a propensity to

44
engage in trade. Head and Ries (1998) find that immigrants admitted as refugees or on
the basis of family ties with Canadian residents have a smaller effect on trade than
immigrants admitted under a point system that values labor-market skills.
More controversial is the impact of emigration on political outcomes in sending
countries. When individuals live and work in another country they are exposed to new
political ideologies and alternative systems of government. This exposure may be most
important for students who go abroad to obtain a university degree, as they are at an
impressionable age and often travel on visas that require them to return to home after
completing their studies. Spilimbergo (2006) suggests there is an association between a
country’s democratic tendencies and the political systems of the countries under which its
students did their university training. He finds a positive correlation between the
democracy index in for a sending country and the average democracy index in the
countries in which a country’s emigrant students have studied. Unknown is whether the
political system of a sending country influences the types of countries in which its
students choose to study. Kim (1998), for instance, finds that the bilateral flow of foreign
students is larger between countries that share a common religion.

45
6. Final Discussion
Over the last decade and a half, migration flows from low and middle-income
countries to high-income countries have been increasing. The phenomenon is just
beginning to be understood, as cross-country data on international migration have only
recently become available. Another factor hindering research is that migration is jointly
determined with many other outcomes, complicating causal inference on the impact of
migration on economic development. With these concerns in mind, I summarize what
appear to be the more robust findings (or nonfindings) in the literature.
1. Bilateral migration flows are negatively affected by migration costs, as captured by
geographic or linguistic distance between countries, the absence of migration networks,
or the stringency of border enforcement against illegal entry. That migration is
negatively correlated with migration costs is not surprising. What is surprising is that
migration flows are so small in relation to observed migration costs, suggesting that
unobserved costs – broadly defined – must be substantial.
2. Emigration rates are highest for developing countries at middle income levels and with
higher population densities. The inverse U relationship between average income and
migration is suggestive of credit constraints that prevent individuals with very low
incomes from being able to finance migration through borrowing.
3. In most developing countries, it is the more educated who have the highest likelihood
of emigrating. In the large majority of sending countries, emigrants are positively
selected in terms of observable skill. In theory, positive selection would result from large
international differences in labor productivity, small international differences in the

46
return to skill, and/or migration costs that do not increase in skill too strongly. In
Australia, Europe and North America, high labor productivity attracts more-educated
immigrants from low-income countries, despite the fact that many of these individuals
could earn a higher annual percentage return on their schooling at home.
4. Emigrants sort themselves across destinations according to income-earning
possibilities, with the countries that have the highest incomes for skilled labor attracting
the most educated mix of immigrants. The ability of a country to attract more-skilled
emigrants appears to depend on its reward to skill relative to other destinations. Thus,
Australia, Canada, the UK, and the US, in which high-skilled workers enjoy relatively
high earnings, attract a more skilled mix of emigrants than continental Europe.
5. Empirically, the impact of opportunities for skilled emigration on the stock of human
capital in a country is unknown. In the last decade, a new theoretical literature has
emerged which takes a more sanguine view of brain drain. While the idea that skilled
emigration raises the incentive to acquire skill in a country is plausible, the literature is
missing well identified econometric estimates of how human capital accumulation and
economic growth respond to labor outflows. Standard economic models would suggest
the departure of skilled workers adversely affects the livelihoods of the poor majority in
developing countries (Benhabib and Jovanovic, 2007). At least for now, there are no
compelling data to suggest this view be overturned.
6. There is some evidence that emigration puts upward pressure on wages in sending
countries. In the short run, economic theory suggests the exodus of labor from a country
would raise wages. Evidence from Mexico indicates that emigration has increased wages
47
for the skill groups and regions with the highest emigration rates. The preponderance of
relatively highly educated individuals among emigrants suggests labor outflows may
have adverse consequences on sending countries’ public finances. However, in the case
of India the fiscal effects of skilled emigration appear to be small.
7. Migrant remittances tend to positively correlated with household consumption and
investments in education and entrepreneurial activities in sending countries. These
findings, while intriguing, lack a clear policy interpretation. Complicating inference
about the development impacts of remittances is the fact that less credit constrained
households are the ones most likely to send migrants abroad in the first place.
Concluding that remittances cause these households to have higher spending, higher
investment, or improved health outcomes for women and children may confound the
effects of emigration with the effects of unobserved wealth that make emigration
possible. Finding that remittances improve the livelihoods of the poor is certainly more
exciting than saying wealthier households are more likely to enjoy higher standards of
living, but it is not a result for which there is yet broad empirical support.
Despite recent advances in the theoretical and empirical analysis of international
migration, there is still a great deal that we do not know about global labor movements.
Much of the individual level data on international migration covers Mexico and/or the
US, which are the subject of a large literature. As the largest sending country and
receiving country, there is still more to learn about the Mexico-US context. Yet, the
highest payoff to research is likely to be in the many under-studied parts of the world.
Since 1990, Central and Eastern Europe have become major sending regions; the Gulf

48
States, Russia, and Spain have become an important receiving regions; and emigration
from China, India, Indonesia, Pakistan, and the Philippines have accelerated, to name but
a few of the recent developments in global labor flows.
Among the many questions about international migration that deserve further
study, I would emphasize the following:
• We know little about the magnitude of international migration costs. What is the
relative importance of uncertainty, credit constraints, and destination-country
admission policies in keeping the poor from migrating to rich economies?
• While there is evidence that migration networks play an important role in
reducing moving costs, the dynamics of networks are poorly understood. Are
there diminishing returns in the impact of network size on migration costs? Or
does the existence of networks imply that spatial opportunities for emigration will
only become more unequal over time?
• We still know little empirically about the factors that determine who leaves
different countries. What are the contributions of international differences in
labor productivity, returns to schooling, and migration costs to migrant selection?
• Given the importance of human capital in economic development, how skilled
emigration affects a country’s relative supply of skill is a question of first-order
policy importance. How do how changes in education, tax, or other policies in
developing countries affect skilled emigration, the domestic supply of skill, or
remittances from skilled emigrants?
• Sending and receiving countries are still far from having equal factor prices, in
which case we might expect to see trade, migration, and FDI to happen
49
concurrently, even reinforcing one another. How does migration interact with
international trade and foreign direct investment?
• The inflow of remittances has been a welcome financial boon for many labor-
exporting countries. Do remittances in fact help deepen domestic financial
markets, as households use banks or other intermediaries to manage lumpy
income receipts from abroad?
Within the development policy community, there are calls for rich countries to
open their economies more widely to labor inflows from poor countries (e.g., Prichett,
2006). Completely open borders are off the table politically. Were the developed world
to propose an increase in immigration quotas, should developing countries take the offer?
The answer would depend on how destination countries structured the additional labor
inflows. An increase in immigration quotas that targeted workers with higher levels of
skill could raise global income, even as it lowered welfare for the less-skilled majority in
source countries (Benhabib and Jovanovic, 2007). Quotas targeted to less-skilled
workers could raise global welfare, though in the presence of human capital externalities
they would not necessarily maximize global income. The adoption of such a policy
would surely face opposition in receiving countries over concerns about fiscal and labor-
market consequences. Getting sending and receiving countries to coordinate on
international migration is a difficult task. A helpful first step would be to determine if the
interests of the two groups of countries are really as far apart as they seem.
50
References
Acosta, Pablo, Pablo Fajnzylber, and Humberto Lopez. 2007. “How Important are Remittances in America?” In Pablo Fajnzylber and Humberto Lopez, eds., Close to Home, Washington, DC: The World Bank, forthcoming. Adams, Richard. 2003. “International Migration, Remittances, and Brain Drain: A Study of 24 Labor Exporting Countries.” World Bank Policy Research Working Paper no. 2972. Assuncao, Juliano J., and Leandro S. Carvalho. 2007. “Financial Constraints, Migration, and Inequality.” Journal of Development Economics, forthcoming. Aydemir, Abdurrahman and George J. Borjas. 2007. “A Comparative Analysis of the Labor Market Impact of International Migration: Canada, Mexico, and the United States.” Journal of the European Economic Association, forthcoming. Banerjee, Abhijit V. and Andrew Foster. 1993. “Occupational Choice and the Process of Development.” Journal of Political Economy, 101(2): 274-298. Barro, Robert J. and Jong-Wha Lee. 2000. “International Data on Educational Attainment: Updates and Implications.” Center for International Development Working Paper No. 42. Beine, Micahael, Frederic Docquier, and Hillel Rapoport. 2001. “Brain Drain and Economic Growth: Theory and Evidence.” Journal of Development Economics, 64(1): 275-289. Beine, Micahael, Frederic Docquier, and Hillel Rapoport. 2006a. “Measuring International Skilled Migration: New Estimates Accounting for Age of Entry.” World Bank Research Report. Beine, Micahael, Frederic Docquier, and Hillel Rapoport. 2006b. “Brain Drain and Human Capital Formation in Developing Countries: Winners and Losers.” IRES Working Paper No. 2006-23. Benhabib, Jess, and Boyan Jovanovic. 2007. “Optimal Migration: A World Perspective.” NBER Working Paper No. 12871. Bhagwati, Jagdish N. and Koichi Hamada. 1974. “The Brain Drain, International Integration of Markets for Professionals, and Unemployment.” Journal of Development Economics 1(1): 19-42. Bhagwati, Jagdish N. and Carlos Rodriguez. 1975. “Welfare Theoretic Analyses of the Brain Drain.” Journal of Development Economics 2(3): 195-221.

51
Bhagwati, Jagdish N. and John Wilson, eds., Income Taxation and International Mobility, Cambridge: The MIT Press. Boeri, Tito, Barry McCormick, and Gordon H. Hanson. 2002. Immigration Policy and the Welfare State. Oxford: Oxford University Press. Borjas, George J. 1987. “Self-Selection and the Earnings of Immigrants.” American Economic Review 77(4): 531-553. Borjas, George, J. 1991. “Immigration and Self-Selection.” In John Abowd and Richard Freeman, eds., Immigration, Trade, and the Labor Market. Chicago: University of Chicago Press, pp. 29-76. Borjas, George J. 1999a. Heaven’s Door: Immigration Policy and the American Economy. Princeton, N.J.: Princeton University Press. Borjas, George J. 1999b. “The Economic Analysis of Immigration.” In Orley C. Ashenfelter and David Card, eds., Handbook of Labor Economics, Amsterdam: North-Holland, pp. 1697-1760. Borjas, George J. 2006. “Labor Outflows and Labor Inflows in Puerto Rico.” Mimeo, Harvard University. Borjas, George J., ed. 2007. Mexican Immigration. Chicago: University of Chicago Press and the National Bureau of Economic Research. Borjas, George J., and Lynette Hilton. 1996. “Immigration and the Welfare State: Immigrant Participation in Means-Tested Entitlement Programs” Quarterly Journal of Economics, 111(2): 575-604. Cano, Gustavo. 2004. “Organizing Immigrant Communities in American Cities: Is this Transnationalism, or What?” Working Paper 103, Center for Comparative Immigration Studies, UCSD. Card, David. 2005. “Is the New Immigration Really so Bad?” Economic Journal, 115(507): 300-323. Cardoso, Lawrence. 1980. Mexican Emigration to the United States, 1897-1931. Tucson, University of Arizona Press. Carrington, William J. and Enrica Detragiache. 1998. “How Big is the Brain Drain?” IMF Working Paper 98/102. Chiquiar, Daniel and Gordon Hanson. 2005. “International Migration, Self-Selection, and the Distribution of Wages: Evidence from Mexico and the United States.” Journal of Political Economy, April 113(2): 239-281.

52
Clark, Ximena, Timothy Hatton, Jeffrey Williamson. 2007. “Explaining U.S. Immigration, 1971-1998.” Review of Economics and Statistics, 89(2): 359-373. Cornelius, Wayne A. 2005. “Impacts of U.S. Immigration Control Policies on Migratory Behavior: The View from Mexican Sending Communities.” Mimeo, UCSD.
Cortes, Patricia. 2005. “The Effects of Low-Skilled Immigration on US Prices: Evidence from CPI Data.” Mimeo, MIT. Cuecuecha, Alfredo. 2005. “The Immigration of Educated Mexicans: The Role of Informal Social Insurance and Migration Costs.” Mimeo, ITAM. Desai, Mihir, Devesh Kapur, and John McHale. 2003. “The Fiscal Impact of High Skilled Emigration: Flows of Indians to the U.S., Weatherhead Center for International Affairs Working Paper 03-01. Docquier, Frederic and Abdeslam Marfouk. 2006. “International Migration by Educational Attainment, 1990-2000.” In Caglar Ozden and Maurice Schiff, eds., International Migration, Remittances, and the Brain Drain. Washington, DC: The World Bank and Palgrave McMillan, pp. 151-200. Docquier, Frederic and Hillel Rapoport. 2007. “Skilled Migration: The Perspective of Developing Countries.” Mimeo, Bar Ilan University. Durand, Jorge, Douglas S. Massey, and Rene M. Zenteno. 2001. “Mexican Immigration in the United States.” Latin American Research Review 36(1): 107-127. Fajnzylber, Pablo, and Humberto Lopez, eds. 2007 Close to Home, Washington, DC: The World Bank, forthcoming. Feliciano, Zadia. 2001. “The Skill and Economic Performance of Mexican Immigrants from 1910 to 1990.” Explorations in Economic History 38: 386-409. Fernandez-Huertas, Jesus. 2006. “New Evidence on Emigration Selection.” Mimeo, Columbia University. Freund, Caroline, and Nicola Spatafora. 2007. “Informality and Remittances.” Mimeo, The World Bank. Gathmann, Christina. 2004. “The Effects of Enforcement on Illegal Markets: Evidence from Migrant Smuggling on the Southwestern Border.” IZA Discussion Paper No. 1004. Grogger, Jeffrey, and Gordon H. Hanson. 2007. “Income Maximization and the Sorting of Emigrants across Destinations.” Mimeo, UCSD.
53
Gould, David M. 1994. “Immigration Links to the Home Country: Empirical Implications for U.S. bilateral Trade Flows.” Review of Economics and Statistics, 76: 302-316. Hamilton, Bob, and John Whalley. 1984. “Efficiency and Distributional Implications of Global Restrictions on Labor Mobility.” Journal of Development Economics, 14(1): 61-75. Hanson, Gordon H. 2006. “Illegal Migration from Mexico to the United States.” Journal of Economic Literature, 44: 869-924. Hanson, Gordon H. 2007. “Emigration, Labor Supply, and Earnings in Mexico.” In George J. Borjas, ed., Mexican Immigration. Chicago: University of Chicago and National Bureau of Economic Research, pp. 289-328. Hanson, Gordon H. 2007. “International Migration and the Developing World.” Mimeo, UCSD. Hanson, Gordon H., Kenneth Scheve, and Matthew J. Slaughter. 2007. “Local Public Finance and Individual Preferences over Globalization Strategies”, Economics and Politics, forthcoming. Hanson, Gordon H., and Antonio Spilimbergo. 1999. "Illegal Immigration, Border Enforcement and Relative Wages: Evidence from Apprehensions at the U.S.-Mexico Border," American Economic Review, 89: 1337-57.
Hatton, Timothy J., and Jeffrey G. Williamson. 2004. “Refugees, Asylum Seekers and Policy in Europe.” NBER Working Paper No. 10680.
Hatton, Timothy J. and Jeffrey G. Williamson. 2005. “A Dual Policy Paradox: Why Have Trade and Immigration Policies Always Differed in Labor-Scarce Economies.” NBER Working Paper No. 11866. Head, Keith, John Ries, and Deborah Swenson. 1998. “Immigration and Trade Creation: Econometric Evidence from Canada.” Canadian Journal of Economics, 31(1): 47-62. Ibarraran, Pablo, and Darren Lubotsky. 2005. “The Socioeconomic Status of Mexican Migrant Families: New Evidence from the 2000 Mexican Census.” In George J. Borjas, ed., Mexican Immigration. Chicago: University of Chicago and National Bureau of Economic Research, forthcoming. Inter-American Development Bank. 2004. Sending Money Home: Remittance to Latin America and the Caribbean. Washington, DC: IADB. Kim, Jinyoung, 1998, “Economic Analysis of Foreign Education and Students Abroad,” Journal of Development Economics, 56(2): 337-65.

54
Lucas, Robert E. 1988. “On the Mechanics of Economic Development.” Journal of Monetary Economics, 22(3): 3-42. Lucas, Robert E.B. 1985. “Motivations to Remit: Evidence from Botswana.” Journal of Political Economy, 93(5): 901-918. Massey, Douglas S. and Kristin E. Espinosa. 1997. “What’s Driving Mexico-U.S. Migration? A Theoretical, Empirical, and Policy Analysis.” American Journal of Sociology 102(4): 939-999. Massey, Douglas S., L. Goldring, and Jorge Durand. 1994. “Continuities in Transnational Migration: An Analysis of Nineteen Mexican Communities.” American Journal of Sociology 99(6): 1492-1533. Mayda, Anna Maria. 2005. “International Migration: A Panel Data Analysis of Economic and Non-economic Determinants.” IZA Discussion Paper No. 1590. McHale, John. 2007. “Taxation and Skilled Indian Migration to the United States: Revisiting the Bhagwati Tax.” Mimeo, Queen’s University. McKenzie, David, John Gibson, and Steven Stillman. 2006. “How Important is Selection? Experimental versus Non-experimental Measures of the Income Gains from Migration.” Mimeo, the World Bank. McKenzie, David and Hillel Rapoport. 2006. “Self-Selection Patterns in Mexico-U.S. Migration: The Role of Migration Networks.” Mimeo, the World Bank and Bar-Ilan University. McKenzie, David and Hillel Rapoport. 2007. “Network Effects and the Dynamics of Migration and Inequality: Theory and Evidence from Mexico.” Journal of Development Economics, 84(1): 1-24. Mishra, Prachi. 2007. “Emigration and Wages in Source Countries: Evidence from Mexico.” Journal of Development Economics, 82(1): 180-199. Miyagiwa, Kaz. 1991. “Scale Economies in Education and the Brain Drain Problem.” International Economic Review, 32(3): 743-759. Mountford, Andrew. 1997. "Can a Brain Drain Be Good for Growth in the Source Economy?" Journal of Development Economics, 53(2): 287-303. Munshi, Kaivan. 2003. “Networks in the Modern Economy: Mexican Migrants in the US Labor Market.” Quarterly Journal of Economics 118 (May): 549-97. OECD. 2006. International Migration Outlook. OECD: Paris.
55
Olinto, Pedro. “Do Conditional Cash Transfer Programs Crowd Out Private Transfers?” In Pablo Fajnzylber and Humberto Lopez, eds., Close to Home, Washington, DC: The World Bank, forthcoming. Orrenius, Pia M. and Madeline Zavodny. 2005. “Self-Selection among Undocumented Immigrants from Mexico.” Journal of Development Economics, October 78(1): 215-240. Ottaviano, Gianmarco I.P., and Giovanni Peri. 2006. “Rethinking the Effects of Immigration on Wages.” NBER Working Paper No. 12497. Ozden, Caglar, and Maurice Schiff, eds.. 2006. International Migration, Remittances, and the Brain Drain. Washington, DC: The World Bank and Palgrave McMillan. Pritchett, Lant. 2006. Let Their People Come: Breaking the Gridlock on Global Labor Mobility. Washington, DC: Center for Global Development. Ramos, Fernando. 1992. “Out-Migration and Return Migration of Puerto Ricans.” In Immigration and the Work Force, George Borjas and Richard Freeman (eds.). Chicago: University of Chicago Press and NBER. 49-66. Rapoport, Hillel. 2002. “Migration, Credit Constraints, and Self-Employment: A Simple Model of Occupational Choice, Inequality, and Growth.” Economics Bulletin, 15(7): 1-5. Ratha, Dilip, and William Shaw. 2007. “South-South Migration and Remittances.” Mimeo, The World Bank. Rauch, James E., 1999, “Networks versus Markets in International Trade,” Journal of International Economics, 48(1): 7-35. Rauch, James E. and Vitor Trindade, 2002, “Ethnic Chinese Networks in International Trade,” Review of Economics and Statistics, 84(1), February, 116-130. Rosenzweig, Mark. 2006. “Global Wage Differences and International Student Flows.” Brookings Trade Forum. Rosenzweig, Mark. 2007. “Education and Migration: A Global Perspective.” Mimeo, Yale. Rosenzweig, Mark, and Oded Stark. 1989. “Consumption Smoothing, Migration, and Marriage: Evidence from Rural India.” Journal of Political Economy, 97(4): 905-926. Roy, A.D. 1951. “Some Thoughts on the Distribution of Earnings.” Oxford Economic Papers 3 (June): 135-46.

56
Rubalclava, Luis, Graciela Teruel, Noreen Goldman, and Duncan Thomas. 2006 “Do Healthier Mexicans Migrate to the United States? New Findings from the Mexican Family Life Survey.” Mimeo, CIDE. Saxenian, AnnaLee. 2002. Local and Global Networks of Immigrant Professionals in Silicon Valley. Monograph, Public Policy Institute of California. Schiff, Maurice. 2006. “Brain Gain: Claims about its Size and Impact on Growth are Greatly Exaggerated.” In Caglar Ozden and Maurice Schiff, ed., International Migration, Remittances, and Brain Drain, Washington, DC: The World Bank, pp. 201-225. Spilimbergo, Antonio. 2006. “Foreign Students and Democracy.” Mimeo, IMF. Stark, Oded, Christian Helmenstein and Alexia Prskawetz. 1997. ”A Brain Gain with a Brain Drain.” Economics Letters, 55: 227-234. Stark, Oded, and You Qiang Wang. 2002. “Inducing Human Capital Formation: Migration as a Substitute for Subsidies.” Journal of Public Economics 86(1): 29-46. Teruel, Graciela and B. Davis. 2000. “Final Report: An Evaluation of the Impact of PROGRESA Cash Payments on Private Inter-Household Transfers.” International Food Policy Research Institute, Washington, DC. United Nations. 2005. “Trends in Total Migrant Stock: 2005 Revision.” New York: Department of Economic and Social Affairs, United Nations. Wellisch, Dietmar, and Uwe Walz. 1998. “Why Do Rich Countries Prefer Free Trade over Free Immigration? The Role of the Modern Welfare States.” European Economic Review, 42: 1595-1612. Wong, Kar-yiu and Chong Kee Yip. 1999. “Education, Economic Growth, and Brain Drain.” Journal of Economic Dynamics and Control, 23(): 699-726. Woodruff, Christopher and Rene Zenteno. 2007. “Migration Networks and Microenterprises in Mexico.” Journal of Development Economics, forthcoming. Yang, Dean. 2006. “Why Do Migrants Return to Poor Countries? Evidence from Philippine Migrants Responses to Exchange Rate Shocks.” Review of Economics and Statistics, 88(4): 715-735. Yang, Dean. 2007. “International Migration, Remittances, and Household Investment: Evidence from Philippine Migrants’ Exchange Rate Shocks.” Economic Journal, forthcoming.