International Maritime Trade Overview
35
International Maritime Trade Overview The determinants driving investment and operational efficiency Dr. Vincent F. Valentine Division on Technology and Logistics
-
Upload
tristan-wiggill -
Category
Business
-
view
209 -
download
0
Transcript of International Maritime Trade Overview
International Maritime Trade
Overview
The determinants driving investment and operational efficiency
Dr. Vincent F. Valentine
Division on Technology and Logistics

An global organisation focused upon helping developing countries
integrate into world trade
UNCTAD
Consensus buildingTechnical assistance
and capacity buildingResearch & analysis

Contents
• 1 - International Maritime Trade Overview
– A) Demand
– B) Supply
– C) Freight costs
• 2 - Infrastructure investment
• 3 - Operational efficiency
• 1 - International Maritime Trade Overview
– A) Demand
– B) Supply
– C) Freight costs

GDP Growth 2008-2016
Source: UNDESA, WESP January 2015

GDP forcast 2015-2016
a Partly estimated; b Forecast, based in part on Project LINK;
Source: UNDESA, WESP 2015
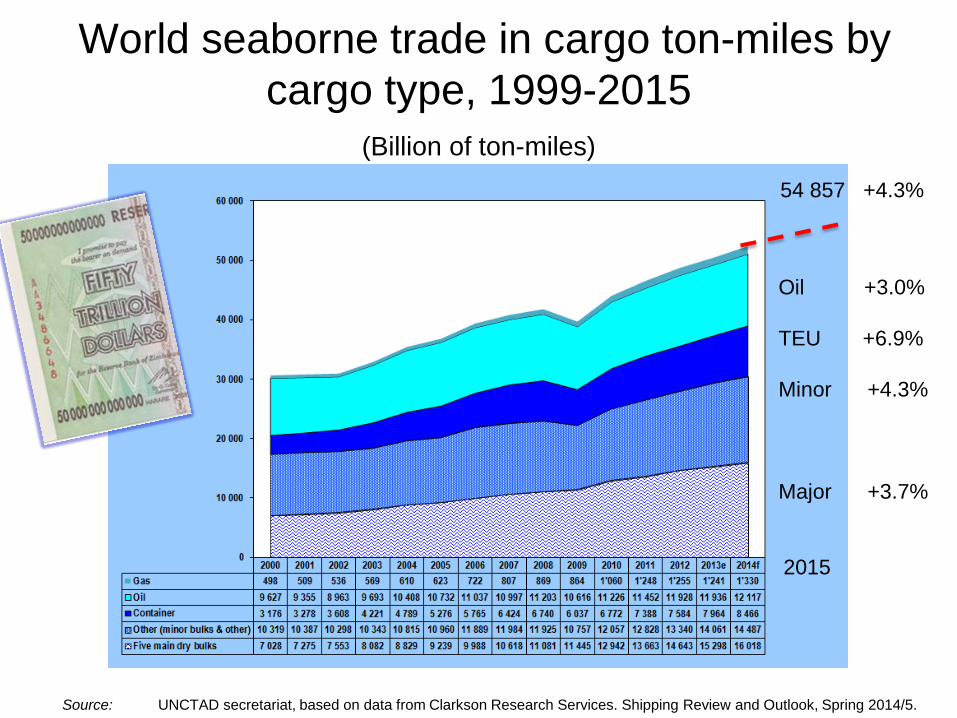
World seaborne trade in cargo ton-miles by
cargo type, 1999-2015
(Billion of ton-miles)
Source: UNCTAD secretariat, based on data from Clarkson Research Services. Shipping Review and Outlook, Spring 2014/5.
2015
54 857 +4.3%
Oil +3.0%
TEU +6.9%
Minor +4.3%
Major +3.7%
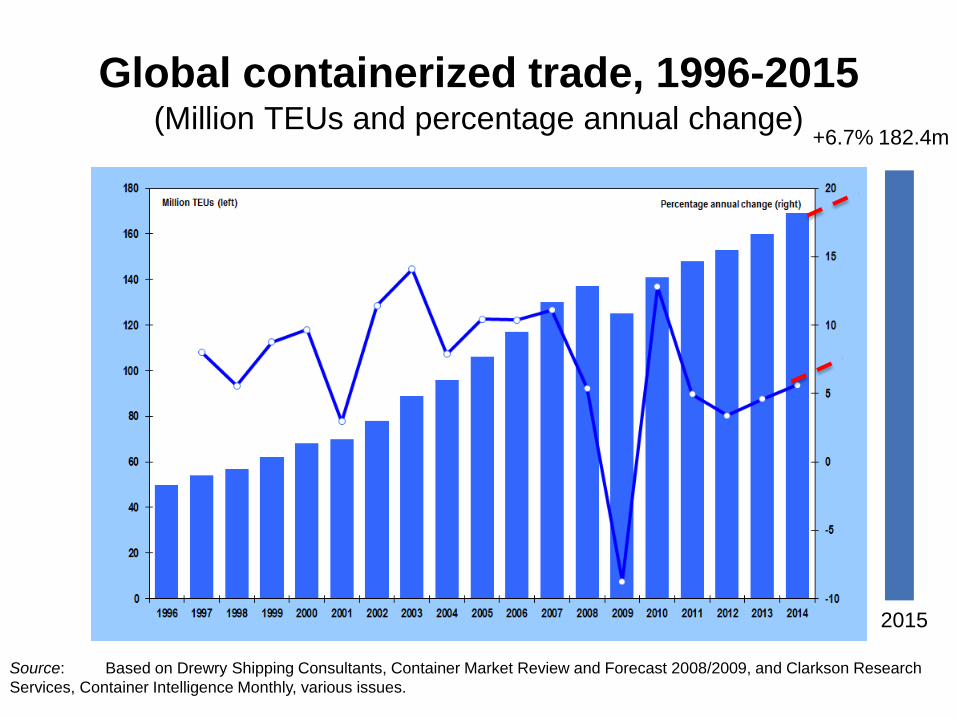
Global containerized trade, 1996-2015(Million TEUs and percentage annual change)
Source: Based on Drewry Shipping Consultants, Container Market Review and Forecast 2008/2009, and Clarkson Research
Services, Container Intelligence Monthly, various issues.
182.4m
2015
+6.7%
• 1 - International Maritime Trade Overview
– A) Demand
– B) Supply
– C) Freight costs
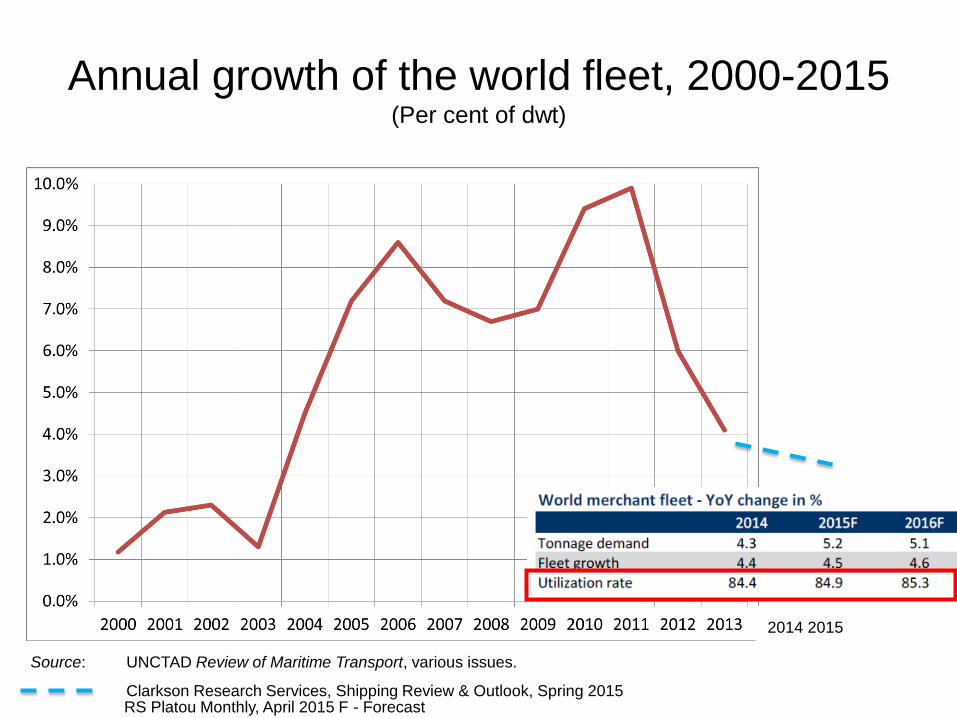
Annual growth of the world fleet, 2000-2015 (Per cent of dwt)
Source: UNCTAD Review of Maritime Transport, various issues.
Clarkson Research Services, Shipping Review & Outlook, Spring 2015
2014 2015
RS Platou Monthly, April 2015 F - Forecast
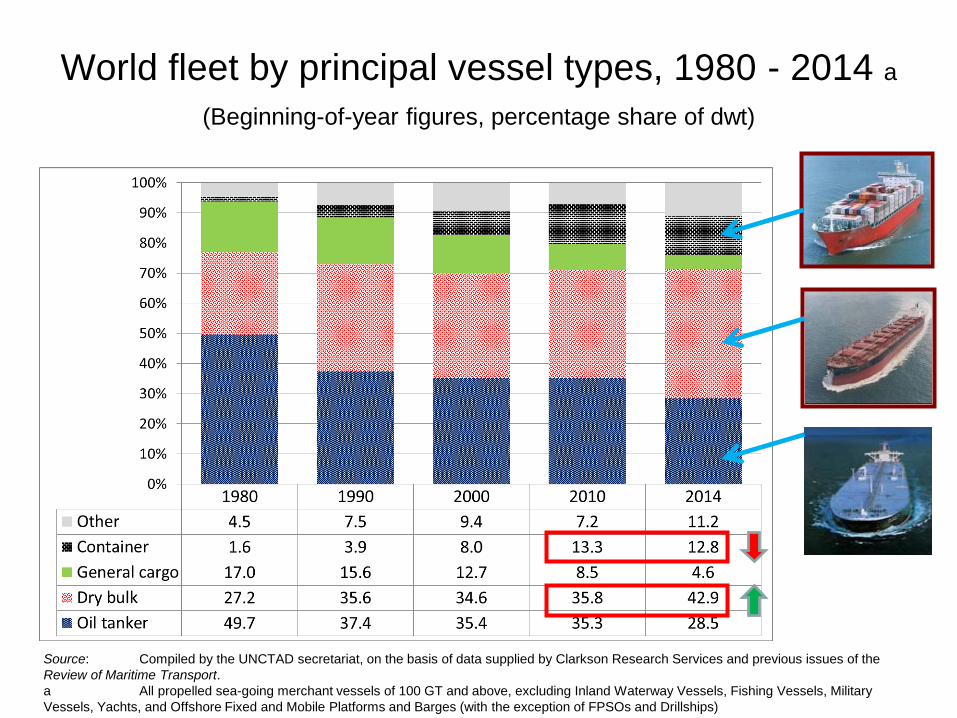
World fleet by principal vessel types, 1980 - 2014 a
(Beginning-of-year figures, percentage share of dwt)
Source: Compiled by the UNCTAD secretariat, on the basis of data supplied by Clarkson Research Services and previous issues of the
Review of Maritime Transport.
a All propelled sea-going merchant vessels of 100 GT and above, excluding Inland Waterway Vessels, Fishing Vessels, Military
Vessels, Yachts, and Offshore Fixed and Mobile Platforms and Barges (with the exception of FPSOs and Drillships)
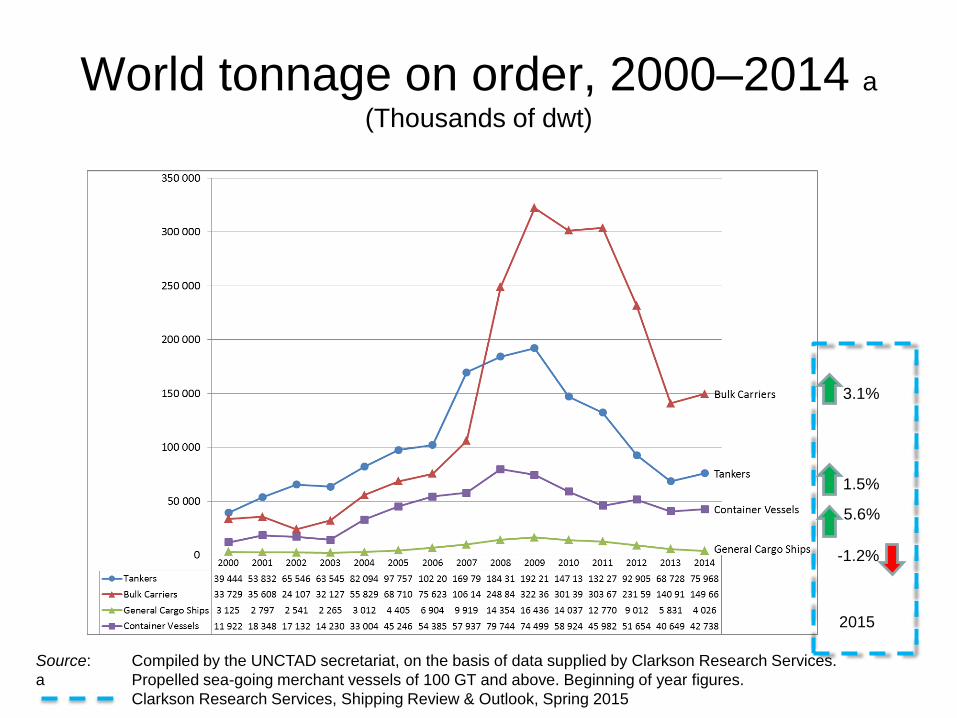
World tonnage on order, 2000–2014 a
(Thousands of dwt)
Source: Compiled by the UNCTAD secretariat, on the basis of data supplied by Clarkson Research Services.
a Propelled sea-going merchant vessels of 100 GT and above. Beginning of year figures.
Clarkson Research Services, Shipping Review & Outlook, Spring 2015
5.6%
3.1%
2015
1.5%
-1.2%

The 10 leading liner companies, May 2015
(Number of ships and total shipboard capacity deployed, in TEUs, ranked by TEU)
Source: http://www.alphaliner.com/top100/

• 1 - International Maritime Trade Overview
– A) Demand
– B) Supply
– C) Freight costs
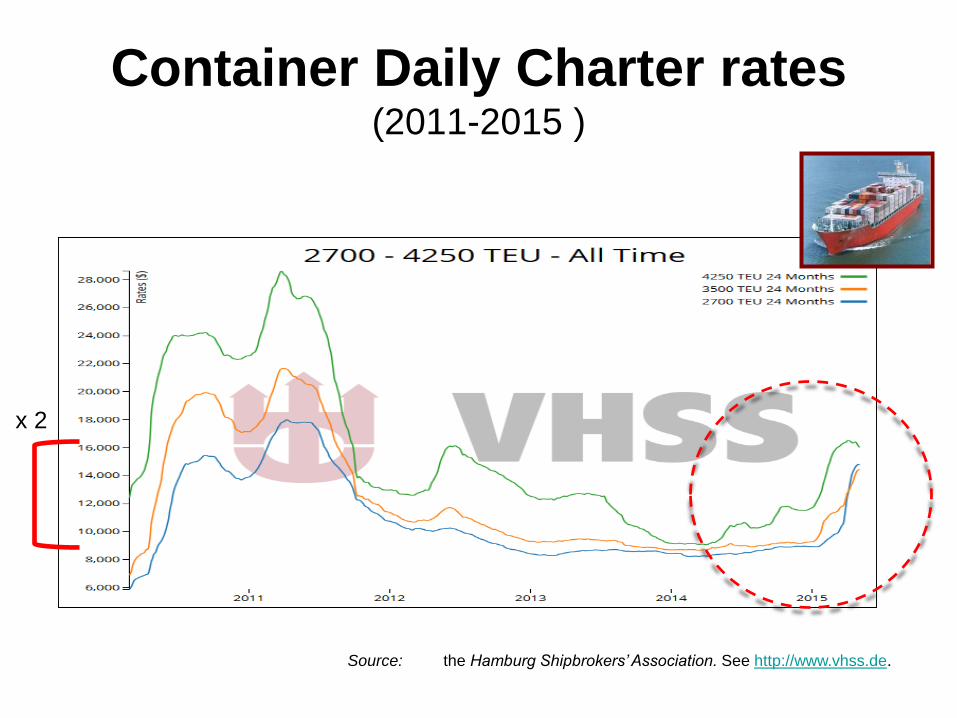
Container Daily Charter rates (2011-2015 )
Source: the Hamburg Shipbrokers’ Association. See http://www.vhss.de.
x 2

Daily earnings of bulk carrier vessels, 2008–2014(Dollars per day)
Source: UNCTAD, based on data from Clarkson Shipping Intelligence Network, figures published by the London Baltic Exchange.
Note: Supramax – average of the six time charter routes; Handysize – average of the six time charter routes; Panamax – average
of the four time charter routes; Capesize – average of the four time charter routes.
RS Platou Monthly, April 2015
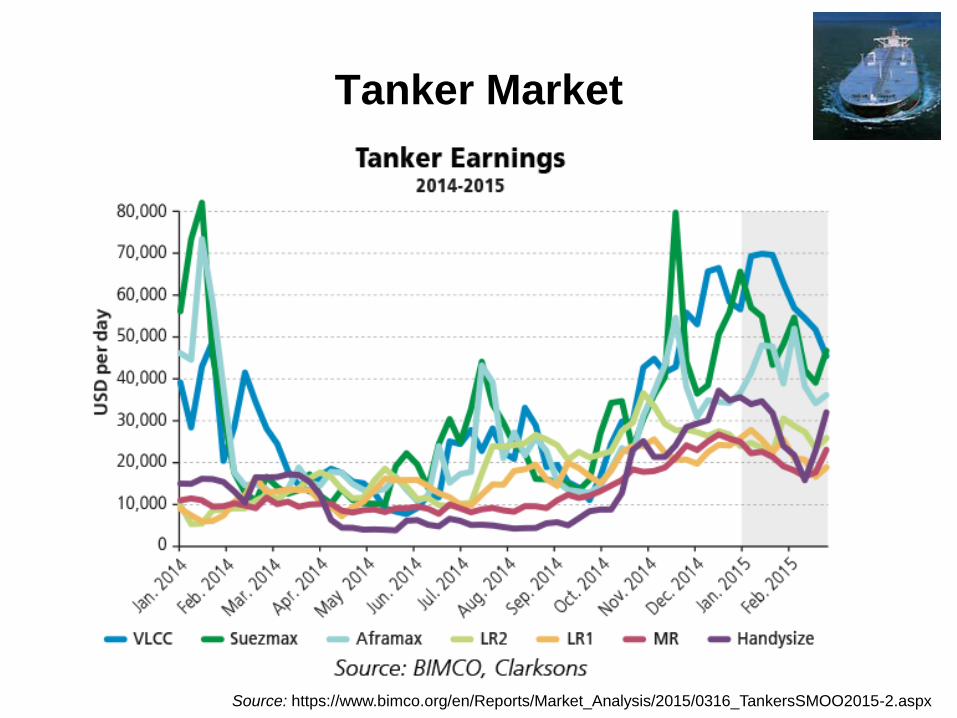
Tanker Market
Source: https://www.bimco.org/en/Reports/Market_Analysis/2015/0316_TankersSMOO2015-2.aspx

Contents
• 1 - International Maritime Trade Overview
– A) Demand
– B) Supply
– C) Freight costs
• 2 - Infrastructure investment
• 3 - Operational efficiency
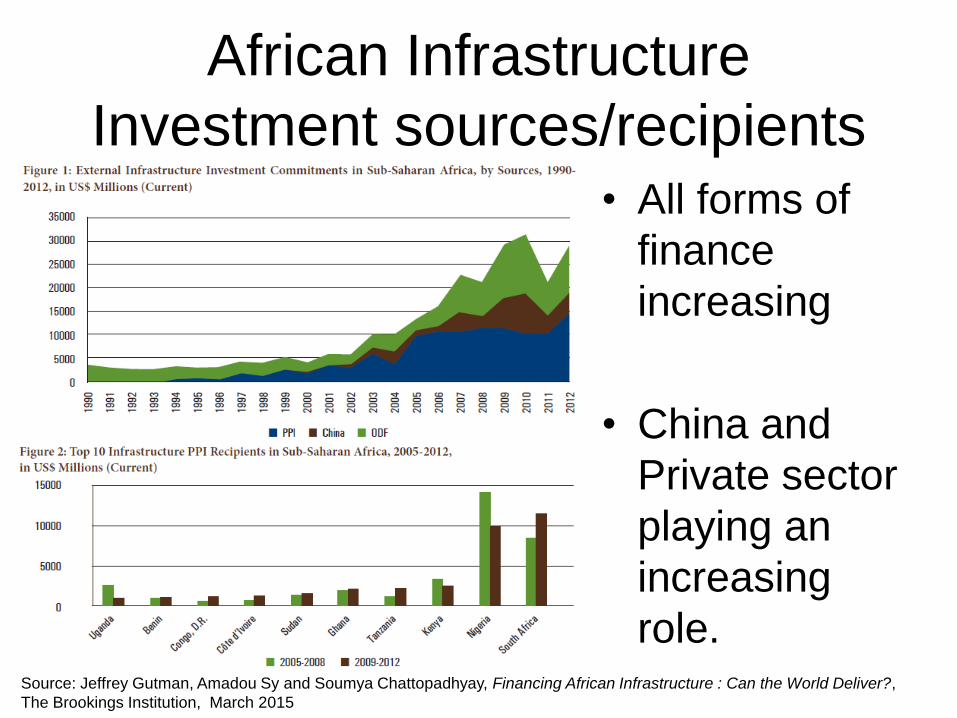
African Infrastructure
Investment sources/recipients• All forms of
finance
increasing
• China and
Private sector
playing an
increasing
role.Source: Jeffrey Gutman, Amadou Sy and Soumya Chattopadhyay, Financing African Infrastructure : Can the World Deliver?,
The Brookings Institution, March 2015
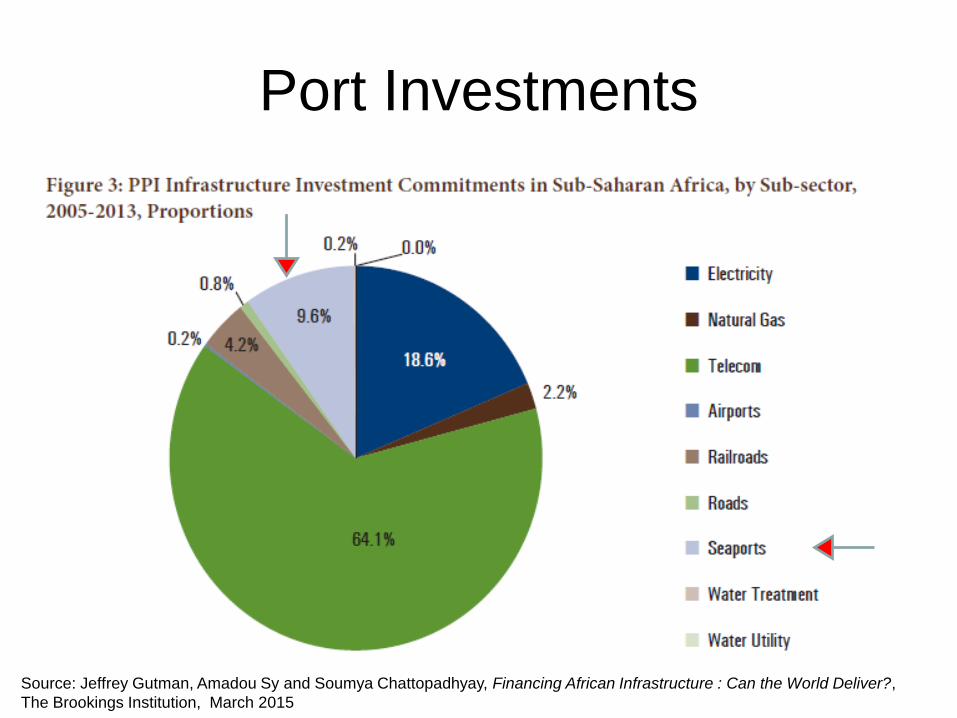
Port Investments
Source: Jeffrey Gutman, Amadou Sy and Soumya Chattopadhyay, Financing African Infrastructure : Can the World Deliver?,
The Brookings Institution, March 2015

Tanzania (Bagamoyo)
• An $11 billion project
to make it the region's
biggest port at an
estimated 20m TEU.
• China Merchant
Holding International
and Omani sovereign
wealth fund.
• Foundation stone to
be laid in July 2015
Source: Tanzania Diaspora 13 March 2015 http://www.tanzaniadiaspora.org/govt-to-lay-foundation-stone-for-bagamoyo-mega-
port-in-july/ /
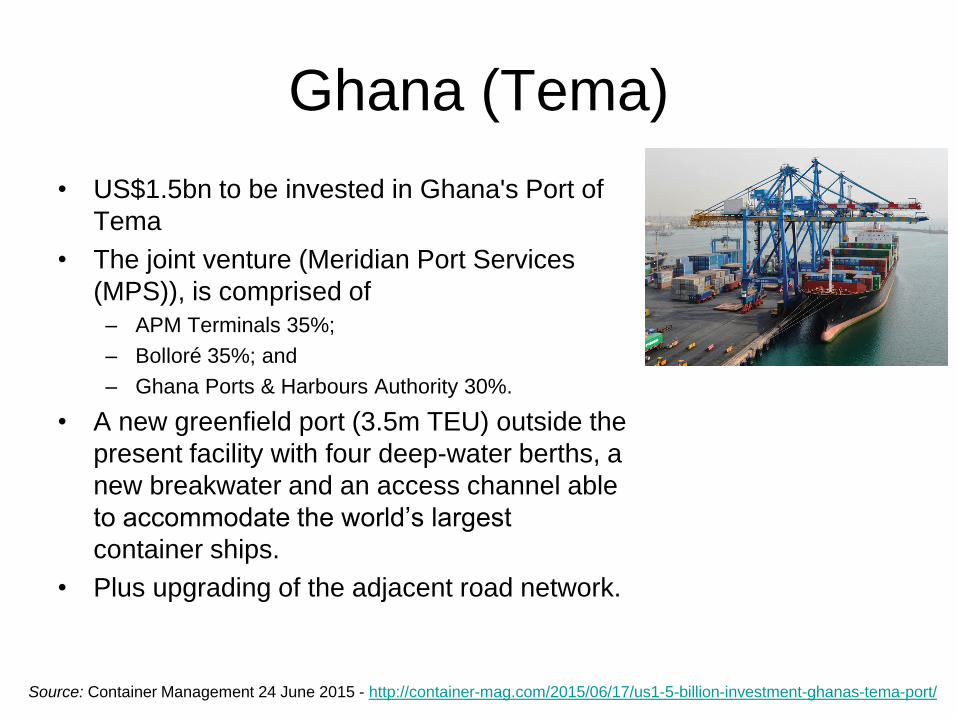
Ghana (Tema)
• US$1.5bn to be invested in Ghana's Port of
Tema
• The joint venture (Meridian Port Services
(MPS)), is comprised of
– APM Terminals 35%;
– Bolloré 35%; and
– Ghana Ports & Harbours Authority 30%.
• A new greenfield port (3.5m TEU) outside the
present facility with four deep-water berths, a
new breakwater and an access channel able
to accommodate the world’s largest
container ships.
• Plus upgrading of the adjacent road network.
Source: Container Management 24 June 2015 - http://container-mag.com/2015/06/17/us1-5-billion-investment-ghanas-tema-port/

Other notable investments
• In Abidjan, Côte d’Ivoire, plans include increasing TEU
capacity to 1–1.5 million. A $933-million contract
between the Abidjan Port Authority and China Harbour
Engineering Company Limited.
• In Cameroon, the Mbalam iron-ore project at $8.7
billion needed for construction work which will include a
510-kilometre rail line for the transportation of iron ore
from the Mbarga Mine to the Cameroon coast. A
deepwater iron-ore export terminal is being built at
Lolabe, in Kribi, with the capacity to handle Chinamax
iron-ore bulk carriers.
Source: UNCTAD Review of Maritime Transport 2013
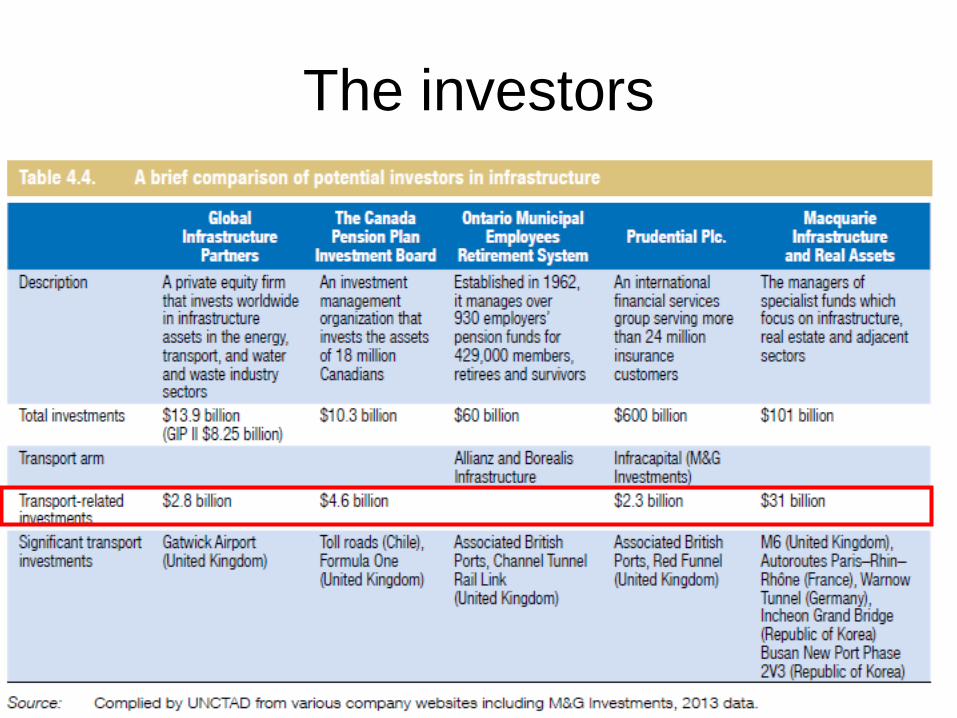
The investors
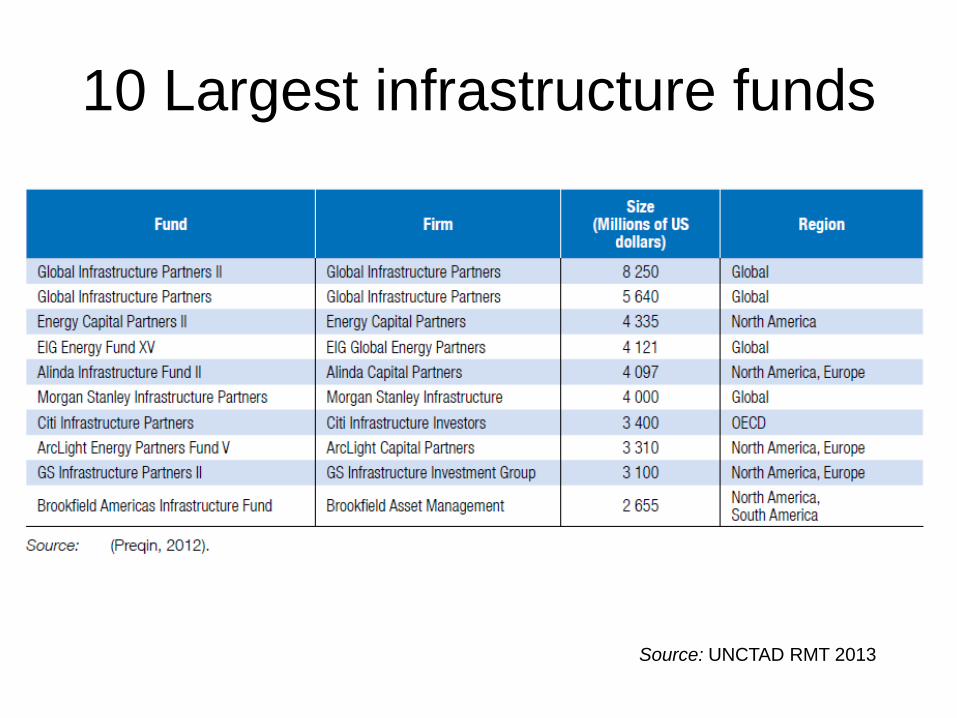
10 Largest infrastructure funds
Source: UNCTAD RMT 2013
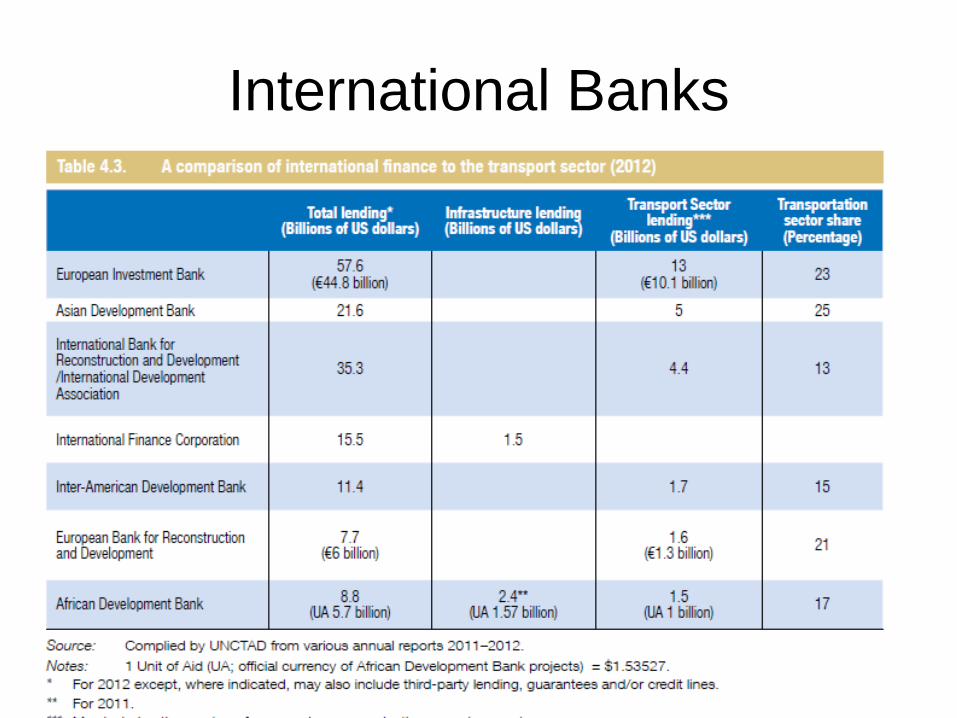
International Banks
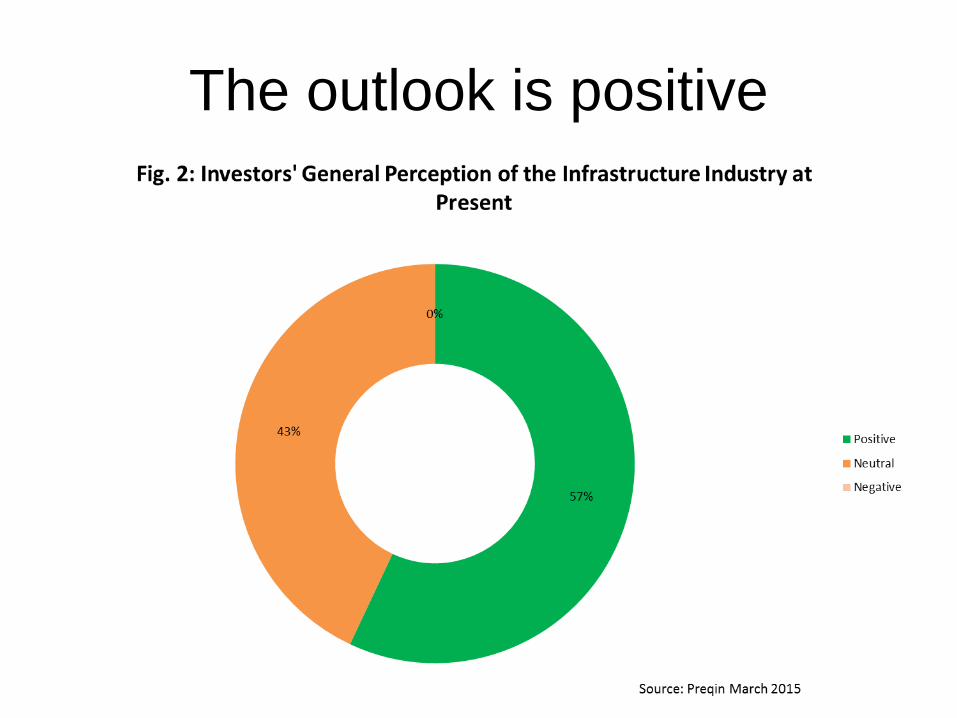
The outlook is positive

Contents
• 1 - International Maritime Trade Overview
– A) Demand
– B) Supply
– C) Freight costs
• 2 - Infrastructure investment
• 3 - Operational efficiency

Opperational Efficiency

World’s leading ports by productivity (2014)
Port Name Country Berth Productivity1 Jebel Ali United Arab Emirates 138
2 Tianjin China 125
3 Qingdao China 125
4 Nansha China 119
5 Yantian China 117
6 Khor al Fakkan United Arab Emirates 108
7 Ningbo China 107
8 Yokohama Japan 105
9 Busan Republic of Korea 102
10 Shanghai China 101
11 Salalah Oman 99
12 Balboa Panama 97
13 Bremerhaven Germany 92
14 Xiamen China 90
15 Taipei Taiwan, Province of China 89
16 Rotterdam Netherlands 88
17 Mawan China 88
18 Gwangyang Republic of Korea 87
19 Chiwan China 86
20 Colombo Sri Lanka 85
21 Jeddah Saudi Arabia 84
22 Nhava Sheva (Jarwaharlal Nehru) India 84
23 Kaohsiung Taiwan, Province of China 83
24 Dalian China 81
25 Los Angeles United States of America 80
Source: Journal of Commerce Port Productivity Database (data H1 2014) May 2015

World’s leading ports by productivity 2012-14
(Container moves per ship, per hour on all vessel sizes and percentage increase)
Source: UNCTAD Secretariat and the Journal of Commerce Port Productivity Database May 2015
Port Country
2012 Berth
Productivity
2013 Berth
Productivity
2014 Berth
Productivity
Percentage
increase
2013/2012
Percentage
increase
2014/2013
Jebel Ali United Arab Emirates 81 119 138 47% 16%
Tianjin China 86 130 125 51% -4%
Qingdao China 96 126 125 31% -1%
Nansha China 73 104 119 42% 14%
Yantian China 78 106 117 36% 10%
Khor al Fakkan United Arab Emirates 74 119 108 61% -9%
Ningbo China 88 120 107 36% -11%
Yokohama Japan 85 108 105 27% -3%
Busan South Korea 80 105 102 31% -3%
Xiamen China 76 106 90 39% -15%
Tianjin - Intra port competition/collaboration - APMT, CHMI, COSCO
Pacific, CSX World Terminals OCCL, PSA and DPW

Top global terminals berth
productivity 2014(Container moves per ship, per hour on all vessel sizes)
Terminal Port County Berth Productivity
APM Terminals Yokohama Yokohama Japan 180
Tianjin Port Pacific International Tianjin China 144
DP World-Jebel Ali Terminal Jebel Ali United Arab Emirates 138
Qingdao Qianwan Qingdao China 136
Tianjin Port Alliance International Tianjin China 132
Ningbo Beilun (Second) Ningbo China 127
Guangzhou South China Oceangate Nansha China 122
Busan Newport Co Ltd Busan Republic of Korea 119
Yantian International Yantian China 117
Nansha Phase I Nansha China 117
Source: Journal of Commerce Port Productivity Database 2015

Collaboration in Terminal
Operations
Source: Drewry, Global Terminal Operators
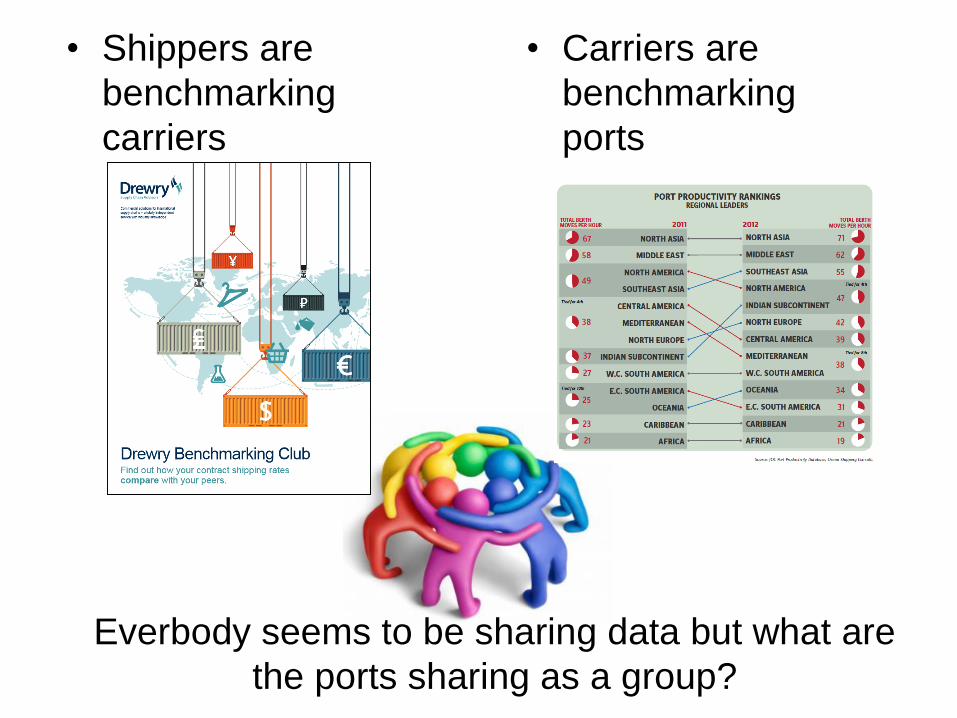
Everbody seems to be sharing data but what are
the ports sharing as a group?
• Shippers are
benchmarking
carriers
• Carriers are
benchmarking
ports

THANK YOU
REVIEW OF MARITIME TRANSPORT -
WWW.UNCTAD.ORG/RMT
Dr. Vincent F. VALENTINE
Division on Technology and Logistics
UNCTAD
Palais des Nations
1211 Geneva, Switzerland
Tel. +41 22 917 2041
Fax +41 22 917 0050
http://unctad.org/rmt