International Management Journals · International Management Journals ... This may have led to the...
17
International Management Journals www.managementjournals.com www.managementjournals.com International Journal of Applied Management Volume 2 Issue 3 Social Skills Differences Among CPA Firm Personnel of Different Cultures: An Exploratory Study Using FIRO-B Mohamed E. Bayou Professor of Accounting, School of Management, University of Michigan-Dearborn Philip Siegel Professor of Accounting, College of Charleston James Smith Department of Management, College of Business, University of Washington ISSN 1742-2590
Transcript of International Management Journals · International Management Journals ... This may have led to the...

International Management Journals
www.managementjournals.com
www.managementjournals.com
International Journal of Applied ManagementVolume 2 Issue 3
Social Skills Differences Among CPA Firm Personnel of Different Cultures:
An Exploratory Study Using FIRO-B
Mohamed E. BayouProfessor of Accounting, School of Management, University of Michigan-Dearborn
Philip SiegelProfessor of Accounting, College of Charleston
James SmithDepartment of Management, College of Business, University of Washington
ISSN 1742-2590
International Journal of Applied Management: Volume 2 Issue 3
Abstract This study examines the social interaction preferences of international accounting personnel and compares these preferences to those of national (U.S) firm personnel. Understanding the differences between preferences for social interaction is important because such information sheds light on the types of personnel who are more likely to succeed in the different work environments. Thompson and Schutz’s (2000) FIRO-B instrument was used to collect social interaction preference data from international accounting firm personnel. The goal is to better understand the interrelationship between preferences for social interaction and work environments. The tasks undertaken in accounting firms require a set of social skills which may vary across cultures. The findings showed that CPA firms’ employees with North-American heritage and those with non-American heritage significantly differ in their wanted inclusion, control and affection. The findings may explain that these differences are due to the emphasis on individualism in the west versus the dominance of the family, the tribe and the state in some Asian and African cultures that shape one’s preferences for social interactions. These findings have important implications for the strategic assignments of individuals from different cultures to the appropriate functions in the CPA firms, the role of the employees in participating in team projects and for helping educators to advise their students to pursue employment positions commensurate with their social skills.
Introduction Research on professional service organizations suggests that it is important to know whether individuals entering, or continuing in, professions have the personality characteristics that fit the kind of work that they do (Holland, 1985, Schloemer &Schloemer, 1997). This research takes on increasing significance since business entities of all types are facing more demanding economic environments characterized by accelerating global competition, rapid turnover of company personnel and reduced levels of corporate hierarchy (Kleinman, et. al, 2002). These complexities generate a need to rapidly integrate newly-hired personnel into the organization to assure that the entering workers can quickly contribute to the firm’s success. This integration is also important for employees’ job satisfaction; since public accounting work often requires frequent contact with clients and other professionals (Poznanski and Bline, 1997), individuals who enjoy such contacts should have an easier time working in the public accounting environment than others. Several studies found that professionals from different cultures have significantly different behavioral characteristics that may have materially influenced their performances (Yamamura, et al. 2004; Chow et al. 2002; Salter and Sharp 2001; Siegel and Smith, 2003). Chow et al. (2002) find cultural factors have an important impact on employee turnover and individual performance. The study concludes that cultural differences help to explain differences in the relative magnitude of errors made by auditors. Further, Kim et al. (2003) argue that people-based modes are generally more effective than formalization-based modes in coordinating and controlling business functions worldwide. Therefore, it is essential for CPA firms’ success and their personnel’s job satisfaction to understand their employees’ social-
www.managementjournals.com Page 1

International Journal of Applied Management: Volume 2 Issue 3
behavioral traits so that they can assign them to functions commensurate with their social skills. This paper examines social interaction traits of individuals from different cultures in order to better understand the interrelationship between their preferences for social interaction and work environments. The first section reviews the literature on the relationship between culture, social skills and performance. The second section explains the nature of FIRO-B methodology in measuring social interaction traits. To closely study their traits, the third section explores the differences between CPA personnel with North-American heritage and those with non-American heritage in a sample of 158 CPA firms’ employees. Finally, a summary and conclusions are presented.
The Relationships Among Social Skills, Culture and Performance Increasing internationalization in business creates a need to focus on the interpersonal skills requisite to manage and work across national borders. Chow, et al. (2002), examining the organizational cultures of U.S.-affiliated international accounting firms, finds cultural differences influencing organizational behavior. Similarly, Salter and Sharp (2001) conclude that even relatively small cultural differences such as those existing between the United States and Canada do matter. Siegel et al. (1997) also found differences in cultural responses to ethical codes not only between the United States and the more closed societies of Hong Kong, Singapore and Taiwan, but also between the United States and Canada. Yamamura, et al. (2004) found that Japanese accountants place higher value on job satisfaction than their American and Australian counterparts. Understanding the effect of congruence of personality characteristics and social skills on the work milieu is important since the mismatch of personality and social skill leads to poor professional performance, job dissatisfaction and high turnover (Scarborough, 1993; Kleinman, This issue becomes more pronounced when considering international cultural differences. Van der Stede (2003) finds that organizational cultures of multinational business units converge with those of the parent company. This implies that management should select and retain those individuals who can best adapt to the organization’s corporate culture. Prior studies suggest that certain personality characteristics and social skill qualities are most successful in CPA firms (Siegel, et al., 2001; Schloemer and Schloemer, 1997; Satava, 1996; Jacoby, 1981). Firms tend to hire and promote employees that they feel will best fit into their unique work environment (Dean et. al. 1988, Ahadiat and Smith, 1994, Pasewark and Strawser, 1996, and Poznanski and Bline, 1997). Understanding the effect of culture on shaping one’s social skills can help educators orient their students toward areas where they can realize their greatest potential. The AICPA (1999) argues that personal competencies are important in achieving success in the accounting field. As Siegel and Smith (2003) argue, knowledge of the personality makeup of successful accounting personnel, as measured by the desire to engage in social interaction, may serve as a variable in assisting professors to encourage individuals who have a proclivity for sociability to study accounting. Restructuring of accounting education might be required to attract new students to accounting coming from diverse cultures who potentially have the strong personal and interpersonal skills needed to succeed in this discipline (Wheeler, 2001). CPA firms could be better informed to hire those that they believe will best fit into their
www.managementjournals.com Page 2
International Journal of Applied Management: Volume 2 Issue 3
work environment. After entry into the firms, these selection processes continue on a more informed basis as individuals choose whether to remain in the firm, and firms choose whether to foster the individual's career within the firm (Kleinman and Palmon, 2000).
Social Skills in Accounting Firms Previous studies that examined the personality characteristics of individuals in accounting firms used either the Myers-Briggs Type Indicator (MBTI) or the Fundamental Interpersonal Relationship Orientation-Behavior (FIRO-B). Some of these studies also examined social-skill differences between large and local CPA firms (Schloemer and Schloemer, 1997; Satava, 1996; Otte, 1984). The studies that used the MBTI did not find conclusive results regarding personality differences between accounting professionals. Wheeler (2001) found that personality types of professional accountants do not differ over time, firm size, work settings and locations. However, differences in needs amongst people in different settings and individual self-selection into compatible work environments indicate that the personality and need structures of accountants will frequently differ between work settings (Wheeler, 2001). Personality characteristics may not be effective predictors of performance because they may neither be related to the CPA firms’ productivity nor to selection processes. This may have led to the inconclusive results. Using a better measure may serve as a better predictor of performance. This study examines the presence, or absence, of different personality characteristics among, and between, accountants from different cultural backgrounds. The behavioral characteristics of interest are the interpersonal orientation of accountants working in CPA firms. The current study seeks to find whether there are significant differences in social characteristics among individuals with different cultural backgrounds. Having such information could enable prospective or current employees to better understand how well they fit in with their current work environment, as well as to enable employers to have better insight into which personality constellation is most appropriate for their work task, and perhaps foster a more satisfied work force that is less likely to leave. The goal is to study interpersonal orientation in work settings within public accounting that provides a better understanding of accounting professionals who might succeed within different work environments. To accomplish this goal, we develop several hypotheses concerning interpersonal orientation on cultural differences within the international CPA firms. The FIRO-B instrument has been used to measure these differences. The characteristics of the FIRO-B instrument are explained below.
www.managementjournals.com Page 3

International Journal of Applied Management: Volume 2 Issue 3
The Nature of FIRO-B The FIRO-B theory of personality was developed by Schutz in 1958. However, the theory has undergone significant changes and expansions including the nature of the research instrument (Schutz, 1992; 1994; Thompson and Schutz, 2000). The theory states that to account for interpersonal behavior, three basic interpersonal needs–inclusion, control and affection–must be studied. In addition, there are two manifestations of the three interpersonal needs–expressed and wanted. People desire to express the need toward others and want from others aspects of the three interpersonal needs. A basic assumption of the model is that all individuals seek to establish compatible relationships with others in their social interactions. Individuals strive for compatible relationships in inclusion, control and affection to avoid stress and frustration in order to satisfy their needs (Whetten & Cameron, 1988; Thompson and Schutz, 2000). The FIOR-B inclusion refers to a person’s general social orientation and need for interaction and belonging. When maintaining relationships with other people, there is a need to be included in their activities or to include them in one’s activities. To a degree, people seek to belong to a group; however, there is also a need to be left alone. Individuals vary in the strength of the need for inclusion and the associated level of comfort. Their need to include or show interest in others is termed “expressed inclusion.” “Wanted inclusion” refers to the need to be included by others (i.e. to gain acceptance). At the extremities, “under social” people are introverted and withdrawn, and “over social” people are extroverted, narcissistic and superficial. Schutz (1966) stated that inclusion refers to an individual’s feelings of self-worth, i.e. a need to feel worthwhile and respected. “Under social” individuals generally feel socially abandoned, uninvolved, and uncommitted. “Over social” people seek to focus attention on themselves, to be prominent, to be listened to, and to be noticed as a way of increasing their self-worth. The second behavioral area is control, which refers to the need for power and influence. This need includes maintaining a satisfactory balance of power and influence in relationships. All individuals need to demonstrate leadership or to control others to some extent. The FIRO-B model refers to this need as “expressed control.” In addition, individuals also have a wanted control need. To some extent, they want to be controlled or guided by others. Even though individuals want freedom and individuality, there is a need for varying degrees of expressed and wanted control. Affection, the third behavioral area, includes the need for intimacy and friendship. Affection includes the need for intimacy and love, i.e., the need to feel close to others. Affection need not include physical or romantic relationships. Individuals need to express affection toward other individuals but also they need to maintain distance. They want affection or liking expressed toward them; however, these needs often vary in strength. Schutz (1966) developed the FIRO-B instrument in order to measure interpersonal orientation. The instrument uses scores ranging from 0 to 9 for expressed and wanted needs for each of the three behavioral areas -- inclusion, control and affection. The total score can range from 0 to 54, which is the Social Interaction Index (SII). The SII measures the overall interpersonal need. The higher the score, the higher the overall interpersonal need.
www.managementjournals.com Page 4

International Journal of Applied Management: Volume 2 Issue 3
Thompson (1998) observes that the FIRO-B has been elevated in status by practitioners. He describes the FIRO-B's advantages in working with teams, team leaders, and executives. Thompson found that the FIRO-B can provide insights with regard to individual interactions, team dynamics, team member compatibility, team development, team effectiveness, and team member satisfaction. Schutz (1994) has extensively revised and improved this method, resulting in a much more powerful and accurate FIRO-B instrument. To understand the wide acceptability of this instrument, the following section reviews some of the published studies on FIRO-B validity and application.
FIRO-B Studies The FIRO-B theory has been widely used. Schutz (1966) applies the FIRO-B instrument to over 6,000 individuals from the educational community, by which he found that the theory is valid and reliable. Lifton (1975) also provides detailed information on the validity and reliability of the FIRO-B instrument. The theory was then applied to (a) organize the major theories of family therapy (Doherty & Colangelo, 1984), and (b) classify approaches to decision-making (Schutz, 1987). The reliability of the FIRO-B scales is excellent and has evidenced stability over time (Lifton, 1975). Lifton's (1975) review of FIRO-B studies of various populations shows that the "scales provide useful information concerning the nature of interpersonal relationships." Fisher et al. (1995) note that the FIRO-B model has been popular with professionals almost since its inception. McRae and Young (1990) find no significant gender differences for the FIRO-B, with reported SII scores for Canadian undergraduate business male and female students of 21.33 and 25.68, respectively. Kubes’ (1992) study of research and development professionals reports significant correlations of interpersonal needs with adaptation/innovation scores as measured by the Kirton Adaptation-Innovation (KAI). The SII in Kubes’ study was 30.54, with no significant gender differences. Goldberg (2000) finds that in the new, fast paced team-oriented environment, executives can no longer rely on history of success but rather need to understand the pattern of social interaction in order to establish more collaborative organizational structures. Siegel, et al. (2001) find that the Big 6 CPA firms had, on average, lower social index indicator scores than the national average. These scores, however, were higher than those of prior studies that focused on undergraduate accounting and business students. In contrast to most prior studies, they found significant gender differences in interpersonal orientation. In a later study, Siegel and Smith (2003) report that CPA professionals at regional firms had different social interaction score indices than those employed at international CPA firms. The personality trait of “warmth” also received some attention in the literature. Wiedmann, et al. (1979) suggest that the inclusion and affection scores added together measure general warmth. Fisher et al.'s (1995) study of software creation teams supports Wiedmann, et al.'s general warmth construct. The results of this study suggest that the FIRO-B assesses what Fisher et al. labeled “group warmth.” Such warmth has implications for managing teams. Since auditors usually work in a team setting, the warmth construct is considered in the current study. Therefore, our research study seeks to shed additional light on the interpersonal orientation differences, or lack of same, among CPA professionals coming from different cultural backgrounds.
www.managementjournals.com Page 5
International Journal of Applied Management: Volume 2 Issue 3
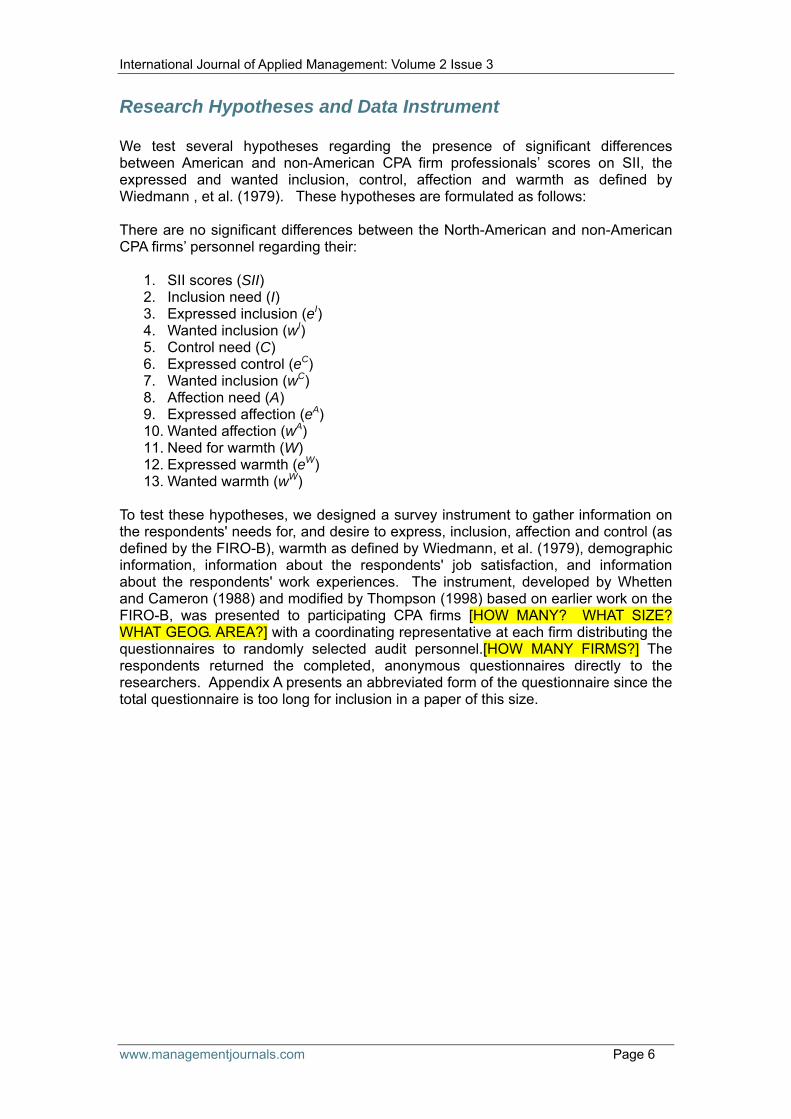
Research Hypotheses and Data Instrument We test several hypotheses regarding the presence of significant differences between American and non-American CPA firm professionals’ scores on SII, the expressed and wanted inclusion, control, affection and warmth as defined by Wiedmann , et al. (1979). These hypotheses are formulated as follows: There are no significant differences between the North-American and non-American CPA firms’ personnel regarding their:
1. SII scores (SII) 2. Inclusion need (I) 3. Expressed inclusion (eI) 4. Wanted inclusion (wI) 5. Control need (C) 6. Expressed control (eC) 7. Wanted inclusion (wC) 8. Affection need (A) 9. Expressed affection (eA) 10. Wanted affection (wA) 11. Need for warmth (W) 12. Expressed warmth (eW) 13. Wanted warmth (wW)
To test these hypotheses, we designed a survey instrument to gather information on the respondents' needs for, and desire to express, inclusion, affection and control (as defined by the FIRO-B), warmth as defined by Wiedmann, et al. (1979), demographic information, information about the respondents' job satisfaction, and information about the respondents' work experiences. The instrument, developed by Whetten and Cameron (1988) and modified by Thompson (1998) based on earlier work on the FIRO-B, was presented to participating CPA firms [HOW MANY? WHAT SIZE? WHAT GEOG. AREA?] with a coordinating representative at each firm distributing the questionnaires to randomly selected audit personnel.[HOW MANY FIRMS?] The respondents returned the completed, anonymous questionnaires directly to the researchers. Appendix A presents an abbreviated form of the questionnaire since the total questionnaire is too long for inclusion in a paper of this size.
www.managementjournals.com Page 6

International Journal of Applied Management: Volume 2 Issue 3
Analysis of Results Table 1 provides a profile of the respondents. All of the respondents, except one, are undergraduate students. Since the respondents with non-American heritage came from eight different cultures and the numbers of respondents in each of these cultures are small, we grouped them into two groups: North Americans (Group A) and Non-Americans (Group B). The A group and B group consist of 97 and 61 respondents, with average ages of 22.11 and 22.07 and having accumulated on average 109.82 and 105.43 credit hours, respectively.
TABLE 1 Respondents’ Profile
Group A Group B N Average Age Gender: Male Female Average number of credit hours taken Heritage:1 North American Non-American
97 22.11
46 51
109.82
97
61 22.07
25 36
105.43
61
1. The number of respondents in the eight Non-American cultures are as follows: Western Europe 7; Africa 4; Between Mid East and Far East 7; Australia 0; South America 1; Eastern Europe 3; the Middle East 1; Far East 25; and Pacific Islands 13.
TABLE 2 FIRO-B Results for Testing the 13 Hypotheses
(t-test)
Group A Group B p-value SII Inclusion: Expressed Inclusion Wanted Inclusion Total Inclusion Control: Expressed Control Wanted Control Total Control Affection: Expressed Affection Wanted Affection Total Affection
26.88
4.76 4.96 9.72
4.65 3.11 7.76
4.53 4.87 9.40
25.52
4.77 3.87 8.64
4.44 3.77 8.21
4.56 4.56 4.11
.408
.977 .047** .171
.646 .087* .484
.945 .093* .354
www.managementjournals.com Page 7

International Journal of Applied Management: Volume 2 Issue 3
Warmth: Expressed Warmth Wanted Warmth Total Warmth
9.29 9.83 19.12
9.33 7.98 17.31
.952 .090* .202
** Difference is significant at .05 level (2-tailed). * Difference is significant at .10 level (2-tailed). Table 2 shows the results of testing the 13 hypotheses using the t-test. The first hypothesis on SII score was not rejected indicating that the two groups, A and B, do not differ in their overall need for social interactions. However, they differ significantly in some of the components of SII. We find significant differences at α = .05 between the two groups regarding their need for wanted inclusion. The North-American group has a higher need for wanted inclusion than the non-American group (4.96 vs. 3.87) (Table 2). This means that the A group is more social than the B group (Schutz, 1966, p. 60). Significant differences at α = .10 also exist between Groups A and B regarding wanted affection (4.87 vs. 4.56) and wanted warmth (9.83 vs. 7.98) (Table 2). However, Group B has (at α = .10) a significantly higher need for wanted control than Group A (3.77 vs. 3.11) (Table 2). One reason for this behavior is that family ties and friendship are stronger in the former group (Chow et al. 2002). That is, respondents from such regions as the Far East, the Pacific Islands and Africa may have less need for wanted affection and wanted warmth from coworkers at the place of work because they can satisfy these needs from their stronger family ties and closer friendships when compared with North Americans.
www.managementjournals.com Page 8
International Journal of Applied Management: Volume 2 Issue 3
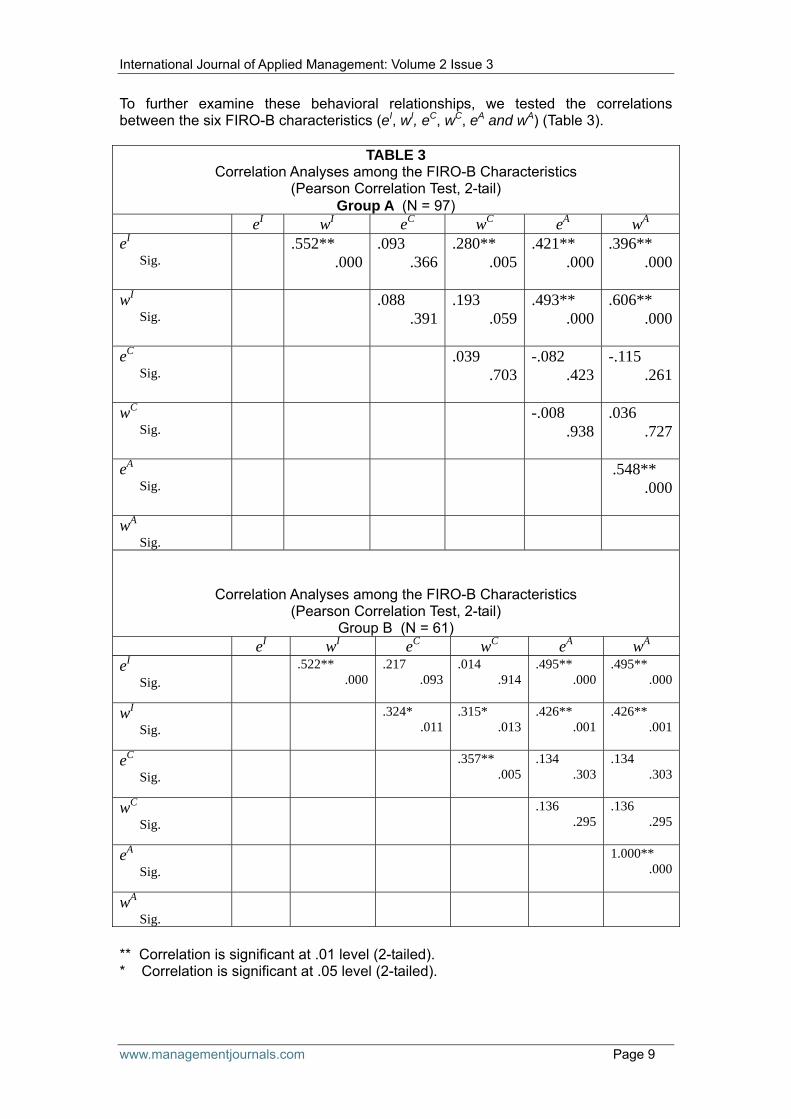
To further examine these behavioral relationships, we tested the correlations between the six FIRO-B characteristics (eI, wI, eC, wC, eA and wA) (Table 3).
TABLE 3 Correlation Analyses among the FIRO-B Characteristics
(Pearson Correlation Test, 2-tail) Group A (N = 97)
eI wI eC wC eA wA
eI Sig.
.552** .000
.093 .366
.280** .005
.421** .000
.396** .000
wI Sig.
.088 .391
.193 .059
.493** .000
.606** .000
eC Sig.
.039 .703
-.082 .423
-.115 .261
wC Sig.
-.008 .938
.036 .727
eA Sig.
.548** .000
wA Sig.
Correlation Analyses among the FIRO-B Characteristics (Pearson Correlation Test, 2-tail)
Group B (N = 61) eI wI eC wC eA wA
eI Sig.
.522** .000
.217 .093
.014 .914
.495** .000
.495** .000
wI Sig.
.324* .011
.315* .013
.426** .001
.426** .001
eC Sig.
.357** .005
.134 .303
.134 .303
wC Sig.
.136 .295
.136 .295
eA Sig.
1.000** .000
wA Sig.
** Correlation is significant at .01 level (2-tailed). * Correlation is significant at .05 level (2-tailed).
www.managementjournals.com Page 9

International Journal of Applied Management: Volume 2 Issue 3
Table 3 shows significant correlations between e and w for inclusion and affection (.552 and .548, respectively) for Group A. Table 3 also shows significant correlations between e and w for inclusion, control and affection (.522, .357 and 1.00, respectively) for Group B. These significant correlations indicate that how one expresses herself or himself in the inclusion and affection areas is similar to how one prefers to be acted toward (Schutz, 1966, p. 80). This is not the case for the control area for Group A. Respondents with American heritage have a clear difference between how they prefer to control others and how they would like to be controlled (Table 3). Group A’s eC and wC of 4.65 and 3.11, respectively (Table 2) indicate that they are autocrat/rebellious individuals (Schutz, 1966, p. 60). That is, they often seek to influence (dominate) others; yet they usually resist others attempting to dominate them. This behavior may reflect the general emphasis on individualism and the individual’s autonomy in the North-American culture as compared with the dominance of the family, the tribe or the state often at the expense of the individual’s autonomy in some other cultures. We also tested the correlations between e and w of the general “warmth” as defined by Wiedemann, et al. (1979) of each group. Using the Pearson test, we found a significant correlation at α = .01 for the two Groups A and B (.662 and .610, respectively). This indicates that how the members of each group prefer to express their warmth to others is similar to how they would like others to show their warmth toward them. However, Table 2 shows significant differences in the e and w of the warmth variable between the two groups. While on average the North-American group would like to receive more than they give warmth to others, the non-American group shows the opposite behavior: they would rather receive less warmth than they express toward others. Again, this may reflect the stronger family ties in other cultures from which the members of these cultures receive more satisfaction of their need for warmth than from coworkers at the place of work.
www.managementjournals.com Page 10

International Journal of Applied Management: Volume 2 Issue 3
Summary and Conclusions One major question that this study seeks to address is whether there are social interaction preference differences between North-American and non-American personnel of CPA firms. This question is important because in today’s team-oriented environment, CPA firm personnel are in frequent contact with clients and other professionals. In recruiting and assigning personnel, understanding interpersonal orientation is an important factor because those disposed toward a high amount of interpersonal contact will generally find the frequent contact to be easier as compared to those not so disposed. We used FIRO-B as developed by Thompson and Schutz (2000) to examine the three inter-social characteristics of inclusion, control and affection along with their expressed and wanted dimensions. For each group, we also studied the general “warmth,” defined by Wiedemann, et al. (1979) as the sum of inclusion and affection. While the two groups’ SII scores do not differ significantly, we found significant differences in some of the components of SII. We found significant differences between the two groups regarding their wanted inclusion, control, affection and warmth. Individuals with North-American heritage have greater needs for wanted inclusion, wanted affection and wanted warmth; however, they have less need for wanted control. While both groups showed more expressed control than wanted control, the North-American group’s need for wanted control is less than that of the non-American group. This difference in behavior between the two groups reflects the differences between North American and other cultures. Individuals from some Asian and African cultures often satisfy their wanted inclusion, affection and warmth from their stronger family ties. In turn, they may have greater need for wanted control from their families, tribes or the state for social and economic support. In comparison, the North-American culture generally places more emphasis on the autonomy of the individual and self-dependence. These findings suggest that the North-American professionals may show better accomplishments in situations with less control, e.g., team projects with open-end questions or non-structured brainstorming format that allows free thinking and autonomous decision making, provided that the participants are individually credited for their contribution. Some individuals from other cultures where family ties are strong may excel in well-structured team projects where the credit for accomplishments is awarded to the team as a whole. The findings have also implications for accounting education. Student advisors and instructors can direct their students toward areas where they can maximize their potential and work in environments fitting their social-interaction skills.
www.managementjournals.com Page 11
International Journal of Applied Management: Volume 2 Issue 3
References Ahadiat, N., and K. J. Smith. (1994). “A Factor-Analytic Investigation of Employee Selection Factors of Significance to Recruiters of Entry-Level Accountants.” Issues in Accounting Education 9(1): 59-79. American Institute of Certified Public Accountants (AICPA). (1999). AICPA core competency framework for entry into the accounting profession. Available at: http://www.aicpa.org/edu/corecomp.htm on November 26, 2001. Chow, C., Harrison, G., McKinnon, J. and Wu, A. (2002). “The organizational culture of public accounting firm: evidence form Taiwanese local and us affiliated firms," Accounting, Organizations and Society, 27: 347-360. Doherty, W. J., and N. Colangelo. (1984). “The family FIRO model: A modest proposal for organizing family treatment.” Journal of Marital and Family Therapy 10: 19-29. Fisher, S. G., W. Macrossen, and C. A. Walker. (1995). “FIRO-B: The poser of love and the love of power.” Psychological Reports 76: 195-206. Greg, C. (1999). “Someone to look up to.” Journal of Accountancy 188 (November): 89-93. Goldberg, R.A. (2000). "Aware of the wheel, a study on executive team development," Leadership and Organization Development Journal, 21(5); 225-238. Holland, J. L. (1985). Making Vocational Choices: A Theory of Vocational Personalities & Work Environments. Second Edition. Englewood Cliffs, NJ: Prentice-Hall, Inc. Jacoby, P. F. (1981). “Psychological types and career success in the accounting profession.” Research in Psychological Types 4: 24-37. Kim, K., Park, J.H. and Prescott, J.E. (2003). "The global integration of business functions" a study of multinational businesses in global integration, Journal of International Business Studies, Vol 34(4), pp 327-348. Kleinman, G. and D. Palmon. (2000). Understanding Auditor-Client Relationships: A Multi-Faceted Analysis. Princeton, NJ: Markus Weiner Publishers, Inc. Kleinman, g, Siegel, P. and Eckstein, C. (2002) "Teams as a learning forum for accounting professionals," Journal of Management Development, 2002, 21(6): 427-460. Kubes, M. (1992). “Cognitive style and interpersonal behavior: The Kirton Adaptation-Innovation and Schutz’s FIRO-B inventories.” Psychology-A Journal of Human Behavior 29: 33-38. Lifton, P. E. (1975). “FIRO-B scales.” In O. K. Buros. Social Studies Tests and Reviews. Highland Park, NJ: Gryphon Press. McRae, L., and J. Young. (1990). “Field independence and the FIRO-B.” Perceptual and Motor Skills 70: 493-494.
www.managementjournals.com Page 12

International Journal of Applied Management: Volume 2 Issue 3
Milliken, F. J., and L. L. Martins. (1996). “Searching for Common Threads: Understanding the Multiple Effects of Diversity in Organizations and Groups.” Academy of Management Review 21(2): 402- 433. Otte, P. J. (1984). “Do CPAs have a unique personality: Are certain personality types found more frequently in our profession?” Michigan CPA, Spring: 29-36. Pasewark, W. R., and Strawser, J. R. (1996). “Determinants and outcomes associated with job insecurity in a professional accounting environment.” Behavioral Research in Accounting, 8: 91-113. Ponemon, L. A. (1992). “Ethical reasoning and selection socialization in accounting.” Accounting, Organizations and Society 17(3/4): 239-258. Poznanski, P. and Bline, D. (1997). “Using structural equation modeling to investigate the casual ordering of job satisfaction and organizational commitment among staff accountants.” Behavioral Research in Accounting, 9:154-178. Satava, D. (1996). “Personality types of CPAs: national versus local firms.” Journal of Psychological Type, 36: 36-41. Scarborough, D. P. (1993). Personality types and job satisfaction of accountants. Journal of Psychological Type, 25: 3-10. Schloemer, P. G., and M. S. Schloemer. (1997). “The personality types and preferences of CPA firm professionals: An analysis of changes in the profession.” Accounting Horizons 11 (December) (4): 24-39. Schutz, W. C. (1958). FIRO: A Three Dimensional Theory of Interpersonal Behavior. New York, NY: Holt, Rinehart and Winston. ___________, (1966). The FIRO Scales Manual. Palo Alto, CA: Consulting Psychologists Press. ___________, (1987). Concordance: Decision Making. Mill Valley, CA: WAS. ___________. (1992). "Beyond FIRO-B: Three New Theory Derived Measures, Element B: Behavior, Element F: Feelings, Element S: Self.” Psychological Reports, June, 70, 915-937. ___________. (1994). The Human Element: Productivity, Self-Esteem and the Bottom Line. San Francisco, CA: Jossey-Bass. Siegel, P. H., Smith, J. W., and Mosca, J. B. (2001). “Mentoring relationships and interpersonal orientation.” The Leadership & Organizational Development Journal, 22(3): 114-126. ____________________. (2003). "CPA personal preferences for social interaction: an examination using the FIRO-B.” Journal for Business and Entrepreneurship, 15(2): 77-96.
www.managementjournals.com Page 13

International Journal of Applied Management: Volume 2 Issue 3
_________, Omer, K. and Karim, K. (1997). "The role of the code of ethics for the internal auditing profession: an international perspective," Research in Accounting Regulation, (10): 115-128. Slater, S, and Sharp, D. (2001). "Agency effects and escalation of commitment: Do small national culture differences matter?" The International Journal of Accounting, 36(1): 33-56. Thompson, H. (1998). “Using the FIRO-B and MBTI.” Management & Organization Development 21 (4): 18-20. ___________ & Schutz, W. (2000). FIRO Element B Organizational Interpretive Report. Watkinsville, GA: High Performing Systems, Inc. Van der Stede, W. A. (2003). "The effect of national culture on management control and incentive system design in multi-business firms: evidence of intracorporate isomorphism.” European Accounting Review, 12(2): 263-285. Wheeler, P. (2001). “The Myers-Briggs Type indicator and applications to accounting education and research.” Issues in Accounting Education, 16(1): 125-150. Whetten, D., and K. Cameron. (1988). Developing Management Skills. Glenview, IL: Scott, Foresman and Company. Wiedmann, C., S. Waxenberg, and L. C. Mona. (1979). “Factor analysis of FIRO-B and FIRO-F.” Small Group Behavior 10: 49-61. Yamamaura, J., Stedman, Y. E. and Satoh, M. (2004). "Accountants in Japan: culture, organizational factors and job satisfaction." International Journal of Accounting, Auditing and Performance Evaluation, 1(1): 85-103.
www.managementjournals.com Page 14
International Journal of Applied Management: Volume 2 Issue 3
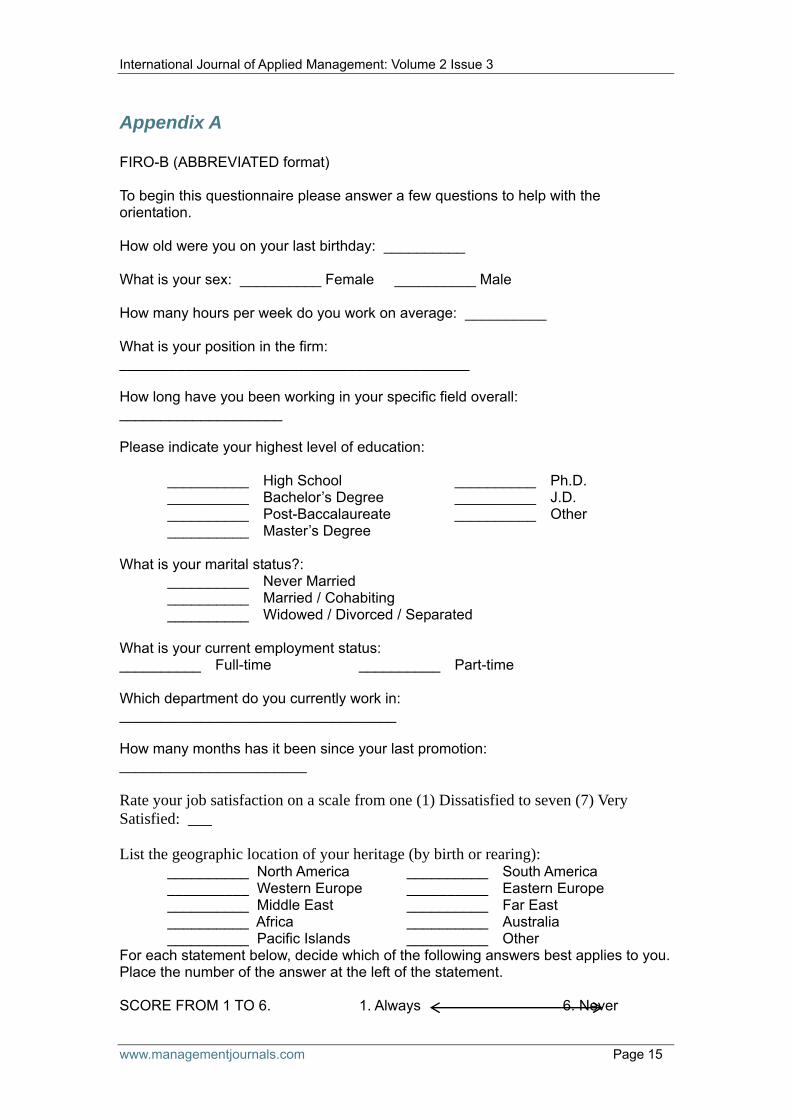
Appendix A FIRO-B (ABBREVIATED format) To begin this questionnaire please answer a few questions to help with the orientation. How old were you on your last birthday: __________ What is your sex: __________ Female __________ Male How many hours per week do you work on average: __________ What is your position in the firm: ___________________________________________ How long have you been working in your specific field overall: ____________________ Please indicate your highest level of education: __________ High School __________ Ph.D. __________ Bachelor’s Degree __________ J.D. __________ Post-Baccalaureate __________ Other __________ Master’s Degree What is your marital status?: __________ Never Married
__________ Married / Cohabiting __________ Widowed / Divorced / Separated What is your current employment status: __________ Full-time __________ Part-time Which department do you currently work in: __________________________________ How many months has it been since your last promotion: _______________________ Rate your job satisfaction on a scale from one (1) Dissatisfied to seven (7) Very Satisfied: ___ List the geographic location of your heritage (by birth or rearing): __________ North America __________ South America __________ Western Europe __________ Eastern Europe __________ Middle East __________ Far East __________ Africa __________ Australia __________ Pacific Islands __________ Other For each statement below, decide which of the following answers best applies to you. Place the number of the answer at the left of the statement. SCORE FROM 1 TO 6. 1. Always 6. Never
www.managementjournals.com Page 15

International Journal of Applied Management: Volume 2 Issue 3
__________ I try to be with people. __________ I let other people decide what to do. __________ I join social groups. __________ I try to have close relationships with people. __________ I tend to join social organizations when I have an opportunity. __________ I let other people strongly influence my actions. __________ I try to be included in informal social activities. __________ I try to have close, personal relationships with people. __________ I try to include other people in my plans. __________ I let other people control my actions. __________ I try to have people around me. __________ I try to get close and personal with people. __________ When people are doing things together I tend to join them. __________ I am easily led by people. __________ I try to avoid being alone. __________ I try to participate in group activities. __________ I like people to invite me to things. __________ I like people to act close and personal with me. __________ I try to influence strongly other people’s actions. __________ I like people to invite me to join in their activities. __________ I like people to act close toward me. __________ I try to take charge of things when I am with people. __________ I like people to include me in their activities. __________ I like people to act cool and distant toward me. __________ I try to have other people do things the way I want them done. __________ I like people to ask me to participate in their discussions. __________ I like people to act friendly toward me. __________ I like people to invite me to participate in their activities. __________ I like people to act distant toward me.
www.managementjournals.com Page 16