INTERNATIONAL JOURNAL OF PHARMACEUTICAL … 735.pdf · Research Article CODEN: IJPRNK IMPACT FACTOR...
13
Research Article CODEN: IJPRNK IMPACT FACTOR : 4.278 ISSN: 2277-8713 Patel BM, IJPRBS, 2014; Volume 3(4): 1-13 IJPRBS Available Online at www.ijprbs.com 1 ANALYTICAL METHOD DEVELOPMENT AND VALIDATION FOR SIMULTANEOUS DETERMINATION OF TIMOLOL MALEATE AND PILOCARPINE NITRATE IN COMBINED PHARMACEUTICAL DOSAGE FORM PATEL BM, SOLANKI SD Quality assurance department, K.B. Raval College of pharmacy, Kasturinagar, Ghandhinagar, Gujrat, India Accepted Date: 23/06/2014; Published Date: 27/08/2014 Abstract: A simple and precise one UV-spectrophotometric and one RP-HPLC methods have been developed for the simultaneous determination of Timolol Maleate and Pilocarpine Nitrate in combined pharmaceutical dosage form. The UV spectrophotometric method was a determination using the Absorbance Ratio method at 239nm (isoabsortive point) and 217nm (ƛmax of pilo) over the concentration range 2-10 μg/ml and 8-40 μg/ml for Timolol Maleate and Pilocarpine Nitrate respectively. The mean recoveries obtained for Timolol Maleate and Pilocarpine Nitrate were in the range of 98.25-101.66 % and 99.34-101.25 %. In RP-HPLC analysis is carried out using Phosphate Buffer: ACN (60:40), adjusted pH-4.5 with 1% H 3 PO 4 as the mobile phase at a flow rate of 1ml/min and Purospher® RP-C18 (4.6 mm i.d×250 mm) column as stationery phase with detection wavelength of 239 nm. Linearity was obtained in the concentration range of 2-10 and 8-40 μg/ml for Timolol Maleate and Pilocarpine Nitrate respectively. The retention time was found to be 3.467 and 6.807 min for Timolol Maleate and Pilocarpine Nitrate. The mean recoveries obtained for Timolol Maleate and Pilocarpine Nitrate were in the range of 98.60-100.27% and 98.83-100.80%. The developed method has been statistically validated according to ICH guidelines and found to be simple, precise and accurate with the prescribed values. Thus the proposed method was successfully applied for the determination of Timolol Maleate and Pilocarpine Nitrate in routine quality control analysis in bulk and its formulations. Keywords: Timolol Maleate, Pilocarpine Nitrate, RP-HPLC, Absorbance Ratio method INTERNATIONAL JOURNAL OF PHARMACEUTICAL RESEARCH AND BIO-SCIENCE PAPER-QR CODE Corresponding Author: MS. BHOOMIKA M. PATEL Access Online On: www.ijprbs.com How to Cite This Article: Patel BM, Solanki SD; IJPRBS, 2014; Volume 3(4): 1-13
Transcript of INTERNATIONAL JOURNAL OF PHARMACEUTICAL … 735.pdf · Research Article CODEN: IJPRNK IMPACT FACTOR...

Research Article CODEN: IJPRNK IMPACT FACTOR : 4.278 ISSN: 2277-8713 Patel BM, IJPRBS, 2014; Volume 3(4): 1-13 IJPRBS
Available Online at www.ijprbs.com 1
ANALYTICAL METHOD DEVELOPMENT AND VALIDATION FOR SIMULTANEOUS DETERMINATION OF TIMOLOL MALEATE AND PILOCARPINE NITRATE IN
COMBINED PHARMACEUTICAL DOSAGE FORM PATEL BM, SOLANKI SD
Quality assurance department, K.B. Raval College of pharmacy, Kasturinagar, Ghandhinagar, Gujrat, India
Accepted Date: 23/06/2014; Published Date: 27/08/2014
Abstract: A simple and precise one UV-spectrophotometric and one RP-HPLC methods have been developed for the simultaneous determination of Timolol Maleate and Pilocarpine Nitrate in combined pharmaceutical dosage form. The UV spectrophotometric method was a determination using the Absorbance Ratio method at 239nm (isoabsortive point) and 217nm (ƛmax of pilo) over the concentration range 2-10 µg/ml and 8-40 µg/ml for Timolol Maleate and Pilocarpine Nitrate respectively. The mean recoveries obtained for Timolol Maleate and Pilocarpine Nitrate were in the range of 98.25-101.66 % and 99.34-101.25 %. In RP-HPLC analysis is carried out using Phosphate Buffer: ACN (60:40), adjusted pH-4.5 with 1% H3PO4 as the mobile phase at a flow rate of 1ml/min and Purospher® RP-C18 (4.6 mm i.d×250 mm) column as stationery phase with detection wavelength of 239 nm. Linearity was obtained in the concentration range of 2-10 and 8-40 μg/ml for Timolol Maleate and Pilocarpine Nitrate respectively. The retention time was found to be 3.467 and 6.807 min for Timolol Maleate and Pilocarpine Nitrate. The mean recoveries obtained for Timolol Maleate and Pilocarpine Nitrate were in the range of 98.60-100.27% and 98.83-100.80%. The developed method has been statistically validated according to ICH guidelines and found to be simple, precise and accurate with the prescribed values. Thus the proposed method was successfully applied for the determination of Timolol Maleate and Pilocarpine Nitrate in routine quality control analysis in bulk and its formulations. Keywords: Timolol Maleate, Pilocarpine Nitrate, RP-HPLC, Absorbance Ratio method
INTERNATIONAL JOURNAL OF
PHARMACEUTICAL RESEARCH AND BIO-SCIENCE
PAPER-QR CODE
Corresponding Author: MS. BHOOMIKA M. PATEL
Access Online On:
www.ijprbs.com
How to Cite This Article:
Patel BM, Solanki SD; IJPRBS, 2014; Volume 3(4): 1-13

Research Article CODEN: IJPRNK IMPACT FACTOR : 4.278 ISSN: 2277-8713 Patel BM, IJPRBS, 2014; Volume 3(4): 1-13 IJPRBS
Available Online at www.ijprbs.com 2
INTRODUCTION
Timolol Maleate (TIMO), chemically is (S)-1-tert-butylamino-3-(4-morpholino-1,2,5-thiadiazol-3-
yloxy}propane-2-ol hydrogen maleate. It is non selective beta-adrenergic antagonist used in
open-angle glaucoma. Pilocarpine Nitrate (PILO), chemically is (3S,4R)-3-ethyl-4-[(1-methyl-1H-
imidazol-5-yl)methyl]oxolan-2-one. It is non selective muscarinic receptor used in treatment of
chronic and acute closure angle glaucoma. TIMO and PILO is official in IP, BP and USP. These
two drugs are marketed as combined dose Eye Drop formulation in the ratio of 25:100 mg
(TIMO: PILO). Literature survey revealed that a number of methods have been reported for
determination of TIMO and PILO individually or in combination with other drugs. but no
method has been reported for this combination drugs. Objective of this study is to develop a
Simple, fast and precise method for simultaneous determination of Timolol Maleate and
Pilocarpine Nitrate by RP-HPLC and UV spectroscopy method.
Fig1: Structure of Timolol Maleate
Fig2: Structure of Pilocarpine Nitrate
Materials and Methods
Instrumentation:
For UV-spectrophotometric method Double beam UV-visible spectrophotometer (Shimadzu,
model 1800) having two matched quartz cells with 1 cm light path was used. For RP-HPLC
method Young Lin, YL 9100 HPLC systems, YL9110 Quaternary solvent delivery Pump, YL9160

Research Article CODEN: IJPRNK IMPACT FACTOR : 4.278 ISSN: 2277-8713 Patel BM, IJPRBS, 2014; Volume 3(4): 1-13 IJPRBS
Available Online at www.ijprbs.com 3
Photodiode array (PDA) detector, Purospher® RP-C18 Column (5μm) with Young Lin software
for data processing was used.
Materials
Standard gift sample of TIMO was received from Zydus cadila healthcare Ltd. Ahmedabad, PILO
as gift sample as from Intas Pharmaceuticals Ltd, Ahmedabad. Combined dose Eye Drop
formulation, Sun Pharmaceutical ltd containing TIMO (25mg), PILO (100mg) was purchased
from a local pharmacy Store. Methanol used for UV-spectrophotometric method was of AR
grade. TEA (Merck Chemicals, India), Water (Rankem Ltd. Ahmedabad, India) used in RP-HPLC
were of HPLC grade.
Procedure
Preparation of standard stock solution
Accurately weighed 10mg TIMO and 10mg PILO was transferred in to different two 10ml
volumetric flask and dissolved in methanol and dilute upto the mark with methanol to give a
stock solution having concentration of 1 mg/ml (1000µg/ml). Accurately measured 1ml of
above two Stock solutions was transferred in to different two 10 ml volumetric flask and diluted
to the mark with methanol to obtain a working standard solution (100µg/ml) of Timolol
Maleate and Pilocarpine Nitrate.
Absorbance Ratio method (Method A)
In absorbance ratio method (method A), for the selection of analytical wavelength, solutions of
TIMO (4 µg/ml) and PILO (16 µg/ml) were prepared separately by appropriate dilution of above
standard stock solution and scanned in the spectrum mode from 200 to 400 nm. From the
overlay spectra of these drugs [Figure 3], wavelengths 239 nm (isoabsorbtive point) and 217 nm
(λmax of PILO) were selected for analysis. The calibration curves for TIMO and PILO were
prepared in the concentration range of 2-10 µg/ml and 8-40 µg/ml, respectively at the selected
wavelengths. The absorbance’s were measured at the selected wavelengths.. The absorbance
and absorptivity values were substituted in the following equation to obtain the
concentrations:
CX = [(QM – Qy) / (QX –QY)] × A1/ax1........... (3) CY = (A1/ax1) – CX ………………………… (4) Where,
CX and CY were the concentration of Atenolol and Chlorthalidone in sample solution
respectively.
QM = (absorbance of sample solution at 217 nm) / (absorbance of sample solution at 239 nm)

Research Article CODEN: IJPRNK IMPACT FACTOR : 4.278 ISSN: 2277-8713 Patel BM, IJPRBS, 2014; Volume 3(4): 1-13 IJPRBS
Available Online at www.ijprbs.com 4
QX = (absorptivity value of Timolol at 217 nm) / (absorptivity value of Timolo at 239 nm)
Qy = (absorptivity value of Pilocarpine at 217 nm) / (absorptivity value of Pilocarpine at 239 nm)
A1 was the absorbance of sample solution at 239 nm.
ax1 = absorptivity value of Timolo at 239 nm.
Validation parameter (1)
The proposed methods were validated as per ICH guidelines.
Linearity
Linearity is expressed in terms of correlation co-efficient of linear regression analysis. The
linearity response was determined by analyzing 5 independent levels of calibration curve in the
range of 2-10μg/ml for Timolol Maleate and 8-40µg/ml for Pilocarpine Nitrate at 239nm and
217 nm for absorbance ratio method. The calibration curve of absorbance vs. concentration
was plotted and correlation coefficient and regression line equations for Timolol Maleate and
Pilocarpine Nitrate were determined. (Table 3)
Precision (Repeatability)
For Repeatability, it was carried out by preparing 6 replicates of 6 same concentrations, within
the linearity range and measuring the absorbance of each solution on the same day. % RSD (%
relative standard deviation) was calculated. The %RSD values were found to be below 2% which
indicate that the proposed methods are repeatable (Table 3).
Intermediate precision (Reproducibility)
The intermediate precision for the proposed method was determined by estimating standard
solution of TIMO (4, 6, 8 μg/ml) and PILO (16, 24, 32 μg/ml) for three times on the same day
(intraday) and on three different days (interday). The results are reported in terms of relative
standard deviation (RSD). The RSD values were found to be below 2% which indicate that the
proposed methods are reproducible (Table 3)
Accuracy
The accuracy of the method was determined by calculating recoveries of TIMO and PILO by the
standard addition method. Known amount of standard of TIMO and PILO (80%, 100%, and
120%) were added to the sample solutions of eye drop forms. The amounts of TIMO and PILO
were estimated by regression equation. The results are shown in (Table 9). The values prove
that the method is accurate. (Table 1)

Research Article CODEN: IJPRNK IMPACT FACTOR : 4.278 ISSN: 2277-8713 Patel BM, IJPRBS, 2014; Volume 3(4): 1-13 IJPRBS
Available Online at www.ijprbs.com 5
Limit of detection (LOD) and limit of quantification (LOQ)
The LOD and LOQ of TIMO and PILO were determined by using standard deviation of the
response and slope approach as defined in International Conference on Harmonization (ICH)
guidelines. The LOD and LOQ data are presented in (Table 3).
Analysis of eye drop formulation
It was tested by analysis of commercially available marketed formulation. To Take a 1 ml of
liquid containg 5 mg Timolol Maleate and 25 mg of Pilocarpine Nitratet was transferred to 10
ml volumetric Flask then the volume was made up to the mark with methanol to get 100 μg/ml
concentration. Shaking was carried out for 5 min. then solution was filtered through whatman
filter paper. From the 100μg/ml of sample solution take 1.6ml of solution and further diluted up
to the mark in 10ml volumetric flask to get 16μg/ml. So the final solution was made which
contains 16μg/ml Pilocarpine Nitrate and 4μg/ml Timolol Maleate both. The solution was
scanned from 400-200 nm. The concentration of both TIMO and PILO were determined by
measuring absorbance of sample solution at 239 nm & 217 nm and using equations (1) and (2).
Amount of TIMO and PILO in mg/drop was then calculated. Results of eye drop analysis are
shown in (Table 2).
RP-HPLC (Method B)
Chromatographic conditions: Preliminary studies were conducted and trails are made for the
method development. Separation and analysis was carried out on Purospher® RP-C18 column
(4.6 x 250mm), 5µ particle size. The optimized mobile phase consisting of Phosphate Buffer:
ACN (60:40 v/v/), adjusted pH 4.5 with 1% H3PO4and filtered through 0.45 µm membrane filter
using vacuum pump. Flow rate was maintained at 1 ml/min and run time for 10 min, prior to
sample injection, column was saturated with mobile phase for 40 min and injection volume was
20 µl injected by auto sampler. The detection response was measured at 239 nm and
maintained at ambient temperature.
Preparation of optimized mobile phase: Take one 500 ml volumetric flask, washed with
distilled water and then methanol (AR Grade) then dried it in oven at 60˚C for 20-25 min. ACN
and Buffer pH-4.5 filtered through 0.45μm Chrom Tech Nylon-66 filter paper. After filteration it
was sonicated for 20min on ultrasonicator. pH- 4.5 adjusted with 1% H3PO4 in 500 ml
volumetric flask.
Preparation of standard stock solution: same as UV spectroscopy method.
Validation Parameter (1)
Linearity and Range

Research Article CODEN: IJPRNK IMPACT FACTOR : 4.278 ISSN: 2277-8713 Patel BM, IJPRBS, 2014; Volume 3(4): 1-13 IJPRBS
Available Online at www.ijprbs.com 6
The linearity response was determined by analyzing 5 independent levels of Calibration curve in
the range of 2-10 μg/ml and 8-40 μg/ml for TIMO and PILO Respectively. Plot the calibration
curve of Area versus respective concentration and Find out correlation co-efficient and
regression line equation for TIMO and PILO. (Table 7)
Precision (Repeatability)
For Repeatability, it was carried out by preparing 6 replicates of 6 same concentrations, within
the linearity range and measuring the Peak area of each solution on the same day. % RSD (%
relative standard deviation) was calculated. The %RSD values were found to be below 2% which
indicate that the proposed methods are repeatable (Table 7).
Intermediate precision (Reproducibility)
The intermediate precision for the proposed method was determined by estimating standard
solution of TIMO (4, 6, 8 μg/ml) and PILO (16, 24, 32 μg/ml) for three times on the same day
(intraday) and on three different days (interday). The results are reported in terms of relative
standard deviation (RSD). The RSD values were found to be below 2% which indicate that the
proposed methods are reproducible (Table 7).
Accuracy
The accuracy of the method was determined by calculating recoveries of TIMO and PILO by the
standard addition method. Known amount of standard of TIMO and PILO (80%, 100%, and
120%) were added to the sample solutions of eye drop forms. The amounts of TIMO and PILO
were estimated by regression equation. The results are shown in (Table 5).
System suitability
Standard solution was injected six times into system and chromatograms were recorded, % RSD
(relative standard deviation) of retention time & peak area, theoretical plates and tailing factor
were calculated. (Table 4)
Limit of detection (LOD) and limit of quantification (LOQ)
The LOD and LOQ of TIMO and PILO were determined by using standard deviation of the
response and slope approach as defined in International Conference on Harmonization (ICH)
guidelines. The LOD and LOQ data are presented in (Table 7).
Analysis of eye drop formulation
Same as UV Spectroscopy method. (Table 6)

Research Article CODEN: IJPRNK IMPACT FACTOR : 4.278 ISSN: 2277-8713 Patel BM, IJPRBS, 2014; Volume 3(4): 1-13 IJPRBS
Available Online at www.ijprbs.com 7
RESULTS AND DISCUSSION
In Absorbance Ratio method, the linearity range was found to be 2-10μg/ml for TIMO and 8-
40μg/ml for PILO. % Assay was found to be 99.68% and 99.87% for TIMO and PILO respectively.
Percentage recovery for TIMO was 98.25-101.66%, while for PILO it was found to be in range of
99.64-101.25%. LOD and LOQ values were found to be and 0.09 & 0.28 for TIMO and 0.80 &
2.43 for PILO.
In RP-HPLC method was developed and validated. The mobile phase used was Phosphate
Buffer: ACN (60:40 v/v/), adjusted pH 4.5 with 1% H3PO4. The retention time of TIMO and PILO
was found to be 3.467 min and 6.807 min respectively. Linearity range was found to be 2-10
μg/ml for TIMO and 8-40 μg/ml for PILO. % Assay was found to be 99.50% and 98.25% for TIMO
and PILO respectively. Percentage recovery for TIMO was 98.60-100.27%, while for PILO, it was
found to be in range of 98.83-100.80 %. LOD and LOQ values were found to be for 0.084 & 0.25
TIMO and 0.70 & 2.12 for PILO.
TABLES AND FIGURES
For method A:
Fig3: Overlay spectra of TIMO (4μg/ml) and PILO (16 μg/ml) for Absorbance Ratio method

Research Article CODEN: IJPRNK IMPACT FACTOR : 4.278 ISSN: 2277-8713 Patel BM, IJPRBS, 2014; Volume 3(4): 1-13 IJPRBS
Available Online at www.ijprbs.com 8
Fig4: Calibration curve of standard TIMO at 239nm
Fig5: Calibration curve of standard TIMO at 217nm
Fig6: Calibration curve of standard PILO at 239nm
0.021
0.0315
0.0418
0.0535
0.0628
y = 0.005x + 0.010 R² = 0.999
0
0.01
0.02
0.03
0.04
0.05
0.06
0.07
0 2 4 6 8 10 12
0.051
0.107
0.157
0.212 0.253
y = 0.025x + 0.003 R² = 0.997
0
0.05
0.1
0.15
0.2
0.25
0.3
0 5 10 15
0.021
0.0315
0.0418
0.0535
0.0628
y = 0.001x + 0.010 R² = 0.999
0
0.01
0.02
0.03
0.04
0.05
0.06
0.07
0 5 10 15
Abs
Con µg/ml

Research Article CODEN: IJPRNK IMPACT FACTOR : 4.278 ISSN: 2277-8713 Patel BM, IJPRBS, 2014; Volume 3(4): 1-13 IJPRBS
Available Online at www.ijprbs.com 9
Fig7: Calibration curve of standard PILO at 217nm
Table 1: Recovery studies data.
Drugs % Level
Amount of drug taken
(μg/ml)
Amount of std. drug added
(μg/ml)
Mean amount found (μg/ml).
% Recovery
0 4 0 3.93 98.25 TIMO 80 4 3.2 7.32 101.66
100 4 4 7.98 99.75 120 4 4.8 8.72 99.09
0 16 0 16.20 101.25 PILO 80 16 12.8 28.61 99.34
100 16 16 32.27 100.84 120 16 19.2 35.11 99.74
Table 2: Assay of Eye Drop formulation.
Table 3: Summary of validation parameter of Absorbance Ratio method.
Parameters
TIMO PILO
239nm 217nm 239nm 217nm
Linearity and range(µg/ml) 2-10 2-10 8-40 8-40 Accuracy 98.25-101.66% 99.34-101.25%
0.3902 0.564
0.7724
0.9577 1.1145
y = 0.023x + 0.207 R² = 0.998
0
0.2
0.4
0.6
0.8
1
1.2
0 20 40 60
Abs
Con µg/ml
Tablet Formulation Drug Label claim (mg) Amount found (mg) % Amount found
Timolet plus
Eye Drop 5 ml
Timolol Maleate
25 24.92 99.68
Pilocarpine Nitrate
100 99.87 99.87

Research Article CODEN: IJPRNK IMPACT FACTOR : 4.278 ISSN: 2277-8713 Patel BM, IJPRBS, 2014; Volume 3(4): 1-13 IJPRBS
Available Online at www.ijprbs.com 10
(Recovery %) (n=3) Precision (%RSD) Intra-day (n=3) 0.23-0.37 0.47-1.28 0.23-0.37 0.12-0.35 Inter-day (n=3) 0.47-0.63 0.94-1.92 0.47-0.63 0.26-0.53
Repeatability (n=6) 0.51 0.98 0.78 0.23 LOD (μg/ml) 0.09 0.80 LOQ (μg/ml) 0.28 2.43
Assay % (n=3) 99.68 99.87
For method B
Fig 8: HPLC chromatogram of TIMO (4µg/ml) and PILO(16 µg/ml)
Fig 9: Calibration curve of standard TIMO
495743
954493
1445652
1925583
2354018
y = 234381x + 28806 R² = 0.9998
0
500000
1000000
1500000
2000000
2500000
0 2 4 6 8 10 12
Area(µV.S
)
Con µg/ml
TIMO
O PILO
Research Article CODEN: IJPRNK IMPACT FACTOR : 4.278 ISSN: 2277-8713 Patel BM, IJPRBS, 2014; Volume 3(4): 1-13 IJPRBS
Available Online at www.ijprbs.com 11
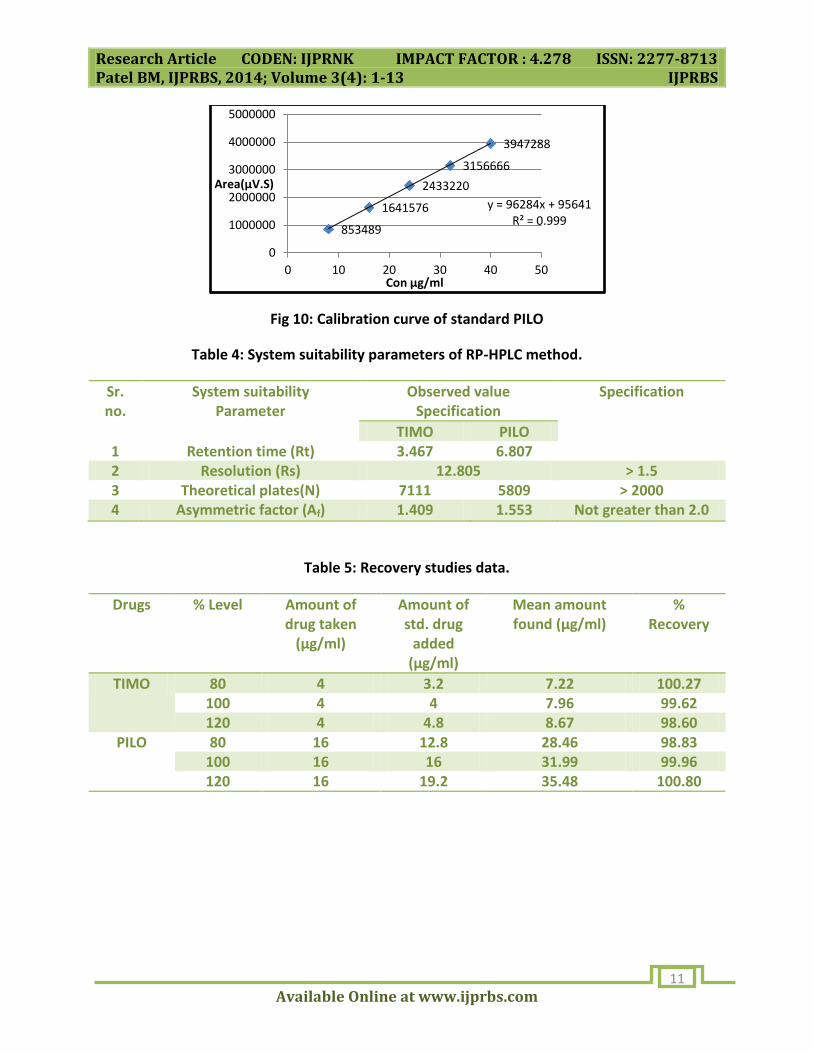
Fig 10: Calibration curve of standard PILO
Table 4: System suitability parameters of RP-HPLC method.
Sr. no.
System suitability Parameter
Observed value Specification
Specification
TIMO PILO 1 Retention time (Rt) 3.467 6.807 2 Resolution (Rs) 12.805 > 1.5 3 Theoretical plates(N) 7111 5809 > 2000 4 Asymmetric factor (Af) 1.409 1.553 Not greater than 2.0
Table 5: Recovery studies data.
Drugs % Level
Amount of drug taken
(μg/ml)
Amount of std. drug
added (μg/ml)
Mean amount found (μg/ml)
% Recovery
TIMO 80 4 3.2 7.22 100.27 100 4 4 7.96 99.62 120 4 4.8 8.67 98.60
PILO 80 16 12.8 28.46 98.83 100 16 16 31.99 99.96 120 16 19.2 35.48 100.80
853489
1641576
2433220
3156666
3947288
y = 96284x + 95641 R² = 0.999
0
1000000
2000000
3000000
4000000
5000000
0 10 20 30 40 50
Area(µV.S)
Con µg/ml

Research Article CODEN: IJPRNK IMPACT FACTOR : 4.278 ISSN: 2277-8713 Patel BM, IJPRBS, 2014; Volume 3(4): 1-13 IJPRBS
Available Online at www.ijprbs.com 12
Table 6: Assay of Eye Drop formulation
Table 7: Summary of validation parameter of RP-HPLC method.
Parameters TIMO PILO
Linearity and Range (μg/ml) 2-10 8-40
Accuracy (Recovery %) (n=3)
98.60-100.27 98.83-100.80
Precision (%RSD) Intra-day (n=3) 0.16-0.48 0.46-0.74 Inter-day (n=3) 0.27-0.61 0.70-0.85 Repeatability (n=6) 0.58 0.66 LOD (μg/ml) 0.084 0.70 LOQ (μg/ml) 0.25 2.12 Assay % (n=3) 99.50 98.25
LOD = Limit of detction
LOQ = Limit of quantitation
R.S.D = Relative standard deviation
n = Number of determination
REFERENCES
1. ICH Harmonized Tripartite Guideline, “Validation of Analytical Procedure: Text and
Methodology Q2 (R1).” International conference on harmonization, IFPMA Geneva,
Switzerland. 2005.
2. Tripathi KD. Essential of Medical Pharmacology; 9thEdn; Jaypee Brothers medical publishers
Pvt. Ltd., New Delhi, 2001, pp 113.
3. Gilman AG., Hardman JG., and Limbard LE. Goodman and Gilman’s The Pharmacological Basis
of Therapeutics; 10th edition; New York: McGraw Hill, 2001, pp 254, 1824, 1834.
Tablet Formulation Drug Label claim (mg)
Amount found (mg)
% Amount found
Timolet Plus 5 ml
Eye Drop Timolol Maleate
25 24.87 99.50
Pilocarpine Nitrate
100 98.25 98.25

Research Article CODEN: IJPRNK IMPACT FACTOR : 4.278 ISSN: 2277-8713 Patel BM, IJPRBS, 2014; Volume 3(4): 1-13 IJPRBS
Available Online at www.ijprbs.com 13
4. Rang HP., Dale MM., and Ritter JM. Pharmacology; 6th edition; New York: Churchill
Livingston, 2007, pp 324-28.
5. Goyal RK. Elements of pharmacology; 5thedition; CBS publishers, pp 123.
6. Satoskar RS. and Bhandarkar SD. Pharmacology and Pharmacotherapeutics; 20th edition;
2007, pp 280,272.
7. Richard AH. and Pamela CC. Lippincott’s Itiustrated Review; 3th edition; 2008, pp 512.
8. ICH Harmonized Tripartite Guideline, Validation of analytical procedure: text and
methodology Q2 (R1), Nov 2005.
9. Indian Pharmacopoeia, Government of India, ministry of health and family welfare,
Ghaziabad: The Indian Pharmacopoeial commission, 2010, volume 3, pp 2224- 2226.
10. British Pharmacopoeia, London: The Department of health, British Pharmacopoeial
Commission, London; 2013, volume 3, pp 2838, 3459, 3460.
11. United Pharmacopoeia 36, NF 31, United States Pharmacopoeial Convention. Inc. Rockville,
2013, volume 3, pp 5400, 5402, 5403.
12. “Timolol maleate Drug Profile”, December 2013. www.drugbank.ca/Timolol
maleate/DB00373.
13. “Pilocarpine nitrate Drug Profile”, December 2013. www.drugbank.ca/Pilocarpine
nitrate/DB01085.