
Manufacturer of coolers and heat exchangers ... - AKG Gruppe

International Journal of Heat and Mass Transfer 107 (2017) 168–180
Contents lists available at ScienceDirect
International Journal of Heat and Mass Transfer
journal homepage: www.elsevier .com/locate / i jhmt
Investigations into air and refrigerant side heat transfer coefficients offinned-tube CO2 gas coolers
http://dx.doi.org/10.1016/j.ijheatmasstransfer.2016.11.0110017-9310/� 2016 The Authors. Published by Elsevier Ltd.This is an open access article under the CC BY license (http://creativecommons.org/licenses/by/4.0/).
⇑ Corresponding author.E-mail address: [email protected] (S.A. Tassou).
IDewa M.C. Santosa a,b, Baboo L. Gowreesunker a, Savvas A. Tassou a,⇑, Konstantinos M. Tsamos a,Yunting Ge a
aRCUK National Centre for Sustainable Energy Use in Food Chain (CSEF), Brunel University London, Uxbridge, Middlesex UB8 3PH, UKbMechanical Engineering Department, Bali State Polytechnic, Bukit Jimbaran, Kuta selatan, Badung, Bali 80361, Indonesia
a r t i c l e i n f o
Article history:Received 12 July 2016Received in revised form 27 September2016Accepted 2 November 2016Available online 19 November 2016
Keywords:CO2 refrigeration systemsCO2 gas coolersAir side heat transfer coefficientRefrigeration side heat transfer coefficientModellingComputational Fluid Dynamics (CFD)
a b s t r a c t
Gas coolers are heat rejection heat exchangers in vapour compression refrigeration systems that use car-bon dioxide (CO2) as refrigerant. The design of gas coolers has a significant influence on the performanceof CO2 refrigeration systems as it determines to a large extent the gas cooler/condenser pressure and thepower consumption of the system. This paper investigates local refrigerant and air heat transfer coeffi-cients in plain fin-and-tube gas cooler coils using Computational Fluid Dynamics (CFD) modelling. Theaims were to provide insights into the variation of the local heat transfer rates in the coil and determinethe influence of a) design enhancements such as the use of slit fins and b) to develop correlations for over-all refrigerant and air heat transfer coefficients to be used in CO2 refrigeration component and systemmodelling. The results from the model which was validated against experimental measurements showedthat a horizontal slit on the fin between the first and second row of tubes can lead to an increase in theheat rejection rate of the gas cooler by between 6% and 8%. This in turn can lead to smaller heat exchangerheat transfer area for a given heat rejection capacity or lower high side pressure and higher efficiency forthe refrigeration system. The results and heat transfer correlations developed are a valuable resource forresearchers and manufacturers of CO2 and other heat exchanger coils that experience a wide variation inrefrigerant temperature during the gas cooling process.� 2016 The Authors. Published by Elsevier Ltd. This is an openaccess article under the CCBY license (http://
creativecommons.org/licenses/by/4.0/).
1. Introduction
The use of Carbon dioxide (CO2) or R-744 as a refrigerant hasbeen increasing in recent years due to its good thermodynamicproperties, zero Ozone Depletion Potential (ODP) and negligibleGlobal Warming Potential (GWP). CO2 has a relatively low criticaltemperature of 31 �C at a pressure of 72.7 barg. At low ambienttemperatures, CO2 refrigeration systems that reject heat to theambient will operate subcritically, similar to conventional vapourcompression refrigeration systems, whilst at high ambient temper-atures they will operate supercritically with single phase heatrejection to the ambient in the heat exchanger. Because of the sin-gle phase heat rejection the heat exchanger is normally referred toas a gas cooler rather than a condenser. The temperature at whichthe system switches from subcritical to supercritical operationdepends on the design of the heat rejection equipment, operatingconditions and control strategy employed, but in the majority of
cases, this transition takes place at ambient temperatures in therange between 23 �C and 27 �C [1].
Similar to air cooled condensers, air cooled gas coolers arefinned tube heat exchangers with air flowing across the heatexchanger coil between the fins and tubes and the refrigerantthrough the tubes in a cross-counterflow arrangement [2]. Theair side heat transfer coefficient is normally much lower than therefrigerant side heat transfer coefficient and thus, has a significantinfluence on the overall performance of the heat exchanger. Forthis reason, much research has been conducted to improve theair side heat transfer performance of finned tube heat exchangers[3–5]. Influencing design parameters include fin and tube materi-als, fin thickness, surface topology of the fins, and the spacingand dimensions of the tubes and fins, amongst others [6].
In gas coolers, during the gas cooling process, the superheatedCO2 gas undergoes a large temperature reduction and thermophys-ical property changes which lead to large variations in the localheat transfer coefficient. A number of researchers investigatedexperimentally the variation of the heat transfer coefficient ofsupercritical CO2 during the cooling process. These investigations,which were aimed at developing correlations for the heat transfer

Nomenclature
Air-off air-side outlet heat exchanger (�C)Air-on air-side inlet heat exchanger (�C)At heat transfer surface area (m2)barg pressure-gauge (Bar)CFD Computational Fluid DynamicsdP pressure difference (Pa)cp specific heat capacity (J/kg-K)ha air side heat transfer coefficient (W/m2 K)hr refrigerant side heat transfer coefficient (W/m2 K)HTC short for heat transfer coefficientNu Nusselt Number (–)OD outer diameter (mm)P static pressure (Pa)Pr Prandtl Number based on the film temperature (–)_Q heat rejection (W)R-744 CO2 refrigerantReDC Reynolds Number based on collar diameter (–)T temperature (�C)Tbulk bulk temperature (�C)Tfilm film temperature = (Tw + Tbulk)/2
Tw wall temperature (�C)Tpc pseudo critical temperature (�C)u,v,w velocity (m/s)
Greek symbolsq density (kg/m3)D change in respective parametersl dynamic viscosity (N�s/m2)
Subscriptsb bulkref refrigerant (R744)w wallDC collar diameter (m)in inletout outleti inner
ID.M.C. Santosa et al. / International Journal of Heat and Mass Transfer 107 (2017) 168–180 169
coefficient for single horizontal tubes, were carried out for tubes ofdifferent diameters and a range of pressures, temperatures andheat and mass fluxes [7–10]. Across the range of conditions inves-tigated, the correlations were found to predict the heat transferrate with a maximum error of 20% compared to those determinedfrom experimental measurement [9]. The deviation was largelyattributed to the large variation in the refrigerant properties atthe pseudo-critical region. The pseudo critical region is a tempera-ture region above the critical temperature where the specific heatcapacity (cp) and consequently the heat transfer coefficient of CO2
reach maximum values for a given pressure [8].Because of the large number of variables and complex heat
transfer mechanisms involved, a variety of modelling approacheshave been employed to investigate the heat and mass transfer per-formance of gas coolers. In these models, the refrigerant side heattransfer coefficients (HTCs), were invariably determined fromestablished correlations for single phase flow and heat transfer intubes such as those proposed by Gnielinski [16], Pitla et al. [8]and Dang and Hihara [9]. As indicated by Zilio et al. [15] these dif-ferent correlations often predict similar results for CO2 gas coolers.Ge and Cropper [11] developed a distributed model for gas coolerswhich takes into consideration the rapid changes in CO2 tempera-ture and its effect on the local HTC. The model was validatedagainst published experimental data and was shown to predictthe general trend in refrigerant temperature variation in the tubeswith errors less than 2 �C. Sánchez et al. [14] developed a steady-state model for a coaxial water cooled gas-cooler which was shownto predict exit fluid temperatures with errors up to 3 oC comparedwith experimental data. Zilio et al. [15] obtained errors of up to30 �C in the first few tubes of an air-cooled gas cooler where rapidcooling takes place. These errors have been attributed to the use ofaverage values of HTCs [11], both on the refrigerant and air-side ofthe gas cooler.
All above investigators highlighted the importance of employ-ing local values of HTCs in order to adequately represent the gascooler performance. To address this problem, and more accuratelyaccount for the impact of the variation of refrigerant properties inthe pseudo-critical region, two-term heat transfer correlationshave been proposed for the refrigerant HTC [10]. These two termsgenerally refer to the density ratio and the specific heat ratio eval-uated at Tb (bulk temperature) and Tw (wall temperature).
The above discussion demonstrates that the large temperaturechanges and wide variation of CO2 properties in gas cooling coilsrequire that for design optimisation much more detail knowledgeof local conditions in the coil, on both the air and refrigerant sides,and their influence on heat transfer performance is necessary. Fur-thermore, heat transfer between higher temperature tubes at theinlet of the coil, normally in the first row of the heat exchanger,and lower temperature tubes across the continuous plate fins,reduces the overall heat transfer effectiveness of the coil. Anapproach that has been considered to reduce this effect is to intro-duce a slit in the fin between the 1st and 2nd row of tubes in thedirection of refrigerant flow [1,12,13].
Because of the difficulty in obtaining sufficient information onlocal heat transfer conditions from measurements on full-scalegas cooler coils, most investigations to-date have been based onsingle tubes. Although these investigations have led to useful out-puts and knowledge, they did not take into consideration theimpact of local interactions between the refrigerant and air sideon local and overall heat exchanger performance. To consider theseinteractions, this paper uses a combination of experimental inves-tigations and modelling of two gas cooler coils to provide: i) globalcoil performance measurements and CO2 refrigerant temperaturedistribution in the coils and ii) simulation of the heat transfer indifferent segments to establish local heat transfer coefficientsusing CFD. CFD allows data to be obtained for areas difficult toaccess in experimental investigations (such as within pipes or nar-row sections) and avoid the physical disruptions caused by sensors.A number of investigators have used CFD to simulate finned-tubeheat exchangers [21–27] but to the authors’ knowledge no previ-ous investigations on the analysis of heat transfer coefficients ofCO2 gas coolers have been reported in the literature. The resultsin this paper should be of benefit to researchers and designers ofCO2 gas cooler heat exchangers.
2. Experiment investigations and test facilities
The experimental investigations were carried out on two gascooler designs: gas cooler-A (3 row-4 circuit) continuous and slitfin, Fig. 1(a) and gas cooler-B (2 row-2 circuit) continuous and slitfin, Fig. 1(b).
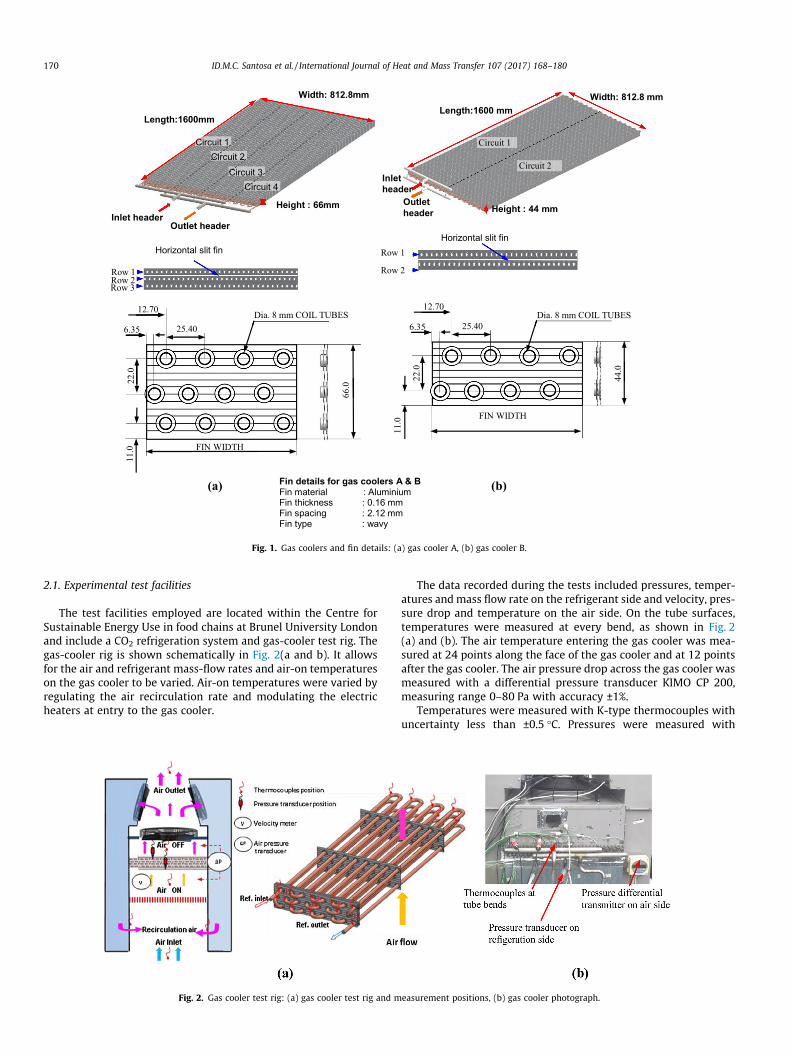
Fig. 1. Gas coolers and fin details: (a) gas cooler A, (b) gas cooler B.
170 ID.M.C. Santosa et al. / International Journal of Heat and Mass Transfer 107 (2017) 168–180
2.1. Experimental test facilities
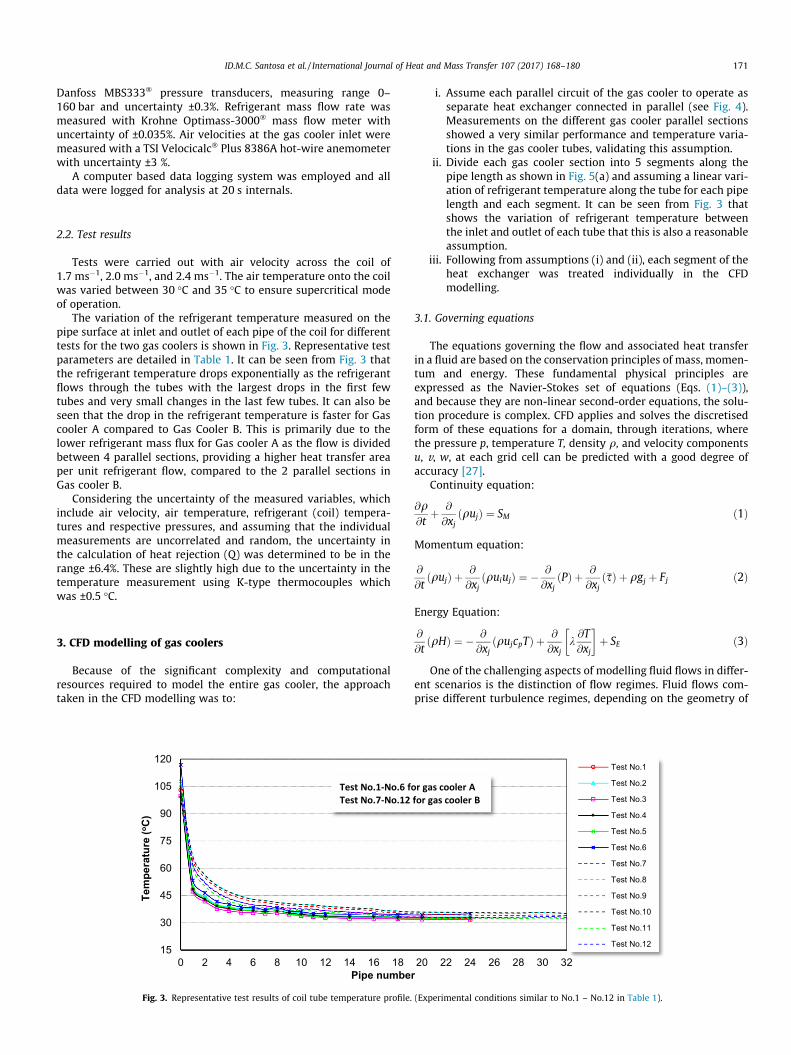
The test facilities employed are located within the Centre forSustainable Energy Use in food chains at Brunel University Londonand include a CO2 refrigeration system and gas-cooler test rig. Thegas-cooler rig is shown schematically in Fig. 2(a and b). It allowsfor the air and refrigerant mass-flow rates and air-on temperatureson the gas cooler to be varied. Air-on temperatures were varied byregulating the air recirculation rate and modulating the electricheaters at entry to the gas cooler.
Fig. 2. Gas cooler test rig: (a) gas cooler test rig and m
The data recorded during the tests included pressures, temper-atures andmass flow rate on the refrigerant side and velocity, pres-sure drop and temperature on the air side. On the tube surfaces,temperatures were measured at every bend, as shown in Fig. 2(a) and (b). The air temperature entering the gas cooler was mea-sured at 24 points along the face of the gas cooler and at 12 pointsafter the gas cooler. The air pressure drop across the gas cooler wasmeasured with a differential pressure transducer KIMO CP 200,measuring range 0–80 Pa with accuracy ±1%.
Temperatures were measured with K-type thermocouples withuncertainty less than ±0.5 �C. Pressures were measured with
easurement positions, (b) gas cooler photograph.
ID.M.C. Santosa et al. / International Journal of Heat and Mass Transfer 107 (2017) 168–180 171
Danfoss MBS333� pressure transducers, measuring range 0–160 bar and uncertainty ±0.3%. Refrigerant mass flow rate wasmeasured with Krohne Optimass-3000� mass flow meter withuncertainty of ±0.035%. Air velocities at the gas cooler inlet weremeasured with a TSI Velocicalc� Plus 8386A hot-wire anemometerwith uncertainty ±3 %.
A computer based data logging system was employed and alldata were logged for analysis at 20 s internals.
2.2. Test results
Tests were carried out with air velocity across the coil of1.7 ms�1, 2.0 ms�1, and 2.4 ms�1. The air temperature onto the coilwas varied between 30 �C and 35 �C to ensure supercritical modeof operation.
The variation of the refrigerant temperature measured on thepipe surface at inlet and outlet of each pipe of the coil for differenttests for the two gas coolers is shown in Fig. 3. Representative testparameters are detailed in Table 1. It can be seen from Fig. 3 thatthe refrigerant temperature drops exponentially as the refrigerantflows through the tubes with the largest drops in the first fewtubes and very small changes in the last few tubes. It can also beseen that the drop in the refrigerant temperature is faster for Gascooler A compared to Gas Cooler B. This is primarily due to thelower refrigerant mass flux for Gas cooler A as the flow is dividedbetween 4 parallel sections, providing a higher heat transfer areaper unit refrigerant flow, compared to the 2 parallel sections inGas cooler B.
Considering the uncertainty of the measured variables, whichinclude air velocity, air temperature, refrigerant (coil) tempera-tures and respective pressures, and assuming that the individualmeasurements are uncorrelated and random, the uncertainty inthe calculation of heat rejection (Q) was determined to be in therange ±6.4%. These are slightly high due to the uncertainty in thetemperature measurement using K-type thermocouples whichwas ±0.5 �C.
3. CFD modelling of gas coolers
Because of the significant complexity and computationalresources required to model the entire gas cooler, the approachtaken in the CFD modelling was to:
Fig. 3. Representative test results of coil tube temperature profile.
i. Assume each parallel circuit of the gas cooler to operate asseparate heat exchanger connected in parallel (see Fig. 4).Measurements on the different gas cooler parallel sectionsshowed a very similar performance and temperature varia-tions in the gas cooler tubes, validating this assumption.
ii. Divide each gas cooler section into 5 segments along thepipe length as shown in Fig. 5(a) and assuming a linear vari-ation of refrigerant temperature along the tube for each pipelength and each segment. It can be seen from Fig. 3 thatshows the variation of refrigerant temperature betweenthe inlet and outlet of each tube that this is also a reasonableassumption.
iii. Following from assumptions (i) and (ii), each segment of theheat exchanger was treated individually in the CFDmodelling.
3.1. Governing equations
The equations governing the flow and associated heat transferin a fluid are based on the conservation principles of mass, momen-tum and energy. These fundamental physical principles areexpressed as the Navier-Stokes set of equations (Eqs. (1)–(3)),and because they are non-linear second-order equations, the solu-tion procedure is complex. CFD applies and solves the discretisedform of these equations for a domain, through iterations, wherethe pressure p, temperature T, density q, and velocity componentsu, v, w, at each grid cell can be predicted with a good degree ofaccuracy [27].
Continuity equation:
@q@t
þ @
@xjðqujÞ ¼ SM ð1Þ
Momentum equation:
@
@tðqujÞ þ @
@xjðquiujÞ ¼ � @
@xjðPÞ þ @
@xjð�sÞ þ qgj þ Fj ð2Þ
Energy Equation:
@
@tðqHÞ ¼ � @
@xjðqujcpTÞ þ @
@xjk@T@xj
� �þ SE ð3Þ
One of the challenging aspects of modelling fluid flows in differ-ent scenarios is the distinction of flow regimes. Fluid flows com-prise different turbulence regimes, depending on the geometry of
(Experimental conditions similar to No.1 – No.12 in Table 1).

Table 1Representative test results for gas coolers A and B with slit fins.
Test v (m/s) Tair on (�C) Pref_in (Bar-g) T ref_in (�C) _mref (kg/s) Tair off (�C) Tref_out (�C) dPair (Pa) Q (kW) ±Q (kW)
Gas cooler ATest No. 1 1.7 32.2 82.8 102.9 0.041 36.2 32.3 24.1 9.4 0.60Test No. 2 1.7 32.8 85.1 105.5 0.042 36.9 33.2 26.6 9.6 0.62Test No. 3 2.0 31.8 81.4 99.7 0.039 35.0 31.8 33.0 8.9 0.57Test No. 4 2.0 32.8 84.2 99.2 0.040 35.9 32.8 34.2 8.9 0.57Test No. 5 2.4 32.4 85.4 107.7 0.038 35.1 32.8 39.5 9.0 0.58Test No. 6 2.4 34.3 86.6 116.8 0.041 37.2 34.9 41.4 9.6 0.61
Gas cooler BTest No. 7 1.7 33.7 84.9 100.3 0.042 37.6 34.0 13.7 8.9 0.56Test No. 8 1.7 35.1 86.3 100.8 0.038 38.7 35.3 13.9 8.2 0.52Test No. 9 2.0 32.6 82.5 100.2 0.039 35.7 32.3 21.5 8.6 0.55Test No. 10 2.0 35.2 86.5 104.6 0.043 38.5 35.0 25.6 9.2 0.58Test No. 11 2.4 32.0 81.5 97.6 0.042 34.9 32.2 27.6 9.2 0.59Test No. 12 2.4 33.0 83.9 101.3 0.042 35.9 33.0 27.6 9.3 0.60
Fig. 4. CFD geometry of gas coolers: (a) gas cooler A with continuous and slit fin, (b) gas cooler B with continuous and slit fin.
Fig. 5. CFD boundary conditions and meshing: (a) segment position along gas cooler, (b) model geometry and boundary conditions, and (c) meshing of geometry.
172 ID.M.C. Santosa et al. / International Journal of Heat and Mass Transfer 107 (2017) 168–180
the heat exchanger and surface topologies. High Reynolds numberflows provide higher heat transfer rates, compared to lower Rey-nolds flows, and is therefore important that the model capturesthe turbulence aspect of the flow. The following section describesthe turbulence models used in previous air-flow studies.
3.2. Turbulence models
The application of CFD in various heat-exchanger design andoptimisation studies has in most cases employed the k-e turbu-lence models [21]. Amongst these, the standard k-e, SST, realizable

ID.M.C. Santosa et al. / International Journal of Heat and Mass Transfer 107 (2017) 168–180 173
k-e and RNG k-e models have been the most popular, but theirchoice has been dependent on the specific heat exchanger beinginvestigated. Singh et al. [23], used CFD to model the steady-state air-side heat transfer of a finned tube heat exchanger. Thenumerical results, using different turbulence models were com-pared with experimental data and the Realizable k-e model wasfound to produce the best predictions with a maximum error of4% [23]. Sun and Zhang [25] also employed the Realizable k-emodelto evaluate the performance of elliptical finned-tube heat exchang-ers. Validation of the CFD model was performed on the predictionof heat transfer coefficients in the heat-exchanger, and maximumerror was found to be 4.7%. The RNG k-e model was employed byBilirgen et al. [26]. to investigate the effects of different fin thick-ness, height, material type and Reynolds number of the air-flowon the performance of finned tube heat exchangers where theair-flow was assumed to be incompressible and steady-state [26].The RNG k-e was also reported to give accurate predictions forthe velocity field, the turbulent kinetic energy and the recirculationlength of flows in helically finned tubes [24].
In general, there is no universal turbulence model for heat-exchangers, because of the wide variation of geometries and flowregimes encountered. As part of this study, different turbulencemodels were investigated, and their validity compared againstexperimental data, in order to determine which turbulence modelis more suitable for the particular heat exchanger designemployed.
3.3. CFD boundary conditions and meshing
The CFD model developed was for finned copper tubes of 8 mmouter-diameter and 0.68 mm wall thickness, and wavy aluminiumfins of 0.16 mm thickness and 2.12 mm air gap between the fins.Simulation was performed for 5 segments along the tubes of thegas cooler, at 0 m; 0.4 m; 0.8 m; 1.2 m; and 1.6 m from the inletof the heat exchanger as shown in Fig. 5(a).
Since the fins are only 0.16 mm thick, the meshing of such athin surface was found to be problematic in terms of the mesh typeand size, especially when considered in the context of the overallgas cooler domain. Hence, the concept of thin-wall shell conduc-tion available in ANSYS FLUENT� [28] was employed. This refersto the simplification of the material heat transfer discretisationto a single node within the thickness, therefore avoiding meshingto very small levels. It allows for a more convenient representationof heat conduction within the fin, for the modelling of finned-tubeheat exchangers as suggested by ANSYS FLUENT� [28].
The boundary conditions used in this study with reference toFig. 5(b) were defined as follows:
- The refrigerant inlet mass flow rate and temperature at inlet toeach tube were input to the model. A linear variation of temper-ature was assumed for the tube segments as shown in Fig. 3.
- The air enters between two fins (y-direction), at a constantvelocity and temperature obtained from the experimental tests(see Table 1).
- The fins and fin collar were modelled as thin-walls.- The thermo-physical properties (density, viscosity, specific heatcapacity, thermal conductivity) of air and refrigerant (R744) as afunction of temperature and pressure were obtained using theEngineering Equation Solver (EES) software [29]. These wereincorporated in FLUENT� using the piecewise-linearformulation.
- The thermo-physical properties of copper and aluminium wereobtained from the FLUENT� database.
The model was meshed using tetrahedral type elements andthree different numbers of cells were tested with respect to the
residual convergence of the models. Using the coarse (1.2 millioncells) and medium (3.2 million cells) grids, the convergence ofresiduals reached minimum at 10�4 for continuity, 10�7 for energy,10�3 for x, y and z, 10�3 for turbulence, whilst the fine grid (4.3million cells) was found to have residuals in the order of 10�5,10�8, 10�6 and 10�4, respectively. Following the satisfactory resid-uals obtained from the fine grid, the latter was used for subsequentsimulations, at the expense of higher computing time compared tothe other mesh sizes. The final mesh is shown in Fig. 5(c), wherebyhigh grid densities have been used in all areas where high temper-ature gradients were more likely to occur at the fin collars and inthe proximity of the tubes.
In addition to having simulations with adequate convergencecriteria, the turbulence model influences the final simulationresults [21]. In this regard, different turbulence models availablein the FLUENT� software were investigated. These turbulencemodels included: Standard, Realizable and Renormalisation Group(RNG) k-e model; Standard and SST k-x models; and the laminarmodel. The numerical results with different turbulence modelswere compared with experimental data, in order to determinethe validity of each turbulence model as explained in followingsection.
3.4. Validation of the CFD model against experimental results
The validation study consisted, firstly of determining the perfor-mance of the turbulence model, and secondly of obtaining theerrors of the model for different test conditions. The validationstudies were conducted with respect to air-off temperature for dif-ferent experimental test conditions. The air-off temperature wasobtained from the mean values of the five simulated segmentsfor each experimental condition. The k-e turbulence models werefound to give better performance with absolute errors in air-offtemperatures as follows: Standard k-e: 0.25 K, RNG k-e: 0.08 K,Realizable k-e: 0.07 K. The k-x models showed slightly worse per-formance (Standard k-x: 0.31 K, and SST k-x: 0.33 K, compared tothe k-e models. The laminar model produced a 1.31 K error. As theRealizable k-e model showed the best performance, it was adoptedfor subsequent simulations.
4. Air and refrigeration side-heat transfer coefficientcalculation methodology
As alluded to in section 1, the heat transfer coefficients of thegas cooler are crucial in determining its overall performance.Unlike previous work, this study does not impose heat transfer cor-relations on the model, but rather, these are calculated implicitly inthe model. Hence, this section depicts the effectiveness of CFD todetermine the heat transfer coefficients.
The air side heat transfer coefficients ha, in each segment for thetube bundles/fin walls are deduced from the heat-transfer rate Q,the heat-transfer surface area At = Acollar + Afins, wall temperaturesTw = (Tcollar + Tfin)/2 and air bulk temperature Tb = (Tin + Tout)/2. Eq.(4) was used for the calculation of the air-side heat transfer coeffi-cient (ha). This equation format was chosen mainly to adhere withthe formulation used in the literature [5].
ha ¼_Q
ðAtÞðTw � TbÞ ðW=m2KÞ ð4Þ
_Q ¼ _mair � Dhair ðWÞ; ð5Þwhere _mair is air mass flow rate and Dhair is enthalpy differencebetween air inlet and outlet
Furthermore, the refrigerant-side heat transfer coefficient (hr)was determined for individual segments using Eq. (6) as follows:

174 ID.M.C. Santosa et al. / International Journal of Heat and Mass Transfer 107 (2017) 168–180
hr ¼Heat fluxref
Wm2
� �Tw;i � Tb
� �K
ð6Þ
where, the heat flux (W/m2) is the heat flux from the refrigerant tothe inner wall surface of the copper tube, Tw,i (�C) is the temperatureof the inner pipe surface (copper), Tb (�C) is the mean refrigerantpipe inlet and outlet temperatures for each segment.
Fig. 6 shows the CFD results for temperature and velocity con-tours for a segment. It shows the wall temperature contours, airflow path-line, and the refrigerant flow vectors of pipe-1 andpipe-2 of the gas cooler, where the refrigerant heat fluxes, walltemperatures, refrigerant and air outlet temperatures were calcu-lated from the model. Based on these results, the air and refrigerantside heat transfer coefficients were calculated for individual seg-ments for the entire gas cooler using Eqs. (4) and (6), respectively.
The CFD results for the gas cooler segments of the two gas cool-ers investigated are shown in Figs. 7(a) and (b). Gas cooler A (24tubes, 3 rows, 4 circuits) is shown in Fig. 8(a); and gas cooler B(32 tubes, 2 rows, 2 circuits) is shown in Fig. 8(b). The investigationof the heat transfer coefficients was performed for one circuit andassumed to be similar for the other circuits, due to the similaritiesin temperatures in the other circuits observed from the test results.
5. Results and discussion
5.1. Air flow characteristics in gas cooler fin and tube passages
The flow characteristics in the heat exchanger flow passages areinfluenced by the tube and fin structures and arrangement. Fig. 9presents the flow characteristics at each row of the gas coolers.As expected, each row has a stagnant area at the rear of each tubein the direction of air flow which reduces heat transfer. Increasingturbulence and reducing this stagnant area will improve the airside heat transfer coefficient [3].
5.2. Air side heat transfer coefficient (ha) profile in segments
The variation of the air side heat transfer coefficient in one cir-cuit of gas cooler A with continuous fins is shown in Fig. 9(a). FromEq. (4), the air side heat transfer is a function of the heat transfer inthe domain between refrigerant and air and the temperature dif-ference between the wall, tube and fins, and the air. It can be seenthat in the third row, ha, is fairly constant at around 150W/m2K,
Fig. 6. CFD post processing at a segme
due to the constant temperature of both air (air on temperature)and refrigerant as can be seen from Fig. 3. In the 2nd row, haincreases until pipe 12 to around 175W/m2K, and then dropsdown to just below 100W/m2K at the start of the first row, pipe8, before rising again slowly just above 100W/m2K in pipe 1. Thesevariations are a function of the relative influence between the rapiddrop in the refrigerant temperature from pipe 1 to pipe 8 and thedifference in temperature between the pipe and fin and the bulk airtemperature.
The variation of the air side heat transfer coefficient for gascooler A with horizontal slit fin is shown in Fig. 9(b). It can be seenthat the slit has a significant influence on the air side heat transferof the second (middle) row of tubes. This is due to the influence ofthe slit on reducing the heat transfer across the fin between thefirst and second row of tubes. Lower fin and tube temperatureslead to higher air side heat transfer coefficients.
The air side heat transfer coefficient, ha, for gas cooler B, contin-uous fin, is shown in Fig. 9(c). It can be seen that (ha) in the secondrow of tubes, 17–32, first increases from around 80W/m2K pipe 32,to around 110W/m2K pipe 24 before dropping back to 85W/m2Kpipe 16. The drop is due to the higher pipe and fin temperaturesin this region and heat transfer from first and second row of tubesacross the fin. In the first row of tubes, pipe 17, ha begins to rise,reaching maximum of around 100 W/m2K at pipe 14 before drop-ping back to 80 W/m2K at pipe 1 due to the very high tube and fintemperatures at refrigerant entry to the gas cooler.
Fig. 9(d) shows the effect of the slit fin. It can be seen that ha inthe second (bottom) row remains relatively constant droppingslightly from 115W/m2K at row 32 to around 110W/m2K at row17 due to the higher pipe and fin temperatures in this region. Inthe first row of tubes, pipe 16, ha, has a low value of 80 W/m2K, ris-ing to 110 W/m2K at pipe 5 before dropping back to 100W/m2K atpipe 1, the refrigerant entry to the heat exchanger.
5.3. Correlation of average air side heat transfer (ha) with ReynoldsNumber (Re)
Based on the results of the local and average air side heat trans-fer coefficients, correlations were developed for the determinationof the air side heat transfer coefficient of gas coolers based on theapproach proposed by Chang and Kim [20], relating the Nusseltnumber to the Reynolds and Prandtl numbers.
nt of fined–tube heat exchanger.
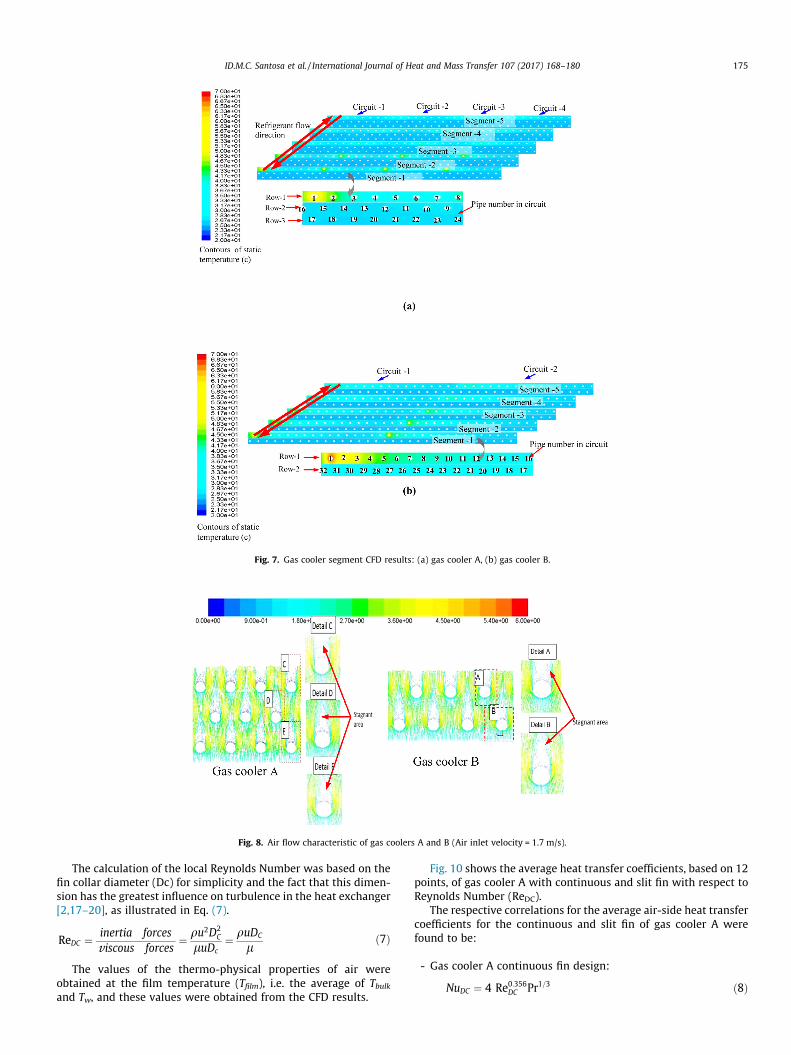
Fig. 7. Gas cooler segment CFD results: (a) gas cooler A, (b) gas cooler B.
Fig. 8. Air flow characteristic of gas coolers A and B (Air inlet velocity = 1.7 m/s).
ID.M.C. Santosa et al. / International Journal of Heat and Mass Transfer 107 (2017) 168–180 175
The calculation of the local Reynolds Number was based on thefin collar diameter (Dc) for simplicity and the fact that this dimen-sion has the greatest influence on turbulence in the heat exchanger[2,17–20], as illustrated in Eq. (7).
ReDC ¼ inertia forcesv iscous forces
¼ qu2D2C
luDc¼ quDC
lð7Þ
The values of the thermo-physical properties of air wereobtained at the film temperature (Tfilm), i.e. the average of Tbulkand Tw, and these values were obtained from the CFD results.
Fig. 10 shows the average heat transfer coefficients, based on 12points, of gas cooler A with continuous and slit fin with respect toReynolds Number (ReDC).
The respective correlations for the average air-side heat transfercoefficients for the continuous and slit fin of gas cooler A werefound to be:
- Gas cooler A continuous fin design:
NuDC ¼ 4 Re0:356DC Pr1=3 ð8Þ
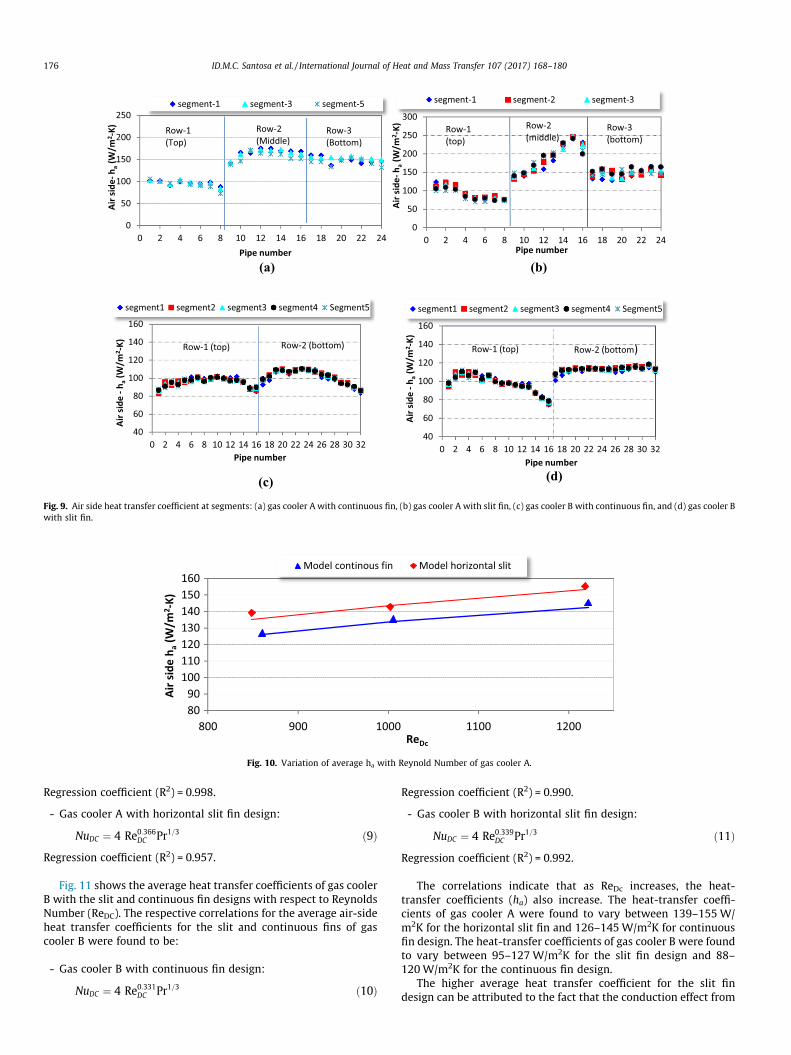
Fig. 9. Air side heat transfer coefficient at segments: (a) gas cooler A with continuous fin, (b) gas cooler A with slit fin, (c) gas cooler B with continuous fin, and (d) gas cooler Bwith slit fin.
Fig. 10. Variation of average ha with Reynold Number of gas cooler A.
176 ID.M.C. Santosa et al. / International Journal of Heat and Mass Transfer 107 (2017) 168–180
Regression coefficient (R2) = 0.998.
- Gas cooler A with horizontal slit fin design:
NuDC ¼ 4 Re0:366DC Pr1=3 ð9Þ
Regression coefficient (R2) = 0.957.Fig. 11 shows the average heat transfer coefficients of gas coolerB with the slit and continuous fin designs with respect to ReynoldsNumber (ReDC). The respective correlations for the average air-sideheat transfer coefficients for the slit and continuous fins of gascooler B were found to be:
- Gas cooler B with continuous fin design:
NuDC ¼ 4 Re0:331DC Pr1=3 ð10Þ
Regression coefficient (R2) = 0.990.
- Gas cooler B with horizontal slit fin design:
NuDC ¼ 4 Re0:339DC Pr1=3 ð11Þ
Regression coefficient (R2) = 0.992.The correlations indicate that as ReDc increases, the heat-transfer coefficients (ha) also increase. The heat-transfer coeffi-cients of gas cooler A were found to vary between 139–155W/m2K for the horizontal slit fin and 126–145W/m2K for continuousfin design. The heat-transfer coefficients of gas cooler B were foundto vary between 95–127W/m2K for the slit fin design and 88–120W/m2K for the continuous fin design.
The higher average heat transfer coefficient for the slit findesign can be attributed to the fact that the conduction effect from
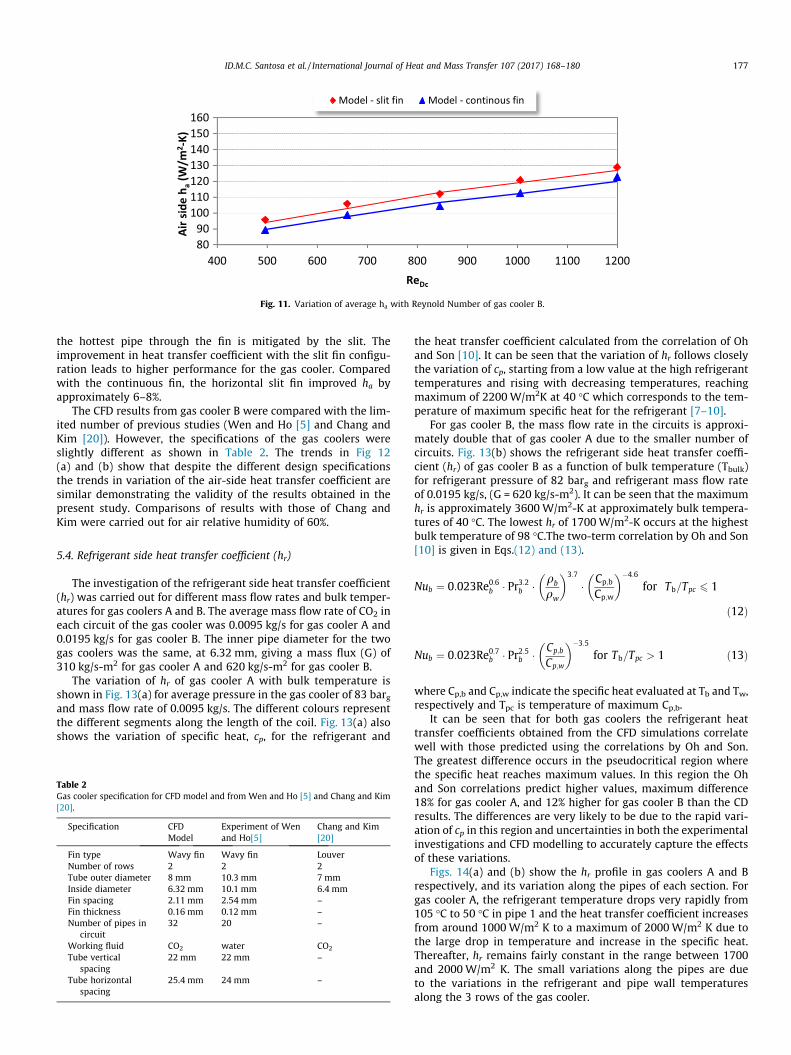
Fig. 11. Variation of average ha with Reynold Number of gas cooler B.
ID.M.C. Santosa et al. / International Journal of Heat and Mass Transfer 107 (2017) 168–180 177
the hottest pipe through the fin is mitigated by the slit. Theimprovement in heat transfer coefficient with the slit fin configu-ration leads to higher performance for the gas cooler. Comparedwith the continuous fin, the horizontal slit fin improved ha byapproximately 6–8%.
The CFD results from gas cooler B were compared with the lim-ited number of previous studies (Wen and Ho [5] and Chang andKim [20]). However, the specifications of the gas coolers wereslightly different as shown in Table 2. The trends in Fig 12(a) and (b) show that despite the different design specificationsthe trends in variation of the air-side heat transfer coefficient aresimilar demonstrating the validity of the results obtained in thepresent study. Comparisons of results with those of Chang andKim were carried out for air relative humidity of 60%.
5.4. Refrigerant side heat transfer coefficient (hr)
The investigation of the refrigerant side heat transfer coefficient(hr) was carried out for different mass flow rates and bulk temper-atures for gas coolers A and B. The average mass flow rate of CO2 ineach circuit of the gas cooler was 0.0095 kg/s for gas cooler A and0.0195 kg/s for gas cooler B. The inner pipe diameter for the twogas coolers was the same, at 6.32 mm, giving a mass flux (G) of310 kg/s-m2 for gas cooler A and 620 kg/s-m2 for gas cooler B.
The variation of hr of gas cooler A with bulk temperature isshown in Fig. 13(a) for average pressure in the gas cooler of 83 bargand mass flow rate of 0.0095 kg/s. The different colours representthe different segments along the length of the coil. Fig. 13(a) alsoshows the variation of specific heat, cp, for the refrigerant and
Table 2Gas cooler specification for CFD model and from Wen and Ho [5] and Chang and Kim[20].
Specification CFDModel
Experiment of Wenand Ho[5]
Chang and Kim[20]
Fin type Wavy fin Wavy fin LouverNumber of rows 2 2 2Tube outer diameter 8 mm 10.3 mm 7mmInside diameter 6.32 mm 10.1 mm 6.4 mmFin spacing 2.11 mm 2.54 mm –Fin thickness 0.16 mm 0.12 mm –Number of pipes in
circuit32 20 –
Working fluid CO2 water CO2
Tube verticalspacing
22 mm 22 mm –
Tube horizontalspacing
25.4 mm 24 mm –
the heat transfer coefficient calculated from the correlation of Ohand Son [10]. It can be seen that the variation of hr follows closelythe variation of cp, starting from a low value at the high refrigeranttemperatures and rising with decreasing temperatures, reachingmaximum of 2200W/m2K at 40 �C which corresponds to the tem-perature of maximum specific heat for the refrigerant [7–10].
For gas cooler B, the mass flow rate in the circuits is approxi-mately double that of gas cooler A due to the smaller number ofcircuits. Fig. 13(b) shows the refrigerant side heat transfer coeffi-cient (hr) of gas cooler B as a function of bulk temperature (Tbulk)for refrigerant pressure of 82 barg and refrigerant mass flow rateof 0.0195 kg/s, (G = 620 kg/s-m2). It can be seen that the maximumhr is approximately 3600 W/m2-K at approximately bulk tempera-tures of 40 �C. The lowest hr of 1700W/m2-K occurs at the highestbulk temperature of 98 �C.The two-term correlation by Oh and Son[10] is given in Eqs.(12) and (13).
Nub ¼ 0:023Re0:6b � Pr3:2b � qb
qw
� �3:7
� Cp;b
Cp;w
� ��4:6
for Tb=Tpc 6 1
ð12Þ
Nub ¼ 0:023Re0:7b � Pr2:5b � Cp;b
Cp;w
� ��3:5
for Tb=Tpc > 1 ð13Þ
where Cp,b and Cp,w indicate the specific heat evaluated at Tb and Tw,respectively and Tpc is temperature of maximum Cp,b.
It can be seen that for both gas coolers the refrigerant heattransfer coefficients obtained from the CFD simulations correlatewell with those predicted using the correlations by Oh and Son.The greatest difference occurs in the pseudocritical region wherethe specific heat reaches maximum values. In this region the Ohand Son correlations predict higher values, maximum difference18% for gas cooler A, and 12% higher for gas cooler B than the CDresults. The differences are very likely to be due to the rapid vari-ation of cp in this region and uncertainties in both the experimentalinvestigations and CFD modelling to accurately capture the effectsof these variations.
Figs. 14(a) and (b) show the hr profile in gas coolers A and Brespectively, and its variation along the pipes of each section. Forgas cooler A, the refrigerant temperature drops very rapidly from105 �C to 50 �C in pipe 1 and the heat transfer coefficient increasesfrom around 1000 W/m2 K to a maximum of 2000W/m2 K due tothe large drop in temperature and increase in the specific heat.Thereafter, hr remains fairly constant in the range between 1700and 2000 W/m2 K. The small variations along the pipes are dueto the variations in the refrigerant and pipe wall temperaturesalong the 3 rows of the gas cooler.

Fig. 12. Comparison the CFD result with other studies: (a) Wen and Ho [5], (b) Chang and Kim[20].
Fig. 13. Variation of refrigerant side heat transfer coefficient (hr) with bulk temperature and comparison with correlation by Ho and Son [10]: (a) gas cooler A, (b) gas cooler B.
178 ID.M.C. Santosa et al. / International Journal of Heat and Mass Transfer 107 (2017) 168–180
For gas cooler B, the heat transfer coefficient is much higherthan gas cooler A due to the much higher mass flux in the pipes.Gas cooler A has 4 parallel sections whilst gas cooler B only has
2 sections, resulting in much higher mass flux but also higher pres-sure drop. The heat transfer coefficient in Gas cooler B increasesfrom around 1800W/m2 K in pipe 1 where the refrigerant temper-

Fig. 14. Variation of hr at segment: (a) gas cooler A, (b) gas cooler B.
ID.M.C. Santosa et al. / International Journal of Heat and Mass Transfer 107 (2017) 168–180 179
ature at inlet is 98 oC to a maximum of 3700W/m2 K at pipe 4where the temperature drops to around 45 oC. After this hr dropsslowly to 3400 W/m2 K at pipe 8 and then remains fairly constantto the end of the heat exchanger.
6. Conclusions
A Computational Fluid Dynamics (CFD) model was developedand used to study the air and refrigerant side heat transfer coeffi-cients in CO2 gas coolers. The model was validated against experi-mental data with respect to heat rejection rate and air-offtemperature. The Realizable k-e turbulence model was found toproduce best results with a mean absolute error in the predictionof the air off temperature of the gas cooler coil of 0.07 K. Insummary,
1. CFD modelling was found to be able to adequately represent theheat transfer characteristics of the gas cooler and be an effectivesimulation tool for the determination of local air andrefrigerant-side heat transfer coefficients in the coil.
2. For the air side heat transfer coefficients evaluations were per-formed for both local and mean heat exchanger heat transfercoefficient values and correlations were developed for thedetermination of these heat transfer coefficients as functionsof the Prandtl (Pr) and Reynolds (Re) numbers.
3. Modelling and experimental results showed that a slit-findesign for the gas cooler coil will enhance heat transfer byreducing heat conduction between the top and second row oftubes in the heat exchanger across the fins. This improves theheat rejection rate of the heat exchanger by between 6% and8% which can lead to lower gas cooler pressures and higher effi-ciency for the refrigeration system and/or smaller size for thecoil.
4. The refrigerant heat transfer coefficient was investigated fordifferent segments of the gas cooler. It was found that the trendin the variation of the refrigerant side heat transfer coefficientfollowed closely the variation of the specific heat of the refrig-erant with temperature. This variation can be as high as 200%along the pipe length of the gas cooler.
5. The results in the paper are a valuable resource for bothresearchers and manufacturers engaged in the design and man-ufacture of gas coolers for CO2 refrigeration applications.
Acknowledgements
This study was supported by the RCUK National Centre for Sus-tainable Energy use in Food chains (CSEF) of the Research Councils
UK Energy programme, Grant No: EP/K011820/1, GEA Searle, nowKevlion, and Directorate General for Higher Education-DIKTI–Indonesian Government for a PhD scholarship. The authors wish toacknowledge the cash and in-kind contributions of these organisa-tions, particularly Simon Jones and Nick Atkins of Kevlion, for theirtechnical input throughout the project.
References
[1] ID.M.C. Santosa, IN. Suamir, Y.T. Ge, K. Tsamos, S.A.Tassou. Modelling andanalysis of CO2 gas coolers for commercial refrigeration applications, in: Proc.2nd Conference on Sustainability and the Cold Chain, Paris, 2013. ISBN: 978-2-913149-97-7. paper S12-P2.
[2] Y.C. Liu, S. Wongwises, W.J. Chang, C.C. Wang, Air side performance of fin-and-tube heat exchangers in dehumidifying conditions – data with larger diameter,Int. J. Heat Mass Transfer 53 (2010) 1603–1608.
[3] X. Du, L. Feng, L. Li, L. Yang, Y. Yang, Heat transfer enhancement of wavy finnedflat tube by punched longitudinal vortex generators, Int. J. Heat Mass Transfer75 (2014) 368–380.
[4] M. Lee, Y. Kim, H. Lee, Y. Kim, Air-side heat transfer characteristics of flat platefinned-tube heat exchangers with large fin pitches under frosting conditions,Int. J. Heat Mass Transfer 53 (2010) 2655–2661.
[5] M.Y. Wen, C.Y. Ho, Heat-transfer enhancement in fin-and-tube heat exchangerwith improved fin, Appl. Therm. Eng. 29 (2009) 1050–1057.
[6] R.K. Shah, D.P. Sekulic, Fundamentals of Heat Exchanger Design, John Wiley &Sons, New Jersey, 2003, ISBN: 0-471-32171-0.
[7] R. Yun, Y. Hwang, R. Radermacher, Convective gas cooling heat transfer andpressure drop characteristics of supercritical CO2/oil mixture in a minichanneltube, Int. J. Heat Mass Transfer 50 (2007) 4796–4804.
[8] S.S. Pitla, E.A. Groll, S. Ramadhyani, New correlation to predict the heat transfercoefficient during in-tube cooling of turbulent supercritical CO2, Int. J. Refrig.25 (2002) 887–895.
[9] C. Dang, E. Hihara, In-tube cooling heat transfer of supercritical carbon dioxide.Part 1. Experimental measurement, Int. J. Refrig. 27 (2004) 736–747.
[10] H.K. Oh, C.H. Son, New correlation to predict the heat transfer coefficient in-tube cooling of supercritical CO2 in horizontal macro-tube, Exp. Thermal FluidSci. 34 (2010) 1230–1241.
[11] Y.T. Ge, R.T. Croper, Simulation and performance evaluation of finned-tube CO2
gas coolers for refrigeration systems, Appl. Therm. Eng. 29 (2009) 957–965.[12] C.Y. Park, P. Hrnjak, Effect of heat conduction through the fins of a
microchannel serpentine gas cooler of transcritical CO2 system, Int. J. Refrig.30 (2007) 389–397.
[13] V. Singh, V. Aute, R. Radermacher, Investigation of effect of cut fins on carbondioxide gas cooler performance, HVAC&R Res. 16 (4) (2010).
[14] D. Sánchez, R. Cabello, R. Llopis, E. Torrella, Development and validation of afinite element model for water – CO2 coaxial gas-coolers, Appl. Energy 93(2012) 637–647.
[15] C. Zilio, L. Cecchinato, M. Corradi, G. Schiochet, An assessment of heat transferthrough fins in a fin-and-tube gas cooler for transcritical carbon dioxide cycles,HVAC&R Res. 13 (3) (2007).
[16] V. Gnielinski, New equation for heat and mass transfer in turbulent pipe andchannel flow, Int. J. Chem. Eng. 16 (1976) 359–368.
[17] C.C. Wang, J.S. Liaw, B.C. Yang, Air side performance of herringbone wavy fin-and-tube heat exchangers – data with larger diameter tube, Int. J. Heat MassTransfer 54 (2011) 1024–1029.
[18] P. Pongsoi, S. Pikulkajorn, C.C. Wang, S. Wongwises, Effect of number of tuberows on the air-side performance of crimped spiral fin-and-tube heatexchanger with a multipass parallel and counter cross-flow configuration,Int. J. Heat Mass Transfer 55 (2012) 1403–1411.

180 ID.M.C. Santosa et al. / International Journal of Heat and Mass Transfer 107 (2017) 168–180
[19] C.S. An, D.H. Choi, Analysis of heat-transfer performance of cross-flow fin-tubeheat exchangers under dry and wet conditions, Int. J. Heat Mass Transfer 55(2012) 1496–1504.
[20] Y. Chang, M. Kim, Modelling and performance simulation of gas cooler for CO2heat pump system, in: Proc. International Refrigeration and Air ConditioningConference, Purdue University, 2006, paper 764.
[21] M.M.A.B. Bhutta, N. Hayat, M.H. Bashir, A.R. Khan, CFD applications in variousheat exchangers design: a review, Appl. Therm. Eng. 32 (2012) 1–12.
[22] W. Yaïci, M. Ghorab, E. Entchev, 3D CFD analysis of the effect of inlet air flowmaldistribution on the fluid flow and heat transfer performances of plate-fin-and-tube laminar heat exchangers, Int. J. Heat Mass Transfer 74 (2014) 490–500.
[23] V. Singh, O. Abdelaziz, V. Aute, R. Radermacher, Simulation of air-to-refrigerantfin-and-tube heat exchanger with CFD – based air propagation, Int. J. Refrig. 34(2011) 1883–1897.
[24] J. Muñoz, A. Abánades, Analysis of internal helically finned tubes for parabolictrough design by CFD tools, Appl. Energy 88 (2011) 4139–4149.
[25] L. Sun, C.L. Zhang, Evaluation of elliptical finned-tube heat exchangerperformance using CFD and response surface methodology, Int. J. Therm. Sci.75 (2014) 45–53.
[26] H. Bilirgen, S. Dunbar, E.K. Levy, Numerical modelling of finned heatexchangers, Appl. Therm. Eng. 61 (2013) 278–288.
[27] B.L. Gowreesunker, S.A. Tassou, Effectiveness of CFD simulation for theperformance prediction of phase change building boards in the thermalenvironment control of indoor spaces, Build. Environ. 59 (2013) 612–625.
[28] ANSYS FLUENT User’s guide, Release 13.0, 2013, p. 699.[29] F-Chart Software. EES (engineering equation solver); 2014, <http://www.
fchart.com>.