International Health- The State of Our World’s Children
42
International Health- The State of Our World’s Children Barbara Oettgen, MD
-
Upload
mark-gallagher -
Category
Documents
-
view
12 -
download
1
description
International Health- The State of Our World’s Children. Barbara Oettgen, MD. Introduction. Present and discuss the statistics of Infant and Child mortality Compare and contrast child mortality in developed vs. developing countries - PowerPoint PPT Presentation
Transcript of International Health- The State of Our World’s Children

International Health- The State of Our World’s Children
Barbara Oettgen, MD

Introduction
Present and discuss the statistics of Infant and Child mortality
Compare and contrast child mortality in developed vs. developing countries
Discuss some of the most common causes of child mortality in developing countries and what is being done to decrease mortality
Discuss status of progress towards mitigation or eradication of causes of mortality

Why talk about Global Health of Children?
“A society in which human rights are promoted and protected and in which human dignity is respected is a healthy society; that is, a society in which people can best achieve physical, mental and social well-being.”
Jonathan Mann, “Human Rights and the New Public Health” 1995

Why talk about Global Health of Children?
There is a stark contrast between developed and developing countries in terms of morbidity and mortality
88% of the world’s children live in developing countries (Population Reference Bureau)
Through immigration, we will see children from developing countries; we must have an understanding of what medical issues for which to screen to care for these children and protect the health of the public

Infant MortalityUS(2000)=6.9 Least developed (2000)=102
0
20
40
60
80
100
120In
du
stri
al.
Dev
elop
ing
Lea
std
evel
oped
Wor
ldIMR
(d
eath
s/1,
000
live
bir
ths)
19902000

Infant Mortality by World region
0
20
40
60
80
100
120
IMR
(d
eath
s/10
00 l
ive
bir
ths)
19902000

Infant Mortality in Selected Developed Countries (2000)*
Singapore 2.9 Belgium 5.2
Hong Kong 3.0 UK 5.6
Finland 3.8 New Zealand 6.1
France 4.4 Cuba 6.2
Germany 4.4 USA 6.9
Switzerland 4.9
Canada 5.3
*Pediatrics, Dec. 2003

Percent of GDP spent on Health Care (2000)*
Finland 6.7 UK 7.3
France 9.3 New Zealand 7.9
Germany 10.6 US 13
Switzerland 10.4
Canada 8.9
Belgium 8.8
* From Org. for Economic Cooperation and Development

Child (Under 5) Mortality RateUS(2001)=8 Least developed (2001)= 157
020406080
100120140160180200
Industrialized Developing Leastdeveloped
World
Dea
ths
per
100
0 li
ve b
irth
s
19902000
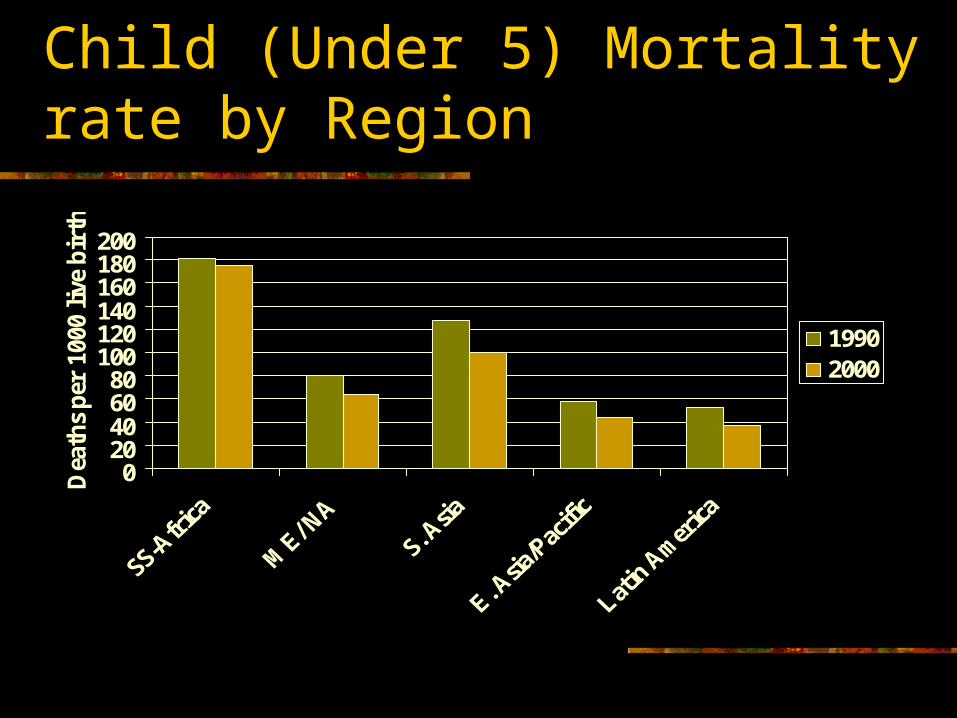
Child (Under 5) Mortality rate by Region
020406080
100120140160180200
Dea
ths
per
100
0 li
ve b
irth
s
19902000

Major Causes of Mortality
Currently, epidemiologic work is being done to try to accurately measure causes of death
Difficult to get completely accurate numbers that can be tracked over time Many deaths are due to a combination of reasons such as
diarrhea and measles At least 60% of deaths are thought to be associated with
malnutrition The breakdown of causes of death varies by country and
region Lack of public health infrastucture to accurately collect data

Major Global Causes of Mortality for Children under 5, in 2002 *WHO
ARI18%
Diarrhea15%
Malaria10%
Measles5%
HIV/Aids4%
Perinatal23%
Other25%

Major Causes of Mortality for children < 5, SS Africa- 2002
ARI16%
Diarrhea14%
Malaria22%
Measles8%
HIV8%
Perinatal13%
Other19%

Major Causes of Infant (< age 1) deaths in the US, 2000 *Pediatrics 12/03
Infant deaths (27,983); IMR=6.9Cong. Malform
21%
LBW/Short gest15%
SIDS8%Perinatal
14%
Unint.Injuries3%
other39%

Major Causes of Childhood Death in the US (ages 1-4), 2000 *Pediatrics 12/03
Child deaths (4942)
Cong. Malform9%Neoplasm
8%
Assault6%
Heart Disease3%
other38%
Injuries36%

Causes of death
Use data to formulate a public health approach to reducing mortality
What are the challenges for each major morbidity?
How can we affect the most change? What are the goals? (World Summit for
Children) Are we making progress?

Acute Respiratory Tract Infection (ARI)
Killed ~ 2 million Children in 2000 Estimated that ~60% of deaths could be
prevented with selective antibiotics WHO recommends using many types of
caregivers to evaluate children and provide Abx if necessary including village health workers; children should seek care outside the home

Acute Respiratory Tract Infection (ARI)
How can the situation change? Improve care-seeking behavior- get the word out
to families and communities about having their children evaluated if sick
IMCI (Integrated Management of Childhood Illness) Initiative
Work on case management skills of health workers

Acute Respiratory Tract Infection (ARI)
Progress So far little- in nearly half of 81 developing
countries with available data, < 50% if children with ARI were taken to an appropriate provider but there is wide inter-country variability
Biggest problem area is sub-Saharan Africa Access is a big issue: urban vs. rural; also
availability of meds

Diarrhea
In early 1990’s was the #1 killer; still important
Tactics so far have included ORT, breastfeeding promotion, measles immunization, safer water supply, and safe feces disposal
Between 1990-2000 diarrheal related deaths decreased by 50%

Diarrhea
Most of success attributed to ORT Evolution of ORT
Early 1980’s ORT= ORS (Oral Rehydration Salts)
Since 1993- ORT=increased fluids and continued feeding (IF/CF)

Diarrhea
Different countries use different versions of ORT so a little difficult to compare data but overall there is wide use of ORT and either increasing or stable trends in use
Still lots of work needed to reach families Still need to work on infrastructure to
establish safe water and sewage disposal

HIV/AIDS
Actuality of epidemic (in its 3rd decade) is far worse than predictions in early 1990’s
As of 12/04, 40 mil infected (2.2 mil children <15) Newly infected in 2003= 5 mil; deaths=3 mil
(600,000 children)- 8,000 people every day 95% of those infected live in low and middle income
countries Largest numbers are in sub-Saharan Africa Epidemics emerging in Eastern Europe, Central
Asia, and Asia/Pacific region (China/India)

HIV/AIDS in Africa- end 2003
25 million Africans with HIV 19 million have already died 80% of world’s children who are orphaned due
to HIV live in Africa 60% of world’s young people (15-24) with HIV
live in Africa (10 million) Half of all new infections occur in the 15-24 age
range (women are 2.5 times as likely to be infected in this age group)

HIV/AIDS
Problems Lack of education- >50% don’t know about AIDS
or how it is transmitted in the 20 of 22 countries for which there is information
Young people do not go for education even if its available because of lack of privacy, threatening environment, insensitive staff
Drug Abuse, Risky sexual behavior

01 July 2002 slide number SSA-42
Percentage of 15Percentage of 15--19 girls 19 girls who do not know that a HIVwho do not know that a HIV--infected person infected person
may look healthy, 1994may look healthy, 1994--19991999
0
10
20
30
40
50
60
70
80
90
100
Per
cent
age
who
do
not kn
ow
Source: UNICEF, DHS surveys and other nationwide surveys, 1994-99.

01 July 2002 slide number SSA-45
Risk perceptionpercentage of sexually active women (15percentage of sexually active women (15--19) 19)
that perceive not to be at risk at all of getting AIDSthat perceive not to be at risk at all of getting AIDS
*HIV prevalence in women attending antenatal care clinics in major urban areas
ZimbabweZambiaUgandaKenyaCARHaitiTogo
CameroonMali
ChadBeninNiger
Dominican Rep.Brazil
GuatemalaBolivia
ColombiaNepal
Nicaragua
HIV Prevalence (at time of survey *)
Percentage of 15-19 year old girls who think they are not at risk of AIDS
Source: UNICEF, DHS surveys, 1994-1999

01 July 2002 slide number SSA-43
Knowledge of condoms Knowledge of condoms among adolescent boysamong adolescent boys
0%
25%
50%
75%
100%
Do not know condomsDo not know condoms
Know condoms but Know condoms but not where to get themnot where to get them
Know condoms and Know condoms and where to get themwhere to get them
Per
cent
age
of 1
5-1
9 ye
ar o
ld b
oys
Source: UNICEF, DHS surveys, 1994-1999

Life-time risk for HIV/AIDS

01 July 2002 slide number SSA-31
Changes in life expectancy in selected African countries Changes in life expectancy in selected African countries with high and low HIV prevalence: 1950with high and low HIV prevalence: 1950--20052005
with high HIV prevalence:ZimbabweSouth AfricaBotswana
with low HIV prevalence:MadagascarSenegalMali
Source: UN Department of Economic and Social Affairs (2001) World Population Prospects, the 2000 Revision
30
35
40
45
50
55
60
65
Life exp
ectanc
y (yea
rs)
1950–1955
1955-1960
1960-1965
1965-1970
1970-1975
1975-1980
1980-1985
1985-1990
1990-1995
1995-2000
2000-2005

HIV/AIDS
Other issues Maternal-Child transmission- U5MR could
increase by 100% in most affected areas by 2010 In 2003, 630,000 newly infected children <15 (mostly
all perinatal) Only 8% of infected pregnant women have access to
meds (In SS Africa, <5%) Orphaned children due to HIV
Already 14 million

HIV/AIDS
Need to be educating children, even before they reach the 15-24 age group on the disease, its severity, and prevention.
World HIV conference HIV Vaccine

Antiretroviral Treatment; the “3 by 5” initiative

Malnutrition
In 1990, 1/3 of children <5 were malnourished (174 million)
Malnutrition contributes to >50% of all child deaths
Poverty, low status of women, poor care during pregnancy, high population densities, poor access to health care and feeding practices contribute

Malnutrition- Progress
Since 1990, the percent of underweight children has decreased from 32 to 28% (150 million). (The WSC goal was to reduce it by half).
Greatest decline has been in East Asia (especially China) from 24-16%.
South Asia remains the most affected area- with a small decline since 1990 from 55% to 48% where half of undernourished children live
Problem is 1.5 times greater in rural areas

Malnutrition
55
3224
13 11
48
31
16 178
0
10
20
30
40
50
60S
ou
th A
sia
SS
-Afr
ica
EA
sia/
Pac
ific
ME
/Naf
rica
LA
/Car
rib
ean
% C
hil
dre
n <
5- U
nd
erw
eig
ht
1990
2000

Malaria
Problem areas are sub-Saharan Africa, India, northern South America
Prevention: treated bednets- if every child slept under a treated bednet we could reduce mortality by 25-30%
Treatment- only about half of children are treated appropriately
Also working on a malaria vaccine

Malaria
Per WHO, every 30 sec. a child dies of malaria (estimated 1 million deaths worldwide/year- mostly in children and 90% in Africa)
Threat of malaria is increasing due to climate changes, environment, development projects (such as dams), war, poverty

Malaria
Roll Back Malaria Project- started in 1998 Strategy includes
Early detection and prompt treatment Treated bednets and other vector control
measures Preventive intermittent treatment in
pregnancy (a Kenya/Malawi study- decrease complications by 75%)
Disease surveillance

Vaccine Preventable Diseases
Tetanus (neonatal/maternal), measles, polio Goal is eradication-
Most dramatic progress so far is with polio- since 1988, incidence has decreased >99%; in 2002, only 1,920 cases worldwide; mostly concentrated in India, Nigeria, and Pakistan
For tetanus, by the end of 1999, 104 of 161 developing countries had eliminated neonatal tetanus
Measles- still have 14 countries with coverage of <50%; global rate =72%

Vaccine Preventable Diseases
Strategy for elimination includes: Use National Immunization Days (NID), sub-
NID, and mop-up activities (including house to house) to improve coverage
Improved surveillance and accurate reporting In the case of polio, have established
technical advisory groups for each country as well as interagency coordination committees
Challenges

Conclusions
United States vs. the world Large role of infectious diseases in the
developing world contributing towards mortality
Challenges of education, nutrition, war, poverty
Successes