International flows of selected cultural goods and...
99
International Flows of Selected Cultural Goods and Services, 1994-2003
Transcript of International flows of selected cultural goods and...

International Flows of Selected CulturalGoods and Services, 1994-2003

INTERNATIONAL FLOWS OF SELECTED CULTURAL GOODS AND SERVICES, 1994-2003
Defining and capturing the flows of global cultural trade
UNESCO Institute for Statistics UNESCO Sector for Culture
UNESCO Institute for Statistics, Montreal, 2005

UNESCO The constitution of the United Nations Educational, Scientific and Cultural Organization (UNESCO) was adopted by 20 countries at the London Conference in November 1945 and entered into effect on 4 November 1946. The Organization currently has 191 Member States and six Associate Members.
The main objective of UNESCO is to contribute to peace and security in the world by promoting collaboration among nations through education, science, culture and communication in order to foster universal respect for justice, the rule of law, and the human rights and fundamental freedoms that are affirmed for the peoples of the world, without distinction of race, sex, language or religion, by the Charter of the United Nations.
To fulfil its mandate, UNESCO performs five principal functions: 1) prospective studies on education, science, culture and communication for tomorrow's world; 2) the advancement, transfer and sharing of knowledge through research, training and teaching activities; 3) standard-setting actions for the preparation and adoption of internal instruments and statutory recommendations; 4) expertise through technical co-operation to Member States for their development policies and projects; and 5) the exchange of specialized information.
UNESCO is headquartered in Paris, France.
UNESCO Institute for Statistics The UNESCO Institute for Statistics (UIS) is the statistical office of UNESCO and is the UN depository for global statistics in the fields of education, science and technology, culture and communication.
The UIS was established in 1999. It was created to improve UNESCO's statistical programme and to develop and deliver the timely, accurate and policy-relevant statistics needed in today's increasingly complex and rapidly changing social, political and economic environments.
The UIS is based in Montreal, Canada.
UNESCO Institute for Statistics P.O. Box 6128, Succursale Centre-Ville Montreal, Quebec H3C 3J7 Canada
Tel: (1 514) 343-6880 Fax: (1 514) 343-6882 Email: [email protected] http://www.uis.unesco.org
ISBN 92-9189-023-5
©UNESCO-UIS 2005
Cover design: JCNicholls Design – www.oglethorpe.ca Ref: UIS/AP/05-01

- 3 -
Acknowledgements The development of this publication has been a joint undertaking by the UNESCO Institute for Statistics (UIS), UNESCO’s Arts and Cultural Enterprise Division (ACE), and UNESCO’s Cultural Policies and Intercultural Dialogue Division (CPD). Under the direction of Denise Lievesley, Director of the UIS, Milagros del Corral, Director of ACE, and Katérina Stenou, Director of CPD, this publication was prepared and coordinated by Lydia Deloumeaux, the UIS project manager, with the support of Guiomar Alonso Cano from ACE. Melika Medici and Aitor Mate from ACE also contributed substantially to the development of this report. This report is based on data extracted from the United Nations Commodity Trade Statistics database. The UIS and UNESCO gratefully acknowledge other international organizations that have supplied additional information and statistics, in particular the Organisation for Economic Co-operation and Development (OECD) and the World Bank, as well as other specialised institutions. The UIS and ACE would also like to express thanks to Moe Chiba (CPD), Véronique Guèvremont (CPD), Laurence Mayer-Robitaille (CPD) and Mélanie Smuga (UIS) for their participation in the preparation of this report. Special thanks are due to S. Venkatraman (UIS) who helped in editing and commenting. Thanks are also presented to Ivan Bernier (consultant), Lluis Bonet (consultant), Michael Bruneforth (UIS), Olivier Labé (UIS), Joscelyn Magdeleine (WTO), Diane Stukel (UIS) and Bertrand Tchatchoua (UIS) who provided valuable comments and other inputs. Katja Frostell coordinated the production of this report in print.
- 4 -
Foreword This report is a collaborative effort by the UNESCO Institute for Statistics (UIS) and the UNESCO Sector for Culture. It looks at cross-border trade in selected cultural goods and, for the first time, examines trade in selected cultural services. Based on UNESCO’s Framework for Cultural Statistics, it adopts a fresh approach to measuring cultural flows by distinguishing between ‘core’ and ‘related’ cultural goods and services. In so doing, it attempts to address some of the shortcomings of statistical data in previous UNESCO studies which, while they pictured trade in cultural ‘hardware’ (TV and radio sets, musical instruments, audiovisual equipment and so forth), said very little about the actual trade in ‘content’ cultural goods. Thus the present report is a step forward by giving a global picture of the nature and direction of international cultural trade flows. However, the paucity of the available data, notably with regard to cultural services, coupled with the very complex nature of cultural products, prevent any but a partial view from emerging. Cross-border trade in cultural goods and supply of cultural services as reflected in the balance of payments are presumably the tip of the iceberg of the much larger phenomena of cultural trade flows and exchanges with major economic, cultural and political implications. We hope this report will contribute to a better understanding of the field.
Mounir Bouchenaki Denise Lievesley Assistant Director-General Director, UNESCO Culture Sector Institute for Statistics


- 6 -
Annex V: List of products used in the report.................................................................................... 89 A. List of codes used for cultural services (EBOPS, CPC) ...................................... 89 B. List of codes used for cultural goods in Harmonised System (HS) and
Standard International Trade Classification Revision 3 (SITC REV. 3)............ 91 Annex VI: Composition of regions and economic groupings .......................................................... 95
A. Geographical zones ................................................................................................ 95 B. Economic zones...................................................................................................... 97
List of Figures
Figure 1: Composition of cultural products ............................................................................................ 14 Figure 2: Exports of core cultural goods in million US$, 2002 ............................................................ 20 Figure 3: Imports of core cultural goods in million US$, 2002 ............................................................ 20 Figure 4: Exports by region of core cultural goods, 2002 ..................................................................... 21 Figure 5: Imports by region of core cultural goods, 2002 ..................................................................... 22 Figure 6: Entertainment and media markets by region (in million US$), 2003.................................. 23 Figure 7: Total exports value of core cultural products, 1994-2002 .................................................... 24 Figure 8: Total imports value of core cultural products, 1994-2002.................................................... 25 Figure 9: Trade coverage ratio of core cultural goods by level of income, 1994-2002 ..................... 26 Figure 10: Exports of core cultural goods classified according to level of income, 2002 .................. 27 Figure 11: Imports of core cultural goods classified according to level of income, 2002 .................. 28 Figure 12: Trade partners of the United States of America’ exports of core cultural goods, 2003 .. 29 Figure 13: Trade partners of the United States of America’ imports of core cultural goods, 2003 . 30 Figure 14: Trade partners of Chinese exports of core cultural goods, 2003......................................... 31 Figure 15: Trade partners of Chinese imports of core cultural goods, 2003 ........................................ 31 Figure 16: Trade partners of South African exports of core cultural goods, 2003 .............................. 32 Figure 17: Trade partners of South African imports of core cultural goods, 2003 ............................. 33 Figure 18: Total trade partners of Brazilian exports of core cultural goods, 2003 .............................. 34 Figure 19: Total trade partners of Brazilian imports of core cultural goods, 2003.............................. 34 Figure 20: Total trade partners of Egyptian exports of core cultural goods, 2002.............................. 35 Figure 21: Total trade partners of Egyptian imports of core cultural goods, 2002 ............................. 36 Figure 22: Repertoire origin as % of market value, 2002......................................................................... 39 Figure 23: Number of films produced in India and the United States of America, 1999-2003......... 44 Figure 24: Audiovisual and related services exports for a selection of countries, 2002...................... 46 Figure 25: Origin of first-time release feature films in a selection of countries, 2000-2002............... 47 Figure 26: Estimates of the trade in audiovisual programmes (TV only) between the European
Union and North America, 1995-2000............................................................................. 48 Figure 27: Collection of copyright income by region, 2002 .................................................................... 51
List of Tables Table 1: Trade of core cultural goods, 1994-2002................................................................................. 36 Table 2: Trade of related cultural goods, 1994-2002 ............................................................................ 45 Table 3: Selected detailed trade cultural services, 2001-2002 .............................................................. 50

- 7 -
List of Boxes
Box 1: Goods and services covered in the report ................................................................................. 15 Box 2: International flows of artisanal/handmade products................................................................ 16 Box 3: Global markets of cultural and creative industries .................................................................... 23 Box 4: The music sector: market of recorded media............................................................................. 39 Box 5: Capturing the value of intangible assets: The case of the Jamaican music copyrights......... 40 Box 6: The major role of India in the film industry ............................................................................. 44 Box 7: Flows of related cultural goods .................................................................................................... 45 Box 8: Audiovisual content - assessing trade flows of movie feature films ....................................... 47 Box 9: Audiovisual content - trade in broadcasting programmes ....................................................... 48 Box 10: Revenues collected by copyright management societies ......................................................... 51

- 9 -
Executive summary
In today’s world, music, books, crafts, films and many other cultural goods and services move across international borders, creating a complex picture of cultural trade flows. Cultural and creative industries alone are estimated to account for over 7% of the world’s Gross Domestic Product (GDP). This report raises methodological issues concerning the measurement of trade flows of cultural goods and services. Due to the special nature of cultural products, it is necessary to have more than improved customs or balance of payments data. Furthermore, additional data are needed to measure cultural flows accurately. In this regard, the identification of cultural products within the international classifi-cations system would be of great value. The report provides an analysis of the trade flows of cultural goods and services between 1994 and 2003. The data used in this report are customs-based and derived from balance of payments expressed at current United States of America dollar values (US$). However imperfect these data are, they give some indication of the trend and distribution of global trade in cultural goods and services. A new methodological approach which focuses on the notion of cultural content has been used in the current report. Using this notion, the core of the analysis is focused on products having a cultural content, such as books, statuettes or feature films, while a short analysis is given for products related to support or equipment, such as blank CDs or television receivers. Further-more, an analysis of cross-nationally comparable services data has also been introduced.
Customs-based data show that the trade of cultural goods almost doubled during the last ten years from US$ 39.3 billion in 1994 to 59.2 in 2002. However, in 2002 this market was restricted to a limited number of countries where high-income economies are still the largest producers and consumers of cultural goods. A notable exception is the emergence of China as the third biggest exporter of cultural goods in 2002. The United Kingdom came out as the biggest exporter of cultural goods with US$ 8.5 billion, followed by the United States of America with US$ 7.6 and China with US$ 5.2. Although developing countries account for less than 1% share of exports of cultural goods, the analysis sheds new light on the rise of a limited number of emerging countries. However, this presence is restricted to a few specific markets, such as visual arts, statuettes and video games. In 2002, the European Union 15 (EU15) occupied the leading position in the export of cultural goods, with 51.8% of all report-ing countries; a slight decrease compared to a 54.3% share in 1994. The region which has profited the most during the last years is Asia, particularly South-East Asia for recorded media and Eastern Asia for visual arts and videogames. Indeed, in 2002 Asia appeared as the second largest exporting region with 20.6% share, due to the growth in Eastern Asia which doubled its share between 1994 and 2002 to reach 15.6%. Consequently, North America became the third largest exporter in 2002 with 16.9%, down from 25% in 1994. The position of Latin America and the Carib-bean improved in the market by gaining one percentage point between 1994 and
- 10 -
2002, although its trade level was quite low at 3%. Oceania and Africa did not show progress in this market during the last ten years, with a combined share of less than 1% in 2002. A different scenario emerges for imports where clearly demand for cultural goods was restricted to a few high-income countries, holding more than 90% market share. The United States of America was the biggest importer of cultural goods in 2002 with US$ 15.3 billion, which is twice the value of the United Kingdom (US$ 7.8 billion) which is the second largest import-er. Germany was the third largest importer of cultural goods with US$ 4.1 billion. The most substantial change in relative terms occurred with audiovisual media from 1994 to 2002, while printed media lost its leading position. However, recorded media (31%), printed media (30%) and visual arts (20%) kept their dominant position in 2002 within the international flows of cultural goods. Audiovisual media represented only 14% of total trade in core cultural goods. Video games are mainly responsible for the predominance of audiovisual media, with photographic and cinematographic goods being only of secondary importance. According to customs data, core cultural goods represented approximately 1% of the total trade in 2002. This percentage has remained the same during the last ten years. These figures might seem surprising in light of the perceived growing importance of cultural industries in the world economy. In order to assess the international exchanges they generate, other sources of data are considered in this report, such as services data.
Cultural services suffers from paucity of data; they are often not part of the statutory data collected by countries. The current international classifications are not detailed enough to identify the cultural components. Data for the last ten years are only available for a limited number of countries. Audiovisual services is the only category where enough coverage is available based on balance of payments data. The current data on audiovisual and related services show that the United States of America is the largest exporter of cultural services with US$ 6.7 billion, far beyond the United Kingdom which is the second largest exporter with US$ 1.5 billion. Unfortunately, no internationally comparable data are available in some key areas, such as copyright royalties. India’s role as a major producer of feature films, with nearly 700 films made per year compared to 400 films per year in the United States of America, is not reflected clearly in the trade data. In addition, other key markets like the flows of broadcasting programmes are not covered. The absence of the majority of developing countries and countries in transition from the international market in cultural products can be regarded as an indicator of lack of information on key sectors, such as crafts, which results in underestimates of data for some of the trade flows that do indeed take place. The phenomenon of piracy, which was not considered in this report, also had an impact on the exchange of cultural products. Better identification of new forms of trade flows related to Information and Communi-cation Technologies (ICTs) - such as e-commerce - will require the development of new statistical tools to measure such phenomena.

- 11 -
1. Introduction The number of products created and sold throughout the world is increasing every year. Similarly, the growing international trade of these cultural products constitutes an important part of the global economy. According to the United Nations Conference on Trade and Development (UNCTAD, 2005), the global market value of industries with strong creative and cultural components is estimated at US$ 1.3 trillion. Since 2000, the industry has grown at an annual compound rate of over 7%. Cultural and creative industries have also taken up a key position in the countries of the Organisation for Economic Co-operation and Development (OECD), with an annual growth rate of between 5% and 20%, as well as in a number of leading developing countries and countries in transition (UNCTAD, 2004). Globally, these industries are estimated to account for more than 7% of the world’s Gross Domestic Product (World Bank, 2003) and are forecast to grow roughly at the same pace over the next three years reaching US$ 1.7 trillion (PWC, 2005). The substantial growth of cultural and creative industries has run parallel to expanding international trade in cultural goods and services. Today, diversified cultural products of multiple origins are being increasingly exchanged between countries. However, due to the specific nature of cultural goods and services, there is great difficulty in determining the actual size of this growing cultural trade, especially when it involves the direction of trade flows and the participation of the countries. It is difficult to assess whether or not these expanding markets are able to reduce the gap in the access to and circulation of cultural products. The reduced costs of cultural goods and services resulting from expanding markets may raise the opportunity for many creators and producers to benefit from exports. But on
the other hand, imports may crowd out domestic creative production. This raises concern over the capacity of individual countries to create and produce their own cultural products. This complex debate on the ability of individual countries to enjoy and contribute to the world’s cultural diversity has many economic, political and ideological underpinnings. The discussion is constrained due to the lack of relevant data which could inform better policy decisions that deals with cultural exchanges and their impact on cultural diversity. The main objective of this report is to contribute to an assessment of the relative size, distribution and trends of the global trade in cultural goods and services. Cross-nationally comparable statistical data are provided on the evolution of international flows of selected cultural goods and services between 1994 and 2002 or 2003. The analysis focuses on the notion of cultural content and develops a new conceptual structure to accommodate the taxonomies currently used for the collection of trade data. This effort aims at better reflecting the trade in products with cultural content. In this regard, the report draws a distinction between “core” and “related” cultural goods and services. Within this structure, items are classified based on their estimated degree of cultural content which is understood as the content or message originally intended by an individual author or a group of creators. The purpose of the analysis is therefore to be able to distinguish between “content products” and those products that make possible their creation, production and distribution. However, despite the improved methodology, the data presented in this report should be interpreted with caution due to the very nature of cultural products and the major gaps that exist in trade data, particularly for

- 12 -
audiovisual, copyrights and other cultural services. This report provides more than an update on previous studies on cultural goods and services carried out by UNESCO. Previous reports (UNESCO, 2000 and UNESCO, 1992), which were based on the UNESCO Framework for Cultural Statistics depicted cross-border movements of cultural goods, which mainly consisted of cultural equipment and support materials. Because of the existing data categories, cultural trade is often equated to trade in equipment, and this leads to distorted analysis and interpretation. Nonetheless, the 2000 report provided a useful indication of cultural production and consumer preferences throughout the world from 1980 and 1998 and reflected the rapid expansion of consumer goods combined with the convergence of consumer tastes. By including data on cultural services, by introducing a new classification that makes the distinction between core cultural products and related ones, and by presenting additional data on the relative size of cultural and creative industries which contextualise cross-border exchanges, this report offers a more comprehensive basis for the interpretation and analysis of the implications of cultural trade. It also identifies the main cultural components being traded and describes changes that have occurred in the involvement of the various countries during the last ten years. For the purpose of this report, trade in cultural products is defined as the exports and imports of tangibles and intangibles conveying cultural content that might take either the form of a good or a service (books, recorded CDs, video games, printing or dubbing services, etc.). Trade in cultural products also includes the goods and services which are required to produce and disseminate such content, including cultural equipment and support materials, as well as ancillary services even if they are only partly cultural in their
content. This approach attempts to factor in the development of the Information and Communication Technologies (ICTs) which have changed the traditional ways of cultural trade. Indeed the digital environment and the Internet have been central to the expanding trade system of cultural products. ICTs have allowed the emergence of new tools of creation, new means of distribution and new formats, such as e-books and downloadable music. However, the challenge here is to capture the intellectual property flows and other intangible assets on which cultural products are increasingly based, and not focus only on the physical and tangible support material. This report portrays the data currently available and the areas where more detailed data is required. The great complexity of measuring trade flows of cultural goods and services requires more than improved customs-based data and services data. The statistics compiled, analysed and presented in this report relate only to quantifiable trade in cultural goods, namely the declared value of goods crossing the country border or being supplied across the border, and not their actual market value which is often considered far more important than the declared value at customs. This remains a continuing difficulty in the evaluation of cultural trade. Export statistics cannot accurately measure the value of cultural products sold in foreign markets. This is particularly true for those core cultural products whose special nature makes them endlessly available and reproducible at insignificant cost. For example, a single master version of a copyrighted work, such as a music master valued at few dollars according to national export statistics, may be shipped to another country where copies or exhibition rights and/or reproduction license fees may generate millions of dollars through sales.

- 13 -
Thus, caution should be employed when drawing conclusions from the data presented in this report. In particular, it is necessary to bear in mind that:
• Customs statistics only include trade in goods that physically enter or leave the country. Under the Harmonised System (HS) classification, these goods are classified by their observable physical characteristics and not according to the status of national content, cultural value or other similar criteria. Customs statistics provide information about the country of origin and the country of destination of each good. Unfortunately, the “cultural origin” of a cultural good is not easily identifiable;
• Many transactions among subsidiaries of large corporations which probably account for a large part of international trade operations in the cultural and creative industries may not be included;
• Data on exports can substantially underestimate the true value attributable to cultural products; and
• Trade in services data in this report refer to balance of payments services transactions which relate mainly to the cross-border supply of services (supplier and consumer remain in their respective countries and the services cross the border).
In order to overcome the limitations of international cultural trade data, additional qualitative and quantitative data on cultural products are presented in boxes throughout the report, providing the necessary context to interpret these data. These boxes relate to areas that are crucial to some of the on-going discussions arena on the understanding, promotion and preservation of cultural diversity. Such topics include international flows of artisanal products, feature films, broadcasting programmes and music copyrights.
Despite these limitations, this overview of international flows of selected cultural goods and services provides some indication of the patterns of production and consumption of cultural products over the last ten years. It shows the trends emerging as a result of the creative economy. First, data reveal the continuing wide variation in the capacities of individual countries across the world to export cultural products. In many developing or small countries, with limited domestic markets, these capacities appear to have shrunk. Second, the distinction between core and related cultural products reveals the gap between many low-income and high-income countries in producing content-based cultural products. The difference is far less substantial with respect to related cultural products, which include equipment, support materials and ancillary services.
Cultural and creative industries do not fall neatly into the existing structure of standard industrial or occupational codes, nor do the products of these industries: cultural goods and services. This analysis explores some new ways of presenting the existing data and identifying future data needs.
2. Methodological approach
2.1. New methodology
The primary objective of this report is to identify the scope of the trade of cultural goods and services and to examine data available at the international level. The UNESCO Framework for Cultural Statistics (FCS) has served as the basis for defining the structure and scope of the report. UNESCO’s former Division of Statistics elaborated the FCS in the 1980s. The FCS comprises ten distinct categories (see Annex III) which have not been revised since 1985 and, thus, do not capture the emergence of information and communication technologies which have developed rapidly since late 1980s. Nonetheless, the FCS still serves as a key reference for most cultural statistical frame-

- 14 -
works developed at regional and national levels.
The FCS was inspired by a broad definition of culture. However, the use of certain categories, such as sports and games, tourism or socio-cultural activities, is often questioned and thus excluded from some national frameworks for cultural statistics. For this reason, they have been excluded from this report.
This report focuses on cultural products which can be defined as the output of cultural and creative industries. Two points have been considered while categorising the cultural products into “core” and “related” cultural products. First, these categories were inspired from the distinction made between cultural and creative industries. Creative industries take into account a wider view of the creative process than the more traditional view of cultural industries by including other areas such as software, advertising, architecture and business intelligence services. Products resulting from some of the above-mentioned activities or industries are defined in the report as “related products”, while the more traditional cultural products have been categorised under “core cultural products”. Second, cultural products have a tangible component (the physical support) and an intangible one (cultural content). This specificity of cultural products has been taken into account by making the distinction between “core” products directly associated with cultural content and “related” cultural products linked with those services, equip-ment and support materials that serve the creation, production and distribution of core cultural products. This distinction means that, for example, a recorded CD of music and the associated copyrights are classified under “core cultural products”, while the blank CDs or the CD player are classified under “related cultural products”. Cultural products comprise both goods and services. Cultural goods are defined as
consumer goods which convey ideas, symbols and ways of life, such as books, magazines, multimedia products, software, recordings, films, videos, audiovisual programmes, crafts and fashion design (Alonso Cano et al., 2000). It is traditionally understood that cultural services are those activities aimed at satisfying cultural interests or needs. Cultural services do not represent material goods in themselves but facilitate their production and distribution. They typically consist of licensing activities and other copyright-related services, audiovisual distribution activities, the promo-tion of performing arts and cultural events, as well as cultural information and preservation of books, recordings and artefacts (in libraries, documentation centres, museums), etc. Figure 1 illustrates this distinction, and Box 1 presents the complete list of goods and services categories used in this report.
Figure 1. Composition of cultural products
This report focuses on core cultural products, although a small section is devoted to related cultural products (see Box 7). Related cultural services are not addressed separately since the categories (such as architectural activities or advertising) fall under much broader categories of services (i.e. “advertising, market research and public opinion polling”) and the cultural aspect cannot be clearly identified. The trade of crafts is also not covered since no detailed internationally comparable data are available (see Box 2).

- 15 -
Box 1. Goods and services covered in
the report1
This list presents goods and services as defined according to the product-based classification: “Harmonised System” for goods and the BPM5 or EBOPS for services. Core cultural goods • Heritage goods
- Collections and collectors’ pieces - Antiques of an age exceeding 100 years
• Books - Printed books, brochures, leaflets, etc. - Children’s pictures, drawing or colouring
books • Newspapers and periodicals • Other printed matter
- Printed music - Maps - Postcards - Pictures, designs
• Recorded media - Gramophone records - Discs for laser-reading systems for
reproducing sound only - Magnetic tape (recorded) - Other recorded media for sound
Data on cultural goods are customs-based, whereas services data are defined according to the balance of payments. As a result, the analysis of the two areas is kept separate. Another reason for the difficulty in combining goods and services data in a single analysis is because data on the trade of goods are derived from customs declarations, while the services data are based on business declarations.
1 Please refer to Annex V for details.
• Visual arts
- Paintings - Other visual arts (statuettes, sculptures,
lithographs, etc.) • Audiovisual media
- Video games used with a television receiver - Photographic and cinematographic film,
exposed and developed2 Core cultural services • Audiovisual and related services • Copyright royalties and license fees Related cultural goods • Equipment/support material
- Musical instruments - Sound player recorder and recorded sound
media - Cinematographic and photographic supplies - Television and radio receivers
• Architecture plans and drawing trade and trade advertisement material
Related cultural services • Information services, news agency services • Advertising and architecture services • Other personal, cultural and recreational
services This means some double counting can occur in measuring copyrights value by merging goods data with services data. Goods data captured by customs statistics can include some copyrights, while services data may also contain some of these copyrights for the same product.
2 This category does not cover feature films (see Boxes 6
and 8).

- 16 -
Box 2. International flows of artisanal/handmade products
According to the International Trade Center (ITC) and UNESCO, artisanal products are defined as “those produced by artisans, either completely by hand or with the help of hand-tools or even mechanical means, as long as the direct manual contribution of the artisan remains the most substantial component of the finished product… The special nature of artisanal products derives from their distinctive features, which can be utilitarian, aesthetic, artistic, creative, culturally attached, decorative, functional, traditional, religiously and socially symbolic and significant” (UNESCO/ITC, 1997). International flows of artisanal products are a major component of cultural trade for many developing countries. Unfortunately, they are difficult to measure within the international classification system of trade statistics since most artisanal products are not identified separately in the Harmonised System (HS). To address this issue and at the request of ITC, the World Customs Organisation (WCO) encouraged its member countries to codify handmade products within their national statistical classification systems. The extent to which this recommendation is being applied, as well as the quality of data being collected, is not yet known. Since no change has yet been made to the HS itself; it is still difficult to identify those products within international trade that are handmade. UNESCO’s Methodological Guide to the Collection of Data on Crafts, published in 1997, divides artisanal products under broad categories based on the materials used. The six main categories of this classification are: Baskets/wickers/vegetable fibre-works; Leather; Metal; Pottery; Textiles and Wood. The guide also identifies complementary categories comprising materials in craft production that are either very specific to a given area, or rare, or difficult to work, such as: stone, glass, ivory, bone, shell, mother-of-pearl, etc. Extra categories are also identified when different materials and techniques are applied at the same time and refer to decorations, jewellery, musical instruments, toys, works of art, etc. Another promising area to begin measuring international flows of artisanal products will be quantifying expenditure by tourists on craft items. Data on consumer spending is of great importance to define better the cultural and socio-economic impact of the crafts sector, as well as to help the sector’s managers determine priorities in terms of training, production and promotion. Research in this area is being undertaken, and a UNESCO Index of Tourist’s Crafts Expenditure is under preparation.
2.2. Description of data used3
Goods data Data for cultural goods were extracted from the United Nations (UN) Comtrade database. The database covers about 160 reporting countries or areas, which cover more than 90% of world trade. Valuation is based on customs records in current United States of America dollars (US$) and the trade data are classified using the Harmonised System (HS).
3 For more information on data sources and
methodology, please refer to technical notes.
Services data Internationally comparable data on trade services statistics were compiled using the International Monetary Fund (IMF) classification for Balance of Payments Transactions (BPM5). An extension of the BPM5, called the Extended Balance of Payments Services Classification (EBOPS), was put in place in 2002. The EBOPS classification provides a more extensive breakdown of cultural activities which was not previously available in the BPM5. Thus, this new classification has been useful to the

- 17 -
study of cultural data. The availability of data according to this classification will be further explored in Section 4 which discusses services.
2.3. Methodological issues
Providing an accurate estimation of the trade flows of cultural products is a challenging task. A number of limitations related to the current data needs to be considered in order to have an accurate interpretation of the data presented in this report. These limitations can be broadly classified into two groups. The first one covers aspects of the quality of trade data, such as measurement biases or lack of inter-temporal and international consistency. The second group deals with the specific nature of cultural products which are in need of statistical refinement and development of alternative ways of measuring the intangible assets of cultural products.
2.3.1. Limitations of available trade data
Statistical classifications. None of the international classification systems presents cultural goods or services as a distinct category. Instead cultural products are scattered under several categories and often listed under the generic grouping of “other” or “additional items”, making it impossible to distinguish cultural trade data with the required level of detail.
Sources of statistics for trade of goods. In customs statistics, goods are classified by their observable physical characteristics and not according to the industry of their origin, status of national content, cultural value or similar criteria. Furthermore, national sources show substantial divergence in terms of interpretation and application of international standards, as well as in methodology, periodi-city and accuracy of data. In this respect, import series are usually perceived to have higher reliability than those of exports, since they serve as a reference to impose duties, quotas and other trade restrictions that are absent in the control of exports.
Sources of statistics for trade of services. Trade services data refer to the cross-border supply of services, but they do not cover other forms by which services could be internationally traded, i.e. through consump-tion abroad (the consumer goes abroad to consume a cultural service), commercial presence (the service supplier from abroad is established in the country of the consumer in order to supply the service) and presence of natural persons (an individual enters the country of the consumer to provide the service) (UN et al., 2002). Data on the trade of services are compiled according to the latest classification provided by EBOPS. This version includes more detailed disaggregation of cultural services than in the former BPM5 and has proved to be very useful. However, most countries still report according to the principles of BPM5 or have not adopted a detailed classification for different cultural services. As a result, they do not provide information for the current EBOPS categories which describe these trade flows. Indeed, the countries which have adapted the EBOPS classification to their national statistical systems have placed cultural services under different categories and grouped them with other services, some of which are not cultural in nature. These obstacles, which will be further explored in Section 4 on the topic of services, restrict the estimation of the actual flows and render it almost impossible to make any valid international comparison. Valuation at current US$. The fact that import and export series are presented at current US$ value implies that they are dependent on the evolution of bilateral exchange rates. Changes in relative positions of some countries may be due to temporary factors linked to exchange rate shifts, such as appreciation or depreciation of the dollar compared to the local currency, instead of long-term changes in competitive capabilities.

- 18 -
Intra-firm trade. As a consequence of the globalisation of the value chain in the production of cultural products, some of the trade flows occur due to transactions between a multinational corporation and its local subsidiaries. The transactions known as transfer pricing may actually result in an underestimation of trade figures.
International concentration. International trade data are frequently used to estimate international competition. However, a global estimation of this phenomenon depends not only upon the concentration of supplying countries but also upon the degree of competition within the countries. The statistics presented in this report contain only a partial approach to international concentra-tion in cultural industries.
Electronic commerce. The period from 1994 to 2003 witnessed the rapid develop-ment of ICTs. These technologies, in turn, have considerably modified the environment in which cultural goods and services are created, reproduced and distributed. More-over, the emergence of the Internet as a channel of commerce had a major impact on the exchange of cultural products. Although statistical methods used to measure electronic transactions have been developed, much of this trade is not captured by customs or balance of payments data. This results in an underestimation of actual trade measurement. Obviously, this issue is relevant only for countries where on-line services are suf-ficiently developed. 2.3.2. Limitations due to the special
nature of cultural products
Audiovisual media. In the framework of this report, audiovisual media only covers photographic film, cinematographic films and video games. The last of these is the largest increasing from 80% in 1994 to 88% in 2002. It should be noted that data on feature films are not accurately measured since the cate-gory of cinematographic films is defined
differently across countries. For example, for some countries it only represents TV com-mercials. Due to the specific nature of feature films, other types of data need to be considered (see Box 8).
Intangible assets. Generally trade statistics cannot accurately measure the economic value of copyrighted cultural works sold in foreign markets. Cultural products have both a tangible element, such as the platform of product format, and an intangible element which determines their content and makes them reproducible as many times as desired. This intangible nature of cultural products leads to underestimations of the actual global value of exchanges. For example, trade statistics assign a small value of US$ 100 to an original work protected by copyright, i.e. a film print or a master version, when exported from one country to another. Yet, this origi-nal work may generate millions of dollars in sales and royalties through copies, exhibition rights and reproduction license fees. How-ever, if unsuccessful, this product may gener-ate almost no revenue at all. Thus, trade statistics as they are currently collected cannot reflect the intangible assets or the market value of many of the cultural products being exchanged among countries. This constitutes the main limitation to attempts to measure cultural trade, which ideally requires the formulation of alternative methodologies and statistical classifications.
Copyrights. An accurate evaluation of the flows relating to copyrights is not possible with current trade data which is available, resulting in a shortcoming in the analysis of the trade of cultural products. Data on flows of copyright royalties and licence fees currently available at the international level are very limited and not easily comparable. Furthermore, it is not possible to estimate the share on product price that is paid by importers corresponding to intellectual property for cultural goods coming from other countries.

- 19 -
Origin of product. Only limited information is available on the origin of the cultural content of traded products. The rules applied to origin and destination of imported and exported products relate to the location of where the product is processed, but do not specify the origin of its cultural content. It is possible for the original work and its copies to be produced in different locations. For example, many films created and projected in country A may have been imported in the form of release prints from country B, which benefits from competitive laboratories that process at lower prices. In trade records, the products are declared as originating from country B. However, from a cultural point of view, country B is not considered as the country of origin of this product. 3. Evolution and patterns of interna-
tional trade in cultural goods
This section explores the distribution and trends of world trade in core cultural goods. It presents in detail the status of international flows of cultural goods in 2002 and 2003, and how the situation has evolved since 1994. Section 3.1 highlights the flows of global exports and imports of cultural goods in 2002. Section 3.2 illustrates the evolution and patterns of trade according to geographic and economic areas. Section 3.3 presents a detailed analysis by level of income of reporting countries. Through a country-level analysis, Section 3.4 presents international patterns of demand and supply of core cultural goods for selected countries. Finally, Section 3.5 analyses the role of the different
core cultural categories in the flows of cul-tural goods over the last ten years. The analysis focuses on changes which have taken place between 1994 and 2002. Since data for 2003 is not available for all countries, data for 2003 are only used in Section 3.4 which presents individual country case studies. 3.1. Brief overview
Customs-based data show that trade in core cultural goods increased between 1994 and 2002, from US$ 38 billion to US$ 60 billion. Figures 2 and 3 present an overview of the level of global exports and imports of core cultural goods in 2002. These figures illustrate the level of concentration within a limited number of countries which participate in the trade of cultural goods. Based on customs data, high-income economies are the largest producers and consumers of cultural goods. In 2002, the United Kingdom was the biggest producer of cultural goods with US$ 8.5 billion, followed by the United States of America with $US 7.6 and China with US$ 5.2. The United States of America was the biggest consumer of cultural goods in 2002 with US$ 15.3 billion, which was twice more than imports of the United Kingdom, which was the second largest consumer with US$ 7.8. Germany was the third largest im-porter of cultural goods with US$ 4.1 (see Statistical Tables I in Annex I). The following sections analyse in detail these results by giving other pertinent information that provides a more complete picture of the flows of cultural goods.

- 20 -
Figure 2. Exports of core cultural goods in million US$, 2002
Exports in million US$
< 10
10 - < 100
100 - < 1,000
1,000 +
Not part of the study
Source: UIS based on data from UN Comtrade, DESA/UNSD, 2004.
Figure 3. Imports of core cultural goods in million US$, 2002
Imports in million US$
< 10
10 - < 100
100 - < 1,000
1,000 +
Not part of the study
Source: UIS based on data from UN Comtrade, DESA/UNSD, 2004.

- 21 -
3.2. Trade by region and economic areas4
As shown in Figure 4, from a regional perspective the European Union 155 (EU15) countries occupied the leading position in exporting cultural goods in 2002, with a percentage share among all reporting countries of 51.8%. This percentage de-creased slightly from 1994 when it was 54.3%. In 2002, Asia appeared as the second largest exporting region with 20.6% share, due to the growth in share of Eastern Asia which doubled between 1994 and 2002 from 7.6% to reach 15.6%. As a result, North America became the third region for export-ing in 2002 with 16.9%, down from 25% in 1994. The less prominent situation of Latin America and the Caribbean (LAC) in 1994 improved slightly in 2002 with a percentage share that increased from 1.9% to 3%. Exports from Africa and Oceania accounted for less than 1% share in 1994 and this level remained the same in 2002 (see Statistical Tables II in Annex I).
Statistical Tables II (see Annex I) show some striking patterns in importation of cultural goods among the different regions. EU15 countries still led cultural trade in 2002 with a share of 40.6% (see Figure 5), showing a slight decrease compared to 1994 when the share was 43.1%. Furthermore, the trend for the last ten years shows that North America increased its position mainly due to the United States of America, with 26.7% of the share in 1994 and reaching 30.1% in 2002. Asia also experienced a slight increase during this period. By contrast, LAC and Oceania countries saw their share in world imports reduce from 4.4% in 1994 to 3.6% in 2002 and from 3.9% to 2.5% respectively. African countries only played a marginal role in 2002 within the international trade of cultural flows with 1% of the total trade value in current US$ in imports.
Figure 4. Exports by region of core cultural goods, 2002
Eastern Asia, 15.6%
South Central Asia, 0.5%
Western Asia,0.5%
South Eastern Asia, 4.1%
Other Europe, 6.2%
Africa, 0.4%
Oceania, 0.6%
Asia, 20.8%
LAC, 3.0%
EU15, 51.8%
North America, 16.9%
Source: UIS based on data from UN Comtrade, DESA/UNSD, 2004.
4 For composition of country groupings, see Annex VI, “Composition of regions and economic groupings”. 5 Compared to other economic regions, EU15 figures are over-valued. Most shipments from EU15 countries are
intended for other EU15 partners, thus registered as international trade even though these are transactions taking place within a single market.

- 22 -
Figure 5. Imports by region of core cultural goods, 2002
EU15, 40.6%
LAC, 3.6%
North America, 30.1%
Western Asia,1.0%
South Eastern Asia,1.5%
South Central Asia,1.3%
Eastern Asia,10.9%
Other Europe, 7.5%
Oceania, 2.5%
Africa, 1.0%
Asia, 14.7%
Source: UIS based on data from UN Comtrade, DESA/UNSD, 2004.
The EU15, the North American Free Trade Agreement (NAFTA) and, at a much lower level, the Association of South East Asian Nations (ASEAN) are the regional trade agreements which constitute the largest share of world trade of cultural goods (see Statistical Tables II in Annex I). Other economic groupings experienced increases in their share in world trade between 1994 and 2002, however their global weight is still quite limited. Individually, none of them reached a 1% of share either for exports or imports. During the last ten years, ASEAN has emerged as a prominent trading block for cultural goods at global level. This is espe-cially true for exports, where ASEAN’s world share rose from 3.6% in 1994 to 4.5% in 2002. This increase is mainly due to the sectors of recorded media and books, which grew during this period at an annual rate of 8.9% and 4.2% respectively.
In contrast with the rise of ASEAN, MERCOSUR6 faced a decline in exports, with a decrease from US$ 229.3 million in 1994 to US$ 167.3 million in 2002. This de-crease is explained by the shrinkage in exports of books, newspapers and periodicals. In this region, the book production industry changed its way of processing in the 1990s. While pre-publishing and book-editing activities are for the most part still carried out in the MERCOSUR countries, the actual printing has been relocated outside the MERCUSOR region. Thus, countries such as Argentina and Chile, which were key producers in books until the early 1990s, faced a substantial drop in their exports from 2000 onwards. 6 Countries of the South Common Market.

- 23 -
Box 3. Global markets of cultural and creative industries
The growing economic importance of cultural and creative industries has redefined the strategic signifi-cance of cultural goods and services today. To complement the overview on the role of trade of cultural products, Figure 6 shows the economic importance of the entertainment and media markets which, according to the E&M Outlook 2004 by Price Waterhouse Coopers (PWC), is estimated at US$ 1,228 billion for 2003. Taking a broad approach on the cultural and creative industries, the E&M Outlook provides global analyses and market forecasts for 14 industry segments, including television networks (broadcast and cable) and distribution (station, cable and satellite), filmed entertainment, recorded music, video games, radio, books, newspapers and magazine publishing, as well as advertising, theme and amusement parks, and sports. North America represents the largest market with 43.5% share, equivalent to US$ 523 billion for the United States of America and US$ 23 billion for Canada. Europe, Middle East and Africa (EMEA) are second with US$ 450 billion, followed by Asia with US$ 229 billion and Latin America with US$ 32 billion.
Figure 6. Entertainment and media markets by region (in million US$), 2003
EMEA, 35.8%
Asia Pacific,18.2%
Latin America, 2.6%
North America,
43.5%
U.S.A., 41.6%
Canada, 1.9%
Source: Global Entertainment and Media Outlook 2004-2008, PWC.
3.3. Trade by level of income
This section presents the change in the export and import flows of core cultural goods between 1994 and 2002 based on the income classification of countries according to the World Bank Atlas method7. It also uses trade
coverage ratio, as an indicator of trade deficit, to highlight the relative performance of each country grouping for every category. These two approaches aim at better tracking the different ways in which country groupings integrate into the global markets for core cultural goods.
7 Economies are divided according to the 2003 Gross National Income per capita, calculated using the World Bank
Atlas method. The groups are: low income, US$ 765 or less; lower-middle income, US$ 766-3,035; upper-middle income, US$ 3,036-9,385; and high income, US$ 9,386 or more. The use of Purchasing Power Parities (PPPs) was considered but, since no PPPs are available for 50 countries, the World Bank Atlas method was used.

- 24 -
3.3.1. Main trends
An analysis based on classification by level of income (see Figure 7) shows that high-income economies have kept their leading position in exports during the last ten years. The most substantial growth occurred for lower-middle-income economies from 1995 onwards. As shown in Statistical Table III-3 (see Annex I), developing countries and countries in transition8 show a higher average annual growth for exports, in current US$ value, from 1994 to 2002 for each cultural compo-nent. Although these results might seem encouraging for developing countries and countries in transition, the country-level analyses, presented later in the document, will show that these figures are heavily dependant on a small number of countries which domi-nate most of the trade of cultural goods.
Moreover, in absolute terms, developing countries and countries in transition still lag considerably behind the high-income econo-mies. The value of exports in 1994 for high-income economies was US$ 33 billion - eleven times more than the value of exports in all other countries (US$ 3 billion). In 2002, the export value of high-income economies (US$ 44 billion) was five times more than the value of exports of all other countries together (9 US$ billion). Nonetheless, as shown in Section 3.3, the situation varies greatly within the different categories of cultural goods.
Figure 7. Total exports value of core cultural products, 1994-2002
0.1
1.0
10.0
100.0
1994 1995 1996 1997 1998 1999 2000 2001 2002
Low income economies Lower-middle income economies Upper-middle income economies High income economies
Exp
orts
in b
illio
n U
S$ (
log
scal
e)
Source: UIS based on data from UN Comtrade, DESA/UNSD, 2004.
8 Developing countries and countries in transition are grouped under three categories: low-income, lower-middle-
income and upper-middle-income economies.

- 25 -
Figure 8 shows that low-income economies and lower-middle-income economies experi-enced a rapid growth in their imports, whereas growth was steadier for the upper-middle-income economies and high-income economies. However, the overall trend is less marked than the trend for exports. The level of imports is substantially higher for high-income economies with US$ 44 billion in
2002, compared to the US$ 9 billion for the other three categories (low-income, lower-middle income and upper-middle income). However, the situation had slightly improved for developed countries and countries in transition between 1994 and 2002.
Figure 8. Total imports value of core cultural products, 1994-2002
0.1
1.0
10.0
100.0
1994 1995 1996 1997 1998 1999 2000 2001 2002
Low income economies Lower-middle income economies Upper-middle income economies High income economies
Imp
orts
in b
illio
n U
S$ (
log
scal
e)
Source: UIS based on data from UN Comtrade, DESA/UNSD, 2004.
3.3.2. Evaluating the cultural trade balance
Figure 9 and Statistical Tables III (see Annex I) distinguish between group of countries which are net importers and those which are net exporters of cultural goods. They also show how the trade balance of country groupings by level of economy has evolved during the last ten years.
The trade balance for lower-middle-income economies, which was 94.7 in 1996, has continuously improved its position since then to reach 200 in 2002 for all cultural goods. The analysis by category shows that lower-middle-income economies are net exporters especially in visual arts and audiovisual media.

- 26 -
Figure 9. Trade coverage ratio of core cultural goods by level of income, 1994-2002
0
50
100
150
200
250
1994 1995 1996 1997 1998 1999 2000 2001 2002
Low income economies Lower-middle income economies Upper-middle income economies High income economies
Tra
de c
over
age
rati
o
Source: UIS based on data from UN Comtrade, DESA/UNSD, 2004.
In 1994, the coverage ratio of high-income economies was close to the equilibrium for core cultural goods. But in 2002, the drop in the figure from 90 to 79.5 shows marked deterioration of the trade balance over the years. High-income economies had an equal balance only in newspapers, periodicals and recorded media in 2002. Increasingly they became net importers of visual arts from 63.6 in 1994 to 55.3 in 2002. Similarly for audio-visual media, the deficit of the trade balance expanded from 67.8 in 1995 to 36.8 in 2002. The low-income economies faced increasing negative trade balance for core cultural goods from 95.2 in 1994 to 32.8 in 2002. They were net exporters for audiovisual media and visual arts and heritage in 2002. Statistical Table III-4 (see Annex I) shows that during this period no clear pattern could be identified since the results were unpredictable.
The upper-middle-income economies contin-ually faced unbalance and volatility between 1994 and 2001. Equilibrium was reached in 2002 only due to audiovisual media which accounted for a great proportion of core cultural goods, while upper-middle-income economies were still net importers for other categories. Trade coverage ratio is defined as exports value divided by imports value in current US$ multiplied by 100. It is used to identify whether a country is considered as a net exporter or importer of cultural goods. It is not only a way of visualising the foreign trade balance but also gives a measure of exports relative to imports. A value of 100 indicates that the foreign trade balance is equal for core cultural goods. When the results are higher than 100, exports are larger than imports in value terms for the category concerned.

- 27 -
3.3.3. Identification of some trading countries
This section focuses on an analysis of the relative position of exports and imports separately for a number of developing countries and countries in transition (falling under low and middle economy categories).
The emphasis is on lower- and middle-income countries to examine whether they can challenge high-income economies since little is known about trade flows in these countries.
Figures 10 and 11 identify which countries play a significant role within the various country groupings categorised by level of income (defined as low-, lower-middle- and upper-middle-income economies). They are only used to help identify trade patterns in countries within the same category. They also
reflect the level of exports and imports that are linked to other factors, such as the size of a local market, infrastructure, etc.
As shown in Figure 10, a correlation is evi-dent between Gross National Income (GNI) per capita and exports of cultural goods. It indicates that inevitably the bigger countries have higher absolute levels of exports to some extent. Figure 10 illustrates that 90% of low-income countries have a marginal role in exporting cultural goods, amounting to less than US$ 10 million in 2002. Most of the African countries which belong to this cate-gory have a less significant role in the trade of cultural goods. Interestingly, India, with US$ 284.4 million, and Indonesia, with US$ 112.3 million, were the only countries from this category which surpassed the US$ 100 million threshold in 2002.
Figure 10. Exports of core cultural goods classified according to level of income, 20029
Source: UIS based on data from UN Comtrade, DESA/UNSD, 2004. World Bank Atlas, 2003.
9 It should be noted that logarithmic axes are used in the graphic. Consequently, minor fluctuations are amplified and larger fluctuations are flattened. Disparities among countries are significantly greater than they appear in the graph. For example, India and China, which are close to one another, have significantly different levels of exports with US$ 284 million and US$ 2.5 billion respectively.

- 28 -
Within the lower-middle-income economies, Chinese exports were substantially higher than for other developing countries and countries in transition. South Africa and Morocco, with levels of exports of US$ 56.9 million and US$ 83.3 million respectively, also emerged as substantial suppliers of cultural goods in 2002. Countries which are beginning to play a more substantial role in exporting cultural goods are Colombia, the Philippines and the Russian Federation. Other countries in the same income category, including some Latin American countries and African countries, hold very low levels of exports.
Two-thirds of the countries belonging to the category of upper-middle-income econo-mies have a middle or high level of exports of cultural goods (above US$ 10 million). In this category, Mexico was the largest
exporter of cultural goods in 2002, with a level of exports above US$ 1 billion, followed by Hungary with US$ 719.5 million.
The correlation between GNI per capita and imports is weaker than for exports. Figure 11 illustrates that countries are less dispersed for imports than for exports, since most countries are minor importers. More precisely, the level of imports was less than US$ 10 million in 2002 for 65% of the low-income economies, which shows the lesser role played by these countries in imports. India, with US$ 803.5 million of imports of cultural goods, differentiates itself from the rest of the countries in this category. Within this group, Kenya, Nicaragua and Zambia had levels of exports higher than US$ 10 million in 2002, totalling US$ 29.4, US$ 30 and US$ 23.3 million respectively.
Figure 11. Imports of core cultural goods classified according to level of income, 2002
Source: UIS based on data from UN Comtrade, DESA/UNSD, 2004. World Bank Atlas, 2003.

- 29 -
In the category of lower-middle-income economies, the average level of imports of cultural goods by country was less than US$ 100 million. China had over US$ 3 billion in imports, whereas the level of imports for Brazil, the Russian Federation, South Africa and Turkey was higher than US$ 100 million. An even greater diversity is apparent for the upper-middle-income economies where countries are dispersed along the scale from less than US$ 10 million to more than US$ 500 million in imports. Mexico is the only upper-middle-income economy with a level of imports above US$ 1 billion.
3.4. Origin and destination of cultural goods: Five case studies
The following section presents examples of trading structure and distribution of trading partners in five countries from different parts of the world. These case studies present different models of integration into the global market of cultural goods in 2003. The analysis identifies key trading partners of the selected countries for both imports and
exports. It gives an indication of the source of imported cultural goods that enter the country and the type of destination of cultural goods for a particular country’s exports. Case 1: The United States of America The United States of America (USA) was net importer of cultural goods in 2003. It was the major importer with US$ 15 billion and the second largest exporter with US$ 7.6 billion. The main destination of American exports was high-income countries in 2003. Indeed, more than one-third of the USA’s exports of core cultural goods went to Canada (see Figure 12). Canada’s share among all partner countries increased between 1994 and 2003, from 31.5% to 40.2%. The position of Canada may be explained by the North American Free Trade Agreement (NAFTA) which provides privileged access of American products to the Canadian market. Mexico was the fourth destination of American exports, benefiting from the same agreement in 2003. The other major destinations of American exports were several high-income countries, such as Japan, Germany and the United Kingdom.
Figure 12. Trade partners of the USA’s exports of core cultural goods, 2003
Switzerland, 5.6%
Japan, 5.2%
Australia, 2.4%
Netherlands, 2.2%
Mexico, 3.6%
France, 2.7%
Rep. of Korea, 2.5%
Germany, 3.3%
China, 1.4%
Rest of available countries, 18.7%
Canada, 40.2%
United Kingdom, 12.0%
Source: UIS based on data from UN Comtrade, DESA/UNSD, 2004.

- 30 -
The main origins of American imports were mainly from China and other high-income countries. The pattern for imports was different, since in 1994 Japan had lost its leading position in favour of China. China became the USA’s major partner, with a
30.8% share in 2003 – this share was only 8% in 1994 (see Figure 13 and Statistical Table IV-1 in Annex I). Leaving Japan and China aside, the source of American imports was concen-trated among the high-income countries in 2003.
Figure 13. Trade partners of the USA’s imports of core cultural goods, 2003
France, 10.9%
China, 30.8%
Spain, 1.8%
Canada, 10.5%
Rest of available countries, 14.7%
United Kingdom, 11.0%
Germany, 4.2%
Japan, 3.6%
Italy, 4.0%
Hong Kong, China, 3.3%
Mexico, 3.0%
Switzerland, 2.1%
Source: UIS based on data from UN Comtrade, DESA/UNSD, 2004.
Case 2: China China started to be an important player in trade flows from the early 1990s. Since the mid-1990s, the Chinese trade balance has become positive. It is also the case for core cultural goods; China is a net exporter with US$ 5.8 billion in exports but only US$ 1.2 billion in imports (see Statistical Table IV-2 in Annex I).
Members of the high-income economies are the main partners of Chinese exports. As stated earlier in the case study for the U.S.A., in 2003 one-third of Chinese cultural goods were going to the USA (see Figure 14). This figure increased slightly between 1994 and 2003 with a percentage share from 31.3 to 34.7 (see Statistical Table IV-2 in Annex I).

- 31 -
Figure 14. Trade partners of Chinese exports of core cultural goods, 2003
U.S.A., 34.7%
Rest of available countries, 11.9%
Japan, 6.6%
United Kingdom, 6.5%
Netherlands, 14.5%
Italy, 1.2%
Australia, 2.0%
Hong Kong, China, 17.9%
Canada, 2.4%
Germany, 2.3%
Source: UIS based on data from UN Comtrade, DESA/UNSD, 2004.
The sources of Chinese imports have been diversified since 1994. The top four partner countries represented 84% of Chinese imports, which had dropped however to 60%
in 2003. Two countries, the USA with 22.2% (a decrease from 29% in 1994) and Germany with 14% in 2003, were the main sources of imports (see Figure 15).
Figure 15. Trade partners of Chinese imports of core cultural goods, 2003
U.S.A., 22.2%
Free Zones, 3.2%
Hong Kong, China, 12.5%
Rest of available countries, 10.7%
United Kingdom, 2.6%
Germany, 14.7%
Singapore, 10.2%
Finland, 7.1%
Japan, 6.4%
Other Asia, nes, 5.7%
Ireland, 4.7%
Source: UIS based on data from UN Comtrade, DESA/UNSD, 2004.

- 32 -
Case 3: South Africa10 South Africa is the only country in sub-Saharan Africa to play a prominent role in the trade of core cultural goods. Zimbabwe is starting to export some goods but at a much lower level. South Africa was a net importer, with total exports of US$ 64.1 million compared to US$ 322.6 million of imports for all core cultural goods in 2003.
South Africa exported about 40% of goods to other sub-Saharan African countries in 2003. Nevertheless, the USA was the first destina-tion for South African goods, with a share of 20% in 2003 (see Figure 16).
Figure 16. Trade partners of South African exports of core cultural goods, 2003
Rest of available countries, 17.3%
Mauritius, 2.6%
Nigeria, 2.6%
Malawi, 3.7%
Angola, 2.9%
Germany, 3.2%
U.S.A., 19.9%
Dem. Rep. of Congo, 2.5%
United Rep. of Tanzania, 3.9%
Zimbabwe, 4.5%
Mozambique, 4.5%
Zambia, 10.4%
Kenya, 2.3%
United Kingdom, 16.2%
Australia, 2.2%
Africa, 39.8%
Netherlands, 1.3%
Source: UIS based on data from UN Comtrade, DESA/UNSD, 2004.
Whereas other sub-Saharan African countries receive a large number of goods from South Africa, they are not the major exporters to the South African market (see Figure 17). Indeed 60% of the South African imports of cultural
goods originated from high-income countries in 2003. Of these, the United Kingdom and the USA provided almost half of the imports in 2003.
10 No trend analysis can be made for South Africa since its trade data were previously amalgamated within the data of
the South African Customs Union until 1999.

- 33 -
Figure 17. Trade partners of South African imports of core cultural goods, 2003
Rest of available countries, 15.3%
United Kingdom, 27.2%
U.S.A., 21.3%
Ireland, 10.7%
Germany, 6.3% Areas, nes, 5.9%
China, 5.2%
Netherlands, 2.6%
Japan, 1.6%
Australia, 1.8%
France, 2.1%
Source: UIS based on data from UN Comtrade, DESA/UNSD, 2004.
Case 4: Brazil Brazil was a net importer of cultural goods in 1994, with a level of imports of US$ 165.9 million, which was three times higher than the value of its exports (US$ 56.9 million) (see Statistical Table IV.4 in Annex I). The balance was negative in 2003 but has fallen since due to the loss of one-third of the value of imports (totalling US$ 105.7 million in 2003) while the value of exports remained almost at the same level. The decrease in Brazilian imports is explained by the drastic drop in the value of video games and recorded media, with a decrease of 50% between 1994 and 2002. Another possible factor is the creation of a free economic zone of Manaus in the mid-1990s which increased Brazil’s own produc-tion capacity and lessened the need for imports.
Mexico is the only country within the Latin American and Caribbean (LAC) region which appears among the top 20 countries importing or exporting cultural goods in 2003. Thus the destination of Brazilian products did not show a strong regional bias in 2003 (see Figure 18). The regional focus was more marked in 1994 when 37% of Brazilian exports were directed to LAC countries but decreased to 21% in 2003. Between 1994 and 2003, Japan lost its position as leader among all recipient coun-tries in favour of Portugal (dropping from 28.8% to 11.9%). In 2003, the USA became the second most common destination for Brazilian exports.

- 34 -
Figure 18. Total trade partners of Brazilian exports of core cultural goods, 2003
South Africa, 1.1%
Angola, 1.1%
Italy, 1.1%
Germany, 0.8%
United Kingdom, 0.8%
France, 1.9%Rest of available countries, 5.9%
Colombia, 4.4%
Chile, 4.3%
Argentina, 4.0%
Mexico, 3.8%
Spain, 3.3%
Peru, 0.7%
Japan, 11.9%
U.S.A., 25.9%
Portugal, 28.9%
LAC, 21.0%
Source: UIS based on data from UN Comtrade, DESA/UNSD, 2004.
In 2003, 45.1% of Brazilian imports originated from only two countries - the USA (with 28.8 percentage share) and the United Kingdom (with 16.3 percentage share) (see Figure 19), while LAC countries represented only 14% of originators of Brazilian imports. Nevertheless, since 1994 Brazil has diversified the prove-nance of its imports to a small degree. The
USA encountered a significant drop in relative share from 41.3% in 1994 to 28.8% in 2003. Japan fell from 10.9% to 3.6%; Argentina and Chile also faced a small decrease in their percentage share. The countries which in-creased their share in 2003 were the United Kingdom, Spain and China.
Figure 19. Total trade partners of Brazilian imports of core cultural goods, 2003
Chile, 2.5%
Uruguay, 3.2%
Peru, 3.3%
Argentina, 5.2%
Sweden, 1.0%
Italy, 2.4%
Hong Kong, China, 2.9%
Portugal, 2.9%
Japan, 3.6%Germany, 4.0%
France, 4.0%
China, 5.2%
Rest of available countries, 6.6%
Spain, 8.2%
United Kingdom, 16.3%
U.S.A., 28.8%
LAC, 14.0%
Source: UIS based on data from UN Comtrade, DESA/UNSD, 2004.

- 35 -
Case 5: Egypt Egypt was a net importer of cultural goods in 2002. Exports of cultural goods from Egypt lost one-third of their current US$ value between 1994 and 2002, with a decrease from US$ 15.5 million to US$ 10.7 million (see Statistical Table IV-6 in Annex I). During the same time, imports gained an increase of one-third in dollar value, from US$ 22.1 million in 1994 to US$ 33.2 million in 2002.
Key destinations of Egypt’s exports were mainly Arabic countries, with 58.4% of the share in 2003, and the USA. (see Figure 20). The destinations of Egyptian exports have changed moderately between 1994 and 2002, since Saudi Arabia remained the first destina-tion country of exports, even tough its share dropped from 25.6% in 1994 to 15.5% in 2002.
Figure 20. Total trade partners of Egyptian exports of core cultural goods, 2002
U.S.A., 8.1%
Morocco, 2.8%
Kuwait, 3.0%
Lebanon, 5.9%
United Arab Emirates, 6.2%
Rest of available countries, 22.6%
Germany, 2.1%
Malaysia, 2.5%
France, 2.6%
United Kingdom, 3.7%
Arabic countries,
58.4%
Jordan, 2.1%
Saudi Arabia, 15.5%
Libya, 7.6%
Yemen, 6.7%
Algeria, 6.6%
Oman, 2.1%
Source: UIS based on data from UN Comtrade, DESA/UNSD, 2004.
Arabic countries account for 22.8% of Egyptian imports of cultural goods (see Figure 21). China and the United Kingdom were the major sources of cultural goods in
2002. The position of the United Kingdom remained the same between 1994 and 2002, while China doubled its share for the same period from 10.3% to 19.2%.

- 36 -
Figure 21. Total trade partners of Egyptian imports of core cultural goods, 2002
Qatar, 1.2%Syria, 2.1%
Saudi Arabia, 2.7%
Kuwait, 3.3%
United Arab Emirates, 4.7%
Lebanon, 8.8%
Italy, 3.8%
France, 4.1%
Germany, 5.7%
U.S.A., 8.8%
China, 19.2%
United Kingdom, 21.8%
Spain, 1.0%Japan, 1.1%
Rest of available countries, 10.8%
Greece, 1.0%
Arabic countries,
22.8%
Source: UIS based on data from UN Comtrade, DESA/UNSD, 2004.
3.5. Components of trade
This section presents a detailed analysis of the main core cultural categories. It looks at the share of each sector in relation to the global trade of core cultural goods, the evolution of exports and imports, and the position of main trade players. The analysis is based on Table 1 and Statistical Tables II, III and V (see Annex I). According to customs data, the trade of core cultural goods almost doubled from US$ 39.3 billion in 1994 to US$ 59.2 in 2002. However, based on these figures, it represented approxi-mately 1% of the total trade in 2002. This percentage has remained the same during the last ten years. These figures might look surprising in the light of the perceived grow-ing importance of cultural industries in the world economy. In order to assess the real value of cultural industries and the interna-
tional exchanges they generate, there is a need to draw data from sources other than customs. Such data would relate to both cultural production and markets. Table 1. Trade11 of core cultural goods,
1994-2002
Core cultural goods
2002 value
in billion US$
Share in
2002
Change in share between
1994-2002
Heritage goods 2.2 3.8 -13.9Printed media 18.2 30.0 -16.6 Books 11.3 19.1 -14.4 Newspapers and periodicals 4.5 7.7 -23.1 Other printed matter 2.4 4.0 -13.2Recorded media 19.0 32.0 -1.0Visual arts 11.3 19.1 -3.6Audiovisual media 8.5 14.3 117.4Total of core cultural goods 59.2 100
Source: UIS based on data from UN Comtrade, DESA/UNSD, 2004.
11 Trade is calculated as the sum of exports plus imports divided by two.

- 37 -
Table 1 shows that audiovisual media experi-enced the most substantial change in relative terms during this period, while printed media lost its leading position. However, recorded media (31%), printed media (30%) and visual arts (20%) kept their leading position in 2002 within the international flows of cultural goods. Audiovisual media represented only 14% of this trade. A detailed analysis by individual cultural category is presented below.
3.5.1. Heritage goods
The category heritage goods corresponds to ‘collections and collector pieces’ and ‘antiques of an age exceeding 100 years’. These two items are not likely to be fully representative of heritage goods, hence a shorter analysis is presented in this section. Since this category is not fully covered, this could also explain the relative marginal role of heritage goods within the trade of cultural goods with a 3.7% share and value of US$ 2.2 billion in 2002. For imports and exports, high-income economies dominated the market with a share of over 98% in 2002. This share remained at the same level between 1994 and 2002.
Within the category of heritage goods, Europe plays a major role, having an 87% share of exports in 2002 and 38.5% in imports. North America increased its share from 1994 to 2002, from 41% to 54%.
In exports, the United Kingdom was the single country to dominate this market in 2002 with a value of US$ 1 billion, representing 58% of this category. Interestingly, Zimbabwe experienced a high average annual growth rate during 1994 and 2002 and became the ninth largest exporter country in 2002, though with a mere 1% share.
The USA led imports of heritage goods with US$ 1.4 billion, accounting for a 52.7% of the share in 2002. Taken together with the United Kingdom, these two countries held a 78.2% share in 2002.
3.5.2. Printed media
The category of printed media comprises books, newspapers, periodicals and other printed matter. Together, they represent 30.8% of the share of total trade of cultural goods, of which 19.1% represents the trade of books, which is the major component within this category (see Table 1). In 2002, trade of printed media as a whole amounted to US$ 18.2 billion, including US$ 11.3 billion on the trade of books, US$ 4.5 billion on newspapers and periodicals, and US$ 2.4 billion on other printed matter.
In 2002, printed media was now the second most traded category, behind recorded media which dropped from the leading 36% share that it held in 1994. The fact that this trend is especially noticeable for printed newspapers and periodicals sheds light on the nature of transformations which these industries are undergoing. Certainly, the impact caused by the emergence of new media, as a result of the development of digital technology, cannot be ignored. Competition with electronic sources of information may be having an influence on the need for international exchanges of printed newspapers. In high-income econo-mies, the percentage of newspapers having a website is estimated to have almost doubled, from 40% to 70% between 1998 and 2002 (World Association of Newspapers, 2003).
The loss of importance of printed media compared to other cultural goods is explained by the low growth rates that their trade registered during the reported period. International exchanges of newspapers and periodicals had the lowest growth rates, with an average annual increase of 2.1%, while books and other printed matter enjoyed an annual growth of 3.7% and 3.9% respectively between 1994 and 2002 (see Statistical Table III-312 in Annex I). However, the data available also reveal substantial differences in perform-ance among countries according to their levels 12 Printed media comprises books, newspapers and
periodicals and other printed matter.

- 38 -
of income. While the growth in trade of dif-ferent printed media was between 1.8% and 3.4% for high-income countries, all other countries registered substantially higher rates between 1994 and 2002. Despite the fact that low-income economies benefit from average annual growth rates of 12.3% for newspapers and periodicals, 12.5% for books and 14.3% for other printed matter, their share in the global trade for these categories of goods remained insignificant during this period. Shipments from high-income economies amount to 86.7% of all exports of books, 87.8% of other printed matter and 93.1% of newspapers and periodicals. Similar figures were observed for imports where flows from all other countries were small (see Statistical Tables II in Annex I).
Europe registered higher volumes of exchanges in all categories for both imports and exports. In 2002, European countries accounted for 51.3% of world trade in other printed matter, 53.1% in books and 66.6% in newspapers and periodicals (see Statistical Tables IV in Annex I). North America is the second most active region in this area, with its trade amounting to between one-third and two-thirds that of Europe, depending on the specific category. In general terms, the region-al structure of trade remained stable between 1994 and 2002, with Europe and North America capturing most of the exchanges. The figures reveal minor participation by Asian countries, while African countries registered insignificant levels of trade.
Germany, Italy, Spain, the United Kingdom and the USA were the world’s largest export-ers in 2002. In this year, their joint supply accounted for 57% of global exports. As for imports, Canada, France, Germany, the United Kingdom and the USA constituted the main destinations with 76% of all imports for the same year (see Statistical Tables V in Annex I). It is interesting to note that the high growth rates were registered by some non-traditional exporters, such as Malaysia and China for books or the Czech Republic and Poland for newspapers and periodicals. This phenomenon is partly explained by their initial low amount of exports, while their market share (with the exception of China) usually remained at 1%.
3.5.3. Recorded media
This category comprises gramophone records, discs for laser-reading systems for repro-ducing sound only, magnetic tape (recorded) and other recorded media for sound reproduction.
Within the international flows of cultural goods, the share of recorded media fell only by 1% between 1994 and 2002. In 2002, this category represented a substantial share of 32% of the value of all trade of cultural goods.
The aggregate value of recorded media worldwide in 2002 was US$ 19 billion in imports and US$ 18.4 billion in exports. These figures should be put into perspective by comparing them with the global size of the sound recording industry13 (see Box 4).

- 39 -
Box 4. The music sector: Market for recorded media
Despite the widely reported crisis during the mid-1990s, the music industry still remains powerful and plays an important role in the economic growth of many countries at all level of development. The music industry’s reported global retail sales for 2002 reached 3 billion units and amounted to US$ 31 billion. In 2002, global music markets were led both in volume and value by the USA (39.8% of world sales), Europe (34.6%) and Japan (14.8%). Asia shared 17.7% of the global music market and was the third largest player, with Japan accounting for around 80% of sales in the region. Latin America, where music was considered the fastest growing segment of the global entertainment economy in the mid-1990s, had only 3.2% of the global music market in 2002. The African music market was the smallest regional market, with only US$ 130.7 million in 2002, representing a mere 0.4% of total global sales. However, the basis for assessing the size of the African market seems questionable as data on recording sales were only available for two countries. A key element in understanding international flows of recorded music is the domestic demand for locally produced music and its relation to imported recorded music. Figure 22 illustrates the market share of imported contents in selected music markets. The data for locally produced music are available only for recording sales, and even these figures are incomplete. Existing data suggest a 10% growth in the world’s average demand for domestic repertoires during the 1990s, although since 2000 there is some evidence of demand slowing down. The preference for domestic repertoire might indicate a certain improvement of the ability of local music industries to serve their domestic audiences; it does not necessarily mean that high local repertoire is always produced and distributed by local companies only.
Figure 22. Repertoire origin as % of market value14, 2002
0%
10%
20%
30%
40%
50%
60%
70%
80%
90%
100%
Eg
ypt
U.S
.A.
Ind
ia
Zim
bab
we
Sau
di A
rab
ia
Jap
an
Th
aila
nd
Bra
zil
Rus
sian
Fed
.
Rep
ublic
of K
orea
Fra
nce
Qat
ar
Leb
anon
Uni
ted
Kin
gdom
Ukr
ain
e
Bah
rain
Rom
ania
Arg
enti
na
Ch
ina
Isra
el
Mex
ico
Bu
lgar
ia
Pak
ista
n
Sou
th A
fric
a
Swed
en
Can
ada
Irel
and
Ch
ile
Au
stra
lia
Mal
aysi
a
New
Zea
lan
d
Domestic International Others
Source: The recording industry in numbers, 2003, IFPI.
13 Global reported retail sales in 2002 were about 3 billion units for a value of US$ 31 billion (see Box 4). 14 Multi-artist included where supplied and “Others” covers regional, classical and multi-artist.

- 40 -
In regard to trade by level of income, Statis-tical Tables II (see Annex I) show that in 2002 high-income countries still held a leading position and accounted for 94.1% of global exports and 82.5% of global imports of recorded media (the USA and EU15 countries in Europe alone accounting for 77.6% and 63.5% of global exports and imports respec-tively). However, encouraging signs also have emerged for developing countries and coun-tries in transition. They saw their position rise from an 8.8% share in 1994 to 17.5% in 2002, enjoying a particularly rapid annual growth rate during this period (20% on average for the three categories). However, as in other sectors of cultural industries, this growth has not been homogeneous and has benefited only a small number of developing countries and countries in transition, notably those in Asia. Asia ranked third among all regions exporting musical industry goods, growing from 7.6% of world exports in 1994 to 18.2% in 2002, and from 15.8% of global imports to 21.8%. In 2002, the three principal exporters (Germany, Ireland and the USA) accounted for 40.4% of global exports, followed by the
United Kingdom (8.9%) and Singapore (8.4%). Imports were slightly more evenly spread among the five leading importers (Canada, France, Germany, the United Kingdom and the USA) which together accounted for 38% of global imports. Hence the importance of Ireland, Japan, Germany, the United Kingdom and the USA as the major participants in physical trade in music-related products were apparent. The advan-tageous position of Ireland was mainly due to the presence of a number of multinationals specialising in software and information technology, contributing to the production of music-related products. However, the data presented above do not provide a comprehensive picture of the direc-tion and magnitude of international music flows. Since they are based on customs information, they can only show the imports and exports of tangible musical products, whereas much of the trade occurs in the form of original masters which are then processed locally for domestic retail distribution. Box 5 illustrates the difficulties of capturing the value of such intangible assets.
Box 5. Capturing the value of intangible assets: The case of the Jamaican music copyrights
It has been estimated that in 2000 Jamaican music represented nearly 3.5% share of the global music market, generating revenues of over US$ 1 billion. However, little of this business activity took place in Jamaica, whose domestic music industry has been assessed within the range of US$ 60-100 million for the year 2000. This includes income from sales of recorded music estimated at US$ 40-50 million and income from foreign tours, local concerts/festivals and other activities at US$ 20-25 million. These figures, however, do not include the substantial amount of revenue generated worldwide from public performance royalties due to Jamaican songwriters, interpreters and music publishers, as well as similar royalties earned by music producers and performers which bear no relation to actual record sales. For Jamaican composers and performers alone, royalties received by European, American and Asian copyright royalty collecting societies are estimated at about US$ 385 million. Sources: Music and the Jamaican Economy, Michael Witter. WIPO UNCTAD 2000. Becoming a globally competitive player : The case of the Jamaican Music Industry, Discussion paper n° 138,
UNCTAD Zeljka Kozul-Wright and Lloyd Stanbury, 1998.

- 41 -
3.5.4. Visual arts
This category comprises paintings and other materials, such as engravings, prints, original sculptures and statuary and other ornaments. In absolute terms, trade of visual arts amount-ed to US$ 11.3 billion in 2002. With a share of 20.4% in total trade of cultural goods, these items represented the third most traded category after recorded media and printed media, a relative position that has remained steady between 1994 and 2002 with a share change of -3.6. The figures for this category may not be internationally comparable due to several reasons, including the regulation of the market which is governed by laws that restrict exports. Another reason would be the lack of clarity of the definition and its inherent bias towards Europe.
Although both exports and imports of visual arts have grown slightly less than audiovisual and recorded media during the reported period, they increased at a remarkable average annual rate of 4.8% and 5.3% respectively between 1994 and 2002. This growth has been especially important for developing countries and countries in transition. Low-income economies had observed an average annual increase of 8.4% in exports and 9.2% in imports; while these figures reached 12% and 11% for lower-middle-income economies (see Statistical Table III-3 in Annex I). Upper-middle-income economies showed a robust annual growth in imports of 7.2%, coupled with a severe reduction of exports of 5.9% between 1994 and 2002. High-income economies performed moderately in terms of growth rates for both flows.
These patterns are explained by the fact that exchange flows, in absolute terms, are mainly concentrated between high-income and lower-middle-income economies. In 2002, high-income economies contributed 71% of world exports and lower-middle-income economies contributed 26.5%. And 96.9% of all imports of visual art goods had high-income economies as their final destination.
An analysis by region reveals that in 2002 European countries were the main exporters of visual art goods, with a world share of 58.3%, of which members of the EU15 alone were responsible for 49.6% of total world exports. However, this figure was lower than the 62.1% that EU15 enjoyed in 1994. In a sense, this relates to the ascension of East Asian countries, whose share in world exports increased from 14.5% in 1994 to 25.1% in 2002. As a result, North America was relegated to second position, with only 10.8% of total exports in 2002. Exports from LAC and Africa are almost non-existent, represent-ing 1.4% and 1.1% respectively of the world total. For imports, data show only two large markets: North America, growing from 33.6% to 43.5% of world share between 1994 and 2002; and Europe, whose share of imports fell during this period from 49.2% to 44.4%. The United Kingdom, China, the USA, Germany and Switzerland were the five largest exporters of visual art goods, with a combined share of 59.9% of world exports in 2002. These countries also constituted the largest world importers, with the exception of China. This could be explained by the fact that these countries serve as marketplaces, where arts and antiques are traded. Thus, the prominent role of London as a central exchange for Europe explains the position of the United Kingdom as the largest world exporter. Finally, in 2002, developing countries, such as Indonesia, Morocco and the Philippines, with a high average annual growth rate during the last ten years, appeared among the top 20 exporters. However, despite this major growth, the share for each of these three countries represented less than 1% of trade across all countries studied.

- 42 -
3.5.5 Audiovisual media
This category covers exposed and developed photographic films, exposed and developed cinematographic films, and video games to be used with a television receiver. The continued rise of the share represented by video games (from 80% in 1994 to 88% in 2002) had reduced the other audiovisual media items to a token presence. Thus, it is video games that are mainly responsible for the evolution of this category, with photographic and cinema-tographic goods being only of secondary importance.
In 2002, trade in audiovisual media goods represented 14.3% of total trade in core cultural goods. Although this share is still lower than that of recorded media, visual arts or books, audiovisual media was the only category whose relative weight has grown during this reported period. The percentage more than doubled between 1994 and 2002, illustrating the increasing importance of exchanges which already amounted to US$ 8.5 billion.
International exchanges of audiovisual media goods have benefited from dynamic growth rates. Data for exports registered an average annual rate of 20.8%, while statistics for imports suggest a more limited but still a significant annual rise of 14% (see Statistical Tables III in Annex I). The fact that both figures are well above the 6% average for total international trade of merchandise confirms the dynamic character of this sector. This is especially remarkable as both export and import flows for all other cultural goods have exceeded the average. The fast expansion of trade flows was accom-panied by changes in the structure of interna-tional exchanges, especially in supply but also noticeably in demand. Lower- and upper-middle-income economies have registered sharp increases in their exports at average annual rates of 36.1% and 35.8% respectively,
while high-income economies registered a much more moderate rate of 13.4% between 1994 and 2002. Consequently, audiovisual media became the single category for which developing countries and countries in transi-tion hold 50% of the exports. International demand had shown a less dynamic evolution, with imports from low-income economies registering the highest growth rate at 17.1% during the same period. Nevertheless, in the case of imports, high-income economies have benefited by an increase in the percentage share compared to other countries. From a regional perspective, the growth of exports originating from Eastern Asia rose from 30.9% of the world total in 1994 to 49.1% in 2002. It eroded the shares of industrialised regions, such as the EU15 and North America, where exports fell from 35.9% and 20.6% in 1994 to 20.4% and 7.8% in 2002, respectively. The rest of Europe has faced a substantial increase during this period due to the level of exports by Hungary. For imports, the Asian growth was, however, moderate from 10.8% to 14.3%, which partially balanced the reduction in the share of imports from North American markets, down to 47.5% in 2002 from 53.1% in 1994. Both imports and exports as a percentage of world total for African countries remained well below 1%.
China, Germany, Hungary, Japan and Mexico, as the five largest exporters, accounted for 60.6% of total world exports in 2002. The main international market was the USA, which alone represented 42.3% of world demand, followed by France; Germany; Hong Kong, China; and the United Kingdom (see Statistical Table V-7 in Annex I). To a great extent, the accelerated growth rates of audiovisual media trade between 1994 and 2002 were due to the performance of China, a country whose video games account for 99% of its audiovisual exports. During this period,
- 43 -
China demonstrated an unmatched compara-tive advantage in the production of video games, being able to increase its exports at an average annual rate of 38.6%. Consequently, by 2002 China had consolidated its position as a leading exporter, with a 28.2% share of the world market and US$ 2.3 billion in exports value, well over the US$ 1.2 billion of Japan, the second largest exporter. An analysis excluding video games and con-sidering only cinematographic and photo-graphic films would give totally different results. In this scenario, China would not remain the largest exporter and India would become one of the largest exporters along with high-income countries. When video games are excluded, the share of Eastern Asia’s exports falls from 50% to 30%. Measuring the international distribution of cinematographic films poses a major challenge for customs statistics. Typically, films are exported to the destination market in the form of goods produced originally, which is then copied and distributed locally. As a conse-quence, the low number of traded goods has a negligible value declared at customs, while the bulk of the international exchanges are
gathered at balance of payments in the forms of receipts for royalties and licenses. A prominent example is India which, based on customs statistics, is not considered among the top exporters of audiovisual media products although it plays a major role as a film producer (see Box 6). To conclude, this section demonstrates the emergence of some developing countries as suppliers of cultural products in a limited range of areas, but their levels of trade are still far behind those of the high-income countries. No such scenario has emerged for imports where the clear demand for cultural goods is still restricted to high-income countries. The absence of the majority of developing coun-tries and countries in transition from the international market in cultural products may be regarded as an indicator reflecting the lack of information on key sectors, such as crafts, resulting in underestimates in data for some of the trade flows that do take place. The pheno-menon of piracy, which was not considered in this report, also has an impact on the exchange of cultural products. However, it would be useful to consider it while studying consumption patterns, as well as other con-textual issues, such as locality, language, popu-lation, socio-cultural traditions, etc.

- 44 -
Box 6. The major role of India in the film industry
With 877 films produced in 2003, India maintained its leading position as the main moviemaker in the world, ahead of the USA (see Figure 23). Indian film production is progressively catering to foreign audiences. Although small by comparison with American productions, the revenues generated by Indian movies abroad have registered a ten-fold expansion in the last ten years.
The experience of serving a massive domestic demand has allowed the Indian film industry to expand its competitive capacity considerably. As an increased sells of some prominent Bollywood15 productions overseas has resulted in financially attractive ventures, Indian filmmakers have realised that the industry is mature enough to approach foreign markets in a more systematic manner. Some films have started to collect 25-30% of their receipts from exports. For the estimated US$ 990 million earned by the whole Indian film sector in 2004, revenues from overseas have already reached US$ 220 million.
Royalties from the reproduction of movies is the most important, but not the sole, source of revenue for the exporting Indian film industry. Income from cable and satellite television, Internet rights, merchan-dising, video, CD and DVD rentals are also important sources of revenue, and Indian productions may obtain as much as 15% of total earnings from music rights only.
Today the value of Indian cultural and creative industries is estimated at US$ 4.3 billion. This sector is growing at an annual rate close to 30%, and analysts forecast that exports may continue to grow by 50% in the coming years. An important factor in this impressive performance is that Indian companies are succeeding in bringing international audiences to the cinemas, in addition to the traditional diaspora communities of the USA, the United Kingdom and the Middle East. This strategy includes expansion to non-traditional countries, both industrialised and emerging, such as Japan and China.
Figure 23. Number of films produced in India and the USA, 1999-2003
764
855
1,013
943
877
758
683
611
543593
0
200
400
600
800
1,000
1,200
1999 2000 2001 2002 2003
India U.S.A.
Source: India Central Board of Film Certification, Federation of Indian Chambers of Commerce
(FICCI), UK Film Council, Motion Picture Association of America (MPAA).
15 In this report, Bollywood movies refers to all Indian commercial movies.

- 45 -
Box. 7 Flows of related cultural goods
Related cultural goods are defined as equipment goods and support materials which serve to create, produce and distribute cultural content. They comprise, for example, blank CDs, cinematographic supplies, TV receivers and architectural plans. Related cultural goods do not necessarily have any cultural content. For the purpose of this report, it was decided to separate them from core cultural goods, such as books or recorded CDs, which do convey cultural content.
In 2002, trade in related cultural goods (US$ 248 billion) was four times that for core cultural goods (US$ 60 billion). These figures result mainly from the nature of products measured. Customs data capture flows of physical goods, which is the main characteristic of the goods considered under the related cultural goods category.
Table 2. Trade of related cultural goods, 1994- 2002
UNESCO Framework for Cultural Statistics Categories
2002 value in billion
US$ Share in
2002
Change in share
between 1994-2002
Equipment/Support material 244.0 98.3 -0.1Musical instruments 3.7 1.5 -13.4Sound player and recorded sound media 167.6 67.5 4.8Cinematographic and photographic supplies 24.9 10.0 -12.6Television and radio receivers 47.9 19.3 -7.2Other related cultural goods 4.3 1.7 3.9Total related cultural goods 248.3 100
Source: UIS based on data from UN Comtrade, DESA/UNSD, 2004.
The main component of this category in 2002 was “sound player and unrecorded sound media”, with a 67.5% share among all categories. This figure probably illustrates the growing importance of the market for DVD players and music, as well as the increasing demand for supports (such as blank CDs or DVDs) for private copying. The second component was TV and radio receivers. Historically strong, the share of this component has shown a tendency to decrease during the last ten years, which is probably due to the fact that this market has already reached its saturation point. Most households are already equipped with TV and radio receivers, which reached, in 2002, 75% and 70% respectively for most parts of the world (ITU, 2003).
Finally, the category “other related cultural goods” refers to architecture plans and advertising. Despite their ingredient of creativity, architecture and advertising goods are, for the purposes of this report, considered as support materials rather than core cultural goods.

- 46 -
4. Measuring international trade in cultural services
For the purposes of this report, core cultural services comprise audiovisual and related services, (including film production, distribu-tion services, broadcasting and sound record-ing services), copyright royalties and perform-ing arts. The related cultural services category covers advertising, architecture services and news information agencies (see Annex I and IV). The analysis of trade in services differs from the analysis of trade in cultural goods since services statistics are quite recent and a historic time series is not available, especially for the categories presented in this section. Hence, it focuses rather on the methodology of measuring trade in cultural services, identi-
fying the relevant categories, analysing the availability of information and presenting the current limitations of using these statistics. 4.1. Audiovisual and related services
As explained in Section 1, cultural services data are not part of the statutory data which countries provide to international institutions, such as OECD and IMF. Therefore, it is diffi-cult to draw a complete picture of interna-tional cultural trade services. However, there is relatively good coverage of the balance of payments item for “audiovisual and related services” as it is a standard component of BPM5.
Some of these data are presented in Figure 24 which shows that in 2002 the USA had the highest level of exports of audiovisual and related services (US$ 7 billion) while the
Figure 24. Audiovisual and related services exports for a selection of countries, 2002
0
1,000
2,000
3,000
4,000
5,000
6,000
7,000
U.S
.A.
Un
ited
Kin
gdom
Can
ada
Fra
nce
Ger
man
y
Hu
ngar
y
Mex
ico
Irel
and
Spai
n
Ital
y
Net
herl
ands
Swed
en
Gre
ece
Arg
enti
na
Japa
n
Nor
way
Aus
tral
ia
Ecu
ador
Chi
na
Bra
zil
Cze
ch R
ep.
0
1
2
3
4
5
6
7
value % share
Val
ue
of a
ud
iovi
sual
ser
vice
s in
mill
ion
US$
% s
har
e of
au
dio
visu
al s
ervi
ces
in t
otal
ser
vice
s
Source: UIS based on data from IMF, Balance of Payments Statistics CD-ROM, 2004.

- 47 -
United Kingdom, in the second position, had only US$ 1.5 billion. For Hungary, Canada and Ecuador, audiovisual and related services represented a higher proportion related to total services with 5.2%, 3.7% and 3.2% shares respectively.
To analyse audiovisual services, it is important to identify all the sub-categories which constitute audiovisual services (broadcasting, feature films, etc.). However, current balance of payments data are not detailed enough to
determine the proportion of each sub-category.
Furthermore, the nature of the trade of broad-casting contents, which is mainly expressed through transactions gathered in the balance of payments, leads to very different conclusions from those obtained through market surveys (see Box 8 on trade in broadcasting programmes between EU and USA). To complete the overview, Box 9 provides other sources of data for audiovisual services.
Box 8. Audiovisual content – assessing trade flows of movie feature films
Several elements are necessary to draw a comprehensive picture of international flows of feature films. The first one is the overall size of the sector. In 2003, the motion picture industry sold over 7.25 billion tickets in 145,598 theatres around the world and generated US$ 21.8 billion in revenues. Secondary exploitation of movie features in the form of different types of licensing, videos and DVD generated revenues of US$ 55 billion, giving a total market value close to US$ 75 billion. The second element is the production of movies. Africa as a whole has produced only 600 movies (UNCTAD, 2002) in its history, a figure which needs to be put in relation to the average production in the USA of 400 movies per year or in India of over 700 movies yearly. Finally, more than one-third of all countries in the world do not produce any films at all. A third element is the penetration of foreign movies into national markets. Since there is a shortage of internationally comparable data on movies by origin, Figure 25 presents the origin of first-time release feature films for a selection of countries. This shows the large penetration of American movies into mostly European countries, despite European legislation protecting their own production. The share of American movies was more than 50% on average between 2000-2002 for most of the countries compared with the marginal share of movies originating from outside Europe or the USA. France was the single exception where national production has a higher percentage (40%) of national first-time release feature films compared to American movies (33%) for the same period.
Figure 25.: Origin of first-time release feature films in a selection of countries, 2000-2002
0%
10%
20%
30%
40%
50%
60%
70%
80%
90%
100%
Lux
embo
urg
Cyp
rus
Slov
ak R
ep.
Bul
gari
a
Bel
gium
Est
onia
Rom
ania
Slov
enia
Nor
way
Por
tuga
l
Au
stri
a
Gre
ece
Tur
key
Lat
via
Den
mar
k
Net
her
land
s
Swit
zerl
and
Pol
and
Swed
en
Ru
ssia
n F
ed.
Spai
n
Uni
ted
Kin
gdom
Ger
man
y
Ital
y
Fra
nce
National Europe U.S.A. Others Sources: Focus 2004, World Film Market Trends and 2003 Yearbook, Film and Home Video, Volume 3,
European Audiovisual Observatory; Screen Digest, September 2004; UNCTAD 2002 AV in Developing countries Complete.

- 48 -
Box 9. Audiovisual content – trade in broadcasting programmes
Figure 26 presents trade flows of broadcasting contents for 1995-2000 between the European Union (EU) and North America, estimated from the revenues obtained by their domestic companies in the other’s market. As shown in the figure, this trade is far from balanced. Although exports from both sides had been steadily growing, the proportion of the flow from the EU to North America remained the same. Exports from the EU to North America have fluctuated around a mere 6.3% of the value of exports from North America to the EU (the highest value 13.5%, which was reached in 1997). Thus EU countries sustained a trade deficit fifteen times the total value of their exports to North America.
Figure 26. Estimates of the trade in audiovisual programmes (TV only) between the European Union and North America, 1995-2000
2,062 1,934
3,187
4,384
-1,933
-2,484
-1,668
-2,874
-3,497
2,645
3,781
129 161 266 313 284 275
-4,109
-5,000
-4,000
-3,000
-2,000
-1,000
0
1,000
2,000
3,000
4,000
5,000
1995 1996 1997 1998 1999 2000
Mill
ion
US$
North American revenues in European UnionEuropean revenues in North AmericaNet
Source: ETS/European Audiovisual Observatory, 2002.

- 49 -
4.2. Other cultural services
Table 3 presents the limited data on cultural services statistics which are available in terms of country coverage and detail. Even though there are few data, the trend shows some improvement from a few years ago when no data were available. Nevertheless, this indicates the difficulty of obtaining any internationally comparable data in the trade of cultural services. Unlike with cultural goods, it is not possible to identify the different categories in the trade in services. Key components, such as services related to performing arts or broadcasting, are difficult to determine. The use of EBOPS classification started in 2002 mainly with OECD countries (see detailed list in Annex V-A). Within this classification, some cultural components of services are included in the category “other personal cultural and recreational services” category, and the part dedicated to cultural services16 is thus difficult to isolate. The coverage of this particular category is minimal, with only Australia and the Czech Republic providing data for 2002. The coverage is superior for categories which are part of “related services”, such as “computer services” and “information services”, where 60% of the countries provided the data for 2002. Among the few countries providing data in this field, different cultural services show different patterns of growth. These data are
based on EBOPS categories provided by country, as well as national classifications. No accurate comparisons can be made at this stage, because no harmonisation of the categories has yet been made. Nevertheless, it gives an indication of what kind of data can be obtained. It shows as well some useful breakdowns for copyrights where, for example, only the USA makes the distinction between books and music recordings. The data on copyright mentioned above are key in the analysis of cultural products due to the distinctive nature of cultural products whose market value includes a certain amount of intellectual property rights. Unfortunately, the only alternative data currently available relate to revenues generated by collecting societies of authors’ rights. These give only a partial view of the international exchanges of copyrights (see Box 10).
To conclude, some cultural services data have started to be available during recent years. Unfortunately, the current limited coverage prevents the presentation of a complete picture of the trade of cultural services. Furthermore, in order to establish comparable data at a global level, harmonisation is still warranted. Countries should be encouraged to provide a greater range of data to illustrate evolution of cultural services. Additional work is also needed to identify relevant indicators.
16 For more details on services data, see Technical Notes.

- 50 -
Table 3: Selected detailed trade cultural services, 2001-2002
EXPORTS IMPORTS
EBOPS categories or national categories Annual change % 2001-2002
Annual change % 2001-2002
AUSTRALIA Information services 0.34 -0.15
News agency services -0.43 -0.73Other information provision services 1.55 0.77Other cultural royalties and license fees (1) (a) -0.16 0.26 Music (a) 0.20 0.08 Computer software (a) -0.30 0.21 Other (a) -0.07 0.35
Architectural services (a) 0.93 ..Audiovisual and related services 0.20 0.22Other cultural and recreational services (1) 0.19 0.24
Other (2) 0.19 0.43CANADA Royalties and license fees -0.05 0.00
Other royalties and license fees (1) -0.03 0.01Copyrights and related rights -0.09 0.08Software and other royalties -0.07 -0.03
Audiovisual and related services -0.02 0.10CZECH REPUBLIC Information services -0.08 0.66
News agency services .. .. Other information provision services -0.08 0.66
Audiovisual and related services (b) 0.14 0.21Other cultural and recreational services (1) (b) -0.01 0.25
Other (c) -0.04 0.25NEW ZEALAND Royalties and license fees 0.56 0.10
Software royalties and license fees 0.26 0.69Other 0.72 -0.01
UNITED STATES OF AMERICA Royalties and license fees (1) 0.07 0.15
Other royalties and license fees (3) -0.03 0.13Books, records, and tapes (3) 0.00 0.13Broadcasting and recording of live events (3) 0.59 6.22General use computer software (3) (4) (b) -0.04 0.06Other (3) (4) 0.11 0.12
Audiovisual and related services 0.05 0.48Source: UIS based on data from Statistics on International Trade in Services, Volume I, OECD/ Eurostat, 2004.
Footnotes: (1) This category contains more sub-categories than displayed. (2) Health services credits for 2000 are included under “Other personal, cultural and recreational
services, Other”. (3) Royalties and license fees receipts and payments between affiliated enterprises are included in item
“Other royalties and license fees, Other”. (4) Prior to 1997, “General use computer software royalties and license fees” are included in “Other”. (a) 1999-2002. (b) 1997-2002. (c) 1998-2002.

- 51 -
Box 10. Revenues collected by copyright management societies
Figure 27 presents data on the collection of copyrights for 210 management societies in 109 countries that are affiliated to the International Confederation of Authors and Composers Societies (CISAC). Data cover only amounts raised by licensing activities of these societies in their national territories thus income from international exchanges is not included.
Copyright management societies collected US$ 6.8 billion in 2002 in royalties. European societies alone collected almost US$ 3.8 billion, which represented 57% of the world’s total, while North America and Asia-Pacific obtained 25% and 17% respectively of total copyright payments. Collections by Latin American and African countries were negligible and reached less than 3% of total payments.
Figure 27. Collection of copyright income by region, 2002
Western Europe38.5%
Other Europe17.1%
Africa0.4%
Latin America2.5%
Asia Pacific16.8%
North America24.8%
Europe55.5%
Source: Survey of the CISAC Member Societies’ Collections in their National Territories for the
Years 2000-2002, CISAC, 2003.

- 52 -
REFERENCES Alonso Cano, G., M. del Corral, and G. Poussin, UNESCO, 2000, “Culture, Trade and Globalisation: 25 Questions and Answers”, UNESCO Publishing, Paris. International Telecommunication Union (ITU), 2003, “World Telecom Development Report”, Geneva. OECD/Eurostat, 2004, “Statistics on International Trade in Services”, Volume I. Price WaterHouse Coopers (PWC), 2005, “Global Entertainment and Media Outlook: 2004-2008”. UN Statistics Division (UNSD), 2004,“International Merchandise Trade Statistics, Compilers Manual”, UN Statistics Division, New-York. UN, European Commission, IMF, OECD, UNCTAD and WTO, 2002, (UN et al., 2002), “Manual on Statistics of international trade in services”, United Nations Publication, New York. UNCTAD, 2004, “UNCTAD XI High-Level Panel on Creative Industries and Development. Backgrounder UNCTAD XI Creative Industries and Development”, (TD(XI)BP/13 4 June 2004)”, Geneva. UNCTAD, 2002, “Audiovisual Services: Improving Participation of Developing Countries” (TD/B/COM.1/EM.20/2 30 September 2002), Geneva. UNESCO, Cultural Policies Division, UIS with Phillip Ramsdale, 2000, “International Flows of Selected Cultural Goods, 1980-98”, UNESCO Publishing, Paris. UNESCO Division of Statistics and Mrs Fariba Razavi Tavakoli, 1992, “International Flows of Selected Cultural Goods, 1970-87”, UNESCO Publishing, Paris. UNESCO/ITC, 1997, “International Symposium on “Crafts and the International Market: Trade & Customs Codification”, Manila. UNESCO, 1986, “The UNESCO Framework for Cultural Statistics”. United Nations Population Division (UNPD), 2003, “World Population Prospects: The 2002 Revision”, New-York. World Intellectual Property Organization (WIPO), 2003 “Guide on surveying the economic contribution of the copyright-based industries”, WIPO, Geneva. World Association of Newspapers (WAN), 2003, “World Press Trends 2003”. World Bank, 2003, “Urban Development Needs Creativity: How Creative Industries Affect Urban Areas. Development Outreach”, Washington.
- 53 -
Other sources: Statistics Canada, Jamie Carson, 2004, “Culture Goods Trade Estimates: Methodology and Technical Notes”, Statistics Canada, Ottawa. Australian Bureau of Statistics (ABS), Denis Trewin, 2001, “Measuring Wellbeing: Framework for Australian Social Statistics”, ABS, Canberra. Department for Culture, Media and Sport and the English Regional Cultural Consortia, 2002, “Regional Cultural Data Framework: A User’s Guide”, United Kingdom. Eurostat working papers, 2000, “Cultural Statistics in the European Union”, European Commission 2000. Ministerio de Cultura de Colombia Convenio Andrés Bello, Equipo Economía y Cultura, 2003, “Impacto económico de las industrias culturales en Colombia”, Bogota. Ministère de la communication et de la culture, « Annuaire statistique du secteur de la communication et de la culture 2000-2001 », Algérie. Ministry of Arts, Culture, Science and Technology, 1998, “Creative South Africa: a Strategy for Realising the Potential of the Cultural Industries”.

- 54 -
Technical notes
For this report, data were extracted in November 2004 from the UN Comtrade database using the Harmonised System (HS) classification, version 1992. The UN Comtrade database contains data disaggre-gated by commodity and trading partners, covering some 230 countries or areas. Data source: United Nations Commodity Trade Statistics Database Department of Economic and Social Affairs/Statistics Division Data are available at http://unstats.un.org/unsd/comtrade/ The Harmonised System Commodity Description and Coding System (also referred to as the “Harmonised System” (HS)) was created by the Customs Cooperation Council in Brussels in 1983. The HS is updated every four or five years by the World Customs Organisation. The HS 2002 is the latest version of this classification and is often used in customs declarations. Implementing a new version within each national system can take a substantial amount of time. The 2002 version of the HS is still not universally used, especially within developing countries. The 1992 version of the HS has been chosen for this report in order to have a better coverage of reporting countries. Furthermore, it allows study of the trends of cultural trade flows for the last ten years.
The HS was preferred to the Standard International Trade Classification System (SITC Revision 3) - which was used for International Flows of Selected Cultural Goods, 1980-98 - because the SITC does not take into account the recent evolution of traded goods, such as the emerging technologies. Further-more, the HS is more precise and allows for a more accurate selection of cultural goods. It
makes the distinction between cultural and non-cultural goods within the same family of a specific good. Both classification systems present data on, amongst other things, the materials used during production, the process of production and the end use of the product on the market. The HS provides international statistical and administrative comparability of trade information (HS codes) but this is sometimes not accurate for cultural goods. For some codes, cultural and non-cultural goods may be combined. Two systems of compilation of international merchandise trade statistics are in common use, namely the general trade system and the special trade system. The two systems differ mainly in classification of how goods entered in countries or how warehoused and re-exported goods are treated. General trade figures are larger than the corresponding special trade figures because the latter exclude certain trade flows, such as goods shipped through bonded warehouses. Consequently, the International Merchandise Trade Statistics: Compilers Manual recommends the use of the general trade system to record international merchandise trade statistics. To the extent possible, total merchandise trade is defined in this report according to the general trade definition. It covers all types of inward and outward movement of goods through a country or territory, including movements through customs warehouses and free zones. Goods include all merchandise that either add to or reduce the stock of material resources of a country or territory by entering (imports) or leaving (exports) the country’s economic territory.
The exports are valued at transaction value (Free on Board: F.O.B.), i.e. the price includes the cost of transportation and insurance to the border of the exporter country. The imports

- 55 -
are recorded at transaction value (Cost Insurance Freight: C.I.F.), which means that the price includes cost of transportation and insurance to the border of the importing country. Low-value transactions are not included, but in general they represent less than 1% of total global exports. When data were available, re-exports have been deducted from exports data in order to measure domestic exports. Data on audiovisual and related services are extracted from the IMF Balance of Payments Statistics in current US$. The source on other services data is from the publication Statistics on International Trade in Services. EBOPS can be characterised as a dis-aggregation of the BPM5 in trade in services. It was based on the recommendations of the Manual on Statistics of International Trade in Services”. EBOPS was defined in order to fulfil the data needs generated from the General Agreements on Trade Services (GATS) recommendations.
Under the category “other personal, cultural, and recreational services”, a new distinction was made between education, health services and “cultural and recreational services” (897). Nevertheless, the new breakdown “other personal, cultural, and recreational services” still includes categories that are non-cultural. A key additional category is “royalties and licence fees” from which it is necessary to identify the part which is dedicated to copyrights. Another category that is linked to related services is “computer and information services”. EBOPS contains two distinct sub-categories, namely “computer services” and “information services”. The category “information services” offers a further breakdown into “news agencies services” and “other information provision services”. The source of population data used for the calculation of the trade per capita is the World Population Prospects: The 2002 Revision, 2003, from the United Nations Population Division. Data on Gross National Income is acquired from the World Bank Atlas, 2003.
Annex I
- 56 -
Annex I: Statistical Tables
Tables I Total trade of core cultural goods by country, 2002 Table I–1 Exports of core cultural goods by country, 2002 Table I–2 Imports of core cultural goods by country, 2002
Tables II Analysis by region Table II–1 Exports of core cultural goods by region, 1994 Table II–2 Exports of core cultural goods by region, 2002 Table II–3 Imports of core cultural goods by region, 1994 Table II–4 Imports of core cultural goods by region, 2002
Tables III Trade by level of income Table III–1 Trade exports by category, 1994-2002 Table III–2 Trade imports by category, 1994-2002 Table III–3 Trend in trade of core cultural goods Table III–4 Trade coverage ratio of core cultural goods by category, 1994-2002
Tables IV Partner country analysis Table IV–1 Top 15 partner countries of the United States of America, 1994 and 2003 Table IV–2 Top 15 partner countries of China, 1994 and 2003 Table IV–3 Top 15 partner countries of South Africa, 2003 Table IV–4 Top 15 partner countries of Brazil, 1994 and 2003 Table IV–5 Top 15 partner countries of Egypt, 1994 and 2002 Tables V Top 20 importers and exporters for the main core cultural goods categories Table V–1 Heritage goods Table V–2 Books Table V–3 Newspapers and periodicals Table V–4 Other printed matter Table V–5 Recorded media Table V–6 Visual arts Table V-7 Audiovisual media
Table VI Detailed trade in cultural services for a selected number of countries
Source: UNESCO Institute for Statistics based on data from UN Comtrade, DESA/UNSD, 2004.

Annex I
- 57 -
Tables I Total trade of core cultural goods by country, 2002
Table I-1 Exports of core cultural goods by country, 2002
EXPORTS in thousands US$
Heritage goods
Books Newspapers
and periodicals
Other printed matter
Recorded media
Visual arts Audiovisual
media
Total core cultural goods
Albania .. 94.9 455.3 47.7 0.7 118.2 0.3 717.1Algeria .. 85.2 1,914.9 1.0 26.5 81.8 .. 2,109.4Andorra 1.7 1,038.3 931.3 9.0 479.2 18.9 260.9 2,739.3Anguilla 12.9 1.3 .. 3.5 3.7 621.1 .. 642.4Argentina 85.6 33,381.1 6,730.6 3,798.8 14,048.3 1,585.3 10,925.7 70,555.2Armenia 0.2 199.1 .. 0.0 .. 20.4 3.0 222.7Australia 9,736.6 72,530.3 29,855.4 18,203.0 101,311.0 44,096.6 42,035.5 317,768.4Austria 13,813.1 85,025.4 54,411.7 22,690.8 1,261,205.5 71,606.0 52,472.8 1,561,225.2Azerbaijan .. 91.4 0.1 17.9 762.6 74.8 .. 946.8Bahrain .. 210.7 .. .. .. 126.6 0.2 337.5Barbados 3.3 169.4 292.5 166.4 49.1 220.4 0.1 901.3Belarus 8.2 15,695.0 404.4 339.1 11,090.2 350.5 47.5 27,934.8Belgium 35,432.2 362,091.0 146,584.4 51,272.6 351,912.7 119,528.7 63,192.0 1,130,013.6Belize .. 0.2 .. 1.8 .. 18.1 .. 20.1Benin .. 251.3 .. 1.6 1.2 50.3 .. 304.4Bolivia .. 288.2 3.6 73.0 688.4 484.3 1.1 1,538.6Brazil 391.3 11,616.6 10,525.3 1,412.9 10,595.9 4,007.3 27.8 38,577.2Brunei Darussalam .. 0.6 .. .. .. .. .. 0.6Bulgaria 21.5 1,382.7 1,770.6 325.7 1,708.9 1,550.7 7,685.9 14,446.1Burkina Faso 100.0 13.8 .. 0.0 10.8 776.8 5.1 906.5Burundi .. 0.0 0.0 .. .. 6.8 .. 6.8Canada 27,490.6 395,964.9 160,852.7 252,804.8 357,374.3 162,190.1 220,552.3 1,577,229.5Central African Rep. .. 38.8 .. .. .. 0.1 .. 38.8Chile 54.2 17,371.0 5,382.4 1,568.2 24,150.0 1,389.3 1,418.7 51,333.8China 2,372.0 409,105.7 4,612.6 92,420.5 254,936.0 2,229,649.0 2,281,804.9 5,274,900.7China, Hong Kong 490.6 258,416.2 35,148.8 18,143.7 254,528.8 7,592.0 3,537.6 577,857.7China, Macao .. 17.7 23.9 .. 178.7 122.8 .. 343.0Colombia .. 90,711.8 20,747.7 3,026.7 31,202.4 3,635.5 6.7 149,330.7Costa Rica 14.1 6,854.6 747.3 185.3 6,653.3 717.3 0.4 15,172.3Cote d'Ivoire 1.4 977.2 0.5 86.0 10.3 945.1 0.5 2,021.0Croatia 27.8 5,689.5 23,610.6 886.4 5,948.1 1,401.4 2,234.6 39,798.3Cyprus 0.7 361.9 413.9 25.7 1,100.4 127.1 0.1 2,030.0Czech Republic 1,590.5 78,199.9 34,325.8 14,169.6 67,562.3 21,816.4 1,017.9 218,682.3Denmark 16,717.0 110,712.7 48,234.5 31,998.3 194,518.4 75,872.4 20,709.6 498,762.9Dominica .. .. .. .. 13.5 17.9 .. 31.4Ecuador .. 694.2 20.0 28.5 701.6 925.6 .. 2,369.9Egypt 1.1 5,721.9 1,377.0 49.9 350.3 3,211.6 5.5 10,717.3El Salvador .. 2,694.4 .. 1,631.7 1,236.5 938.2 131.6 6,632.3Estonia 89.2 2,806.0 6,648.8 419.7 1,599.1 3,883.2 36.1 15,482.0Ethiopia 8.9 13.0 1.5 240.9 0.8 54.6 4.2 323.8Fiji 17.6 123.8 13.1 16.7 66.4 168.9 3.9 410.4Finland 126.5 70,603.3 126,143.7 20,783.6 46,039.1 2,860.7 23,659.5 290,216.5France 189,181.4 518,539.2 368,724.5 104,716.3 741,180.9 505,250.0 93,681.0 2,521,273.3French Polynesia 4.1 73.4 .. 1.3 66.1 166.8 45.0 356.5Germany 73,858.5 1,257,829.7 711,078.1 274,817.7 2,280,960.0 550,891.3 639,495.6 5,788,930.8Greece 60.3 23,478.0 10,167.1 3,858.9 23,284.3 7,044.9 9,870.0 77,763.6Greenland 33.9 41.3 1.4 986.3 91.2 22.1 .. 1,176.2

Annex I
- 58 -
EXPORTS in thousands US$
Heritage goods
Books Newspapers
and periodicals
Other printed matter
Recorded media
Visual arts Audiovisual
media
Total core cultural goods
Grenada .. 2.5 .. 2.8 .. 4.5 0.0 9.8Guatemala 0.1 0.6 0.0 15.6 4,109.4 321.4 0.4 4,447.5Guinea 16.6 .. .. .. .. 17.3 .. 33.9Guyana 2.0 9.6 7.5 0.4 0.2 36.9 0.0 56.6Honduras 0.0 38.0 20.0 0.3 6.1 41.0 0.3 105.7Hungary 421.0 18,684.0 6,583.0 5,740.0 27,284.0 13,579.0 647,220.0 719,511.0Iceland .. 2,288.4 61.6 1,529.2 141.1 161.2 6.5 4,188.0India 917.8 42,588.7 12,628.6 6,180.8 191,335.1 15,257.6 15,552.4 284,461.1Indonesia 35.2 10,187.2 530.8 5,787.6 9,595.8 85,422.5 742.0 112,301.0Iran (Islamic Rep. of) .. 1,005.0 .. 1,509.7 76.0 535.1 0.0 3,125.8Ireland 5,356.3 93,797.9 26,721.0 5,309.7 2,128,151.0 10,416.9 7,107.2 2,276,860.1Israel 1,493.0 44,242.0 906.0 4,067.0 77,571.0 18,858.0 7,830.0 154,967.0Italy 9,864.2 510,284.3 202,342.8 112,557.6 144,092.1 273,523.9 128,065.6 1,380,730.5Jamaica .. 64.5 141.6 12.5 166.4 97.5 .. 482.5Japan 8,054.2 107,524.0 34,439.9 15,189.8 371,455.9 60,394.6 1,208,074.3 1,805,132.8Jordan 14.8 3,832.5 96.7 54.8 81.1 337.4 .. 4,417.5Kenya 4.1 1,361.5 760.5 86.8 153.0 2,266.9 6.7 4,639.3Kyrgyzstan .. 8.6 0.6 1.2 0.3 279.3 3.7 293.8Latvia 79.8 3,975.5 1,069.5 707.5 2,571.5 284.4 14.6 8,702.8Lebanon 1,880.9 47,947.9 90.6 270.9 1,727.3 2,871.7 664.1 55,453.5Lesotho .. 28.7 .. 0.7 0.1 0.3 .. 29.9Luxembourg 233.0 6,160.7 5,634.7 359.4 97,838.8 1,302.3 2,692.4 114,221.4Madagascar 81.1 34.3 1.7 13.2 2.1 538.5 3.5 674.4Malawi 0.3 205.1 .. 21.4 1.4 78.6 .. 306.9Malaysia 1,508.5 93,059.8 2,315.2 3,931.2 71,347.6 11,269.1 32,420.4 215,851.7Mauritius 10.8 3,406.9 171.9 626.1 947.7 934.4 73.5 6,171.4Mexico 567.9 119,585.4 32,936.3 61,805.8 145,956.5 111,705.5 771,890.3 1,244,447.8Mongolia 15.1 21.2 .. 0.9 0.2 24.5 .. 61.9Morocco 821.9 1,020.1 0.7 2,010.1 5,554.9 70,918.5 0.0 80,326.2Namibia 1,197.2 592.9 5.1 504.3 283.1 620.8 10.1 3,213.7Netherlands 15,353.4 253,673.4 142,824.2 50,085.4 955,687.7 108,741.9 20,076.9 1,546,442.9New Caledonia 4.3 315.3 266.0 10.5 117.6 133.3 3.0 850.0New Zealand 1,006.5 11,941.5 1,475.7 5,350.3 7,394.8 4,194.2 751.4 32,114.4Nicaragua .. 184.5 20.3 9.6 197.0 2,017.8 2.9 2,432.1Niger .. .. .. .. 4.3 .. .. 4.3Norway 23,697.3 26,934.1 7,699.3 7,255.5 30,830.4 18,265.6 40,258.8 154,940.9Oman .. 622.3 91.2 16.5 197.4 201.1 12.9 1,141.4Other Asia, n.e.s. 30.7 35,310.9 8,743.0 6,252.9 374,940.7 76,945.6 4,497.5 506,721.4Panama .. 50.9 23.4 11.6 .. 16.1 1.0 102.9Papua New Guinea 5.8 4.3 13.5 0.1 4.8 38.2 .. 66.7Paraguay .. 792.6 .. 19.6 20.9 19.8 4.1 856.9Peru 230.0 20,188.2 537.9 3,270.0 836.5 5,012.0 10.5 30,085.2Philippines 174.1 1,651.5 652.1 1,441.7 13,124.5 98,281.6 1,228.9 116,554.4Poland 3,317.0 50,009.0 49,841.0 12,463.0 59,624.0 33,231.0 875.0 209,360.0Portugal 123.4 24,880.1 2,529.3 6,366.9 16,370.6 105,716.8 2,013.9 158,001.2Qatar .. 135.4 0.3 1.4 .. 2.1 .. 139.2Rep. of Korea 952.1 71,900.1 3,664.6 24,915.6 174,867.6 69,108.4 43,035.5 388,443.9Rep. of Moldova .. 658.2 0.0 5.7 20.3 11.7 0.0 615.0Romania .. 1,661.0 5,319.0 436.0 6,930.0 9,381.0 1,320.0 25,047.0Russian Federation 1,282.7 240,227.0 15,477.6 16,517.3 59,331.6 13,434.9 786.2 347,057.3Rwanda 1.5 0.2 .. 0.2 .. 34.9 .. 36.8

Annex I
- 59 -
EXPORTS in thousands US$
Heritage goods
Books Newspapers
and periodicals
Other printed matter
Recorded media
Visual arts Audiovisual
media
Total core cultural goods
Saint Lucia .. 7.9 31.6 .. 0.6 71.6 0.4 112.1St Vincent & the Grenadines .. 2.7 .. .. .. 17.6 .. 20.2Samoa 0.1 6.3 2.4 0.9 .. 0.2 0.2 10.0Sao Tome & Principe .. .. .. .. .. 0.2 .. 0.2Saudi Arabia 8.3 2,268.6 647.6 37.5 1,964.8 598.3 577.7 6,102.8Senegal 0.2 181.9 5.1 0.1 3.9 1,420.3 .. 1,611.5Serbia & Montenegro 1.3 2,932.8 4,821.3 505.3 5,309.7 273.1 18.8 13,862.3Seychelles .. .. .. .. .. 0.1 .. 0.1Sierra Leone .. .. .. .. 725.4 .. .. 725.4Singapore 3,685.5 349,859.5 35,934.4 7,554.5 1,552,343.9 10,167.7 41,443.9 2,000,989.4Slovakia 401.2 48,327.1 42,518.4 6,676.6 10,373.2 4,704.9 201.0 113,202.4Slovenia 25.4 40,658.3 3,331.1 1,660.6 11,962.6 694.9 61.1 58,393.9South Africa 9,340.8 18,859.4 1,698.9 3,023.9 7,641.1 15,392.2 1,014.5 56,970.8Spain 1,188.2 685,967.9 238,801.0 45,415.0 258,742.7 255,184.4 47,390.2 1,532,689.3Sri Lanka 1.7 914.2 1,081.0 189.6 520.1 12,389.4 0.5 15,096.4Sudan 0.1 107.2 29.0 .. 47.7 248.5 .. 432.5Swaziland 13.8 112.6 133.3 8.9 29.6 81.0 1.6 380.8Sweden 7,512.4 95,405.8 20,117.2 34,788.7 644,907.7 43,664.8 28,903.2 875,299.8Switzerland 120,238.4 147,190.9 40,966.0 91,620.2 254,227.2 720,389.2 9,241.1 1,383,873.0Syria .. 216.0 328.8 1,599.1 .. 183.6 .. 2,327.5TFYR of Macedonia .. 103.7 96.2 47.6 223.4 71.5 9.5 551.8Togo 2.2 18.7 .. 0.9 0.4 187.4 .. 209.5Tunisia 0.2 596.7 136.0 30.8 3,391.6 1,094.0 0.0 5,249.3Turkey 157.4 7,817.6 2,221.2 5,043.5 12,812.0 21,368.8 46.7 49,467.1Uganda 7.2 152.8 .. 17.4 3.4 26.0 .. 206.8Ukraine 21.1 5,745.4 869.7 446.9 856.3 430.9 44.0 8,414.3United Kingdom 1,052,550.0 1,805,746.6 744,952.6 274,640.6 1,640,203.3 2,700,214.4 330,464.7 8,548,772.1United Rep. of Tanzania 8.8 38.3 0.2 7.1 507.9 191.3 1.2 754.8Uruguay 45.9 80.7 0.5 15.1 3,291.5 1,007.4 6.5 4,447.6United States of America 143,174.1 1,921,368.5 880,488.7 400,657.7 3,068,793.9 889,146.3 344,785.1 7,648,414.3Venezuela 0.1 4,672.5 240.4 684.5 1,954.3 1,221.4 14.1 8,787.2Zambia 7.1 197.3 26.0 1.8 10.6 622.0 0.2 864.9Zimbabwe 18,482.0 1,134.9 70.9 315.5 115.8 6,843.8 8.3 26,971.3

Annex I
- 60 -
Table I-2 Imports of core cultural goods by country, 2002
IMPORTS thousands US$
Heritage goods
Books Newspapers
and periodicals
Other printed matter
Recorded media
Visual arts Audiovisual
media
Total core cultural goods
Albania .. 881.3 768.1 352.6 3,911.8 1,061.1 218.3 7,193.2Andorra 177.8 3,345.0 2,563.7 379.7 18,652.1 2,760.9 3,404.0 31,283.2Anguilla 0 417.9 14.3 57.9 36.2 341.5 0.3 868.1Argentina 193.5 24,308.5 6,027.5 1,408.1 22,400.5 1,340.9 1,263.9 56,942.9Armenia .. 1,381.2 735.4 148.5 118.5 157.6 30.2 2,571.3Australia 22,419.7 307,581.6 150,136.4 47,547.4 378,425.4 89,258.9 214,652.4 1,210,021.8Austria 15,955.0 258,485.5 164,421.8 56,628.8 435,839.1 94,849.6 51,812.4 1,077,992.2Azerbaijan .. 1,434.7 884.2 99.0 1,620.3 1,257.3 12.8 5,308.3Bahrain 10.2 4,341.4 1,957.7 697.1 3,766.5 3,181.3 1,202.8 15,156.9Barbados 9.5 7,479.1 1,891.7 878.3 4,135.9 1,582.3 816.4 16,793.2Belarus 4.7 8,742.7 3,248.3 3,672.7 8,281.8 739.9 374.4 25,064.4Belgium 30,549.2 329,618.8 259,246.5 53,049.2 638,997.4 117,021.4 82,255.3 1,510,737.7Belize .. 1,936.2 116.6 549.5 153.2 251.9 43.7 3,051.1Benin .. 1,877.7 41.1 130.6 50.6 34.0 0.2 2,134.2Bolivia 69.0 6,746.7 714.6 335.8 3,527.4 1,147.0 429.4 12,969.9Brazil 2,846.6 90,205.1 21,685.0 3,417.6 100,260.9 10,253.0 6,852.8 235,520.9Bulgaria 2.6 3,784.0 2,728.6 1,134.6 10,676.0 1,317.4 401.6 20,044.7Burkina Faso 51.9 2,280.6 183.9 128.2 2,125.1 34.0 11.6 4,815.3Burundi .. 544.6 48.2 22.4 3.2 6.8 0.6 625.9Canada 32,877.6 1,019,337.3 646,659.5 264,609.3 1,171,495.8 190,083.5 504,829.4 3,829,892.5Chile 1,944.2 34,029.4 6,495.1 2,676.9 35,993.8 9,782.6 8,569.4 99,491.3China 729.6 97,172.2 52,694.1 15,565.9 873,359.6 16,069.2 57,795.8 1,113,386.4China, Hong Kong 89,176.8 472,680.9 24,301.9 90,007.1 278,678.7 577,594.8 656,733.4 2,189,173.6China, Macao 0.2 2,187.3 155.7 220.7 6,346.9 644.3 299.4 9,854.4Colombia 55.0 47,814.4 6,079.6 2,676.8 31,755.5 5,841.6 2,138.9 96,361.8Costa Rica 63.6 21,521.6 5,868.1 1,788.5 19,446.5 3,867.7 796.7 53,352.6Cote d'Ivoire 0.2 8,994.7 7,513.3 242.0 368.4 213.1 49.3 17,381.0Croatia 60.1 13,025.9 13,533.4 3,076.3 43,040.6 9,623.4 4,686.4 87,046.0Cyprus 532.5 18,782.9 13,279.8 2,448.8 15,836.1 7,614.3 2,760.5 61,254.9Czech Rep. 19,724.9 110,955.1 26,296.6 16,724.1 75,473.7 30,955.4 7,260.3 287,390.2Denmark 5,199.9 115,082.7 39,158.6 33,701.4 219,966.0 61,908.3 39,385.8 514,402.7Dominica 2.3 1,379.3 85.1 126.3 180.0 58.7 68.8 1,900.7Ecuador 21.4 43,123.4 5,547.0 1,663.9 15,468.2 6,533.9 1,167.9 73,525.8Egypt .. 16,649.0 4,258.0 1,746.5 2,781.4 4,829.1 3,066.7 33,330.6El Salvador 27.6 24,421.0 1,756.4 1,524.6 12,109.8 1,986.5 625.4 42,451.3Estonia 167.6 7,424.8 1,832.8 1,382.9 9,551.2 1,864.7 1,198.6 23,422.5Ethiopia 43.9 10,137.2 442.6 2,569.9 1,612.0 213.1 182.5 15,201.0Faeroe Islands 2.1 1,425.2 1,657.3 353.4 2,798.9 361.0 429.9 7,027.8Fiji 0.5 3,219.6 38.1 365.2 1,182.4 559.4 1,105.1 6,470.4Finland 284.4 60,731.0 31,949.2 13,371.4 174,960.0 12,881.6 50,244.0 344,421.6France 66,513.0 541,265.6 402,028.5 116,724.4 1,397,715.5 355,300.1 527,299.2 3,406,846.1French Polynesia 143.5 5,131.6 2,752.2 421.3 8,933.9 4,139.8 776.4 22,298.6Germany 42,337.7 631,609.4 328,659.7 190,160.2 1,487,769.5 592,662.5 888,920.6 4,162,119.7Greece 946.2 51,013.3 33,841.2 8,114.8 77,221.4 31,863.3 21,786.7 224,787.0Greenland 13.8 2,096.5 59.4 406.3 2,377.0 251.5 218.6 5,423.1Grenada .. 2,334.5 173.6 305.4 331.6 183.1 16.9 3,345.0Guatemala 9.9 29,719.2 3,194.0 3,427.8 37,549.2 5,300.9 2,100.9 81,302.0Guinea 21.0 556.7 139.4 151.8 54.1 7.6 16.2 946.7Guyana 5.4 2,205.3 201.8 253.1 127.0 412.9 17.7 3,223.1

Annex I
- 61 -
IMPORTS thousands US$
Heritage goods
Books Newspapers
and periodicals
Other printed matter
Recorded media
Visual arts Audiovisual
media
Total core cultural goods
Honduras 0.5 2,191.1 1,011.1 199.6 352.9 927.5 37.8 4,720.6Hungary 227.0 49,215.0 12,547.0 8,481.0 120,778.0 7,369.0 6,744.0 205,361.0Iceland 20.8 6,928.0 2,149.5 838.0 12,048.9 1,743.9 2,196.8 25,925.9India 262.0 78,589.1 5,245.6 1,486.7 708,047.6 5,019.2 4,930.8 803,580.9Indonesia 118.0 6,763.6 3,482.7 1,631.7 4,039.3 2,644.2 1,965.0 20,644.5Iran .. 20,406.2 52.9 296.5 7,124.8 280.7 314.6 28,475.7Ireland 1,874.2 153,025.8 87,608.9 25,398.9 244,235.7 30,816.4 31,860.6 574,820.5Israel 112.0 31,950.0 5,534.0 2,986.0 120,350.0 41,376.0 26,027.0 228,335.0Italy 10,783.2 231,513.9 180,016.5 36,450.7 991,957.5 305,456.5 63,240.5 1,819,418.7Jamaica 0.3 38,202.0 98.9 1,350.0 11,338.3 1,485.5 238.2 52,713.2Japan 50,654.0 329,759.9 127,076.7 70,065.4 777,849.2 397,669.8 261,098.4 2,014,173.5Jordan .. 14,887.4 124.9 701.8 6,632.8 1,102.0 288.7 23,737.7Kenya 13.1 11,619.2 1,388.0 3,574.2 13,047.0 250.0 175.3 30,066.7Kyrgyzstan 1.2 631.7 51.8 107.2 70.7 414.1 3.1 1,279.8Latvia 2.1 5,973.6 6,271.0 1,204.6 17,099.1 1,462.8 285.7 32,299.0Lebanon 80.9 21,802.5 5,701.8 921.8 11,377.8 10,243.6 4,783.9 54,912.3Lesotho 0.3 2,637.3 161.5 476.1 41.8 108.7 8.4 3,434.1Luxembourg 2,492.7 33,815.0 33,291.7 3,548.5 102,062.2 11,074.4 9,870.7 196,155.2Malaysia 4,302.5 94,832.1 9,243.3 3,714.3 87,139.2 6,789.9 14,234.1 220,255.3Maldives .. 1,911.5 251.2 276.4 536.0 404.8 83.6 3,463.5Mauritius 7.3 8,209.9 2,890.9 405.1 2,544.2 1,090.5 655.9 15,803.7Mexico 1,410.9 414,474.1 72,974.1 65,289.2 364,597.6 71,942.3 158,698.1 1,149,386.4Morocco 284.8 26,102.5 15,464.9 819.4 32,574.7 2,998.1 1,280.4 79,524.8Netherlands 20,457.4 230,663.8 92,130.8 112,076.2 626,976.6 186,490.7 156,747.9 1,425,543.5New Caledonia 102.7 5,896.4 3,334.2 293.7 7,137.2 1,252.0 1,134.5 19,150.7New Zealand 3,468.9 82,552.6 56,697.0 14,570.5 94,795.0 19,689.8 29,909.5 301,683.4Nicaragua 5.1 15,014.2 1,529.0 773.7 4,621.8 1,071.0 376.3 23,391.1Niger .. 1,186.1 99.1 73.2 205.3 87.6 5.7 1,657.1Norway 2,780.0 108,574.3 37,072.2 32,674.5 265,968.6 35,969.7 69,370.4 552,409.8Oman 11.4 5,476.0 4,933.9 1,433.8 4,100.4 1,986.4 1,017.2 18,959.1Other Asia, n.e.s. 2,208.5 105,879.5 27,446.4 6,389.9 375,450.2 31,722.4 35,684.2 584,781.1Panama 2.9 15,071.0 6,947.0 2,606.9 13,208.4 4,401.9 2,752.8 44,990.9Paraguay .. 3,529.7 303.9 150.5 3,263.3 1,720.9 2,964.2 11,932.6Peru 11.7 32,322.6 6,103.1 1,344.3 13,903.6 4,178.6 2,865.5 60,729.5Philippines 39.0 41,217.4 5,600.5 828.7 17,927.7 3,494.7 2,972.0 72,080.0Poland 4,848.0 78,749.0 25,041.0 24,555.0 88,714.0 31,120.0 7,845.0 260,872.0Portugal 2,315.4 57,321.1 91,929.6 6,703.3 146,245.3 36,697.1 52,801.3 394,013.1Qatar 97.3 2,966.2 1,835.8 966.5 8,201.7 1,791.3 404.9 16,263.8Rep. of Korea 6,532.6 120,502.0 22,102.0 40,598.1 638,872.4 73,191.3 119,179.0 1,020,977.6Rep. of Moldova .. 2,296.8 1,209.7 198.0 535.8 79.2 11.8 4,331.3Romania .. 17,465.0 4,670.0 2,123.0 10,976.0 2,181.0 528.0 37,943.0Russian Federation 533.2 103,125.7 164,338.4 18,875.1 59,111.6 24,103.7 2,789.0 372,876.7Rwanda .. 2,010.8 447.0 139.9 165.5 50.6 95.7 2,909.6Saint Lucia .. 3,034.7 422.1 382.1 417.5 469.7 44.0 4,770.1St Vincent & Grenadines 28.1 1,127.7 245.4 169.7 113.8 241.5 24.4 1,950.8Samoa 0.8 620.7 78.5 101.2 132.1 22.7 12.6 968.6Sao Tome & Principe .. 13.6 2.1 1.8 3.4 2.3 0.0 23.3Saudi Arabia 304.0 30,131.6 869.9 3,895.4 24,907.3 25,897.8 8,329.3 94,335.3Senegal .. 5,391.6 3,042.5 337.4 434.4 336.9 31.8 9,574.5Serbia & Montenegro 40.0 4,042.7 6,051.9 448.8 60,821.7 1,845.5 1,491.4 74,742.0

Annex I
- 62 -
IMPORTS thousands US$
Heritage goods
Books Newspapers
and periodicals
Other printed matter
Recorded media
Visual arts Audiovisual
media
Total core cultural goods
Seychelles 2.3 670.3 111.0 40.3 .. 80.9 2.6 907.5Sierra Leone .. 339.0 0.0 59.6 18.5 11.1 26.9 455.0Singapore 4,885.9 199,171.7 26,641.1 18,801.3 170,562.1 41,989.7 177,462.7 639,514.6Slovakia 239.6 24,174.8 17,149.5 3,967.0 40,252.0 6,288.5 2,773.3 94,844.7Slovenia 81.5 10,305.7 7,054.8 2,825.7 24,035.1 4,692.9 1,109.6 50,105.3South Africa 3,405.6 96,330.7 9,081.7 7,235.9 148,600.9 33,023.6 11,716.0 309,394.4Spain 9,128.6 196,354.8 165,860.1 112,400.6 507,268.2 220,580.2 273,013.7 1,484,606.2Sri Lanka 29.5 7,494.2 760.7 457.5 5,963.3 1,046.2 175.1 15,926.5Sudan 5.8 1,612.1 583.1 147.4 2,269.3 4,168.6 156.9 8,943.1Swaziland 0.6 5,017.7 423.4 215.3 525.8 216.4 35.7 6,434.8Sweden 8,701.4 148,761.2 57,583.8 28,465.1 425,398.6 69,207.8 92,024.6 830,142.5Switzerland 98,999.8 402,311.0 302,954.7 105,023.6 821,082.5 665,591.9 70,079.5 2,466,043.0Syria .. 423.0 .. .. 1,301.1 .. .. 1,724.1TFYR of Macedonia 1.2 2,000.8 1,735.6 263.5 1,604.0 440.8 190.4 6,236.3Togo .. 1,072.9 47.7 70.4 135.0 13.4 0.3 1,339.6Tunisia 101.7 10,000.1 5,390.5 1,267.4 23,881.2 1,376.0 317.7 42,334.6Turkey 1,298.0 17,032.1 20,786.7 3,293.6 100,128.2 13,151.4 8,591.9 164,281.8Uganda 5.5 11,794.4 449.4 1,545.9 365.8 98.6 39.1 14,298.7Ukraine 14.0 15,833.7 10,716.7 1,373.5 18,152.1 2,056.7 902.0 49,048.7United Kingdom 673,242.6 1,272,757.9 300,862.2 200,402.7 1,953,886.2 2,759,551.3 711,198.9 7,871,901.8United Rep. of Tanzania 101.7 9,282.2 535.8 854.7 297.8 203.6 38.7 11,314.4Uruguay 52.5 317.8 197.2 405.4 1,685.2 347.7 709.8 3,715.7United States of America 1,394,183.1 2,089,998.0 303,128.6 673,322.1 1,358,347.6 5,425,732.7 4,093,870.7 15,338,583.0Venezuela 19.3 67,238.1 24,584.0 6,416.5 42,284.8 7,775.3 3,920.0 152,237.9Wallis & Futuna Islands .. 89.8 132.8 9.7 66.1 19.6 16.8 334.8Zambia 14.3 26,212.3 1,723.8 463.5 814.3 162.1 77.8 29,468.1Zimbabwe 47.9 8,394.6 1,396.5 260.4 5,202.6 226.3 262.1 15,790.4
.. : Nil. 0: Less than US$ 1,000 n.e.s.: Not elsewhere specified

Annex I
- 63 -
Tables II Analysis by region Table II-1 Exports of core cultural goods by region, 1994
EXPORTS Total core cultural
goods Heritage goods Books
Newspapers and periodicals
Other printed matter
Recorded media Visual arts Audiovisual
media
1994 Value
million US$
Share Value
million US$
Share Value
million US$
Share Value
million US$
Share Value
million US$
Share Value
million US$
Share Value
million US$
Share Value
million US$
Share
All available countries 36,222.5 1,461.5 8,441.4 3,806.3 1,669.2 12,563.3 6,690.4 1,590.4
Regional groupings
Americas 9,778.0 27.0 203.4 13.9 2,299.5 27.2 1,071.1 28.1 445.8 26.7 4,124.7 32.8 1,244.9 18.6 388.6 24.4 North America 9,072.9 25.0 202.7 13.9 2,033.2 24.1 959.7 25.2 401.2 24.0 4,018.1 32.0 1,130.9 16.9 327.0 20.6 Latin America and the Caribbean 705.1 1.9 0.7 0.05 266.3 3.2 111.3 2.9 44.6 2.7 106.6 0.8 114.0 1.7 61.5 3.9
Europe 21,892.8 60.4 1,208.0 82.7 4,928.7 58.4 2,561.6 67.3 1,026.9 61.5 7,417.0 59.0 4,157.0 62.1 593.7 37.3 EU15 19,675.8 54.3 988.1 67.6 4,548.2 53.9 2,447.4 64.3 875.6 52.5 6,916.8 55.1 3,328.8 49.8 570.7 35.9 Other Europe 2,217.1 6.1 219.9 15.0 380.5 4.5 114.2 3.0 151.2 9.1 500.1 4.0 828.2 12.4 23.0 1.4
Africa 58.2 0.2 2.6 0.2 17.5 0.2 7.3 0.2 2.4 0.1 4.2 0.03 22.6 0.3 1.7 0.1 SACU 27.3 0.1 2.5 0.2 7.4 0.1 1.5 0.04 1.1 0.1 3.1 0.03 10.2 0.2 1.4 0.1 Other sub-Saharan countries 4.1 0.0 0.02 0.001 1.6 0.02 0.1 0.002 0.4 0.02 0.3 0.002 1.5 0.02 0.2 0.01 Northern Africa 26.8 0.1 0.04 0.002 8.5 0.1 5.7 0.1 0.9 0.1 0.8 0.01 10.9 0.2 0.05 0.003
Asia 4,288.8 11.8 45.7 3.1 1,117.6 13.2 141.6 3.7 176.1 10.6 956.6 7.6 1,247.6 18.6 603.6 38.0 Eastern Asia 2,741.6 7.6 34.8 2.4 655.9 7.8 91.9 2.4 107.6 6.4 391.7 3.1 967.9 14.5 491.9 30.9 South Central Asia 162.3 0.4 0.1 0.01 18.6 0.2 7.1 0.2 3.3 0.2 88.3 0.7 36.1 0.5 8.7 0.6 South Eastern Asia 1,319.3 3.6 10.7 0.7 432.3 5.1 40.0 1.0 59.4 3.6 450.9 3.6 223.3 3.3 102.8 6.5 Western Asia 65.6 0.2 0.1 0.004 10.8 0.1 2.6 0.1 5.9 0.4 25.8 0.2 20.3 0.3 0.2 0.01
Oceania 204.6 0.6 1.8 0.1 78.1 0.9 24.8 0.7 18.0 1.1 60.8 0.5 18.3 0.3 2.9 0.2
Economic groupings / Regional trade agreement
Low-income economies 143.9 0.40 0.12 0.008 20.2 0.24 6.48 0.2 3.2 0.19 88.3 0.70 16.8 0.25 8.8 0.6 Lower-middle-income economies 1,734.4 4.8 31.7 2.2 232.6 2.8 60.8 1.6 87.5 5.2 86.1 0.7 1,041.1 15.56 194.5 12.2 Upper-middle-income economies 1,207.2 3.3 26.7 1.83 310.4 3.7 101.0 2.7 65.9 3.9 230.2 1.83 346.2 5.2 126.9 8.0 High-income economies 3,3136.9 91.5 1,403.0 96.0 7,878.2 93.3 3,638.0 95.6 1,512.5 90.6 12,158.7 96.8 5,286.3 79.0 1,260.2 79.2
COMESA 2.6 0.01 0.02 0.001 0.8 0.01 0.02 0.0004 0.4 0.02 0.1 0.001 1.1 0.02 0.2 0.01 CIS(a) 352.8 1.0 0.8 0.1 276.5 3.3 4.7 0.1 12.0 0.7 55.9 0.4 2.2 0.03 0.8 0.05 Arab States 36.4 0.1 0.1 0.01 16.6 0.2 6.1 0.2 1.1 0.1 1.0 0.01 11.4 0.2 0.2 0.01 MERCOSUR 229.3 0.6 0.1 0.01 89.5 1.1 64.2 1.7 6.2 0.4 43.4 0.3 23.3 0.3 2.6 0.2 NAFTA 9,366.8 25.9 203.0 13.9 2,110.3 25.0 974.3 25.6 428.9 25.7 4,068.3 32.4 1,197.2 17.9 384.8 24.2
(a): data for 1996

Annex I
- 64 -
Table II-2 Exports of core cultural goods by region, 2002
EXPORTS Total core cultural
goods Heritage goods Books
Newspapers and periodicals
Other printed matter
Recorded media Visual arts Audiovisual
media
2002 Value
million US$
Share Value
million US$
Share Value
million US$
Share Value
million US$
Share Value
million US$
Share Value
million US$
Share Value
million US$
Share Value
million US$
Share
All available countries 54,666.4 1,807.4 1,0835.0 4,398.3 2,158.9 18,509.4 9,741.0 7,216.4
Regional groupings
Americas 10,860.3 19.9 172.1 9.5 2,626.8 24.2 1,119.8 25.5 732.2 33.9 3,672.1 19.8 1,187.5 12.2 1,349.8 18.7 North America 9,226.8 16.9 170.7 9.4 2,317.4 21.4 1,041.3 23.7 654.4 30.3 3,426.3 18.5 1,051.4 10.8 565.3 7.8 Latin America and the Caribbean 1,633.5 3.0 1.4 0.08 309.5 2.9 78.4 1.8 77.7 3.6 245.9 1.3 136.2 1.4 784.4 10.9
Europe 3,1670.8 57.9 1,572.6 87.0 6,598.9 60.9 3,096.4 70.4 1,201.5 55.7 11,344.3 61.3 5,676.0 58.3 2,181.1 30.2 EU15 28,301.2 51.8 1,421.4 78.6 5,904.2 54.5 2,849.3 64.8 1,039.7 48.2 10,785.1 58.3 4,831.8 49.6 1,469.8 20.4 Other Europe 3,369.5 6.2 151.2 8.4 694.7 6.4 247.1 5.6 161.8 7.5 559.2 3.0 844.2 8.7 711.3 9.9
Africa 206.2 0.4 30.1 1.7 35.2 0.3 6.3 0.1 7.0 0.3 19.8 0.1 106.6 1.1 1.1 0.02 SACU 60.6 0.1 10.6 0.6 19.6 0.2 1.8 0.04 3.5 0.2 8.0 0.04 16.1 0.2 1.0 0.01 Other sub-Saharan countries 46.8 0.1 18.7 1.0 8.0 0.1 1.0 0.02 1.4 0.1 2.5 0.01 15.0 0.2 0.1 0.001 Northern Africa 98.8 0.2 0.8 0.05 7.5 0.1 3.5 0.08 2.1 0.1 9.4 0.05 75.6 0.8 0.01 0.0001
Asia 11,577.5 21.2 21.8 1.2 1,489.2 13.7 144.2 3.3 194.6 9.0 3,364.3 18.2 2,722.1 27.9 3,641.5 50.5 Eastern Asia 8,553.5 15.6 11.9 0.7 882.3 8.1 86.6 2.0 156.9 7.3 1,430.9 7.7 2,443.8 25.1 3,540.9 49.1 South Central Asia 303.0 0.6 0.9 0.1 44.5 0.4 13.7 0.3 7.9 0.4 191.9 1.0 28.5 0.3 15.6 0.2 South Eastern Asia 2,445.7 4.5 5.4 0.3 454.8 4.2 39.4 0.9 18.7 0.9 1,646.4 8.9 205.1 2.1 75.8 1.1 Western Asia 275.4 0.5 3.6 0.2 107.6 1.0 4.4 0.1 11.1 0.5 95.0 0.5 44.6 0.5 9.1 0.1
Oceania 351.6 0.6 10.8 0.6 85.0 0.8 31.6 0.7 23.6 1.1 109.0 0.6 48.8 0.5 42.8 0.6
Economic groupings / Regional trade agreement
Low-income economies 329.0 0.6 19.7 1.1 48.2 0.4 13.5 0.3 7.0 0.3 193.2 1.04 31.9 0.3 15.6 0.2 Lower-middle-income economies 6,411.1 11.7 16.1 0.9 857.1 7.9 76.0 1.7 141.9 6.6 444.2 2.4 2,581.0 26.5 2,295.0 31.8 Upper-middle-income economies 3,005.4 5.5 10.1 0.6 537.2 5.0 214.3 4.9 114.2 5.3 447.3 2.4 212.8 2.2 1,469.6 20.4 High-income economies 44,920.9 82.2 1,761.5 97.46 9,392.5 86.7 4,094.5 93.1 1,895.9 87.8 1,7424.9 94.1 6,915.4 71.0 3,436.2 47.6
COMESA 43.8 0.1 19.8 1.1 7.2 0.1 1.2 0.03 1.8 0.1 1.5 0.01 12.1 0.1 0.1 0.001 CIS 385.4 0.7 1.3 0.1 262.6 2.4 16.7 0.4 17.3 0.8 71.9 0.4 14.6 0.1 0.9 0.01 Arab States 168.2 0.3 2.7 0.2 62.8 0.6 4.1 0.1 4.2 0.2 13.3 0.1 79.9 0.8 1.3 0.02 MERCOSUR 167.3 0.3 0.6 0.03 63.5 0.6 22.6 0.5 6.9 0.3 52.8 0.3 8.5 0.1 12.4 0.2 NAFTA 10,471.3 19.2 171.3 9.5 2,437.0 22.5 1,074.3 24.4 716.3 33.2 3,572.2 19.3 1,163.1 11.9 1,337.2 18.5

Annex I
- 65 -
Table II-3 Imports of core cultural goods by region, 1994
IMPORTS Total core
cultural goods Heritage goods Books
Newspapers and periodicals
Other printed matter
Recorded media Visual arts Audiovisual
media
1994 Value
million US$
Share Value
million US$
Share Value
million US$
Share Value
million US$
Share Value
million US$
Share Value
million US$
Share Value
million US$
Share Value
million US$
Share
All available countries 40,421.1 1,887.9 8,640.2 3,833.9 1,896.6 12,244.7 8,525.8 3391.9
Regional groupings
Americas 12,541.4 31.0 780.6 41.3 2,906.6 33.6 1,062.4 27.7 579.3 30.5 2,348.9 19.2 2,964.2 34.8 1,899.4 56.0 North America 10,780.4 26.7 774.1 41.0 2,181.1 25.2 844.1 22.0 502.3 26.5 1,818.2 14.8 2,860.4 33.6 1,800.1 53.1 Latin America and the Caribbean 1,761.0 4.4 6.5 0.3 725.5 8.4 218.2 5.7 77.0 4.1 530.7 4.3 103.8 1.2 99.3 2.9
Europe 20,572.8 50.9 895.7 47.4 4,086.2 47.3 2,196.7 57.3 950.0 50.1 7,188.1 58.7 4,191.6 49.2 1,064.5 31.4 EU15 17,433.6 43.1 736.5 39.0 3,319.6 38.4 1,696.6 44.3 776.3 40.9 6,263.8 51.2 3,643.6 42.7 997.2 29.4 Other Europe 3,139.3 7.8 159.2 8.4 766.6 8.9 500.0 13.0 173.8 9.2 924.3 7.5 548.0 6.4 67.4 2.0
Africa 452.7 1.1 4.8 0.3 222.0 2.6 39.6 1.0 12.0 0.6 140.4 1.1 20.9 0.2 13.0 0.4 SACU 255.6 0.6 4.3 0.2 123.1 1.4 8.8 0.2 6.7 0.4 94.5 0.8 12.5 0.1 5.8 0.2 Other sub-Saharan countries 95.6 0.2 0.1 0.0 47.0 0.5 17.3 0.5 3.4 0.2 19.9 0.2 5.1 0.1 2.9 0.1 Northern Africa 101.5 0.3 0.4 0.0 52.0 0.6 13.4 0.3 1.9 0.1 26.1 0.2 3.3 0.0 4.28 0.1
Asia 5,269.0 13.0 164.8 8.7 950.9 11.0 312.7 8.2 268.0 14.1 1,938.4 15.8 1,267.6 14.9 366.6 10.8 Eastern Asia 3,912.2 9.7 153.3 8.1 517.1 6.0 230.2 6.0 149.3 7.9 1,412.7 11.5 1,148.0 13.5 301.5 8.9 South Central Asia 134.3 0.3 0.02 0.0 60.1 0.7 6.7 0.2 2.9 0.2 56.8 0.5 6.0 0.1 1.8 0.1 South Eastern Asia 1,032.9 2.6 10.7 0.6 286.7 3.3 61.6 1.6 107.4 5.7 422.8 3.5 90.4 1.1 53.3 1.6 Western Asia 189.6 0.5 0.7 0.0 87.0 1.0 14.1 0.4 8.4 0.4 46.2 0.4 23.2 0.3 9.9 0.3
Oceania 1,585.0 3.9 42.1 2.2 474.5 5.5 222.6 5.8 87.3 4.6 628.8 5.1 81.4 1.0 48.3 1.4
Economic groupings / Regional trade agreement
Low-income economies 151.3 0.37 0.02 0.001 73.3 0.85 8.6 0.2 3.6 0.19 57.6 0.47 6.3 0.07 1.8 0.05 Lower-middle-income economies 1,260.1 3.1 8.7 0.5 546.2 6.3 116.5 3.0 33.5 1.8 413.1 3.4 67.7 0.79 74.5 2.20 Upper-middle-income economies 2,030.8 5.0 6.8 0.36 792.6 9.2 293.3 7.7 109.6 5.8 612.9 5.01 135.9 1.6 79.8 2.35 High-income economies 36,978.9 91.5 1,872.4 99.18 7,228.2 83.7 3,415.6 89.1 1,749.8 92.3 11,161.1 91.2 8,316.0 97.5 3,235.8 95.4
COMESA 33.0 0.1 0.04 0.002 19.2 0.2 4.8 0.1 1.7 0.1 4.7 0.0 1.9 0.0 0.7 0.0 CIS(a) 459.7 1.1 0.4 0.02 129.9 1.5 215.1 5.6 18.8 1.0 86.2 0.7 6.6 0.1 2.7 0.1 Arab States 204.7 0.5 0.8 0.04 88.5 1.0 16.4 0.4 9.3 0.5 53.3 0.4 23.8 0.3 12.5 0.4 MERCOSUR 470.1 1.2 2.2 0.12 158.1 1.8 66.8 1.7 11.6 0.6 149.7 1.2 27.4 0.3 54.4 1.6 NAFTA 11,598.4 28.7 777.1 41.2 2,510.0 29.0 937.9 24.5 553.3 29.2 2,075.6 17.0 2,909.5 34.1 1,835.2 54.1
(a): Data for 1996.

Annex I
- 66 -
Table II-4 Imports of core cultural goods by region, 2002 IMPORTS
Total core cultural goods
Heritage goods Books Newspapers and
periodicals Other printed
matter Recorded media Visual arts
Audiovisual media
2002 Value
million US$
Share Value
million US$
Share Value
million US$
Share Value
million US$
Share Value
million US$
Share Value
million US$
Share Value
million US$
Share Value
million US$
Share
All available countries 63,668.4 2,644.2 11,738.0 4,675.1 2,620.0 19,394.7 12,911.0 9,685.5
Regional groupings
Americas 21,465.5 33.7 1,433.9 54.2 4,041.6 34.4 1,124.1 24.0 1,038.5 39.6 3,271.5 16.9 5,759.5 44.6 4,796.5 49.5 North America 19,173.9 30.1 1427.1 54.0 3,111.4 26.5 949.8 20.3 938.3 35.8 2,532.2 13.1 5,616.1 43.5 4,598.9 47.5 Latin America and the Caribbean 2,291.6 3.6 6.8 0.3 930.2 7.9 174.3 3.7 100.2 3.8 739.3 3.8 143.4 1.1 197.5 2.0
Europe 30,620.7 48.1 1,019.2 38.5 5,311.4 45.2 2,933.5 62.7 1,229.6 46.9 11,159.9 57.5 5,727.6 44.4 3,239.5 33.4 EU15 25,837.9 40.6 890.8 33.7 4,312.0 36.7 2,268.6 48.5 997.2 38.1 9,430.5 48.6 4,886.4 37.8 3,052.5 31.5 Other Europe 4,782.8 7.5 128.5 4.9 999.4 8.5 664.9 14.2 232.4 8.9 1,729.4 8.9 841.2 6.5 187.1 1.9
Africa 658.1 1.0 4.1 0.2 268.9 2.3 55.9 1.2 23.0 0.9 238.1 1.2 49.8 0.4 18.3 0.2 SACU 319.3 0.5 3.4 0.1 104.0 0.9 9.7 0.2 7.9 0.3 149.2 0.8 33.3 0.3 11.8 0.1 Other sub-Saharan countries 174.7 0.3 0.3 0.0 110.6 0.9 20.5 0.4 11.1 0.4 27.4 0.1 3.1 0.0 1.7 0.0 Northern Africa 164.1 0.3 0.4 0.0 54.4 0.5 25.7 0.5 4.0 0.2 61.5 0.3 13.4 0.1 4.82 0.0
Asia 9,363.2 14.7 160.9 6.1 1,711.0 14.6 348.5 7.5 265.6 10.1 4,234.5 21.8 1,259.1 9.8 1,383.6 14.3 Eastern Asia 6,932.3 10.9 149.3 5.6 1,128.2 9.6 253.8 5.4 222.8 8.5 2,950.6 15.2 1,096.9 8.5 1,130.8 11.7 South Central Asia 852.7 1.3 0.3 0.0 109.0 0.9 6.4 0.1 2.6 0.1 721.7 3.7 7.2 0.1 5.5 0.1 South Eastern Asia 952.5 1.5 9.3 0.4 342.0 2.9 45.0 1.0 25.0 1.0 279.7 1.4 54.9 0.4 196.6 2.0 Western Asia 625.6 1.0 1.9 0.1 131.8 1.1 43.4 0.9 15.1 0.6 282.5 1.5 100.1 0.8 50.7 0.5
Oceania 1,560.9 2.5 26.1 1.0 405.1 3.5 213.2 4.6 63.3 2.4 490.7 2.5 114.9 0.9 247.6 2.6
Economic groupings / Regional trade agreement
Low-income economies 1,003.3 1.6 0.6 0.0 202.6 1.7 26.4 0.6 13.8 0.5 740.6 3.8 12.8 0.1 6.5 0.07 Lower-middle-income economies 3,198.7 5.0 9.7 0.4 844.4 7.2 361.1 7.7 79.6 3.0 1,631.6 8.4 156.2 1.2 116.1 1.2 Upper-middle-income economies 2,988.3 4.7 33.7 1.3 1,044.9 8.9 252.4 5.4 152.8 5.8 1,029.9 5.3 237.0 1.8 237.5 2.5 High-income economies 56,478.1 88.7 2,600.3 98.34 9,646.1 82.2 4,035.2 86.3 2,373.7 90.6 15,992.5 82.5 12,505.0 96.9 9,325.3 96.3
COMESA 131.5 0.2 0.1 0.01 84.6 0.7 9.3 0.2 9.2 0.4 24.3 0.1 2.4 0.0 1.5 0.02 CIS 460.5 0.7 0.6 0.02 133.4 1.1 181.2 3.9 24.5 0.9 87.9 0.5 28.8 0.2 4.1 0.04 Arab States 389.2 0.6 0.9 0.03 134.4 1.1 41.1 0.9 12.6 0.5 121.8 0.6 57.6 0.4 20.8 0.2 MERCOSUR 420.6 0.7 5.1 0.2 159.1 1.4 35.4 0.8 8.4 0.3 167.1 0.9 24.6 0.2 20.8 0.2 NAFTA 20,323.3 31.9 1,428.5 54.0 3,525.9 30.0 1,022.8 21.9 1,003.6 38.3 2,896.8 14.9 5,688.0 44.1 4,757.6 49.1

Annex I
- 67 -
Tables III Trade by level of income Table III–1 Trade exports by category, 1994-2002
Total exports in million US$ 1994 1995 1996 1997 1998 1999 2000 2001 2002Heritage goods Low-income economies 0.1 7.6 0.7 0.2 0.2 0.2 11.5 1.6 19.7 Lower–middle-income economies 31.7 33.0 37.4 53.9 41.0 34.0 27.8 10.1 16.1 Upper-middle-income economies 26.7 45.9 19.3 241.8 42.2 29.7 9.7 7.5 10.1 High-income economies 1,403.0 1,499.9 1,407.5 1,526.5 1,597.1 1,759.1 2,026.9 840.1 1,761.5 Total of all available countries 1,461.5 1,586.3 1,465.0 1,822.4 1,680.4 1,823.0 2,075.9 859.4 1,807.4Books Low-income economies 20.2 26.1 27.0 24.3 30.0 35.4 48.0 37.7 48.2 Lower-middle-income economies 232.6 305.2 563.0 673.1 802.3 723.6 804.8 875.9 857.1 Upper-middle-income economies 310.4 416.0 399.9 440.5 493.3 461.4 485.4 496.1 537.2 High-income economies 7,878.2 9,233.3 9,387.1 9,312.9 9,293.0 9,328.6 9,192.4 9,250.7 9,392.5 Total of all available countries 8,441.4 9,980.5 10,377.0 10,450.9 10,618.7 10,549.0 10,530.7 10,660.4 10,835.0Newspapers and periodicals Low-income economies 6.5 7.9 11.9 10.6 13.7 15.9 11.4 11.9 13.5 Lower-middle-income economies 60.8 67.4 51.9 63.3 61.6 62.6 60.1 72.3 76.0 Upper-middle-income economies 101.0 155.9 180.0 222.9 256.6 214.0 223.1 230.4 214.3 High-income economies 3,638.0 4,614.6 4,502.8 4,179.5 4,256.2 4,074.0 3,851.2 3,875.0 4,094.5 Total of all available countries 3,806.3 4,845.9 4,746.7 4,476.3 4,588.2 4,366.6 4,145.8 4,189.7 4,398.3Other printed matter Low-income economies 3.2 6.5 3.2 3.5 3.7 5.2 5.4 5.5 7.0 Lower–middle-income economies 87.5 102.0 82.1 118.2 124.2 107.0 135.8 125.2 141.9 Upper-middle-income economies 65.9 71.0 79.1 89.8 90.1 106.5 120.5 104.9 114.2 High-income economies 1,512.5 1,765.6 1,796.5 1,820.5 1,781.0 1,783.0 1,727.2 1,757.5 1,895.9 Total of all available countries 1,669.2 1,945.2 1,961.0 2,031.9 1,999.1 2,001.7 1,988.9 1,993.1 2,158.9Recorded media Low income economies 88.3 127.3 149.8 208.4 215.4 205.8 330.2 180.2 193.2 Lower middle income economies 86.1 75.8 201.7 302.8 270.0 342.6 366.2 503.4 444.2 Upper-middle-income economies 230.2 358.0 459.9 285.8 336.5 355.2 343.6 384.5 447.3 High-income economies 12,158.7 13,453.3 14,496.3 14,950.9 15,347.8 17,610.7 18,068.8 16,869.3 17,424.9 Total of all available countries 12,563.3 14,014.4 15,307.6 15,747.9 16,169.7 18,514.3 19,108.8 17,937.4 18,509.4Visual arts Low-income economies 16.8 24.0 18.0 21.8 22.4 59.1 29.7 19.6 31.9 Lower-middle-income economies 1,041.1 1,150.7 1,281.2 1,583.3 1,657.6 1,948.5 2,397.9 2,289.6 2,581.0 Upper-middle-income economies 346.2 236.5 251.1 342.2 326.0 372.4 287.2 243.0 212.8 High-income economies 5,286.3 5,383.3 4,980.9 5,775.8 5,785.7 5,913.5 7,120.8 5,096.6 6,915.4 Total of all available countries 6,690.4 6,794.4 6,531.2 7,723.1 7,791.8 8,293.5 9,835.7 7,648.8 9,741.0Audiovisual media Low-income economies 8.8 11.5 15.0 23.3 24.0 27.5 25.9 18.1 15.6 Lower–middle-income economies 194.5 437.3 399.1 189.1 239.1 327.8 460.3 700.7 2,295.0 Upper-middle-income economies 126.9 227.6 304.3 96.6 201.7 161.8 68.6 532.9 1,469.6 High-income economies 1,260.2 2,306.7 2,866.4 3,547.2 3,718.7 4,819.4 2,956.6 2,961.9 3,436.2 Total of all available countries 1,590.4 2,983.1 3,584.7 3,856.2 4,183.6 5,336.4 3,511.5 4,213.5 7,216.4Total core cultural goods Low-income economies 143.9 210.9 225.6 292.1 309.5 349.0 462.1 274.5 329.0 Lower-middle-income economies 1,734.4 2,171.3 2,616.4 2,983.7 3,195.9 3,546.3 4,253.0 4,577.2 6,411.1 Upper-middle-income economies 1,207.2 1,510.8 1,693.6 1,719.6 1,746.5 1,700.9 1,538.2 1,999.3 3,005.4 High-income economies 33,136.9 38,256.7 39,437.6 41,113.3 41,779.6 45,288.4 44,944.0 40,651.2 44,920.9 Total of all available countries 36,222.5 42,149.8 43,973.3 46,108.8 47,031.4 50,884.5 51,197.3 47,502.3 54,666.4

Annex I
- 68 -
Table III–2 Trade imports by category, 1994-2002
Total imports in million US$ 1994 1995 1996 1997 1998 1999 2000 2001 2002 Heritage goods Low-income economies 0.0 0.1 0.2 0.1 0.2 0.3 0.2 0.3 0.6 Lower-middle-income economies 8.7 29.3 25.4 14.9 14.7 16.6 115.3 40.3 9.7 Upper-middle-income economies 6.8 43.7 10.0 43.8 27.8 60.5 14.8 10.2 33.7 High-income economies 1,872.4 1,813.6 1,925.3 2,495.3 2,604.9 2,836.7 2,924.0 2,667.4 2,600.3 Total of all available countries 1,887.9 1,886.7 1,960.8 2,554.2 2,647.6 2,914.0 3,054.4 2,718.2 2,644.2 Books Low-income economies 73.3 146.4 125.6 179.2 188.2 193.9 234.8 156.9 202.6 Lower–middle-income economies 546.2 703.6 978.9 1,071.6 1,055.9 775.3 839.6 912.9 844.4 Upper-middle-income economies 792.6 782.1 832.1 889.5 1,021.7 1,022.8 1,100.3 1,156.0 1,044.9 High-income economies 7,228.2 8,573.9 8,718.5 8,853.1 8,792.3 9,159.9 9,205.8 9,355.2 9,646.1 Total of all available countries 8,640.2 10,206.0 10,655.0 10,993.5 11,058.1 11,151.9 11,380.4 11,581.0 11,738.0 Newspapers and periodicals Low-income economies 8.6 30.4 24.5 29.8 34.1 32.1 29.3 31.4 26.4 Lower–middle-income economies 116.5 199.2 482.4 529.8 492.9 326.5 336.7 364.5 361.1 Upper-middle-income economies 293.3 290.6 266.1 280.8 356.1 318.7 283.4 291.8 252.4 High-income economies 3,415.6 4,110.7 4,001.8 3,951.8 4,190.3 4,317.8 4,065.2 3,904.7 4,035.2 Total of all available countries 3,833.9 4,630.8 4,774.8 4,792.2 5,073.5 4,995.0 4,714.6 4,592.5 4,675.1 Other printed matter Low-income economies 3.6 8.2 9.2 9.0 15.3 11.9 14.3 8.8 13.8 Lower–middle-income economies 33.5 58.5 65.7 94.7 89.6 64.7 69.8 78.2 79.6 Upper-middle-income economies 109.6 117.9 119.4 127.8 132.2 158.6 138.8 144.6 152.8 High-income economies 1,749.8 1,955.9 2,023.9 2,092.0 1,965.5 2,018.1 2,117.7 2,172.3 2,373.7 Total of all available countries 1,896.6 2,140.5 2,218.2 2,323.5 2,202.6 2,253.2 2,340.7 2,403.9 2,620.0 Recorded media Low-income economies 57.6 160.5 120.6 221.0 237.0 312.7 406.5 475.6 740.6 Lower–middle-income economies 404.1 630.8 925.9 890.0 931.8 1,184.3 1,463.0 1,586.9 1,626.0 Upper-middle-income economies 612.9 624.4 772.6 1,001.6 1,105.8 1,180.9 1,291.9 1,311.6 1,029.9 High-income economies 11,161.1 13,624.7 14,303.5 14,250.8 14,932.6 16,295.1 16,235.1 15,486.1 15,992.5 Total of all available countries 12,235.7 15,040.5 16,122.6 16,363.4 17,207.2 18,973.0 19,396.5 18,860.0 19,389.0 Visual arts Low-income economies 6.3 3.9 5.1 4.6 6.0 7.5 11.7 13.5 12.8 Lower–middle-income economies 67.7 86.4 122.8 153.9 118.4 128.5 153.2 133.1 156.2 Upper-middle-income economies 135.9 149.0 131.3 284.7 228.0 266.6 202.9 213.1 237.0 High-income economies 8,316.0 8,383.1 8,290.9 9,532.4 10,518.0 11,290.2 12,909.2 12,834.2 12,505.0 Total of all available countries 8,525.8 8,622.3 8,550.0 9,975.6 10,870.3 11,692.8 13,276.9 13,193.9 12,911.0 Audiovisual media Low-income economies 1.8 4.0 5.9 7.3 7.9 7.8 7.9 5.9 6.5 Lower–middle-income economies 74.5 118.6 160.3 143.0 145.7 136.1 112.6 117.9 116.1 Upper-middle-income economies 79.8 73.4 109.1 85.1 116.1 145.2 119.4 145.9 237.5 High-income economies 3,235.8 3,401.9 4,109.5 6,457.7 6,696.4 6,340.0 5,574.6 7,470.3 9,325.3 Total of all available countries 3,391.9 3,598.0 4,384.9 6,693.2 6,966.1 6,629.1 5,814.5 7,740.0 9,685.5 Total core cultural goods Low-income economies 151.3 353.4 291.2 451.0 488.8 566.1 704.8 692.4 1,003.3 Lower–middle-income economies 904.6 1,356.2 1,956.1 2,229.0 2,154.1 1,760.3 2,033.7 2,122.5 2,307.6 Upper-middle-income economies 2,030.8 2,081.0 2,240.5 2,713.4 2,987.7 3,153.3 3,151.4 3,273.2 2,988.3 High-income economies 36,978.9 41,863.9 43,373.3 47,633.2 49,700.0 52,257.7 53,031.6 53,890.1 56,478.1 Total of all available countries 40,412.0 46,124.9 48,666.4 53,695.6 56,025.4 58,609.1 59,978.0 61,089.5 63,662.8

Annex I
- 69 -
Table III–3 Trend in trade of core cultural goods
4 Calculated as Annual compound growth rate is defined as the following: 100*]1[0
−n n
VV
Average annual growth rates4, 1994-2002 Goods categories Level of income Exports Imports Heritage goods Low-income economies 90.0 49.8 Lower-middle-income economies -8.1 1.3 Upper-middle-income economies -11.4 22.2 High-income economies 2.9 4.2 Total of all available countries 2.7 4.3Books Low-income economies 11.5 13.5 Lower–middle-income economies 17.7 5.6 Upper-middle-income economies 7.1 3.5 High-income economies 2.2 3.7 Total of all available countries 3.2 3.9Newspapers and periodicals Low-income economies 9.6 15.1 Lower–middle-income economies 2.8 15.2 Upper-middle-income economies 9.9 -1.9 High-income economies 1.5 2.1 Total of all available countries 1.8 2.5Other printed matter Low-income economies 10.3 18.3 Lower-middle-income economies 6.2 11.4 Upper-middle-income economies 7.1 4.2 High-income economies 2.9 3.9 Total of all available countries 3.3 4.1Recorded media Low-income economies 10.3 37.6 Lower-middle-income economies 22.8 19.0 Upper-middle-income economies 8.7 6.7 High-income economies 4.6 4.6 Total of all available countries 5.0 5.9Visual arts Low-income economies 8.4 9.2 Lower-middle-income economies 12.0 11.0 Upper-middle-income economies -5.9 7.2 High-income economies 3.4 5.2 Total of all available countries 4.8 5.3Audiovisual media Low-income economies 7.4 17.1 Lower–middle-income economies 36.1 5.7 Upper-middle-income economies 35.8 14.6 High-income economies 13.4 14.1 Total of all available countries 20.8 14.0Total core cultural goods Low-income economies 10.9 26.7 Lower–middle-income economies 17.8 12.4 Upper-middle-income economies 12.1 4.9 High-income economies 3.9 5.4 Total of all available countries 5.3 5.8

Annex I
- 70 -
Table III-4 Trade coverage ratio5 of core cultural goods by category, 1994-2002
Total imports in million US$ 1994 1995 1996 1997 1998 1999 2000 2001 2002Heritage goods Low-income economies 512.1 11495.7 478.8 136.6 84.8 60.9 5040.1 495.5 3,426.6 Lower–middle-income economies 364.1 112.3 147.2 361.0 278.6 205.5 24.1 25.2 166.9 Upper-middle-income economies 394.3 105.0 193.7 551.7 151.9 49.0 65.4 73.9 30.0 High-income economies 74.9 82.7 73.1 61.2 61.3 62.0 69.3 31.5 67.7Books Low-income economies 27.6 17.8 21.5 13.6 16.0 18.2 20.5 24.0 23.8 Lower–middle-income economies 42.6 43.4 57.5 62.8 76.0 93.3 95.9 95.9 101.5 Upper-middle-income economies 39.2 53.2 48.1 49.5 48.3 45.1 44.1 42.9 51.4 High-income economies 109.0 107.7 107.7 105.2 105.7 101.8 99.9 98.9 97.4Newspapers and periodicals Low-income economies 75.6 26.1 48.6 35.5 40.0 49.6 38.8 38.0 51.0 Lower–middle-income economies 52.3 33.9 10.8 12.0 12.5 19.2 17.9 19.8 21.1 Upper-middle-income economies 34.4 53.7 67.6 79.4 72.1 67.2 78.7 78.9 84.9 High-income economies 106.5 112.3 112.5 105.8 101.6 94.4 94.7 99.2 101.5Other printed matter Low-income economies 88.6 79.8 35.2 39.1 24.4 43.8 37.5 62.7 50.6 Lower–middle-income economies 260.9 174.4 124.9 124.7 138.7 165.5 194.4 160.1 178.1 Upper-middle-income economies 60.1 60.2 66.3 70.3 68.2 67.2 86.8 72.5 74.7 High-income economies 86.4 90.3 88.8 87.0 90.6 88.3 81.6 80.9 79.9Recorded media Low-income economies 153.3 79.3 124.2 94.3 90.9 65.8 81.2 37.9 26.1 Lower–middle-income economies 21.3 12.0 21.8 34.0 29.0 28.9 25.0 31.7 27.3 Upper-middle-income economies 37.6 57.3 59.5 28.5 30.4 30.1 26.6 29.3 43.4 High-income economies 108.9 98.7 101.3 104.9 102.8 108.1 111.3 108.9 109.0Visual arts Low-income economies 265.3 613.1 351.4 478.9 375.0 784.1 254.6 145.1 248.9 Lower–middle-income economies 1,538.9 1,332.5 1,043.5 1,028.7 1,400.2 1,516.4 1,565.5 1,720.2 1,652.7 Upper-middle-income economies 254.8 158.8 191.3 120.2 143.0 139.7 141.6 114.0 89.8 High-income economies 63.6 64.2 60.1 60.6 55.0 52.4 55.2 39.7 55.3Audiovisual media Low-income economies 477.7 284.8 252.5 319.8 302.9 353.1 328.3 305.6 239.2 Lower–middle-income economies 261.2 368.6 248.9 132.2 164.2 240.8 408.9 594.3 1,976.7 Upper-middle-income economies 159.1 310.1 278.8 113.5 173.7 111.4 57.5 365.2 618.7 High-income economies 38.9 67.8 69.8 54.9 55.5 76.0 53.0 39.6 36.8Total core cultural goods Low-income economies 95.2 59.7 77.5 64.8 63.3 61.7 65.6 39.6 32.8 Lower–middle-income economies 138.6 118.9 94.7 103.0 112.2 134.7 137.6 141.5 200.8 Upper-middle-income economies 59.4 72.6 75.6 63.4 58.5 53.9 48.8 61.1 100.6 High-income economies 89.6 91.4 90.9 86.3 84.1 86.7 84.7 75.4 79.5
5 Coverage ratio (CR) is defined as the following : 100*MXCR = , where X = exports and M = imports.

Annex I
- 71 -
Tables IV Partner country analysis
Table IV-1 Top 15 partner countries of the USA, 1994 and 2003
Exports Value
2003 in million US$
Share
Exports Value
1994 in million US$
Share
World 7,977.0 World 8,222.8 Canada 3,210.4 40.2 Canada 2,592.7 31.5United Kingdom 955.2 12.0 United Kingdom 848.6 10.3Switzerland 448.8 5.6 Japan 782.9 9.5Japan 417.2 5.2 Germany 472.6 5.7Mexico 284.6 3.6 Mexico 418.0 5.1Germany 263.6 3.3 Australia 335.9 4.1France 219.0 2.7 Switzerland 323.7 3.9Republic of Korea 203.3 2.5 France 261.6 3.2Australia 192.0 2.4 Netherlands 207.9 2.5Netherlands 175.6 2.2 Rep. of Korea 174.6 2.1Spain 125.1 1.6 Singapore 164.7 2.0Hong Kong, China 121.4 1.5 Hong Kong SAR of China 138.0 1.7India 114.0 1.4 Brazil 126.8 1.5China 112.0 1.4 Other Asia, n.e.s. 118.7 1.4
Singapore 94.2 1.2 South African Customs Union 91.2 1.1
Rest of available countries 1,040.6 13.0 Rest of available countries 1,164.9 14.2
Imports Value
2003 in million US$
Share
Imports Value 1994 in
million US$ Share
World 13,662.8 World 7,674.1 China 4,209.1 30.8 Japan 1,396.8 18.2United Kingdom 1,504.9 11.0 United Kingdom 1,222.0 15.9France 1,489.9 10.9 France 642.5 8.4Canada 1,428.2 10.5 China 639.6 8.3Germany 575.7 4.2 Canada 633.0 8.2Italy 548.3 4.0 Switzerland 304.1 4.0Japan 498.4 3.6 Hong Kong, China 286.6 3.7Hong Kong, China 456.0 3.3 Other Asia, n.e.s 281.5 3.7Mexico 407.2 3.0 Germany 279.8 3.6Switzerland 288.0 2.1 Italy 278.5 3.6Spain 249.2 1.8 Mexico 234.1 3.1Other Asia, n.e.s 223.5 1.6 Singapore 198.8 2.6Netherlands 222.6 1.6 Spain 153.4 2.0Singapore 157.3 1.2 Netherlands 148.0 1.9Republic of Korea 151.9 1.1 Thailand 123.8 1.6Rest of available countries 1,252.6 9.2 Rest of available countries 851.6 11.1

Annex I
- 72 -
Table IV–2 Top 15 partner countries of China, 1994 and 2003
Exports Value 2003 in million US$
Share
Exports Value 1994 in million US$
Share
World 5,821.3 World 1,091.3 United States of America 2,019.9 34.7 United States of America 341.2 31.3Hong Kong, China 1,040.5 17.9 Hong Kong, China 215.6 19.8Netherlands 843.3 14.5 Japan 122.7 11.2Japan 385.9 6.6 Germany 56.5 5.2United Kingdom 376.9 6.5 United Kingdom 52.5 4.8Canada 137.1 2.4 Spain 29.6 2.7Germany 135.2 2.3 Netherlands 29.1 2.7Australia 118.4 2.0 France 22.1 2.0Italy 69.5 1.2 Canada 21.5 2.0Other Asia, n.e.s. 62.2 1.1 Singapore 20.7 1.9Spain 55.1 0.9 Italy 18.7 1.7France 47.1 0.8 Other Asia, n.e.s. 17.3 1.6United Arab Emirates 38.8 0.7 Australia 12.9 1.2Republic of Korea 36.5 0.6 Saudi Arabia 9.4 0.9Belgium 36.0 0.6 Russian Federation 7.9 0.7Rest of available countries 418.8 7.2 Rest of available countries 113.5 10.4
Imports Value 2003 in million US$
Share
Imports Value 1994 in million US$
Share
World 1,285.8 World 141.1 United States of America 285.5 22.2 United States of America 41.3 29.3Germany 189.2 14.7 Hong Kong, China 35.0 24.8Hong Kong, China 160.5 12.5 Japan 26.5 18.8Singapore 131.4 10.2 Other Asia, n.e.s 15.7 11.2Finland 91.2 7.1 Germany 4.34 3.1Japan 82.5 6.4 Republic of Korea 4.16 3.0Other Asia, n.e.s. 73.5 5.7 France 2.27 1.6Ireland 60.8 4.7 Singapore 2.25 1.6Free Zones 40.7 3.2 Italy 2.22 1.6United Kingdom 33.0 2.6 United Kingdom 2.19 1.6Republic of Korea 25.0 1.9 Free Zones 1.52 1.1Australia 24.0 1.9 Canada 0.48 0.3Denmark 15.7 1.2 Switzerland 0.36 0.3France 13.3 1.0 Australia 0.30 0.2Russian Federation 12.1 0.9 Macao, China 0.27 0.2Rest of available countries 47.4 3.7 Rest of available countries 2.13 1.5
n.e.s. = Not elsewhere specified

Annex I
- 73 -
Table IV-3 Top 15 partner countries of South Africa, 2003
Exports Value 2003 in million US$
Share
World 64.1 United States of America 12.8 19.9United Kingdom 10.4 16.2Zambia 6.6 10.4Mozambique 2.9 4.5Zimbabwe 2.9 4.5United Rep. of Tanzania 2.5 3.9Malawi 2.4 3.7Germany 2.0 3.2Angola 1.9 2.9Nigeria 1.7 2.6Mauritius 1.7 2.6Dem. Rep. of the Congo 1.6 2.5Kenya 1.5 2.3Australia 1.4 2.2Netherlands 0.8 1.3Rest of available countries 11.1 17.3
Imports Value 2003 in million US$
Share
World 322.6 United Kingdom 87.8 27.2United States of America 68.8 21.3Ireland 34.6 10.7Germany 20.2 6.3Areas, n.e.s. 19.1 5.9China 16.7 5.2Netherlands 8.3 2.6France 6.6 2.1Australia 5.8 1.8Japan 5.2 1.6Singapore 4.8 1.5Italy 4.5 1.4Other Asia, n.e.s. 4.3 1.3Switzerland 4.0 1.2Hong Kong, China 3.9 1.2Rest of available countries 27.9 8.7

Annex I
- 74 -
Table IV-4 Top 15 partner countries of Brazil, 1994 and 2003
Exports Value 2003 in million US$
Share
Exports Value 1994 in million US$
Share
World 54.4 World 56.9 Portugal 15.7 28.9 Argentina 18.2 32.0United States of America 14.1 25.9 Japan 16.4 28.8Japan 6.5 11.9 Portugal 7.1 12.4Colombia 2.4 4.4 United States of America 5.2 9.1Chile 2.3 4.3 Italy 1.7 2.9Argentina 2.2 4.0 Mexico 1.5 2.6Mexico 2.1 3.8 Chile 0.87 1.5Spain 1.8 3.3 Uruguay 0.87 1.5France 1.1 1.9 France 0.61 1.1South Africa 0.62 1.1 Spain 0.46 0.8Angola 0.60 1.1 United Kingdom 0.45 0.8Italy 0.58 1.1 South African Customs Union 0.42 0.7Germany 0.43 0.8 Germany 0.37 0.6United Kingdom 0.42 0.8 Switzerland 0.37 0.6Peru 0.41 0.7 Colombia 0.30 0.5Rest of available countries 3.2 5.9 Rest of available countries 2.2 3.9
Imports Value 2003 in
million US$ Share
Imports Value 1994 in
million US$ Share
World 105.7 World 166.0 United States of America 30.4 28.8 United States of America 68.5 41.3United Kingdom 17.2 16.3 Japan 18.1 10.9Spain 8.7 8.2 United Kingdom 15.9 9.6China 5.5 5.2 Chile 15.6 9.4Argentina 5.5 5.2 Germany 8.4 5.0France 4.2 4.0 Portugal 5.3 3.2Germany 4.2 4.0 Italy 5.1 3.1Japan 3.8 3.6 Hong Kong, China 4.0 2.4Peru 3.4 3.3 Spain 3.9 2.3Uruguay 3.4 3.2 France 3.6 2.2Portugal 3.1 2.9 Denmark 3.2 1.9Hong Kong, China 3.1 2.9 Argentina 2.8 1.7Chile 2.6 2.5 Netherlands 1.5 0.9Italy 2.6 2.4 Other Asia, n.e.s. 1.5 0.9Sweden 1.1 1.0 Mexico 1.4 0.8Rest of available countries 6.9 6.6 Rest of available countries 7.2 4.3
n.e.s. = Not elsewhere specified

Annex I
- 75 -
Table IV-5 Top 15 partner countries of Egypt, 1994 and 2002
Exports Value 2002 in million US$
Share
Exports Value 1994 in million US$
Share
World 10.72 World 15.48 Saudi Arabia 1.66 15.5 Saudi Arabia 3.96 25.6United States of America 0.87 8.1 United States of America 1.31 8.5Libya 0.81 7.6 United Arab Emirates 1.29 8.3Yemen 0.72 6.7 Kuwait 0.89 5.7Algeria 0.71 6.6 Germany 0.64 4.2United Arab Emirates 0.66 6.2 Morocco 0.63 4.1Lebanon 0.64 5.9 Israel 0.54 3.5United Kingdom 0.39 3.7 France 0.51 3.3Kuwait 0.32 3.0 Oman 0.48 3.1Morocco 0.30 2.8 Bahrain 0.45 2.9France 0.28 2.6 Qatar 0.43 2.8Malaysia 0.27 2.5 United Kingdom 0.41 2.7Oman 0.23 2.1 Greece 0.37 2.4Jordan 0.23 2.1 Lebanon 0.36 2.4Germany 0.22 2.1 Sudan 0.30 2.0Rest of available countries 2.42 22.6 Rest of available countries 2.89 18.7
Imports Value 2002 in million US$
Share
Imports Value 1994 in million US$
Share
World 33.21 World 22.1 United Kingdom 7.23 21.8 United Kingdom 5.1 22.9China 6.37 19.2 Lebanon 2.6 11.6United States of America 2.93 8.8 United States of America 2.3 10.3Lebanon 2.91 8.8 China 2.3 10.3Germany 1.90 5.7 Germany 1.5 6.6United Arab Emirates 1.57 4.7 Italy 0.9 4.3France 1.36 4.1 Kuwait 0.9 4.2Italy 1.25 3.8 France 0.8 3.6Kuwait 1.11 3.3 Netherlands 0.8 3.6Saudi Arabia 0.89 2.7 United Arab Emirates 0.8 3.5Syria 0.70 2.1 Hong Kong, China 0.8 3.4Qatar 0.39 1.2 Spain 0.5 2.3Japan 0.36 1.1 Free Zones 0.3 1.4Spain 0.34 1.0 Switzerland 0.3 1.4Greece 0.32 1.0 Other Asia, n.e.s. 0.3 1.4Rest of available countries 3.57 10.8 Rest of available countries 2.0 9.2
n.e.s. = Not elsewhere specified

Annex I
- 76 -
Tables V Top 20 importers and exporters for the main core cultural goods categories Table V-1 Heritage goods
Heritage goods
EXPORTS Million US$ in 2002 Share
All available countries 1,807.4 100Rank Sub-total for five countries 1,579.0 87.4
2001/2002 % change in $
value
Average annual % change
(1994/2002) 1 United Kingdom 1,052.6 58.2 -6.3(a) 5.2 2 France 189.2 10.5 -6.2 1.0 3 United States of America 143.2 7.9 -31.4 8.3 4 Switzerland 120.2 6.7 24.2 -5.9 5 Germany 73.9 4.1 -10.7 6.0 6 Belgium 35.4 2.0 -12.9 -3.4(b) 7 Canada 27.5 1.5 -13.5 -9.7 8 Norway 23.7 1.3 372.2 1.4 9 Zimbabwe 18.5 1.0 71.8 44.0(c) 10 Denmark 16.7 0.9 -21.2 31.2 11 Netherlands 15.4 0.8 -16.0 -9.1 12 Austria 13.8 0.8 -0.5 0.0 13 Italy 9.9 0.5 -7.7 1.7 14 Australia 9.7 0.5 -30.9 7.1 15 South Africa 9.3 0.5 87.8 4.8(c) 16 Japan 8.1 0.4 -76.8 11.4 17 Sweden 7.5 0.4 21.8 8.2 18 Ireland 5.4 0.3 -52.3 -8.1 19 Singapore 3.7 0.2 -42.7 25.0 20 Poland 3.3 0.2 1.7 -1.0
Heritage goods
IMPORTS Million US$ in 2002 Share
All available countries 2,644.2 100Rank Sub-total for five countries 2,322.1 60.04
2001/2002 % change in $ value
Average annual % change
(1994/2002)
1 United States of America 1394.2 52.7 -3.7 8.0 2 United Kingdom 673.2 25.5 24.5 2.2 3 Switzerland 99.0 3.7 -25.2 -5.1 4 Hong Kong, China 89.2 3.4 -30.4 8.7 5 France 66.5 2.5 14.2 5.4 6 Japan 50.7 1.9 0.5 -7.2 7 Germany 42.3 1.6 -25.7 -5.5 8 Canada 32.9 1.2 -94.3 7.2 9 Belgium 30.6 1.2(b) -4.0 -10.0(b) 10 Australia 22.4 0.8 9.5 -5.1 11 Netherlands 20.5 0.8 -64.8 -0.3 12 Czech Republic 19.7 0.7 97.8 57.4 13 Austria 16.0 0.6 -6.2 6.5 14 Italy 10.8 0.4 -7.2 3.8 15 Spain 9.1 0.3 7.7 2.8 16 Sweden 8.7 0.3 27.0 22.1 17 Republic of Korea 6.5 0.2 8.0 -9.6 18 Denmark 5.2 0.2 -66.2 -4.1 19 Singapore 4.9 0.2 -4.6 -8.8 20 Poland 4.9 0.2 43.0 15.6
(a): Average between 2000 and 2002. (b): 1999/2002. (c): 1995/2002.
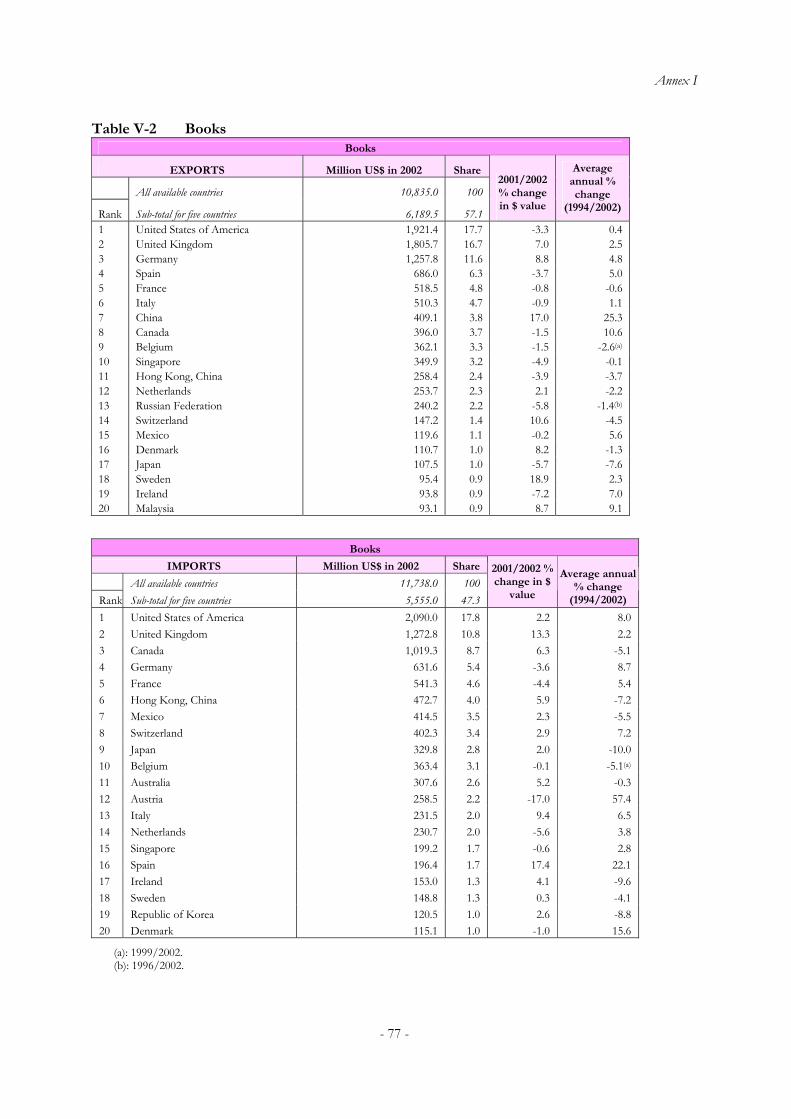
Annex I
- 77 -
Table V-2 Books Books
EXPORTS Million US$ in 2002 Share
All available countries 10,835.0 100
Rank Sub-total for five countries 6,189.5 57.1
2001/2002 % change in $ value
Average annual % change
(1994/2002)
1 United States of America 1,921.4 17.7 -3.3 0.4 2 United Kingdom 1,805.7 16.7 7.0 2.5 3 Germany 1,257.8 11.6 8.8 4.8 4 Spain 686.0 6.3 -3.7 5.0 5 France 518.5 4.8 -0.8 -0.6 6 Italy 510.3 4.7 -0.9 1.1 7 China 409.1 3.8 17.0 25.3 8 Canada 396.0 3.7 -1.5 10.6 9 Belgium 362.1 3.3 -1.5 -2.6(a) 10 Singapore 349.9 3.2 -4.9 -0.1 11 Hong Kong, China 258.4 2.4 -3.9 -3.7 12 Netherlands 253.7 2.3 2.1 -2.2 13 Russian Federation 240.2 2.2 -5.8 -1.4(b) 14 Switzerland 147.2 1.4 10.6 -4.5 15 Mexico 119.6 1.1 -0.2 5.6 16 Denmark 110.7 1.0 8.2 -1.3 17 Japan 107.5 1.0 -5.7 -7.6 18 Sweden 95.4 0.9 18.9 2.3 19 Ireland 93.8 0.9 -7.2 7.0 20 Malaysia 93.1 0.9 8.7 9.1
Books
IMPORTS Million US$ in 2002 Share
All available countries 11,738.0 100Rank Sub-total for five countries 5,555.0 47.3
2001/2002 % change in $
value
Average annual % change
(1994/2002)
1 United States of America 2,090.0 17.8 2.2 8.0 2 United Kingdom 1,272.8 10.8 13.3 2.2 3 Canada 1,019.3 8.7 6.3 -5.1 4 Germany 631.6 5.4 -3.6 8.7 5 France 541.3 4.6 -4.4 5.4 6 Hong Kong, China 472.7 4.0 5.9 -7.2 7 Mexico 414.5 3.5 2.3 -5.5 8 Switzerland 402.3 3.4 2.9 7.2 9 Japan 329.8 2.8 2.0 -10.0 10 Belgium 363.4 3.1 -0.1 -5.1(a) 11 Australia 307.6 2.6 5.2 -0.3 12 Austria 258.5 2.2 -17.0 57.4 13 Italy 231.5 2.0 9.4 6.5 14 Netherlands 230.7 2.0 -5.6 3.8 15 Singapore 199.2 1.7 -0.6 2.8 16 Spain 196.4 1.7 17.4 22.1 17 Ireland 153.0 1.3 4.1 -9.6 18 Sweden 148.8 1.3 0.3 -4.1 19 Republic of Korea 120.5 1.0 2.6 -8.8 20 Denmark 115.1 1.0 -1.0 15.6
(a): 1999/2002. (b): 1996/2002.

Annex I
- 78 -
Table V–3 Newspapers and periodicals Newspapers and periodicals
EXPORTS Million US$ in 2002 Share
All available countries 4,398.3 100
Rank Sub-total for five countries 2,954.0 66.9
2001/2002 % change in $ value
Average annual % change
(1994/2002)
1 United States of America 880.5 20.0 -5.3 0.8 2 United Kingdom 745.0 16.9 30.8 5.5 3 Germany 711.1 16.2 7.8 -2.5 4 France 368.7 8.4 -4.2 -0.6 5 Spain 238.8 5.4 2.8 8.9 6 Italy 202.3 4.6 4.4 -0.2 7 Canada 160.9 3.7 10.4 2.1 8 Belgium 146.6 3.3 26.5 1.4 (a) 9 Netherlands 142.8 3.2 2.0 1.3 10 Finland 126.1 2.9 5.1 5.3 11 Austria 54.4 1.2 1.1 -5.0 12 Poland 49.8 1.1 30.0 36.4 13 Denmark 48.2 1.1 -25.1 0.0 14 Slovakia 42.5 1.0 4.2 13.6 15 Switzerland 41.0 0.9 -20.7 -7.8 16 Singapore 35.9 0.8 5.2 0.8 17 Hong Kong, China 35.1 0.8 -20.1 -1.3 18 Japan 34.4 0.8 -2.8 -4.3 19 Czech Republic 34.3 0.8 1.9 18.9 20 Mexico 32.9 0.7 -6.1 10.8
Newspapers and periodicals
IMPORTS Million US$ in 2002 Share
All available countries 4,675.1 100Rank Sub-total for five countries 1,983.4 42.4
2001/2002 % change in $
value
Average annual % change
(1994/2002)
1 Canada 646.7 13.8 -4.1 0.6 2 France 402.0 8.6 6.6 2.3 3 Germany 328.7 7.0 3.3 0.8 4 United States of America 303.1 6.5 4.7 3.6 5 Switzerland 303.0 6.5 12.4 0.0 6 United Kingdom 300.9 6.4 25.8 8.2 7 Belgium 259.2 5.5 0.5 -6.2 (a) 8 Italy 180.0 3.9 -3.6 6.6 9 Spain 165.9 3.5 7.9 5.2 10 Austria 164.4 3.5 16.8 -5.1 11 Russian Federation 164.3 3.5 16.5 -4.1(b) 12 Australia 150.1 3.2 0.2 -1.0 13 Japan 127.1 2.7 -19.3 -2.6 14 Netherlands 92.1 2.0 -1.6 -3.1 15 Portugal 91.9 2.0 9.0 5.3 16 Ireland 87.6 1.9 5.1 1.5 17 Mexico 73.0 1.6 2.4 -3.1 18 Sweden 57.6 1.2 19.1 -4.7 19 New Zealand 56.7 1.2 8.9 -0.8 20 China 52.7 1.1 32.6 26.0
(a): 1999/2002. (b): 1996/2002

Annex I
- 79 -
Table V–4 Other printed matter Other printed matter
EXPORTS Million US$ in 2002 Share
All available countries 2,308.0 100
Rank Sub-total for five countries 1,315.5 57.0
2001/2002 % change in $ value
Average annual % change
(1994/2002)
1 United States of America 400.7 17.4 -7.4 3.7 2 Germany 274.8 11.9 9.4 -0.3 3 United Kingdom 274.6 11.9 26.2 3.6 4 Canada 252.8 11.0 15.8 12.4 5 Italy 112.6 4.9 19.3 0.4 6 France 104.7 4.5 19.6 5.1 7 China 92.4 4.0 33.1 15.9 8 Switzerland 91.6 4.0 4.6 -2.9 9 Mexico 61.8 2.7 7.2 10.6 10 Belgium 51.3 2.2 11.2 -8.0(a) 11 Netherlands 50.1 2.2 13.3 -1.0 12 Spain 45.4 2.0 20.9 13.6 13 Sweden 34.8 1.5 13.6 1.4 14 Denmark 32.0 1.4 -25.2 -0.3 15 Republic of Korea 24.9 1.1 -7.2 1.0 16 Austria 22.7 1.0 -5.3 -0.8 17 Finland 20.8 0.9 9.8 7.0 18 Australia 18.2 0.8 37.4 6.0 19 Hong Kong, China 18.1 0.8 -5.2 -6.2 20 Russian Federation 16.5 0.7 -25.3 7.1(b)
Other printed matter
IMPORTS Million US$ in 2002 Share
All available countries 2,620.0 100Rank Sub-total for five countries 1,445.2 55.2
2001/2002 % change in $ value
Average annual % change
(1994/2002)
1 United States of America 673.3 25.7 18.2 8.7 2 Canada 264.6 10.1 -7.6 6.9 3 United Kingdom 200.4 7.6 3.4 4.2 4 Germany 190.2 7.3 11.7 0.6 5 France 116.7 4.5 6.8 -0.7 6 Spain 112.4 4.3 28.9 17.1 7 Netherlands 112.1 4.3 8.8 3.7 8 Switzerland 105.0 4.0 5.7 0.1 9 Hong Kong, China 90.0 3.4 -0.3 6.3 10 Japan 70.1 2.7 4.8 -1.7 11 Mexico 65.3 2.5 38.3 3.1 12 Austria 56.6 2.2 18.6 -2.5 13 Belgium 53.0 2.0 7.2 6.6(a) 14 Australia 47.5 1.8 14.9 -5.6 15 Republic of Korea 40.6 1.5 52.2 25.0 16 Italy 36.5 1.4 8.5 1.3 17 Denmark 33.7 1.3 2.0 4.0 18 Norway 32.7 1.2 3.1 0.9 19 Sweden 28.5 1.1 -2.6 -3.4 20 Ireland 25.4 1.0 19.3 3.5
(a): 1999/2002 (b): 1996/2002

Annex I
- 80 -
Table V-5 Recorded media Recorded media
EXPORTS Million US$ in 2002 Share
All available countries 18,509.4 100
Rank Sub-total for five countries 10,670.5 57.6
2001/2002 % change in $ value
Average annual % change
(1994/2002)
1 United States of America 3,068.8 16.6 -3.9 -2.4 2 Germany 2,281.0 12.3 72.1 7.9 3 Ireland 2,128.2 11.5 -28.9 -0.9 4 United Kingdom 1,640.2 8.9 15.3 4.6 5 Singapore 1,552.3 8.4 -9.5 18.5 6 Austria 1,261.2 6.8 18.9 20.5 7 Netherlands 955.7 5.2 -20.4 -0.3 8 France 741.2 4.0 25.2 6.4 9 Sweden 644.9 3.5 46.2 21.5 10 Japan 371.5 2.0 7.4 2.8 11 Canada 357.4 1.9 -4.2 3.3 12 Belgium 351.9 1.9 7.4 2.1(a) 13 Spain 258.7 1.4 43.5 24.7 14 China 254.9 1.4 40.0 29.9 15 Hong Kong, China 254.5 1.4 1.0 27.6 16 Switzerland 254.2 1.4 5.6 -4.6 17 Denmark 194.5 1.1 -12.0 3.6 18 India 191.3 1.0 6.8 10.2 19 Republic of Korea 174.9 0.9 -10.9 27.4 20 Mexico 146.0 0.8 6.6 14.3
Recorded media
IMPORTS Million US$ in 2002 Share
All available countries 19,394.7 100Rank Sub-total for five countries 7,369.2 38.0
2001/2002 % change in $ value
Average annual % change
(1994/2002)
1 United Kingdom 1,953.9 10.1 14.3 6.2 2 Germany 1,487.8 7.7 2.2 -1.3 3 France 1,397.7 7.2 21.9 6.1 4 United States of America 1,358.3 7.0 4.5 7.2 5 Canada 1,171.5 6.0 1.6 1.5 6 Italy 992.0 5.1 5.0 13.4 7 China 873.4 4.5 8.2 39.9 8 Switzerland 821.1 4.2 -9.2 5.3 9 Japan 777.8 4.0 -14.2 0.2 10 India 708.0 3.7 60.7 37.7 11 Belgium 639.0 3.3 31.6 4.3(a) 12 Republic of Korea 638.9 3.3 9.7 8.2 13 Netherlands 627.0 3.2 7.1 -0.4 14 Spain 507.3 2.6 19.3 7.7 15 Austria 435.8 2.2 10.2 3.8 16 Sweden 425.4 2.2 8.3 4.7 17 Australia 378.4 2.0 10.2 -3.9 18 Other Asia, n.e.s. 375.5 1.9 -27.5 1.1 19 Mexico 364.6 1.9 -21.3 4.5 20 Hong Kong, China 278.7 1.4 -18.4 1.6
(a): 1999/2002. n.e.s.: Not elsewhere specified.

Annex I
- 81 -
Table V-6 Visual arts Visual arts
EXPORTS Million US$ in 2002 Share
All available countries 11,834.8 100
Rank Sub-total for five countries 7,090.3 59.9
2001/2002 % change in $
value
Average annual % change
(1994/2002)
1 United Kingdom 2,700.2 22.8 23.8 (a) 9.4 2 China 2,229.6 18.8 14.3 14.1 3 United States of America 889.1 7.5 -40.3 -2.2 4 Switzerland 720.4 6.1 33.2 2.7 5 Germany 550.9 4.7 -6.7 1.3 6 France 505.3 4.3 -5.8 2.2 7 Italy 273.5 2.3 -8.5 -4.0 8 Spain 255.2 2.2 19.2 5.6 9 Canada 162.2 1.4 -36.6 11.8 10 Belgium 119.5 1.0 12.3 5.1(b) 11 Mexico 111.7 0.9 -12.3 6.7 12 Netherlands 108.7 0.9 -19.1 -5.9 13 Portugal 105.7 0.9 -5.8 -5.6 14 Philippines 98.3 0.8 8.4 -3.8 15 Indonesia 85.4 0.7 7.7 7.0 16 Denmark 75.9 0.6 -9.5 7.3 17 Austria 71.6 0.6 -21.7 11.4 18 Morocco 70.9 0.6 868.2 43.5 19 Republic of Korea 69.1 0.6 42.9 -2.6 20 Japan 60.4 0.5 -34.1 -0.6
Visual arts
IMPORTS Million US$ in 2002 Share
All available countries 12,911.0 100Rank Sub-total for five countries 10,021.1 77.6
2001/2002 % change in $
value
Average annual % change
(1994/2002)
1 United States of America 5,425.7 42.0 -2.8 8.9 2 United Kingdom 2,759.6 21.4 9.5 6.9 3 Switzerland 665.6 5.2 -23.5 4.3 4 Germany 592.7 4.6 -27.6 -1.1 5 Hong Kong, China 577.6 4.5 -2.2 5.3 6 Japan 397.7 3.1 -1.4 -6.5 7 France 355.3 2.8 7.6 1.3 8 Italy 305.5 2.4 52.1 11.7 9 Spain 220.6 1.7 -35.6 -10.8 10 Canada 190.1 1.5 22.3 6.9 11 Netherlands 186.5 1.4 -4.6 3.8 12 Belgium 117.0 0.9 5.1 3.0 (b) 13 Austria 94.8 0.7 6.5 3.6 14 Australia 89.3 0.7 12.2 3.6 15 Republic of Korea 73.2 0.6 72.5 1.9 16 Mexico 71.9 0.6 8.7 4.9 17 Sweden 69.2 0.5 47.8 3.7 18 Denmark 61.9 0.5 -4.3 7.8 19 Singapore 42.0 0.3 -11.1 -6.4 20 Israel 41.4 0.3 -36.2 4.3
(a): Annual change between 2000 and 2002: (b): 1999/2002.

Annex I
- 82 -
Table V–7 Audiovisual media Audiovisual media
EXPORTS Million US$ in 2002 Share
All available countries 7,216.4 100
Rank Sub-total for five countries 5,548.5 76.9
2001/2002 % change in $
value
Average annual % change
(1994/2002)
1 China 2,281.8 31.6 230.2 38.6 2 Japan 1,208.1 16.7 83.3 23.2 3 Mexico 771.9 10.7 351.9 38.3 4 Hungary 647.2 9.0 89.1 90.9 5 Germany 639.5 8.9 299.4 27.4 6 United States of America 344.8 4.8 16.1 3.5 7 United Kingdom 330.5 4.6 157.0 3.0 8 Canada 220.6 3.1 43.4 16.6 9 Italy 128.1 1.8 77.0 16.3 10 France 93.7 1.3 16.6 -1.1 11 Belgium 63.2 0.9 -9.0 4.4(a) 12 Austria 52.5 0.7 42.3 24.1 13 Spain 47.4 0.7 -26.1 15.0 14 Republic of Korea 43.0 0.6 -16.0 -8.0 15 Australia 42.0 0.6 76.4 44.9 16 Singapore 41.4 0.6 17.6 9.5 17 Norway 40.3 0.6 27.7 73.0 18 Malaysia 32.4 0.4 1650.3 -7.3 19 Sweden 28.9 0.4 63.5 13.1 20 Finland 23.7 0.3 59.0 37.2
Audiovisual media
IMPORTS Million US$ in 2002 Share
All available countries 9,685.5 100Rank Sub-total for five countries 6,878.0 71.0
2001/2002 % change in $
value
Average annual % change
(1994/2002)
1 United States of America 4,093.9 42.3 9.0 12.6 2 Germany 888.9 9.2 234.2 15.3 3 United Kingdom 711.2 7.3 128.6 23.1 4 Hong Kong, China 656.7 6.8 324.6 18.2 5 France 527.3 5.4 32.1 9.8 6 Canada 504.8 5.2 21.7 11.1 7 Spain 273.0 2.8 9.9 15.1 8 Japan 261.1 2.7 -29.1 25.1 9 Australia 214.7 2.2 344.4 22.8 10 Singapore 177.5 1.8 42.6 21.3 11 Mexico 158.7 1.6 157.2 20.8 12 Netherlands 156.7 1.6 -79.6 18.3 13 Republic of Korea 119.2 1.2 28.2 5.4 14 Sweden 92.0 1.0 70.0 15.5 15 Belgium 82.3 0.8 12.1 -18.4(a) 16 Switzerland 70.1 0.7 24.9 7.7 17 Norway 69.4 0.7 142.7 25.3 18 Italy 63.2 0.7 -19.5 -2.1 19 China 57.8 0.6 -2.5 29.4 20 Portugal 52.8 0.5 111.8 15.4
(a): 1999/2002.

Annex I
- 83 -
Table VI Detailed trade in cultural services for a selected number of countries EXPORTS IMPORTS
EBOPS EBOPS CATEGORIES OR NATIONAL CATEGORIES
Million US$ in 2002
Annual % change 2001-2002
Average annual % change
1994-2002
Million US$ in 2002
Annual % change
2001-2002
Average annual % change
(1994-2002)
AUSTRALIA
200 Total Services (billion US$) 17,887.5 0.07 2.9 1,8071.1 0.07 1.99264 Information Services 12 0.34 4.5 25 -0.15 12.85889 News agency Services 3 -0.43 .. 5 -0.73 ..890 Other information provision Services 9 1.55 .. 20 0.77 ..892 Other cultural royalties and license fees (a) 168 -0.16 -14.9 362 0.26 -2.97 Music (a) 35 0.20 -1.8 120 0.08 0.41 Computer software (a) 78 -0.30 -28.3 227 0.21 -5.19 Other (a) 55 -0.07 33.2 135 0.35 1.28280 Architectural Services (a) 12 0.93 27.2 1 .. ..288 Audiovisual and related Services 57 0.20 -2.5 399 0.22 2.10289 Other cultural and recreational Services 126 0.19 7.7 442 0.24 3.41897 Other (2) 70 0.19 .. 43 0.43 ..CANADA 200 Total Services (billion US$) 37,165 -0.02 6 42,473 -0.02 3.4266 Royalties and license fees 3,035 -0.05 28 4,379 0.00 10.1892 Other royalties and license fees 1,629 -0.03 25 3,077 0.01 10.7 Copyrights and related rights 210 -0.09 25 368 0.08 8.6 Software and other royalties 1,197 -0.07 36 934 -0.03 8.9288 Audiovisual and related Services 1,304 -0.02 13 1,541 0.10 9.1CZECH REPUBLIC 200 Total Services (billion US$) 6,975 -0.001 4 6,308 0.16 4 264 Information Services 5 -0.08 .. 8 0.66 ..889 News agency Services .. .. 890 Other information provision Services 5 -0.08 .. 8 0.66 ..288 Audiovisual and related Services (b) 26 0.14 - 9 22 0.21 - 29 289 Other cultural and recreational Services (b) 136 -0.01 27 155 0.25 4 897 Other (c) 110 -0.04 - 13 133 0.25 4 NEW ZEALAND 200 Total Services (billion US$) 5,121 0.17 4 4,726.2 0.11 2 266 Royalties and license fees 87 0.56 23 346 0.10 5 Software royalties and license fees 25 0.26 .. 85 0.69 .. Other 62 0.72 .. 261 -0.01 ..UNITED STATES 200 Total Services billion US$) 288,723 0.01 5 227,380 0.04 7 266 Royalties and license fees 44,142 0.07 6 19,258 0.15 16 892 Other royalties and license fees (3) 38,212 -0.03 5 18,522 0.13 16 Books, records, and tapes (3) 523 0.00 8 346 0.13 13 Broadcasting and recording of live events (3) 277 0.59 6 946 6.22 16 General use computer software (3) (4) (b) 4,824 -0.04 12 481 0.06 0 Other (3) (4) 32,879 0.11 5 15,319 0.12 17 288 Audiovisual and related Services 6,919 0.05 15 149 0.48 1
Source: UIS based on data from Statistics on International Trade in Services, Volume I, OECD / Eurostat, 2004. (1) This category contains more categories than displayed. (2) Health Services credits for 2000 are included under Other personal, cultural and recreational Services, Other. (3)
Royalties and license fees receipts and payments between affiliated enterprises are included in item Other royalties and license fees, Other. (4) Prior to 1997, General use computer software royalties and license fees are included in Other. (a) 1999-2002; (b) : 1997-2002; (c): 1998-2002

Annex II
- 84 -
Annex II: Glossary Balance of Payments: statistical statement that systematically summarises, for a specific time period, the economic transactions of an economy with the rest of the world. A transaction itself is defined as an economic flow that reflects the creation, transformation, exchange, transfer or extinction of economic value and involves changes in ownership of goods and/or financial assets, the provision of services, or the provision of labour and capital. Creative industries: Industries which include the cultural industries plus all cultural or artistic production, whether live or produced as an individual unit. The creative industries are those in which the product or service contains a substantial element of artistic or creative endeavour (WIPO, 2003).
Cultural industries: Industries which combine the creation, production and commercialisation of creative contents which are intangible and cultural in nature. These contents are typically protected by copyright and they can take the form of a good or a service. Cultural industries generally include printing, publishing and multimedia, audio-visual, phonographic and cinematographic productions, as well as crafts and design.
Cultural goods: Consumer goods which convey ideas, symbols, and ways of life. They inform or entertain, contribute to build collective identity and influence cultural practices. They are the result of individual or collective creativity. Cultural products: Combination of cultural goods and cultural services. Cultural services: Consist of the overall set of measures and supporting facilities for cultural practices that government, private and
semi-public institutions or companies make available to the community. Examples of such services include the promotion of perform-ances and cultural events as well as cultural information and preservation (libraries, docu-mentation centres and museums). Cultural services may be offered for free or on a commercial basis (Alonso Cano et al., 2000). International trade in services: Trade between residents and non-residents of an economy. It also includes the value of services provided through foreign affiliates established abroad, described here as foreign affiliates trade in services (FATS). Services are also supplied by individuals located abroad, either as service suppliers themselves or employed by service suppliers including those in the host country (UN et al., 2002). Re-exports: Foreign goods exported from any part of the economic territory of a country in the same state as previously imported (UNSD, 2004). General Agreement on Trade in Services GATS: Set of legally enforceable disciplines and rules negotiated and agreed at the world level to cover international trade in services. It identifies four modes of supplies: cross border, consumption abroad, commercial presence and presence of natural persons. Distinctions are made based on whether the service supplier, the consumer, or neither, moves from one country to another for the transaction to be effected (UN et al, 2002). Services: Heterogeneous range of intangible products and activities defined by the System of National Accounts 1993 as: “a group of industries, generally classified as service industries which produce outputs that have many characteristics of goods, i.e. those concerned with the provision, storage

Annex II
- 85 -
communication and dissemination of information, advice and entertainment in the broadest sense of those terms the production of general or specialised information, news, computer programs, movies, music” (UN et al., 2002).
Audiovisual and related services: Services and associated fees related to the production post production, distribution, broadcasting and projection of motion pictures (on film or videotape), radio and television programmes (live or on tape) and musical recordings (UN et al., 2002). Other personal, cultural and recreational services: Services such as those associated with museums, libraries, archives and other cultural, sporting and recreational activities including performing arts and live entertainment (UN et al., 2002). Information services consist of: News agency services: Include the provision of news, photographs, and feature articles to the media. Other information provision services include database services. Also include direct, non-bulk subscriptions to newspapers and periodicals, whether by mail, electronic transmission or by other means (UN et al., 2002).
Other royalties and license fees: Include international payments and receipts for the authorised use of intangible, non-produced, non-financial assets and proprietary rights (such as patents, copyrights and industrial processes and designs) and with the use, through licensing agreements, of produced originals or prototypes (such as manuscripts, computer programs, and cinematographic works and sound recordings) (UN et al., 2002). Advertising, market research and public opinion polling services: Cover the design, creation and marketing of advertisements by advertising agencies; media placement, including the purchase and sale of advertising space; exhibition services provided by trade fairs; the promotion of products abroad; market research; telemarketing; and public opinion polling on various issues (UN et al., 2002). Architectural, engineering and other technical services: cover transactions between residents and non-residents related to architectural design of urban and other development projects; planning and project design and supervision of dams, bridges, airports, turnkey projects, etc.; surveying; cartography; product testing and certification; and technical inspection services. Mining engineering is excluded and included in mining services (UN et al., 2002).

Annex III
- 86 -
Annex III: UNESCO Framework for Cultural Statistics
UNESCO Framework for Cultural Statistics (FCS)
0 CULTURAL HERITAGE 0.1 Historical monuments 0.2 Archaeological heritage 0.3 Musicological heritage 0.4 Archival heritage 0.5 Other forms of cultural heritage
1 PRINTED MATTER AND LITERATURE 1.1 Books and pamphlets 1.2 Newspapers and periodicals 1.3 Library services
2 & 3 MUSIC AND THE PERFORMING ARTS 2.1 Live music 2.2 Music theatre 3.1 Drama theatre 3.2 Dance 3.3 Other performing arts (circus, pantomime, etc.)
2/3 Common issues of which audio and audiovisual records 4 VISUAL ARTS
Group A 4.1 Painting 4.2 Sculpture 4.3 Graphic arts 4.4 Art handicrafts 4.5 Other forms of visual arts
Group B 4.6 Photography
4.6.1 Creative-artistic photography 4.6.2 Other photography
5 & 6 AUDIO AND AUDIOVISUAL MEDIA 5 CINEMA AND PHOTOGRAPHY
5.1 Cinema 5.2 Photography
6 RADIO AND TELEVISION 6.1 Radio 6.2 Television
5/6 Video 7 SOCIO-CULTURAL ACTIVITIES
7.1 Associate life 7.2 Multipurpose socio-cultural facilities 7.3 Socio-cultural practices
7.3.1 Individual practices 7.3.2 Family life 7.3.3 Community life
7.4 Intercategory data Tourism
8 SPORTS AND GAMES 9 ENVIRONMENT AND NATURE
9.1 Natural environment 9.2 Urban environment (quality of life in the urban setting)

Annex IV
- 87 -
Annex IV: Maps
A. Countries covered in the report
Country which is:
part of the study
not part of the study
UIS based on UN Comtrade, DESA/UNSD, 2004.

Annex IV
- 88 -
B. Countries by levels of income
Type of Economies:
Low-income economies
Lower-middle-income economies
Upper-middle-income economies
High-income economies
Data not available
UIS based on UN Comtrade, DESA/UNSD, 2004.

Annex V
- 89 -
Annex V: List of Products Used in the Report
A. List of codes used for cultural services (EBOPS, CPC)
Core cultural Services
EBOPS CPC6, Version 1.1 288 Audiovisual and related Services 9 Community, social and personal services 96 Recreational, cultural and sporting services 961 Audiovisual and related services 96111 Sound recording services 96112 Audio post-production services 96121 Motion picture, video tape and television programme production services 96122 Radio programme production services 96130 Audiovisual production support services 96141 Motion picture and television programme distribution services 96142 Film and video post-production services 96149 Other services related to the production of motion pictures and television and radio programmes 96151 Motion picture projection services 96152 Video tape projection services 96160 Broadcasting (programming and scheduling) services 73 Leasing or rental services without operator 73210 Leasing or rental services concerning televisions, radios, video cassette recorders and related equipment and
accessories 73220 Leasing or rental services concerning videotape 266 Royalties and license fees Copyrights 733 Licensing services for the right to use non-financial intangible assets 7331 Licensing services for the right to use computer software 7332 Licensing services for the right to use entertainment, literary or acoustic originals 7339 Licensing services for the right to use other non-financial intangible assets
6 CPC: The Central Product Classification was used to describe the balance of payments services components recommended in BPM5. It serves as a guideline for the
elaboration of such classifications for specific areas of the economy, including international trade in services.

Annex V
- 90 -
897 Other personal, cultural, and recreational services* EBOPS CPC,
Version 1.1
897 Cultural services Recreational, cultural and sporting services 96210 Performing arts event promotion and organization services 96220 Performing arts event production and presentation services 96230 Performing arts facility operation services 96290 Other performing arts and live entertainment services 96310 Services of performing artists 96320 Services of authors, composers, sculptors and other artists, except performing artists 897 Personal services Library and archive services 84510 Library services 84520 Archive services Recreational, cultural and sporting services 96411 Museum services except for historical sites and buildings 96412 Preservation services of historical sites and buildings *Presently no data available for this category. Related cultural Services
278 Advertising, market research, and public opinion
polling
83610 Planning, creating and placement services of advertising 83690 Other advertising services 85970 Trade fair and exhibition organization services 280 Architectural, engineering, and other technical
services
832 Architectural Services and urban planning and landscape architectural services 83211 Architectural advisory and pre-design services 83212 Architectural design and contract administration services 83219 Other architectural services 889 News agency services News agency Services 84410 News agency services to newspapers and periodicals 84420 News agency services to audiovisual media Note: Categories in italics are not uniformly agreed upon in the international community as cultural services.

Annex V
- 91 -
B. List of codes used for cultural goods in Harmonised System (HS) and Standard International Trade Classification, Revision 3 (SITC REV. 3)
CORE CULTURAL PRODUCTS
FCS category SITC 3 SITC 3 label HS 96 HS 96 label
0. Cultural heritage
8965* Collections and collectors’ pieces of zoological, botanical,
mineralogical, anatomical, historical, archaeological, paleontological, ethnographic or numismatic interest
9705 Collections and collectors pieces
Antiques 8966 Antiques of an age exceeding 100 years 9706 Antiques of an age exceeding 100 years 1. Printed matter 892 Printed matter 49 Printed books, newspapers, pictures and other product, etc. Books 89215 Books, brochures and similar printed matter, in sheets 89216 Dictionaries and encyclopaedias, not in single sheets
89219 Other books, brochures and similar, printed matter, excluding sheets
4901 Printed reading books, brochures, leaflets, etc.
89212 Children’s picture, drawing or colouring books 4903 Children’s picture, drawing or colouring books Newspapers and periodicals
8922 Newspapers, journals and periodicals
4902 Newspapers, journals and periodicals, whether or not illustrated or containing advertising material
Other printed matter89285 Music, printed or in manuscript, whether or not bound or
illustrated 4904 Music, printed or in manuscript, whether or not bound or illustrated
89213 Maps and charts in book form
89214 Maps and hydrographic or similar charts of all kinds (including
wall maps, topographical plans and globes), printed, not in book form
4905 Maps and hydrographic or similar charts, including atlases, wall maps
8924 Postcards, personal greeting, message or announcement cards, and transfers (decalcomanias), printed by any process
4909 Postcards, printed or illustrated; printed greeting cards
89284 Calendars of any kind, printed (including calendar blocks) 4910 Calendars of any kind, printed, including calendar blocks 89287 Pictures, designs and photographs 491191 Pictures, designs and photographs
8964 Postage or revenue stamps, stamp-postmarks, first-day covers, postal stationery (stamped paper) and the like, used, or if unused not of current or new issue in the country to which they are destined
9704 Used postage/revenue stamps and the like/unused not of current/new issue
2 & 3 Music and the performing arts
Recorded media 89871 Gramophone records 852410 Gramophone records 89879* Recorded media, n.e.s. 852432 Discs for laser reading systems for reproducing sound only 89861 Magnetic tape recorded of a width not >4mm 852451 Magnetic tape recorded (excl. 852440) of a width not >4mm
89865 Magnetic tape recorded of a width not 4mm<x<6.5 mm 852452 Magnetic tape recorded (excl. 852440) of a width not 4mm<x<6.5 mm
89867 Magnetic tape recorded of a width >6.5 mm 852453 Magnetic tape recorded (excl. 852440) of a width >6.5 mm 89879* Recorded media, n.e.s. 852499 Other recorded media for sound

Annex V
- 92 -
4. Visual arts
Paintings 8961 Paintings, drawings and pastels, executed entirely by hand, other than drawings of heading 892.82 and other than hand-painted or hand-decorated manufactured
9701Paintings, drawings, pastels, collages, etc. (hand-made)
Other Visual arts 8962 Original engravings, prints and lithographs 9702 Original engravings, prints and lithographs 8963 Original sculptures and statuary, in any material 9703 Original sculptures and statuary, in any material 89399* Articles of plastics, n.e.s. 392640 Statuettes and other ornamental articles
63549*
Wood marquetry and inlaid wood; caskets and cases for jewellery or cutlery, and similar articles; statuettes and other ornaments; wooden articles of furniture not falling within division 82
442010
Statuettes and other ornaments, of wood
6662 Statuettes and other ornamental ceramic articles 6913 Statuettes and other ornamental ceramic articles
830621 Statuettes and other ornaments, of base metal plated with precious metal
69782* Statuettes and other ornaments, of base metal; photograph,
picture or similar frames, of base metal; mirrors of base metal 830629 Other statuettes and other ornaments, of base metal
89911* Worked ivory, bone, tortoiseshell, horn, antlers, coral, mother-of-pearl and other animal carving material, and articles of these materials
9601Worked ivory, bone, tortoiseshell, horn, antlers, coral, mother-of-pearl and other animal carving material, and articles of these materials (including articles obtained by moulding)
5 & 6. Audio and Audiovisual media 5. Cinema and photography
Photography 8826* Photographic plates and film, exposed and developed, other than cinematographic film 370590
Photographic plates and film, exposed and developed, other than cinematographic film, other than for offset reproduction and microfilms
Cinema 883 Cinematograph films, exposed and developed 3706 Cinematograph film, exposed and developed without incorporated sound track
New media 89431 Videogames used with a television receiver 950410 Videogames used with a television receiver
*: Some goods of this category are not cultural. Only the cultural goods need to be considered. n.e.s. = Not elsewhere specified

Annex V
- 93 -
RELATED CULTURAL PRODUCTS
HARDWARE/SUPPORTS
FCS category SITC 3 SITC 3 label HS 96 HS 96 label 2. Music
8981 Pianos and other string musical instruments 8982 Other musical instruments; not 898.1- Musical instruments 8989 Parts of and accessories for musical instruments
92 Musical instruments; parts and access of such articles
7633 Turntables, record player 8519 Electronic sound reproducing equipment, non-recording 8520 Electronic sound recording equipment Sound player recorder 7638 Sound-recording and other sound-reproducing apparatus; video-recording
or reproducing apparatus, whether or not incorporating a video tuner 8521 Video recording and reproducing apparatus Sound recording media
8984 Magnetic tape, unrecorded
Unrecorded 8985 Other blank recording media
8523 Prepared unrecorded sound recording media
5. Cinema and photography
Photographic camera 881 Photographic apparatus and equipment, n.e.s. 9006 Photographic cameras (except cine), accessories 9007 Cinematographic cameras and projectors
9008 Image projectors, photographic enlargers and reducers Cinematographic camera
9010 Equipment for photographic laboratories, n.e.s.
Photo / cine supplies 882 Photographic or cinematographic goods 37 Photographic or cinematographic goods
8822 Photographic plates and film in the flat, sensitized, unexposed, of any
material other than paper, paperboard or textiles; instant print film in the flat, sensitized, unexposed, whether or not in packs
3701 Photographic plate, film, not rolls, exposed, paper
8823 Photographic film in rolls, sensitized, unexposed, of any material other than
paper, paperboard or textiles; instant print film in rolls, sensitized, unexposed
3702 Photograph film, rolls, unexposed, not paper
8824 Photographic paper, paperboard and textiles, sensitized, unexposed 3703 Photographic paper, board, etc., sensitised, unexposed
8825 Photographic plates, film, paper, paperboard and textiles, exposed but not developed
3704 Photographic plate, film, paper, exposed, undeveloped
370510 Photographic plates and film, exposed and developed, other
than cinematographic film for offset reproduction
8826* Photographic plates and film, exposed and developed, other than cinematographic film
370520 Microfilms 6. Television and radio Television 761 Television receivers 8528 Television receivers, video monitors, projectors
Radio 762 Radio-broadcast receivers, whether or not incorporating sound-recording or
reproducing apparatus or a clock 8527 Radio, radio-telephony receivers

Annex V
- 94 -
OTHER RELATED CATEGORIES
Architecture and design
89282* Plans and drawings for architectural, engineering, industrial, commercial, topographical or similar purposes, being originals drawn by hand; handwritten texts; photographic reproductions on sensitized paper and carbon copies of the foregoing
4906 Plans and drawings for architectural, engineering, industrial, commercial, topographical or similar purposes, being originals drawn by hand; hand-written texts; photographic reproductions on sensitised paper and carbon copies of the foregoing
Advertising 89286 Trade advertising material, commercial catalogues and the like 491110 Trade advertising material, commercial catalogue and the like
New media
Software 8986* Magnetic tapes, recorded 852440 Magnetic tapes for reproducing phenomena other than
sound or image
852431 Recorded discs for laser reading systems for reproducing
phenomena other than sound or image
852439 Other recorded discs for laser reading systems
89879 Recorded media, n.e.s.
852491 Other recorded media for reproducing phenomena other than sound or image, n.e.s.
*: Some goods of this category are not cultural. Only the cultural goods need to be considered. n.e.s. = Not elsewhere specified
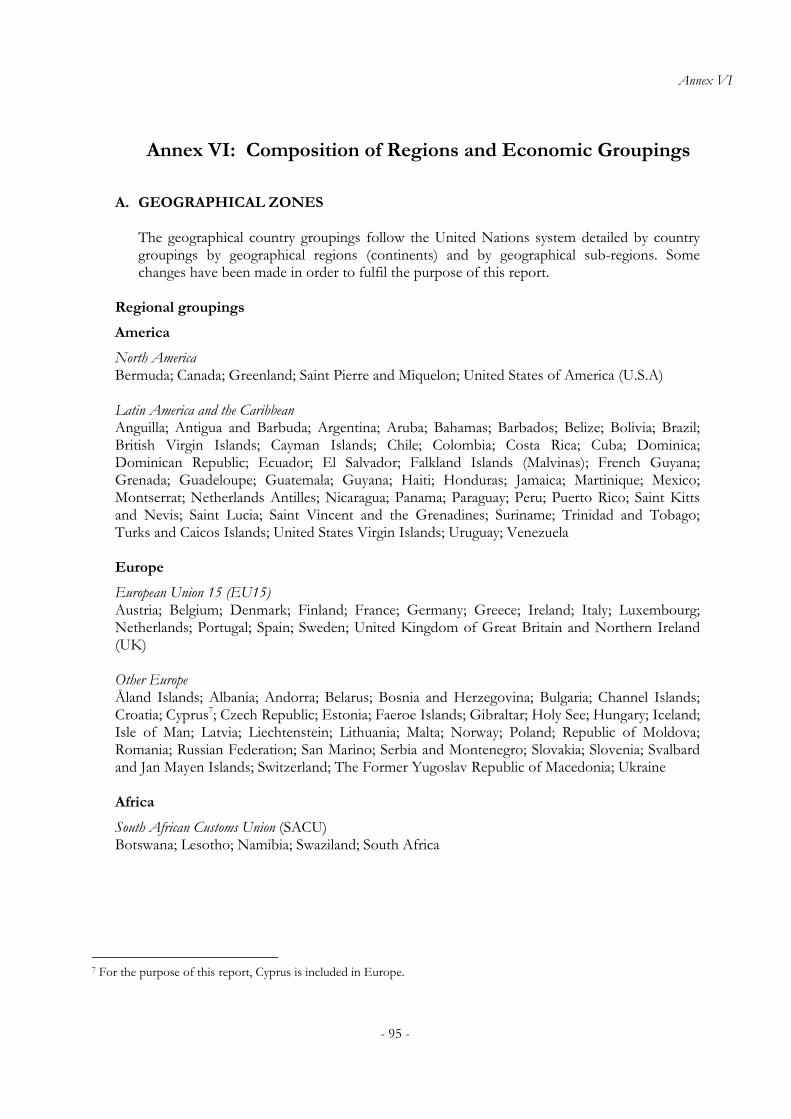
Annex VI
- 95 -
Annex VI: Composition of Regions and Economic Groupings A. GEOGRAPHICAL ZONES
The geographical country groupings follow the United Nations system detailed by country groupings by geographical regions (continents) and by geographical sub-regions. Some changes have been made in order to fulfil the purpose of this report.
Regional groupings
America
North America Bermuda; Canada; Greenland; Saint Pierre and Miquelon; United States of America (U.S.A) Latin America and the Caribbean Anguilla; Antigua and Barbuda; Argentina; Aruba; Bahamas; Barbados; Belize; Bolivia; Brazil; British Virgin Islands; Cayman Islands; Chile; Colombia; Costa Rica; Cuba; Dominica; Dominican Republic; Ecuador; El Salvador; Falkland Islands (Malvinas); French Guyana; Grenada; Guadeloupe; Guatemala; Guyana; Haiti; Honduras; Jamaica; Martinique; Mexico; Montserrat; Netherlands Antilles; Nicaragua; Panama; Paraguay; Peru; Puerto Rico; Saint Kitts and Nevis; Saint Lucia; Saint Vincent and the Grenadines; Suriname; Trinidad and Tobago; Turks and Caicos Islands; United States Virgin Islands; Uruguay; Venezuela Europe
European Union 15 (EU15) Austria; Belgium; Denmark; Finland; France; Germany; Greece; Ireland; Italy; Luxembourg; Netherlands; Portugal; Spain; Sweden; United Kingdom of Great Britain and Northern Ireland (UK) Other Europe Åland Islands; Albania; Andorra; Belarus; Bosnia and Herzegovina; Bulgaria; Channel Islands; Croatia; Cyprus7; Czech Republic; Estonia; Faeroe Islands; Gibraltar; Holy See; Hungary; Iceland; Isle of Man; Latvia; Liechtenstein; Lithuania; Malta; Norway; Poland; Republic of Moldova; Romania; Russian Federation; San Marino; Serbia and Montenegro; Slovakia; Slovenia; Svalbard and Jan Mayen Islands; Switzerland; The Former Yugoslav Republic of Macedonia; Ukraine Africa
South African Customs Union (SACU) Botswana; Lesotho; Namibia; Swaziland; South Africa
7 For the purpose of this report, Cyprus is included in Europe.

Annex VI
- 96 -
Other sub-Saharan countries8 Angola; Benin; Burkina Faso; Burundi; Cameroon; Cape Verde; Central African Republic; Chad; Comoros; Congo; Cote d'Ivoire; Democratic Republic of the Congo; Djibouti; Equatorial Guinea; Eritrea; Ethiopia; Gabon; Gambia; Ghana; Guinea; Guinea-Bissau; Kenya; Liberia; Madagascar; Malawi; Mali; Mauritania; Mauritius; Mayotte; Mozambique; Niger; Nigeria; Reunion; Rwanda; Saint Helena; Sao Tome and Principe; Senegal; Seychelles; Sierra Leone; Somalia; Togo; Uganda; United Republic of Tanzania; Zambia; Zimbabwe Northern Africa Algeria; Egypt; Libyan Arab Jamahiriya; Morocco; Sudan; Tunisia; Western Sahara Asia
Eastern Asia China; Hong Kong Special Administrative Region of China (Hong Kong, China)9; China, Macao, Special Administrative Region (Macao, China); Democratic People's Republic of Korea; Japan; Mongolia; Taiwan of China; Republic of Korea South Central Asia Islamic Republic of Afghanistan; Bangladesh; Bhutan; India; Islamic Republic of Iran; Kazakhstan; Kyrgyzstan; Maldives; Nepal; Pakistan; Sri Lanka; Tajikistan; Turkmenistan; Uzbekistan South Eastern Asia: Brunei Darussalam, Cambodia, Indonesia, Lao People's Democratic Republic, Malaysia, Myanmar, Philippines, Singapore, Thailand, Timor-Leste, Viet Nam Western Asia Armenia; Azerbaijan; Bahrain; Georgia; Iraq; Israel; Jordan; Kuwait; Lebanon; Occupied Palestinian Territory; Oman; Qatar; Saudi Arabia; Syrian Arab Republic (Syria); Turkey; United Arab Emirates; Yemen Oceania
American Samoa; Australia; Cook Islands; Fiji; French Polynesia; Guam; Kiribati; Marshall Islands; Micronesia (Federated States of); Nauru; New Caledonia; New Zealand; Niue; Norfolk Island; Northern Mariana Islands; Palau; Papua New Guinea; Pitcairn; Samoa; Solomon Islands; Tokelau; Tonga; Tuvalu; Vanuatu; Wallis and Futuna Islands
8 The designation sub-Saharan Africa is commonly used to indicate all Africa except Northern Africa, with
Sudan included in sub-Saharan Africa. 9 Data for Hong Kong, China are shown separately since handover of Hong Kong, China took place only in
1997 whereas data collection starts in 1994.

Annex VI
- 97 -
B. ECONOMIC ZONES
Commonwealth of Independent States Armenia; Azerbaijan; Belarus; Georgia; Kyrgyzstan; Kazakhstan; Republic of Moldavia; Russian Federation; Tajikistan; Turkmenistan; Ukraine; Uzbekistan Common Market for East and Southern Africa (COMESA) Angola; Burundi; Comoros; Democratic Republic of Congo; Djibouti; Egypt; Eritrea; Ethiopia; Kenya; Madagascar; Malawi; Mauritius; Namibia; Rwanda; Seychelles; Sudan; Swaziland, Uganda; Tanzania; Zambia; Zimbabwe Countries of the South Common Market (MERCOSUR and Associated Members) Argentina; Brazil; Paraguay; Uruguay; Chile; Bolivia North American Free Trade Agreement (NAFTA) Canada; Mexico; U.S.A WORLD BANK CLASSIFICATION BY INCOME GROUP Economies are divided according to 2002 GNI per capita, calculated using the World Bank Atlas method. Low-income economies and middle-income economies are sometimes referred to as developing countries and countries in transition.
Low-Income Economies - GNI per capita: US$ 735 or less Afghanistan; Angola; Azerbaijan; Bangladesh; Benin; Bhutan; Burkina Faso; Burundi; Cambodia; Cameroon; Central African Republic; Chad; Comoros; Democratic Republic of the Congo; Republic of Congo; Cote d'Ivoire; Equatorial Guinea; Eritrea; Ethiopia; Gambia; Ghana; Guinea; Guinea-Bissau; Georgia; Haiti; India; Indonesia; Kenya; Democratic People's Republic of Korea; Kyrgyzstan; Lao People's Democratic Republic; Lesotho; Liberia; Madagascar; Malawi; Mali; Mauritania; Republic of Moldova; Mongolia; Montserrat; Mozambique; Myanmar; Nepal; Nicaragua; Niger; Nigeria; Pakistan; Papua New Guinea; Rwanda; Sao Tome and Principe; Senegal; Sierra Leone; Solomon Islands; Somalia; Sudan; Tajikistan; United Republic of Tanzania; Timor-Leste; Togo; Tuvalu; Uganda; Uzbekistan; Viet Nam; Wallis and Futuna Islands; Yemen; Zambia; Zimbabwe
Lower-Middle-Income Economies - GNI per capita: US$ 736 - US$ 2,935 Albania; Algeria; Armenia; Azerbaijan; Belarus; Bolivia; Bosnia and Herzegovina; Brazil; Bulgaria; Cape Verde; China; Colombia; Cuba; Djibouti; Dominican Republic; Ecuador; Egypt; El Salvador; Fiji; Guatemala; Guyana; Honduras; Iran; Iraq; Jamaica; Jordan; Kazakhstan; Kiribati; The Former Yugoslav Republic (TFYR) of Macedonia; Maldives; Marshall Islands; Federation. States of Micronesia; Morocco; Namibia; Occupied Palestinian Territory, Paraguay; Peru; Philippines; Romania; Russian Federation; Samoa; Saint Vincent and the Grenadines; Serbia and Montenegro; South Africa, (South African Customs Union: between 1994 and 2000); Sri Lanka; Suriname; Swaziland; Syrian Arab Republic; Thailand; Tonga; Tunisia; Turkey; Turkmenistan; Ukraine; Vanuatu;

Annex VI
- 98 -
Upper-Middle-Income Economies - GNI per capita: US$ 2,936 - US$ 9,075 American Samoa; Argentina; Belize; Botswana; Chile; Costa Rica; Croatia; Czech Republic; Dominica; Estonia; Gabon; Grenada; Hungary; Latvia; Lebanon; Libyan Arab Jamahiriya; Lithuania; Malaysia; Mauritius; Mayotte; Mexico; Northern Mariana Islands; Oman; Palau; Panama; Poland; Saudi Arabia; Seychelles; Slovak Republic; Saint Kitts and Nevis; Saint Lucia; Trinidad and Tobago; Uruguay; Venezuela
High-Income Economies - GNI per capita: US$ 9,076 or more Andorra; Anguilla; Antigua and Barbuda; Aruba; Australia; Austria; Bahamas; Bahrain; Barbados; Belgium (Belgium-Luxembourg before 1999); Bermuda; British Virgin Islands; Brunei Darussalam; Canada; Cayman Islands; Channel Islands; Cyprus; Denmark; Faeroe Islands; Finland; France10; French Polynesia; Germany; Greece; Greenland; Guam; Hong Kong, China; Iceland; Ireland; Isle of Man; Israel; Italy; Japan; Republic of Korea; Kuwait; Liechtenstein; Luxembourg; Macao, China; Malta; Monaco; Netherlands; Netherlands Antilles; New Caledonia; New Zealand; Norway; Portugal; Puerto Rico; Qatar; San Marino; Saint Helena; Singapore; Slovenia; Spain; Sweden; Switzerland; United Arab Emirates; United Kingdom; United States of America; United States Virgin Islands
10 Data for Guadeloupe, Martinique, Reunion and French Guyana are included in trade of France.

In today’s world there is a diverse range of cultural and creative industries. Music, books, crafts, films and many other cultural goods andservices move across international borders, creating a complex picture of cultural trade flows. Cultural and creative industries alone areestimated to account for over 7% of the world’s Gross Domestic Product.
This report looks at selected global flows of cultural goods and services. It shows that high-income economies are the largest producers andconsumers of cultural goods. Based on the analysis of customs data, the United Kingdom came out as the biggest producer of cultural goodsand the United States of America remained the biggest consumer in 2002. Although playing a less significant role, the report sheds new lighton the emergence of developing countries in the trade of cultural goods.
The report outlines some of the difficulties in measuring the international flows of cultural and creative industries’ products using theexisting industrial and product classifications. It explores innovative ways of presenting existing data and identifying data which could becollected in the future. It also represents a step forward towards presenting a more complete global picture of international cultural trade flows.
The UNESCO Institute for Statistics (UIS) is thestatistical office of the United Nations Educational,Scientific and Cultural Organization (UNESCO) andis the UN depository for internationally comparablestatistics in the fields of education, science andtechnology, and culture and communication.
UNESCO Institute for StatisticsP.O. Box 6128, Succursale Centre-VilleMontreal, Quebec H3C 3J7Canada
UNESCOSector for Culture1, rue Miollis75732 Paris Cedex 15, France