International Economics and the AP® Microeconomics Course
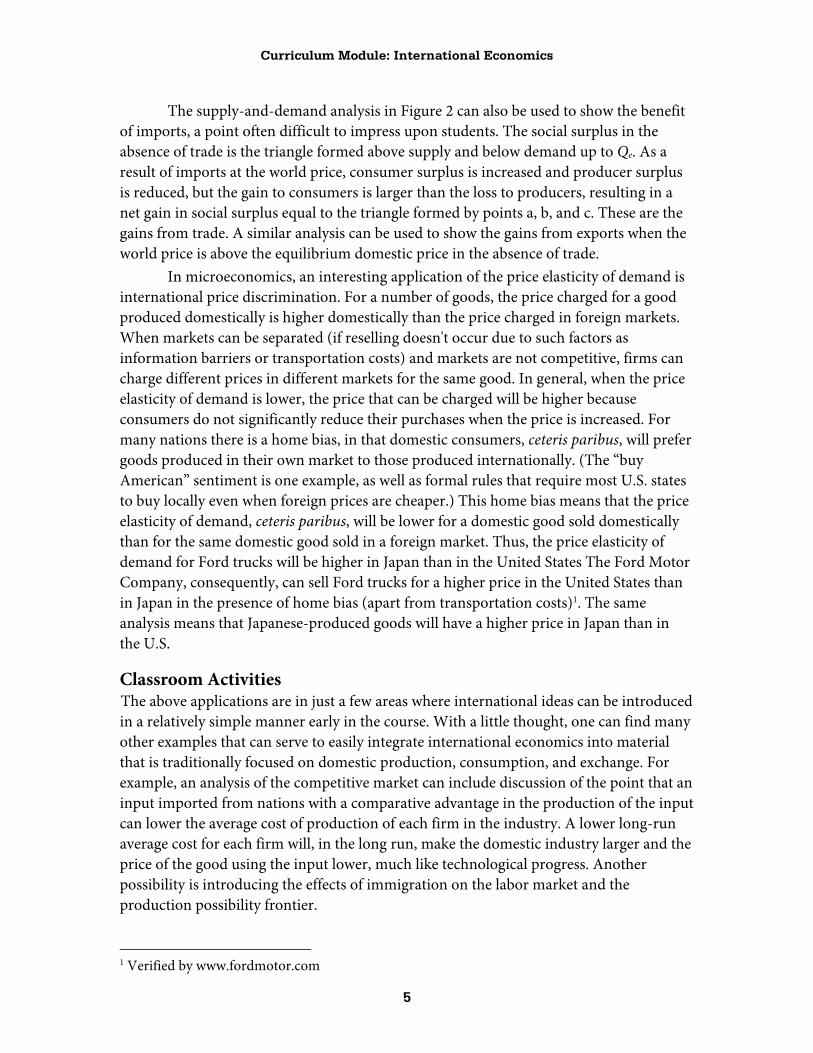
39
© 2008 The College Board. All rights reserved. College Board, Advanced Placement Program, AP, SAT, and the acorn logo are registered trademarks of the College Board. connect to college success is a trademark owned by the College Board. Visit the College Board on the Web: www.collegeboard.com.
Transcript of International Economics and the AP® Microeconomics Course

© 2008 The College Board. All rights reserved. College Board, Advanced Placement Program, AP, SAT, and the acorn logo are registered trademarks of the College Board. connect to college success is a trademark owned by the College Board. Visit the College Board on the Web: www.collegeboard.com.

AP® Microeconomics Curriculum Module: International Economics
Table of Contents
Editor’s Introduction .........................................................1 Richard K. Rankin Iolani School Honolulu, HI
International Economics and the AP® Microeconomics Course ...........................2 Arthur Raymond Muhlenberg College Allentown, PA
Trade Restrictions and Total Surplus ..........................7 Linda M. Manning University of Ottawa Ottawa, Canada
Bill McCormick Richland District Two Columbia, SC
The Basics of Absolute and Comparative Advantage ....................................... 24 Peggy Pride St. Louis University High School St. Louis, MO
Contributors ...................................................................... 36

Curriculum Module: International Economics
1
International Economics
Editor’s Introduction
Richard K. Rankin Iolani School Honolulu, Hawaii
International economics has become an increasingly important segment of economic study in recent years. Not only has international trade become a larger percentage of the gross domestic product for most countries, but it is clear that domestic monetary and fiscal policies can cause international impacts and reactions that must be considered when formulating economic policies. In addition, many students studying economics and business today will find themselves working for multinational firms during their careers.
Unfortunately, recent student scores on the international economics questions of the AP® Economics Exams have not been very good compared with the other parts of the exams. There is a great deal of speculation as to why students do not perform very well on the international economics questions, but most teachers agree that one cause could be that international economics has most often been left for the last major subject taught in an economics course. As such, international economics does not always receive the attention and emphasis it deserves.
As the College Board advisor for AP Economics, it is my hope that the pieces in this curriculum module will help teachers rectify the current shortcoming in teaching international economics in economics courses. They should see interesting and helpful ways to present the material, as well as ways to address the topic earlier in their economics courses and then build on that knowledge throughout the course.

Curriculum Module: International Economics
2
International Economics and the AP® Microeconomics Course
Arthur Raymond Muhlenberg College Allentown, Pennsylvania
Introduction Because of time constraints, many teachers of AP Microeconomics find that a complete and thorough coverage of the AP curriculum can be difficult. In many Principles of Microeconomics courses and texts, the material on international economics comes at the end, when little time is left for complete and thorough coverage. This tendency, combined with the inherent complexity of international ideas, may be the source of the trouble many students have with international questions on the AP Exam. The purpose of this essay is to offer a few suggestions for integrating international ideas into material covered earlier in the Principles of Microeconomics course. By showing students where international economic ideas fit into the most basic analyses, the teacher can prompt students to begin to think about such ideas. This thought process can promote more focused discussion later in the course. A major strength and appeal of economics is that most of its fundamental concepts—like elasticity, marginal analysis, opportunity cost, and the supply-and-demand framework—can be applied to many forms of production, consumption, and exchange, both international and domestic. I am not suggesting that more material be included in the Principles of Microeconomics course but that applications of standard material presented early in the course include examples with an international focus. In my Principles of Microeconomics course, I provide some international examples in class; I also include, as part of homework and other out-of-class assignments, a number of international examples that require students to apply vital concepts (such as opportunity cost or supply and demand) to new areas. I find that most students enjoy discovering for themselves how the core tools can be extended to international exchange.
Integrating the Concepts in the Course A natural point at which to introduce international economic ideas is when the text or the syllabus reaches opportunity cost. The idea of opportunity cost establishes the basis of comparative advantage and exchange. If you are using a text that does not take this chance to extend the idea to international trade, adding a few relatively simple examples can easily make the point. In addition to demonstrating comparative advantage by considering the productivity of, say, Bill and Beth, or Farm A and Farm B, use the same framework for Belgium and France.

Curriculum Module: International Economics
3
The idea of comparative advantage can be easily elaborated by pointing out that the sources of comparative advantage, domestic and international, are natural and/or acquired. For instance: The United States has cheap food relative to much of the world in part because of the natural relative abundance of arable land in the U.S. Jockeys have a comparative advantage in horse racing because of their size. The Middle East has cheap oil relative to much of the world because of the region’s relative abundance of oil fields. These are natural advantages that exist because of the initial endowment of resources. On the other hand, New York has a comparative advantage in financial services; doctors have a comparative advantage in medicine; and Hollywood has a comparative advantage in making movies, not primarily because of initial endowments (there is nothing natural about the geography of New York that confers a comparative advantage in financial services), but due to productivity acquired through time because of historical circumstances. Few of us are natural teachers of economics, but have become so because of the history of our personal lives.
Figure 1: World’s supply of, and demand for, shoes. (Figure courtesy of author).
Using the Supply-and-Demand Framework The supply-and-demand framework is a versatile framework for many international economic examples. The relationship between the world’s supply of and demand for
Curriculum Module: International Economics
9
good at lowest cost are said to have the absolute advantage and should specialize in the production of the good (Adam Smith). But even if an individual or country cannot produce the good at the lowest cost, it may produce the good at a lower opportunity cost, this being determined by their initial factor endowments, and also those of other countries. Those who can produce a good at the lowest opportunity cost are said to have a comparative advantage and should specialize in that good (David Ricardo). These concepts of specialization and comparative advantage are fundamental to an understanding of international trade.
Economists assert that voluntary exchange (trade) makes both market participants (the buyers and the sellers) better off than they would have been in the absence of the transaction. If this is true, why are some groups so opposed to free trade? The answer lies in the fact that not all parties benefit equally, nor are all the effects of trade positive for everyone. For instance, while consumers can purchase more at lower prices with trade, we often observe that domestic jobs are lost. This translates into lower income to some households and some producers. The economists’ assertion of gains from trade reflects an overall, net effect, and not an impact on any specific group within an economy. In the pages that follow, you will learn how to explain this phenomenon using economic theory.
Let’s use a historical example and economic theory to analyze what happens when there is free trade; why some people oppose free trade; and what happens when the government uses protectionist policies to limit the amount of free trade.
The U.S. Shoe Industry
The U.S. shoe industry was established primarily in New England and serves as an excellent platform for analyzing who gains and who loses from trade, the meaning of market efficiency, and the costs of trade barriers.
The Shoe Industry Before Trade In the colonial era, a pair of shoes was relatively more expensive than what one might pay today. We need look no further than simple economic principles to uncover the reason for this. Since the methods employed in the manufacturing process were primarily labor intensive, assisted only by hand tools, the opportunity cost of a pair of shoes was relatively high compared with that of many other goods. Even though shoemakers were on the lower end of the wage scale compared with other skilled craftsmen such as cabinetmakers and silversmiths,4 they nevertheless commanded a fair market wage for the hours of labor required to make a pair of shoes.
Shoes were produced with rudimentary and largely manual manufacturing techniques—not only in constructing the final product, but also in creating the inputs such as the leather and the thread. Because of this, shoes were produced and sold locally 4 http://www.answers.com/boot%20and%20shoe%20manufacturing, boot and shoe
manufacturing, US History Encyclopedia.

Curriculum Module: International Economics
10
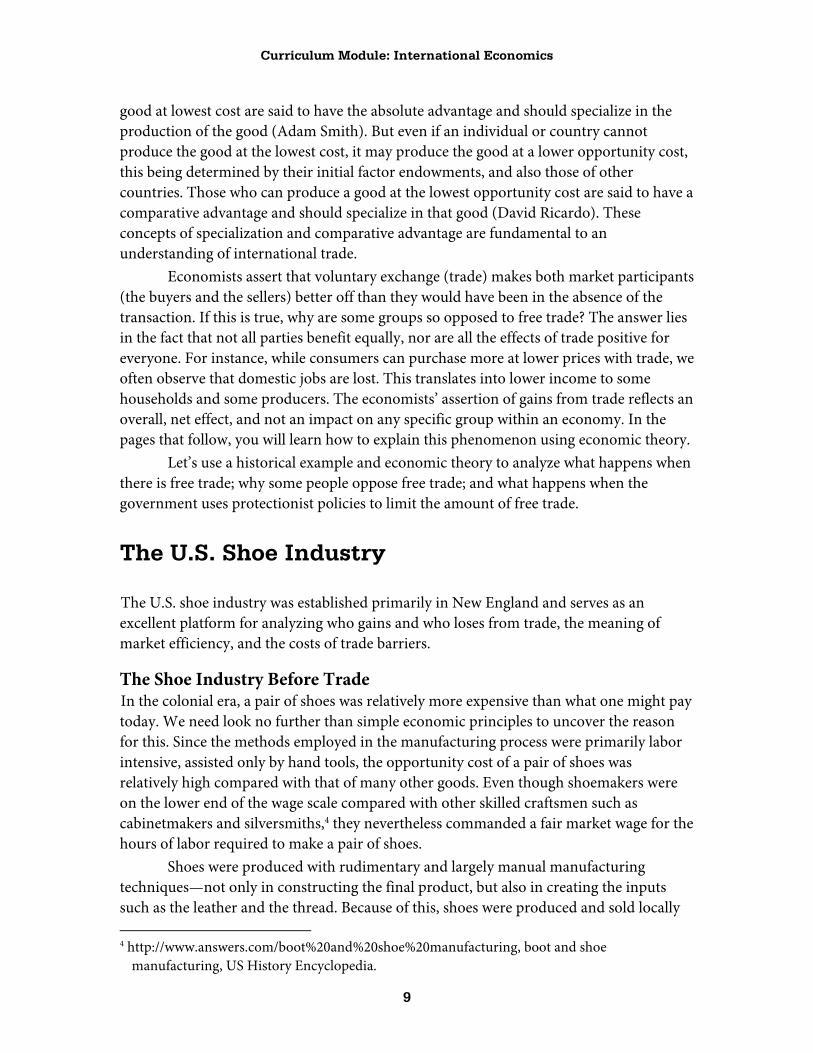
(i.e., not traded on the world market). Raw materials were generally not imported,5 and as many hours were required to make a pair of shoes, prices were relatively high. Figure 1 illustrates the U.S. shoe market in equilibrium. The position of the Domestic Supply curve reflects the relative high cost of production. We will assume throughout the analysis that follows, that demand remains constant.
Figure 2: Domestic producers’ supply and domestic buyers’ demand. (Figure courtesy of author).
This diagram illustrates the situation in the U.S. (the domestic economy) with no trade (i.e., shoes are produced domestically [no imports], and sold domestically [no exports]).
While shoes are not traded in Figure 1, shoes are a tradable good—they can either be imported or exported. There will be a few things you’ll note that are different about the diagrams for markets for tradable goods. First, you will note that supply and demand are labeled Domestic Supply and Domestic Demand. These are the same supply and demand curves you learned about when you first began your study in economics. By identifying them specifically as domestic curves, we can use this diagram to illustrate the situation with trade. This is a bit confusing. Perhaps change to “You will discover that with free trade, all consumers and producers face the world price.”
When there is no international trade in shoes, market equilibrium is determined by the intersection of the domestic demand and domestic supply curves, point A in
5 Thomson, Ross. (1989). The Path to Mechanized Shoe Production in the United States, Chapel
Hill: University of North Carolina Press.
Curriculum Module: International Economics
11
Figure 1. The domestic market equilibrium price of shoes is PA, and the equilibrium quantity of shoes produced and consumed domestically is QA
Gains from exchange in the domestic market Before we consider trading shoes on the world market, let’s review the concept of market efficiency in the shoe market. Efficiency is defined as the price and quantity that maximize total surplus. Figure 2 illustrates consumer and producer surplus when the domestic market is in equilibrium.
Figure 2:
As you will note, both consumers and producers gain from voluntary exchange in the domestic market. Consumer surplus is equal to the area of the upper shaded triangle in Figure 2. Producer surplus is equal to the area of the lower shaded triangle, and total surplus is equal to the sum of these two shaded triangles.
Changes in supply; changes in gains from exchange Around 1850, innovations in the industry occurred that mechanized many specialized processes. There were over 5,000 American patents6 for improvements in shoemaking.
6 Thomson, Ross. (1989). The Path to Mechanized Shoe Production in the United States, Chapel
Hill: University of North Carolina Press.
Curriculum Module: International Economics
12
Three were especially significant: 1. Howe sewing machine 2. Method of sewing upper to sole 3. Invention of the Goodyear Welt7
By 1919, there were 1,449 shoe firms with 211,000 employees producing 331 million pairs of shoes.8
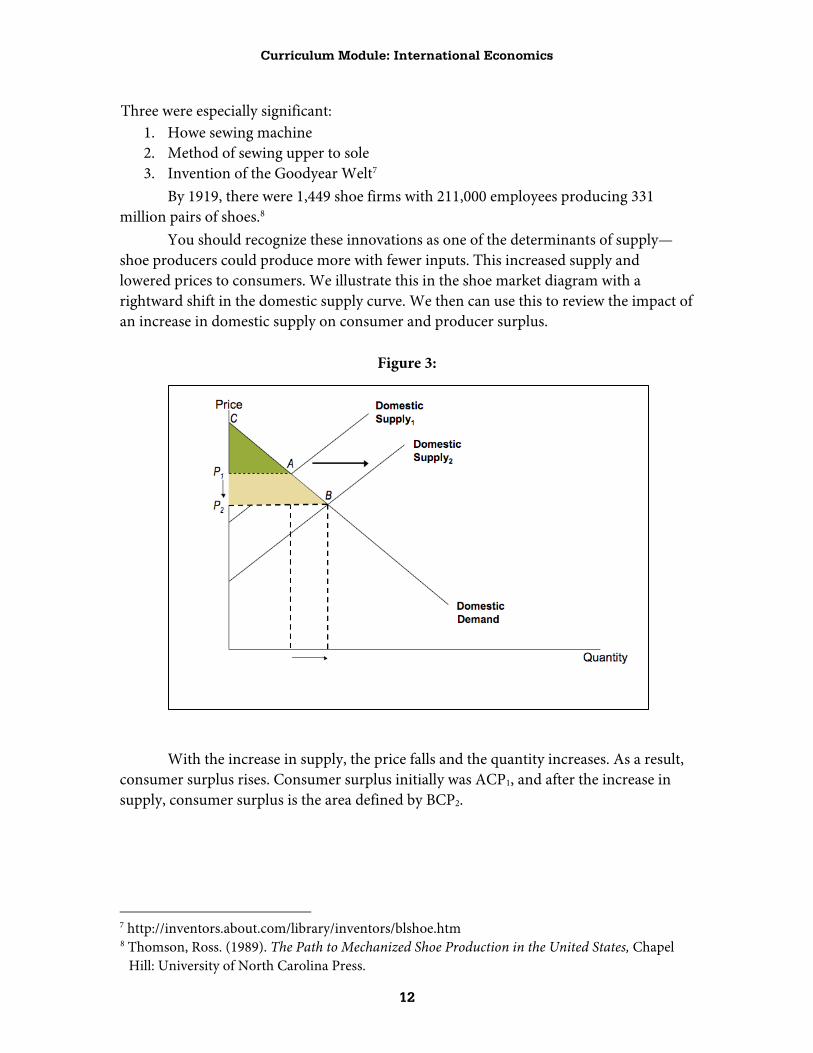
You should recognize these innovations as one of the determinants of supply—shoe producers could produce more with fewer inputs. This increased supply and lowered prices to consumers. We illustrate this in the shoe market diagram with a rightward shift in the domestic supply curve. We then can use this to review the impact of an increase in domestic supply on consumer and producer surplus.
Figure 3:
With the increase in supply, the price falls and the quantity increases. As a result, consumer surplus rises. Consumer surplus initially was ACP1, and after the increase in supply, consumer surplus is the area defined by BCP2.
7 http://inventors.about.com/library/inventors/blshoe.htm 8 Thomson, Ross. (1989). The Path to Mechanized Shoe Production in the United States, Chapel
Hill: University of North Carolina Press.
Curriculum Module: International Economics
13
Figure 4:
With the increase in supply, the price falls and the quantity increases. As drawn, producer surplus rises. Producer surplus initially was AFP1, and after the increase in supply, producer surplus is the area defined by BGP2.
Gains and losses from trade We can use the evolution of the shoe industry to analyze changes over time and examine who benefits and who loses from trade (sometimes called globalization in the news) in this industry. When there is trade, the price that domestic producers and consumers face is no longer fully determined by domestic supply and demand. Instead price is determined by the world market, which gives us the world price, and domestic producers and consumers face the world price when there is international trade.
In an open economy (i.e., an economy where there is trade), in markets for tradable goods, domestic QS and domestic QD are no longer equal, and the difference between the two (domestic shortage or surplus) represents the amount of trade (imports or exports). With trade, there will be a net gain in total surplus in the economy, which can be illustrated on the demand/supply diagram using the market analysis. You will discover that with trade, there are always winners and losers, but that the wins are greater than the losses.
After World War I, exports and imports increased in America as trade restrictions decreased. These changes affected the shoe industry.

Curriculum Module: International Economics
14
Figure 5:
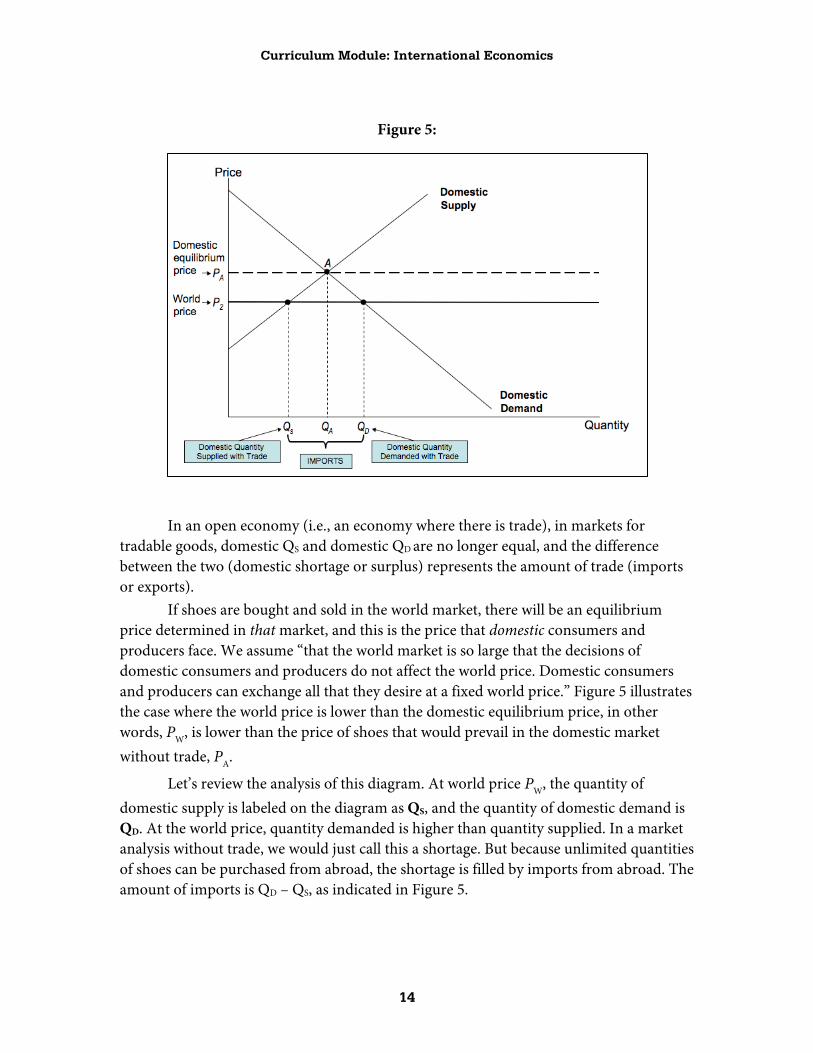
In an open economy (i.e., an economy where there is trade), in markets for tradable goods, domestic QS and domestic QD are no longer equal, and the difference between the two (domestic shortage or surplus) represents the amount of trade (imports or exports).
If shoes are bought and sold in the world market, there will be an equilibrium price determined in that market, and this is the price that domestic consumers and producers face. We assume “that the world market is so large that the decisions of domestic consumers and producers do not affect the world price. Domestic consumers and producers can exchange all that they desire at a fixed world price.” Figure 5 illustrates the case where the world price is lower than the domestic equilibrium price, in other words, PW, is lower than the price of shoes that would prevail in the domestic market without trade, PA.
Let’s review the analysis of this diagram. At world price PW, the quantity of domestic supply is labeled on the diagram as QS, and the quantity of domestic demand is QD. At the world price, quantity demanded is higher than quantity supplied. In a market analysis without trade, we would just call this a shortage. But because unlimited quantities of shoes can be purchased from abroad, the shortage is filled by imports from abroad. The amount of imports is QD – QS, as indicated in Figure 5.
Curriculum Module: International Economics
15
Who gained and who lost? American consumers gained because they pay lower prices for their shoes and are likely to have a larger variety of types and quality of shoes with trade. These gains can be demonstrated with an analysis of the change in consumer surplus.
American producers lost because the lower world price means that U.S. shoe manufacturers earned lower profits. Some went out of business because the world price was lower than their minimum average cost. The lower production (decrease in quantity supplied) of shoes in the United States resulted in a loss of jobs for workers in the shoe industry and in related industries. In fact, the few remaining American shoe producers tend to make specialty products such as hiking boots, steel-toed industrial shoes, and luxury products such as handmade bench-crafted shoes or custom-sized products. The losses incurred by producers can be illustrated with an analysis of the change in producer surplus.
With trade, there will be a net gain in total surplus in the economy, illustrated on the demand/supply diagram using the market analysis. You will discover that with trade there are always winners and losers, but that the wins are greater than the losses. Figure 6 illustrates these impacts.
Figure 6:
CHANGE IN SURPLUS Gain Loss
Consumer Surplus X + Z
Producer Surplus X
Change in Total Surplus Z
Curriculum Module: International Economics
16
With no trade, consumer surplus was represented by the area CS. With trade,
consumer surplus is CS + X + Z. So consumers gain from trade when the world price is below the domestic equilibrium price and the country imports the good. However, domestic producers lose. Producer surplus before trade was PS + X, and after trade, producer surplus is PS. Imports of a particular good hurt domestic producers of that good but help domestic consumers. Consumers gain X + Z, whereas producers lose X, which means that the gains are greater than the losses—so overall, there is a net gain from trade for the economy. For exports, it is the opposite case—consumers are made worse off and producers are made better off. In each case, the gains are larger than the losses.
“The undoubted pain suffered by the losers from trade often is translated into pressure put on politicians to restrict trade in one way or another. The pain is often felt more strongly than the “happiness” felt by those who benefit from trade.”9
Those who lose with trade often put pressure on politicians for trade barriers—policies that protect them from trade. If politicians yield to this pressure, there are costs that need to be taken into account. An import tariff is an example of such a policy, designed to protect domestic producers. What we’ll see is that while producers may be made better off by a tariff, the improvement in their well-being is at the expense of consumers, and that the loss to consumers is greater than the gains to producers.
The Effects of Trade Protection Trade protection consists of policies that discourage imports, usually aimed at protecting domestic producers. The most common protectionist policy is a tariff. A tariff is a form of excise tax on sales of imported goods.
The effect of a tariff is to raise both the price received by domestic producers and the price paid by domestic consumers.
As an example, when the United States imports shoes, and a tariff of $100 per pair of shoes is imposed, the domestic price will rise by $100 per pair, and it won’t be profitable to import shoes unless the price in the domestic market is high enough to compensate importers for the cost of paying the tariff.
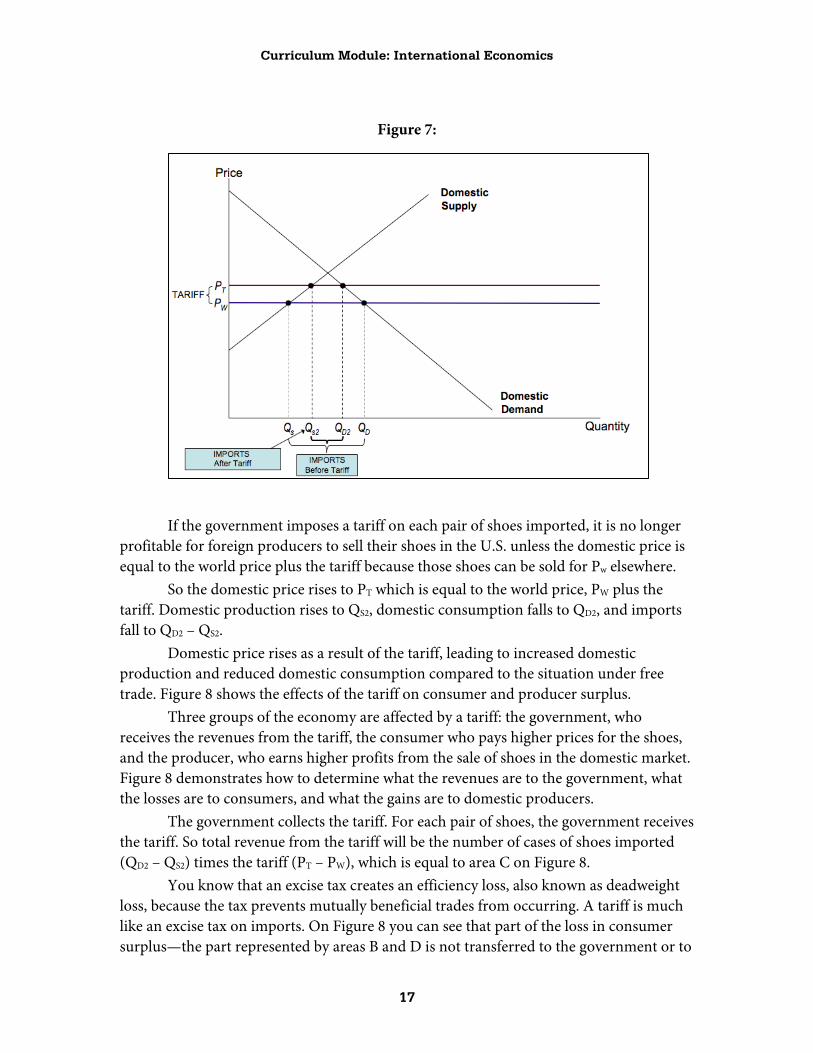
Figure 7 illustrates the effects of a tariff on shoe imports. As before, we assume that PW is the world price of shoes. Before the tariff is imposed, imports have driven the domestic price down to PW, so that pre-tariff domestic production is QS, pre-tariff domestic consumption is QD, and pre-tariff imports are QD – QS.
9 Stone, Gerald. (2007). CoreMicroeconomics, International Trade (chapter). New York: Worth
Publishers.

Curriculum Module: International Economics
17
Figure 7:
If the government imposes a tariff on each pair of shoes imported, it is no longer profitable for foreign producers to sell their shoes in the U.S. unless the domestic price is equal to the world price plus the tariff because those shoes can be sold for Pw elsewhere.
So the domestic price rises to PT which is equal to the world price, PW plus the tariff. Domestic production rises to QS2, domestic consumption falls to QD2, and imports fall to QD2 – QS2.
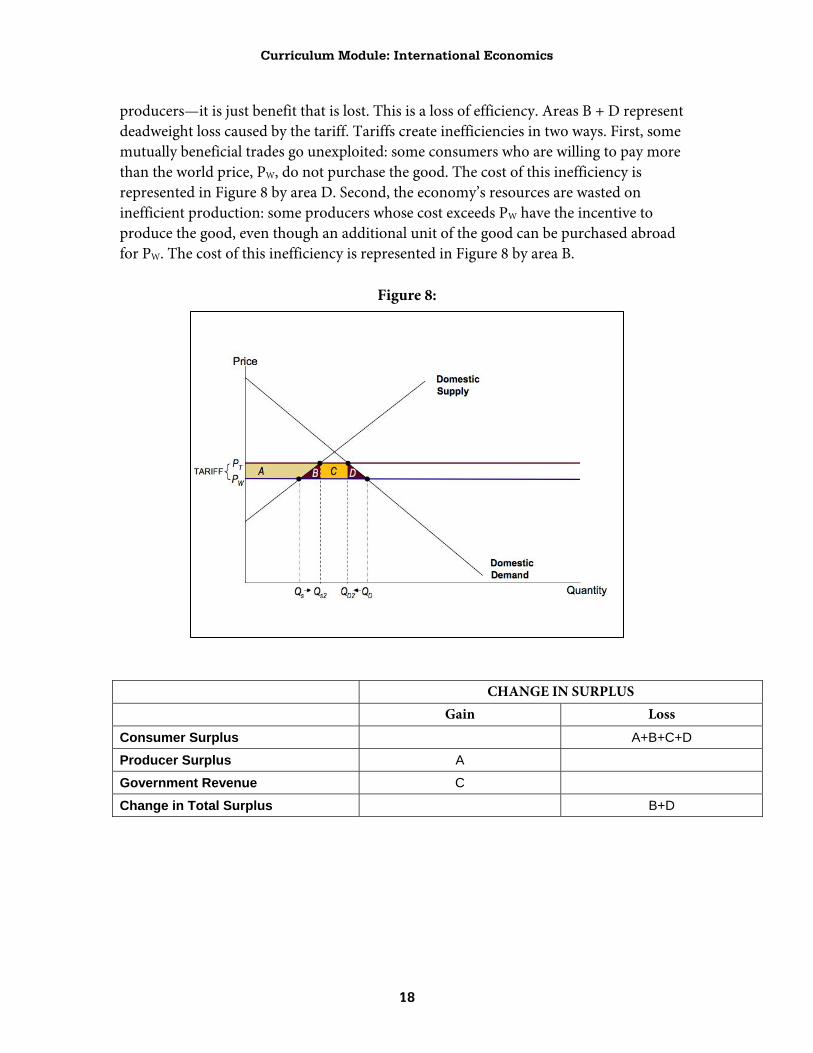
Domestic price rises as a result of the tariff, leading to increased domestic production and reduced domestic consumption compared to the situation under free trade. Figure 8 shows the effects of the tariff on consumer and producer surplus.
Three groups of the economy are affected by a tariff: the government, who receives the revenues from the tariff, the consumer who pays higher prices for the shoes, and the producer, who earns higher profits from the sale of shoes in the domestic market. Figure 8 demonstrates how to determine what the revenues are to the government, what the losses are to consumers, and what the gains are to domestic producers.
The government collects the tariff. For each pair of shoes, the government receives the tariff. So total revenue from the tariff will be the number of cases of shoes imported (QD2 – QS2) times the tariff (PT – PW), which is equal to area C on Figure 8.
You know that an excise tax creates an efficiency loss, also known as deadweight loss, because the tax prevents mutually beneficial trades from occurring. A tariff is much like an excise tax on imports. On Figure 8 you can see that part of the loss in consumer surplus—the part represented by areas B and D is not transferred to the government or to
Curriculum Module: International Economics
18
producers—it is just benefit that is lost. This is a loss of efficiency. Areas B + D represent deadweight loss caused by the tariff. Tariffs create inefficiencies in two ways. First, some mutually beneficial trades go unexploited: some consumers who are willing to pay more than the world price, PW, do not purchase the good. The cost of this inefficiency is represented in Figure 8 by area D. Second, the economy’s resources are wasted on inefficient production: some producers whose cost exceeds PW have the incentive to produce the good, even though an additional unit of the good can be purchased abroad for PW. The cost of this inefficiency is represented in Figure 8 by area B.
Figure 8:
CHANGE IN SURPLUS Gain Loss
Consumer Surplus A+B+C+D
Producer Surplus A
Government Revenue C
Change in Total Surplus B+D

Curriculum Module: International Economics
19
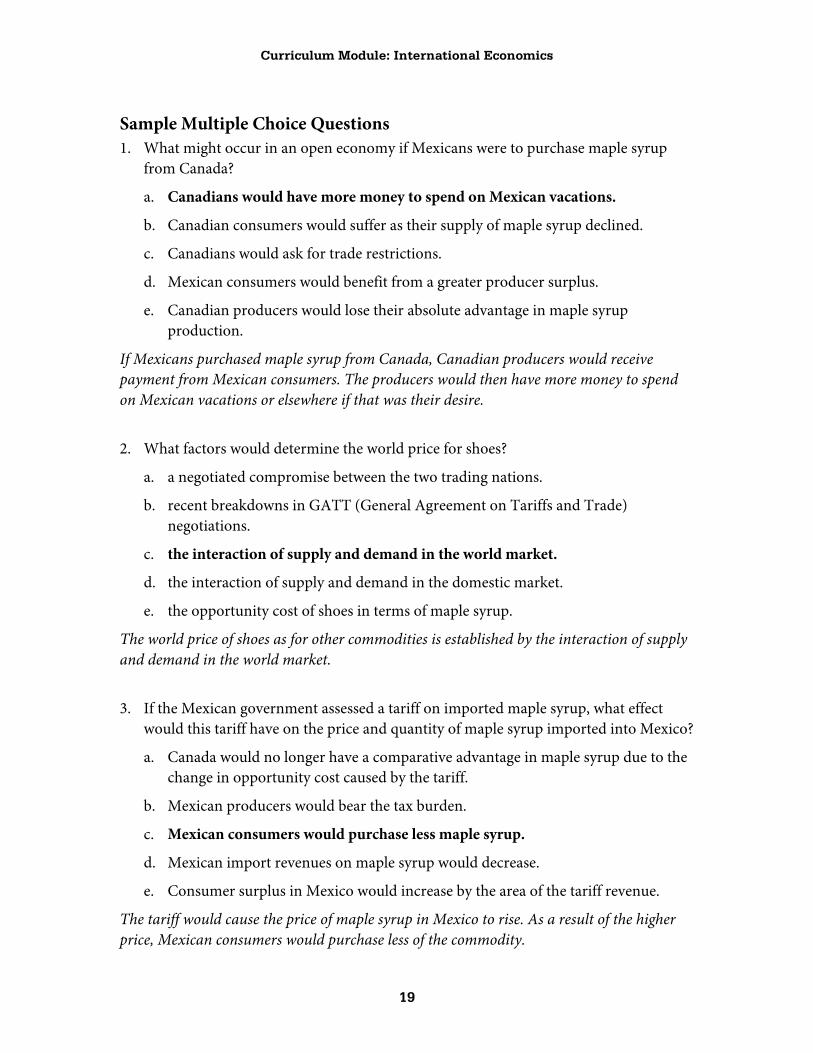
Sample Multiple Choice Questions 1. What might occur in an open economy if Mexicans were to purchase maple syrup
from Canada?
a. Canadians would have more money to spend on Mexican vacations.
b. Canadian consumers would suffer as their supply of maple syrup declined.
c. Canadians would ask for trade restrictions.
d. Mexican consumers would benefit from a greater producer surplus.
e. Canadian producers would lose their absolute advantage in maple syrup production.
If Mexicans purchased maple syrup from Canada, Canadian producers would receive payment from Mexican consumers. The producers would then have more money to spend on Mexican vacations or elsewhere if that was their desire.
2. What factors would determine the world price for shoes?
a. a negotiated compromise between the two trading nations.
b. recent breakdowns in GATT (General Agreement on Tariffs and Trade) negotiations.
c. the interaction of supply and demand in the world market.
d. the interaction of supply and demand in the domestic market.
e. the opportunity cost of shoes in terms of maple syrup.
The world price of shoes as for other commodities is established by the interaction of supply and demand in the world market.
3. If the Mexican government assessed a tariff on imported maple syrup, what effect would this tariff have on the price and quantity of maple syrup imported into Mexico?
a. Canada would no longer have a comparative advantage in maple syrup due to the change in opportunity cost caused by the tariff.
b. Mexican producers would bear the tax burden.
c. Mexican consumers would purchase less maple syrup.
d. Mexican import revenues on maple syrup would decrease.
e. Consumer surplus in Mexico would increase by the area of the tariff revenue.
The tariff would cause the price of maple syrup in Mexico to rise. As a result of the higher price, Mexican consumers would purchase less of the commodity.
Curriculum Module: International Economics
20
4. In one month, Quebec can produce 10 liters of maple syrup or 100 shoes. In the same time period, Oaxaca can produce 5 liters of maple syrup or produce 75 shoes. When Mexico and Canada begin trading maple syrup and shoes, we could expect:
a. the price of maple syrup in Canada to fall from the closed economy price.
b. the price of maple syrup in Canada to rise from the closed economy price.
c. the price of maple syrup in Canada to remain unchanged.
d. the price of maple syrup in Canada to be 7.5 liters of maple syrup.
e. Canadian producers of maple syrup to oppose trade.
In Quebec, one liter of maple syrup costs 10 shoes. In Oaxaca, one liter of maple syrup costs 15 shoes. Consequently, maple syrup is relatively more expensive in Oaxaca and very likely will sell for a higher price in that market. As a result of trade, Canadians would find it beneficial to sell the maple syrup in a market where it will yield a higher price. This exportation will decrease the supply in the Canadian market and raise the price.
Curriculum Module: International Economics
21
Sample Free Response Question Assume that Canada imports shoes from Mexico and that the price of shoes in Mexico is lower than the domestic price of shoes in Canada.
i) Explain what happens to the market price and quantity of shoes in Canada as a result of trade. Use a diagram to illustrate your answer.
ii) Show how trade affects producer surplus in Canada and explain how trade affects the Canadian producers.
iii) What trade policies might the Maple Leaf Boot Company, a Canadian manufacturer of footwear ask the government of Canada to implement? How would your policy affect Canadian producers were the policy to be adopted?
Curriculum Module: International Economics
22
Answer Key
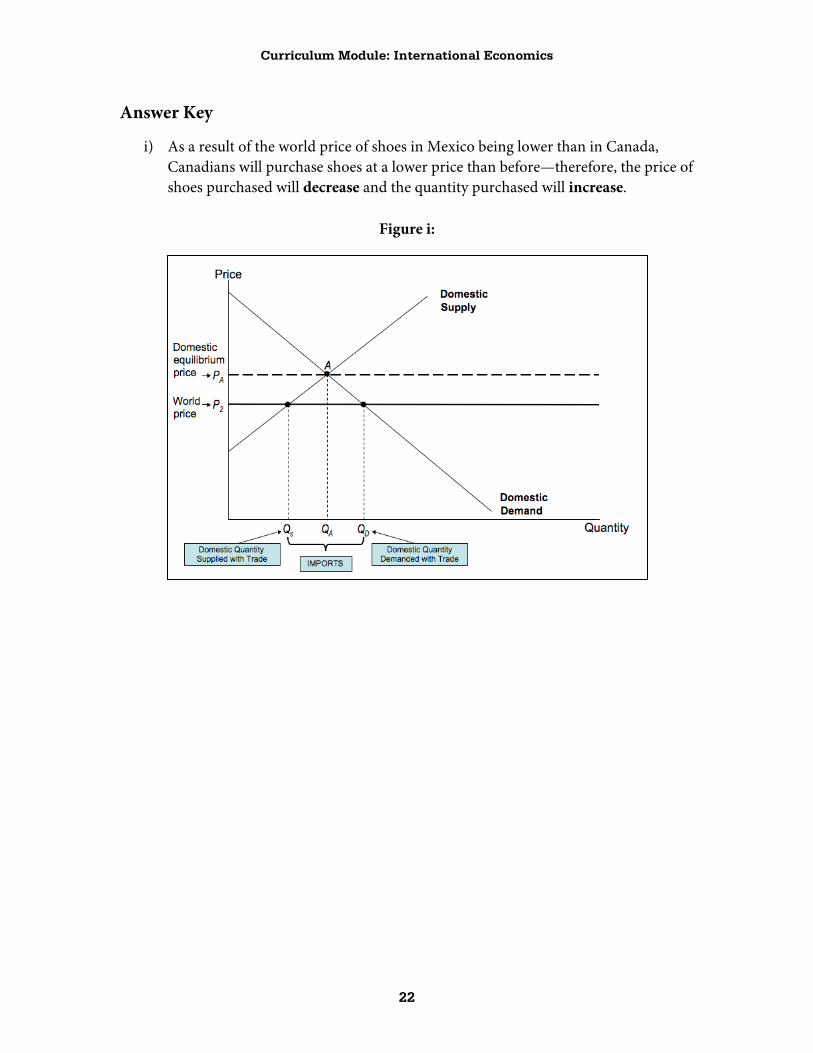
i) As a result of the world price of shoes in Mexico being lower than in Canada, Canadians will purchase shoes at a lower price than before—therefore, the price of shoes purchased will decrease and the quantity purchased will increase.
Figure i:
Curriculum Module: International Economics
23
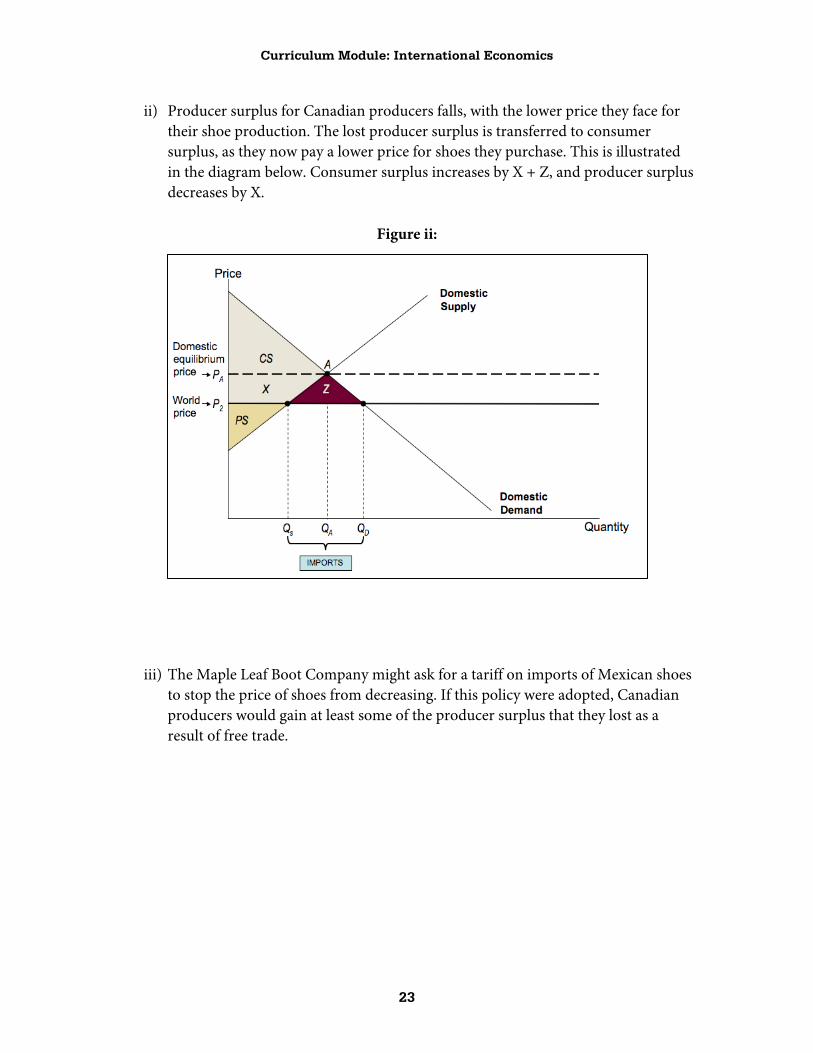
ii) Producer surplus for Canadian producers falls, with the lower price they face for their shoe production. The lost producer surplus is transferred to consumer surplus, as they now pay a lower price for shoes they purchase. This is illustrated in the diagram below. Consumer surplus increases by X + Z, and producer surplus decreases by X.
Figure ii:
iii) The Maple Leaf Boot Company might ask for a tariff on imports of Mexican shoes to stop the price of shoes from decreasing. If this policy were adopted, Canadian producers would gain at least some of the producer surplus that they lost as a result of free trade.

Curriculum Module: International Economics
24
The Basics of Absolute and Comparative Advantage
Peggy Pride St. Louis University High School St. Louis, Missouri
The inclusion of the topic of comparative advantage in the AP Microeconomics Course Description outline and summary helps students to see how trade can solve the scarcity problem, since we face a limited set of resources. Specialization and international trade increase the productivity and efficient use of a nation’s resource base and allow for a larger total output. A discussion of these topics works well within broader teaching on opportunity cost, developing the use of production possibility curves.
Learning Objectives 1. Students will be able to define specialization and relate its definition to resource
use.
2. Students will be able to comprehend the “basis for trade” using the two concepts of absolute and comparative advantage.
3. Students will be able to visually demonstrate their understanding of these concepts by using Production Possibility curves.
Basic Terms Specialization occurs when workers or nations concentrate on what they do best. It usually means improved quality and/or increases in output. Absolute Advantage is the ability to produce a good or service more efficiently—a lower cost of resources—than another producer. Comparative Advantage is the ability to produce a good or service at a lower opportunity cost than another producer. Resources are scarce, so that one can only produce more of one product by taking the resources away from another.
Starter activity or discussion starter 1. As a discussion starter using a primary source, try:
http://www.econlib.org/Library/Topics/Details/comparativeadvantage.html • Of particular interest at this link for The Library of Economics and Liberty is
the excerpt from David Ricardo. He compares Portugal’s production of wine with England’s production of cloth to illustrate the benefits of specialization and trade.

Curriculum Module: International Economics
25
2. Asking this set of questions will start the thinking process of connecting the ideas to concepts learned earlier:
• Why do people trade? Both parties gain. Just as individuals specialize, so do nations, gaining greater output and income. (A gain in the ability to consume more goods and services moves the production possibility curve to the right.)
• Why does a school hire a teacher who has a degree in teaching?
Both parties gain. Students can gain the greatest benefit in their educational pursuit and the teacher teaches to satisfy a need for income and to gain a good feeling about the employment. (Efficient use of human resources.)
• Why do I teach economics?
Both parties gain. Students enrolled in AP Economics gain the greatest benefit, while the teacher gains a greater income and feeling of satisfaction by specializing. (Specialization increases efficient resource use.)
• Why does the U.S. import bananas?
U.S. farmers could grow bananas, but it would be very expensive; they gain more by growing wheat and trading it for bananas. (Our resources are better suited to growing wheat, so we specialize.)
Lesson 1. Use the Lecture Notes given to explore the ideas of
• Economic Basis of Trade • Specialization • Comparative and Absolute Advantage
2. Use the Activity Page given to aid student understanding in terms of how opportunity costs are measured to derive the comparative advantage.
3. Integrate the given Multiple-Choice Questions and Free Response Question into the first unit test in your AP Microeconomics course.
Curriculum Module: International Economics
26
Lecture Notes From The Wealth of Nations, written in 1776 by Adam Smith: “In every country it always is and must be the interest of the great body of the people to buy whatever they want of those who sell it cheapest.”10
Economic Basis for Trade 1. Uneven Distribution of Economic Resources. Since resources worldwide are not
equally available, nations have differences in opportunity costs and thus comparative advantage exists.
2. Different Technologies and/or Resources are present worldwide. Based on the skills
and innovative characteristics of a nation’s entrepreneurs, a sharing of the benefits of increased technology can benefit all.
3. Goods Are Differentiated as to Quality and Other Non-Price Attributes.
Individuals often will choose products that have unique characteristics of quality or desirability found only through trade with other nations.
Specialization occurs when workers or nations concentrate on what they do best. It usually means improved quality and/or increases in output.
1. Labor-Intensive Goods
• Goods that require a large amount of labor to be produced. i. Japan with its large, well-educated workforce can produce high-quality
electronics efficiently.
2. Land-Intensive Goods • Goods that require a large amount of usable land to be produced.
i. Canada has large open spaces suitable for growing corn and growing and harvesting trees for wood and paper.
ii. Brazil has the tropical climate of high temperature and rainfall with rich soil to grow tea. Their large, unskilled labor force is also a benefit for tea production.
3. Capital-Intensive Goods
• Goods that require a large amount of capital goods to be produced.
10 Smith, Adam. (1776). An Inquiry into the Nature and Causes of the Wealth of Nations. Book 4,
chap. 3. Location: Publisher - verified by The Library of Economics and Liberty Web site. http://www.econlib.org/library/Smith/smWN14.html#B.IV,%20Ch.3,%20Of%20the%20extraordinary%20Restraints%20upon%20the%20Importation%20of%20Goods%20of%20almost%20all%20Kinds
Curriculum Module: International Economics
27
i. The United States can more easily produce large agricultural and earth moving equipment, automobiles, and chemicals, since it has large manufacturing facilities with extensive capital equipment.
Comparative advantage is the ability to produce a good or service at a lower opportunity cost than another producer. Resources are scarce: one can only produce more of one product by taking the resources away from another.
• Absolute advantage is the ability to produce a good or service more efficiently—at a lower cost of resources—than other producers. To find comparative advantage for two nations, do not compare their absolute advantage in production. Examine opportunity cost to determine comparative advantage.
• Total output will be greatest when each good is produced by the nation that has lowest domestic opportunity cost for that good.
• As a result of trade, countries that specialize and export products for which they have a comparative advantage can have more of both products (what is produced and what it is traded for).
Two countries are considering trading two products, which they both produce:
Figure 1: Production Possibility Curves
1. These production possibility curves show the combinations of tea and corn that can be produced by each of these nations without trade assuming constant opportunity costs.
7
20
10
Nation B
Corn (tons)
3
Tea (Tons)
30
Nation A
16
10
Tea (Tons)
Corn (tons)

Curriculum Module: International Economics
28
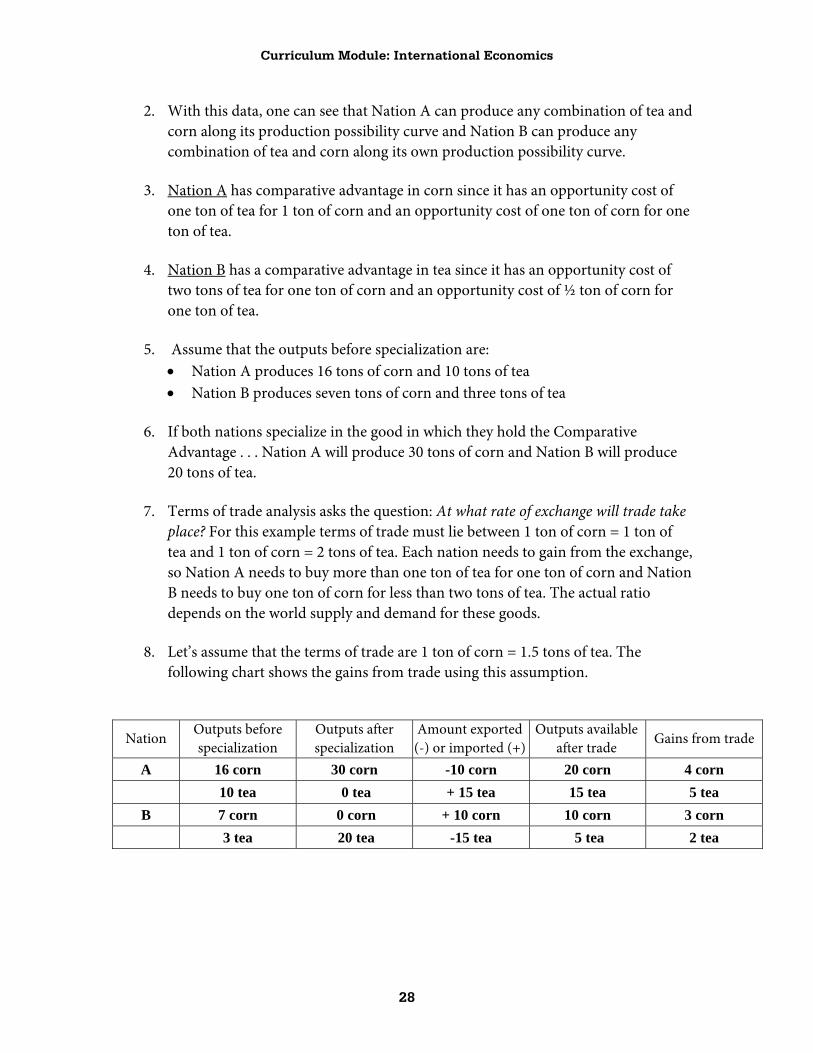
2. With this data, one can see that Nation A can produce any combination of tea and corn along its production possibility curve and Nation B can produce any combination of tea and corn along its own production possibility curve.
3. Nation A has comparative advantage in corn since it has an opportunity cost of
one ton of tea for 1 ton of corn and an opportunity cost of one ton of corn for one ton of tea.
4. Nation B has a comparative advantage in tea since it has an opportunity cost of
two tons of tea for one ton of corn and an opportunity cost of ½ ton of corn for one ton of tea.
5. Assume that the outputs before specialization are:
• Nation A produces 16 tons of corn and 10 tons of tea • Nation B produces seven tons of corn and three tons of tea
6. If both nations specialize in the good in which they hold the Comparative
Advantage . . . Nation A will produce 30 tons of corn and Nation B will produce 20 tons of tea.
7. Terms of trade analysis asks the question: At what rate of exchange will trade take
place? For this example terms of trade must lie between 1 ton of corn = 1 ton of tea and 1 ton of corn = 2 tons of tea. Each nation needs to gain from the exchange, so Nation A needs to buy more than one ton of tea for one ton of corn and Nation B needs to buy one ton of corn for less than two tons of tea. The actual ratio depends on the world supply and demand for these goods.
8. Let’s assume that the terms of trade are 1 ton of corn = 1.5 tons of tea. The
following chart shows the gains from trade using this assumption.
Nation Outputs before specialization
Outputs after specialization
Amount exported (-) or imported (+)
Outputs available after trade
Gains from trade
A 16 corn 30 corn -10 corn 20 corn 4 corn 10 tea 0 tea + 15 tea 15 tea 5 tea
B 7 corn 0 corn + 10 corn 10 corn 3 corn 3 tea 20 tea -15 tea 5 tea 2 tea

Curriculum Module: International Economics
29
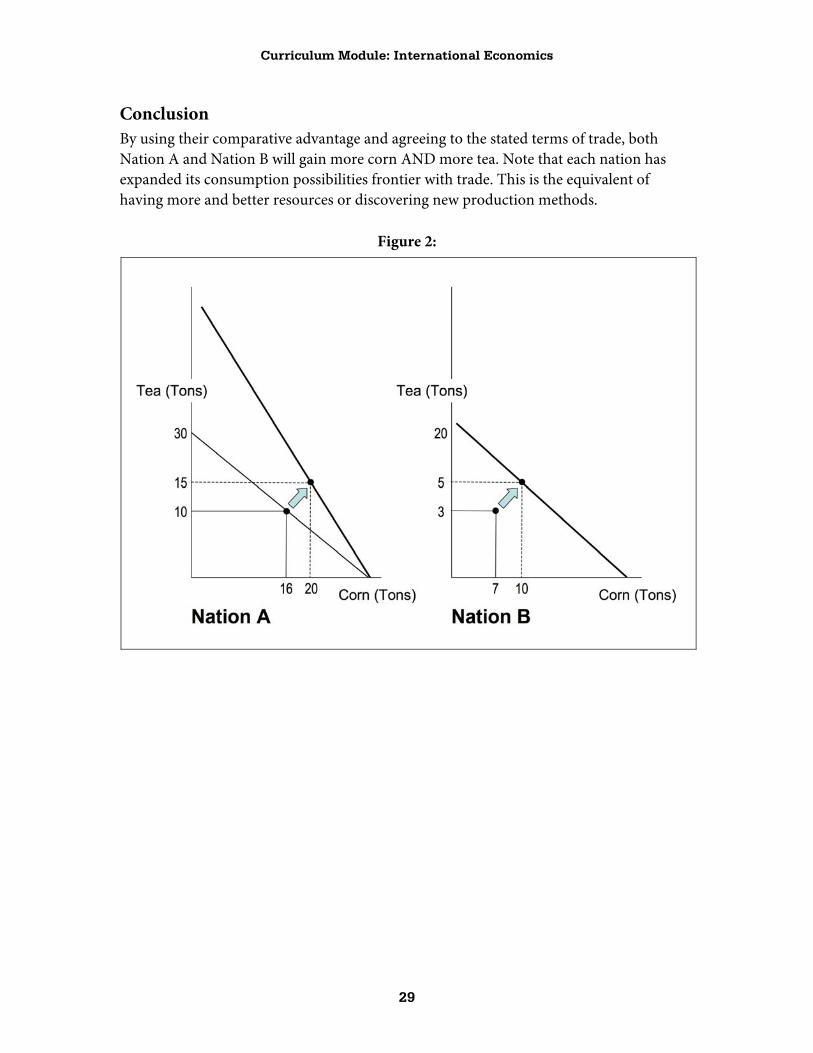
Conclusion By using their comparative advantage and agreeing to the stated terms of trade, both Nation A and Nation B will gain more corn AND more tea. Note that each nation has expanded its consumption possibilities frontier with trade. This is the equivalent of having more and better resources or discovering new production methods.
Figure 2:

Curriculum Module: International Economics
30
Student Activity Sheet—Comparative and Absolute Advantage
1. Define Comparative Advantage:
2. Define Absolute Advantage:
Chipland and Entertainia
Two nations that currently produce their own computer chips and CD players
Required Inputs Without Trade
Product Chipland Entertainia 1 Computer Chip 5 hours 24 hours
1 CD Player 10 hours 12 hours Total 15 hours 36 hours
3. Who has the absolute advantage in computer chip production? How do you know?
4. Who has the absolute advantage in CD player production? How do you know?
5. Why would that nation care about trade?
6. Calculate the Opportunity Cost of production (fill in the chart) Product Chipland Entertainia
1 Computer Chip 1 CD Player

Curriculum Module: International Economics
31
7. Who has the comparative advantage in production of computer chips?
8. Who has the comparative advantage in CD player production?
9. With Specialization in place, complete this chart:
Consumption With Trade
Chipland Entertainia 1 Computer Chip for Chipland 1 CD Player for Entertainia
1 Computer Chip for Entertainia 1 CD Player for Chipland Total Total
10. Discuss the gains from trade based on the data given.
Curriculum Module: International Economics
32
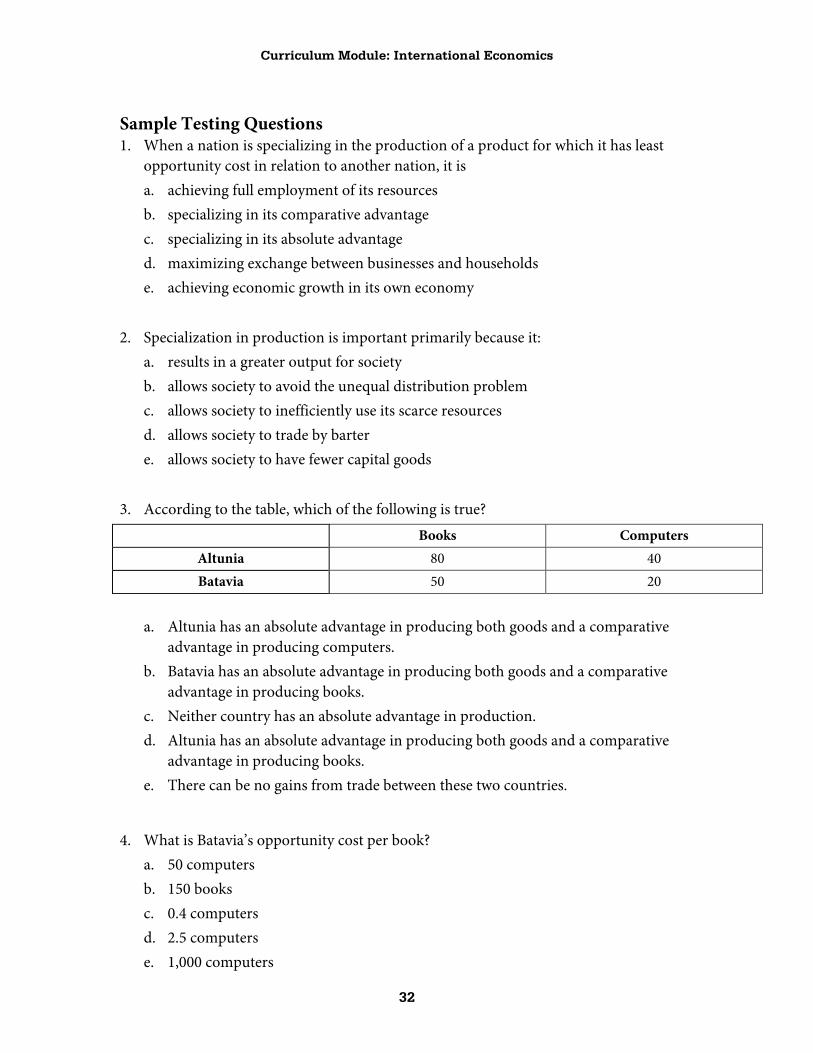
Sample Testing Questions 1. When a nation is specializing in the production of a product for which it has least
opportunity cost in relation to another nation, it is a. achieving full employment of its resources b. specializing in its comparative advantage c. specializing in its absolute advantage d. maximizing exchange between businesses and households e. achieving economic growth in its own economy
2. Specialization in production is important primarily because it: a. results in a greater output for society b. allows society to avoid the unequal distribution problem c. allows society to inefficiently use its scarce resources d. allows society to trade by barter e. allows society to have fewer capital goods
3. According to the table, which of the following is true?
Books Computers Altunia 80 40 Batavia 50 20
a. Altunia has an absolute advantage in producing both goods and a comparative
advantage in producing computers. b. Batavia has an absolute advantage in producing both goods and a comparative
advantage in producing books. c. Neither country has an absolute advantage in production. d. Altunia has an absolute advantage in producing both goods and a comparative
advantage in producing books. e. There can be no gains from trade between these two countries.
4. What is Batavia’s opportunity cost per book? a. 50 computers b. 150 books c. 0.4 computers d. 2.5 computers e. 1,000 computers
Curriculum Module: International Economics
33
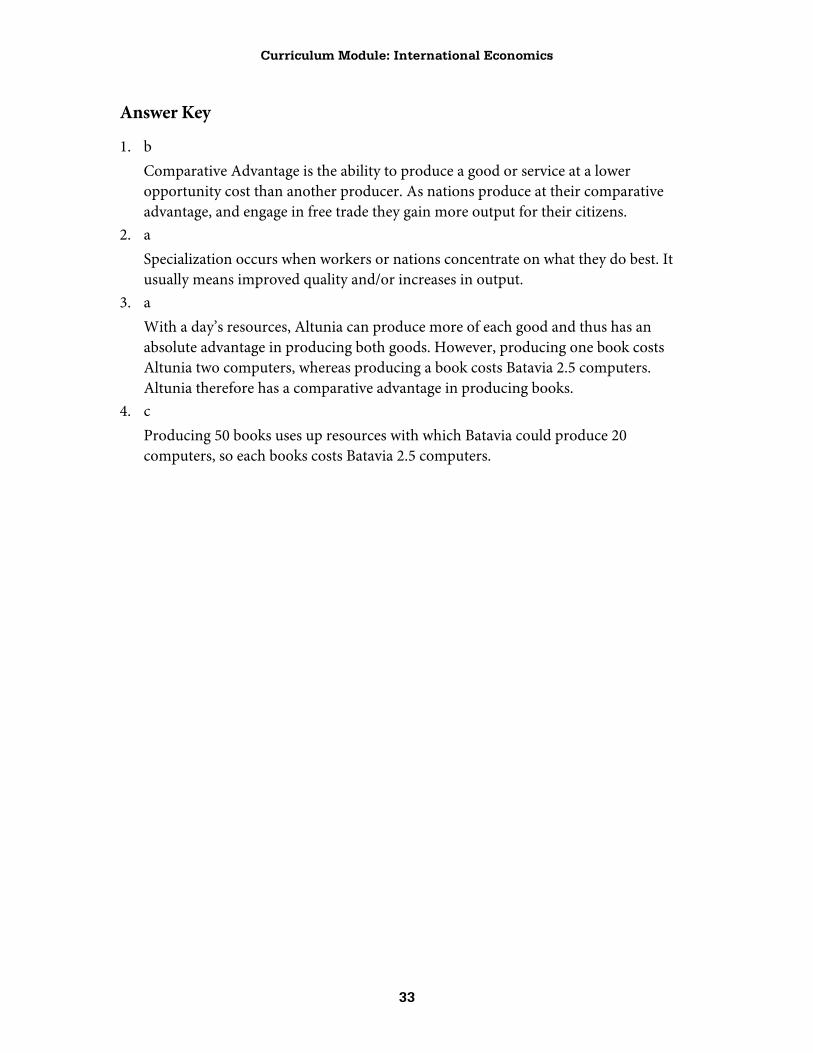
Answer Key
1. b Comparative Advantage is the ability to produce a good or service at a lower opportunity cost than another producer. As nations produce at their comparative advantage, and engage in free trade they gain more output for their citizens.
2. a Specialization occurs when workers or nations concentrate on what they do best. It usually means improved quality and/or increases in output.
3. a With a day’s resources, Altunia can produce more of each good and thus has an absolute advantage in producing both goods. However, producing one book costs Altunia two computers, whereas producing a book costs Batavia 2.5 computers. Altunia therefore has a comparative advantage in producing books.
4. c Producing 50 books uses up resources with which Batavia could produce 20 computers, so each books costs Batavia 2.5 computers.

Curriculum Module: International Economics
34
Free Response Question Assume that Countries X and Y have equal amounts of resources and identical technology. Country X can produce 100 bushels of corn or 100 yards of cloth or any combination as shown in line AB. Country Y can produce 100 bushels of corn or 200 yards of cloth or any combination as shown in line CD.
1. Which country has the Absolute Advantage in the production of corn and which has the Absolute Advantage in the production of cloth? How do you know?
2. Which country has the Comparative Advantage in the production of corn and which has the Comparative Advantage in the production of cloth? Explain.
3. With specialization and trade, which country will import corn?
4. Assume that the countries trade and that one bushel of wheat is exchanged for two yards of cloth, what will the country that imports corn gain from trade?

Curriculum Module: International Economics
35
Answer Key 1. Neither country has the absolute advantage in the production of corn. Country Y
has the absolute advantage in the production of cloth since it can make more. 2. Country X gives up 1 yard of cloth for 1 bushel of corn, while Country Y gives up
2 yards of cloth for 1 bushel of corn. It is relatively more expensive for Country Y to produce corn so Country X has the comparative advantage in the production of corn and Country Y has a comparative advantage to produce cloth.
3. Country Y will import corn. 4. Country Y using trade will gain more of each good. Specialization and trade
increases Country Y’s consumption possibilities making it possible to consume more of both.
Curriculum Module: International Economics
36
Contributors Linda M. Manning has taught first year economics at colleges and universities in the United States and Canada for 20 years. She served as a faculty Reader and Table Leader at the annual AP Economics Examination Readings for 10 years, was a member of the AP Economics Test Development Committee for 3 years, and co-moderated the AP Economics listserve for several years. She taught at the University of Missouri-Rolla from 1989–2001, where she served as the director of the Center for Economic Education. Currently at the University of Ottawa, she teaches economics as well as a course for future professors titled, “Theory and Practice of University Teaching.” In 2006 she coauthored Krugman & Wells Economics AP Economics Teaching Tool Kit (Worth Publishers) to accompany the Krugman & Wells Economics (AP Version)11 textbook for AP teachers, with Bill McCormick. Linda received her Ph.D. from the University of Illinois at Chicago in 1990.
Bill McCormick has served as a teacher of economics and AP Microeconomics in Richland District Two (in Columbia, South Carolina) for 24 years. He has taught AP Microeconomics for the last 10 years and served as a Reader for AP Microeconomics for the past 6 years. He also serves as an adjunct faculty member of Southern Wesleyan University teaching International Business and other management courses to adult professionals. Bill received his undergraduate degree from the University of South Carolina in 1975 (B.A. in Education) and an MBA in 1978.
Peggy Pride received both an undergraduate degree in history and economics (1971) and a master’s degree in business education (1986) from Southern Illinois University at Edwardsville. She has taught at St. Louis University High School since August of 1981 and currently teaches four sections of AP Microeconomics and Macroeconomics. She was given the Teacher of the Year Award by the Global Association of Teachers of Economics in 2005. Peggy has been the Micro Question Leader at the annual Reading for the past four years, and served for five years on the AP Economics Development Committee, and was the content advisor for AP Central® Economics.
Arthur Raymond is the head of the Accounting, Business, and Economics Department at Muhlenberg College in Allentown, Pennsylvania. A former member of the Development Committee, he currently serves as the Chief Reader for AP Microeconomics and AP Macroeconomics.
11 Per Bedford, Freeman, & Worth Web site:
http://www.bfwpub.com/highschool/newcatalog.aspx?isbn=071678355X&disc=HS&course=Social+Studies&detail=supplements
Curriculum Module: International Economics
37
Editor/College Board Advisor Richard K. Rankin has taught AP Microeconomics and AP Macroeconomics at Iolani High School in Honolulu, Hawaii, since 1994. Dick holds a bachelor’s degree in economics from the Virginia Military Institute, an MBA from Shippensburg University, and a master’s in economics from the University of Texas at Austin. He is a retired colonel having served in the U.S. Army for 26 years. While on active duty, he taught Principles of Economics and was the course director for sophomore economics at the U.S. Military Academy at West Point, and at the University of Maryland. He was selected as the NASDAQ National Economics Teacher of the Year in 2001, and was selected as the Department of Social Sciences Outstanding Teacher of the Year at West Point. Dick has served as a Reader for the AP Microeconomics Exam and as a Reader, as well as Table Leader, for the AP Macroeconomics Exam. Dick is a former Development Committee member, and is a board member on the Hawaii Council for Economic Education. He is the author of Money Management for Starters.