International Conference On Recent Trends In Engineering...
69
International Conference On Recent Trends In Engineering Science And Management ISBN: 978-81-931039-2-0 Jawaharlal Nehru University, Convention Center, New Delhi (India), 15 March 2015 www.conferenceworld.in 1000 | Page ETHNOBOTANY STUDY OF SOME ETHNOMEDICINAL PLANTS OF GOPALGANJ USED TO CURE DIABETES MELLITUS Basant Narain Singh 1 , Surendra Kr.Prasad 2 , P.K.Singh 3 1 Department of Botany, SMD Degree College MN Jalalpur, Gopalganj JPU, Chapra, Bihar, (India) 2 Deparment of Botany Magadh Mahila College, Patna University,Patna ,Bihar, (India) 3 Yoga Therapist, Yogo Chiktsa Kendra, South of Gandak Colony, Nai Bazaar Chapra, (India) ABSTRACT The Present paper deals with the enumeration of 15 Eethnomedicinal plants which are commonly used for the treatment of a silent killer disease Diabetes Mellitus. Keywords: Cure Diabetes, Diabetes Mellitus, Ethnmedicinal Plant, Gopalgnaj. I. INTODUCTION Since time immemorial human being using ethno medicinal plants as medicines. Our Rig veda stand to the testimony. our anciant literature like Charak Samhita and Susruta Samhita provides detail information on ethno medicinal plants (Devraj 1985, Sharma and Goswami, 1992). Ethno medicinal healing practices have been widely accepted during our culture and environmental evolution. Which is acquiring a gigantic challenge. Diabetes mellitus (DM) is defined as elevated blood glucose associated with absent or inadequate pancreatic insulin secretion, with or without concurrent impairment of insulin action. The world wide prevalence of DM has risen dramatically from an estimated 30 million cases in 1985 to 177 million in 2000 and based on the current trends more than 360 million individuals will have diabetes by the year 2030. Now it is very imperative to explore the values of ethno medicinal plants with special emphasis on plants used to cure DM. Gopalganj a tarai belts of Nepal and lies between 26 0 12’- 26 0 39’ N latitude and 83 0 54’- 85 0 55’ East longitude. The total geographical area covered by the district is 2033 squire Km and about 73 Feet above mean sea level. The soil of the District is thick alluvium deposited by River Gandak and its ph ranges from 7-8.Climate is tropical, Temperature ranges 4 0 C in winter to 40 0 C – 42 0 C in summer and rainfall is about 1170.90 mm. the riverian banks, adjoining village and grass land are rich sources of ethno medicinal plants. II. METERIALS AND METHODS Floristic surveys of different parts were conducted in different seasons for several days to document the ethno medicinal plants information. At the time of floristic survey, a questionnaire was made to collect the information with local peoples, farmers, and experienced healers of the areas. III. RESULTS AND DISCUSSION The detail studies of ethno medicinal plants and medicinal uses of their different parts in DM are given as follows:
Transcript of International Conference On Recent Trends In Engineering...

International Conference On Recent Trends In Engineering Science And Management ISBN: 978-81-931039-2-0
Jawaharlal Nehru University, Convention Center, New Delhi (India), 15 March 2015 www.conferenceworld.in
1000 | P a g e
ETHNOBOTANY STUDY OF SOME ETHNOMEDICINAL PLANTS OF GOPALGANJ USED
TO CURE DIABETES MELLITUS
Basant Narain Singh1, Surendra Kr.Prasad2, P.K.Singh3
1Department of Botany, SMD Degree College MN Jalalpur, Gopalganj JPU, Chapra, Bihar, (India) 2Deparment of Botany Magadh Mahila College, Patna University,Patna ,Bihar, (India)
3Yoga Therapist, Yogo Chiktsa Kendra, South of Gandak Colony, Nai Bazaar Chapra, (India)
ABSTRACT The Present paper deals with the enumeration of 15 Eethnomedicinal plants which are commonly used for the
treatment of a silent killer disease Diabetes Mellitus.
Keywords: Cure Diabetes, Diabetes Mellitus, Ethnmedicinal Plant, Gopalgnaj.
I. INTODUCTION
Since time immemorial human being using ethno medicinal plants as medicines. Our Rig veda stand to the
testimony. our anciant literature like Charak Samhita and Susruta Samhita provides detail information on ethno
medicinal plants (Devraj 1985, Sharma and Goswami, 1992). Ethno medicinal healing practices have been
widely accepted during our culture and environmental evolution. Which is acquiring a gigantic challenge.
Diabetes mellitus (DM) is defined as elevated blood glucose associated with absent or inadequate pancreatic
insulin secretion, with or without concurrent impairment of insulin action. The world wide prevalence of DM
has risen dramatically from an estimated 30 million cases in 1985 to 177 million in 2000 and based on the
current trends more than 360 million individuals will have diabetes by the year 2030. Now it is very imperative
to explore the values of ethno medicinal plants with special emphasis on plants used to cure DM.
Gopalganj a tarai belts of Nepal and lies between 260 12’- 260 39’ N latitude and 830 54’- 850 55’ East longitude.
The total geographical area covered by the district is 2033 squire Km and about 73 Feet above mean sea level.
The soil of the District is thick alluvium deposited by River Gandak and its ph ranges from 7-8.Climate is
tropical, Temperature ranges 40 C in winter to 400 C – 42 0 C in summer and rainfall is about 1170.90 mm. the
riverian banks, adjoining village and grass land are rich sources of ethno medicinal plants.
II. METERIALS AND METHODS
Floristic surveys of different parts were conducted in different seasons for several days to document the ethno
medicinal plants information. At the time of floristic survey, a questionnaire was made to collect the information
with local peoples, farmers, and experienced healers of the areas.
III. RESULTS AND DISCUSSION
The detail studies of ethno medicinal plants and medicinal uses of their different parts in DM are given as
follows:

International Conference On Recent Trends In Engineering Science And Management ISBN: 978-81-931039-2-0
Jawaharlal Nehru University, Convention Center, New Delhi (India), 15 March 2015 www.conferenceworld.in
1001 | P a g e
IV. ENUMERATION OF ETHNO MEDICINAL PLANTS
SL Botanical Name Local Name Family Parts used Method of uses
1 Aloe vera (L) burm.F. Ghekuwar Lilliaceae Pulp & juice
Its Juice 4-6 ounces daily before each meal.
2 Catharanthus roseus (L) Sadabahar Apocyanaceae Leaves Take 3-4 leaves daily at morning.
3. Trigonella foenumgraecum (linn)
Methi Fabaceae Seeds Seeds are grind and its powder 5gm thrice daily with milk.
4 Mangifera indica Linn Mango Anacardiaceae Tender Leaves
Its leaves can be dried in shade, powdered and taken 5gm twice a day.
5 Azadirachta indica (L) Neem Meliaceae Leaves . Tender leaves before breakfast used directly.
6 Momordica Charantia (L)
Karela Cucurbitaceae Fruits Fresh fruit juice & dry fruit powder 3-6 gm with water & honey.
7 Maduca butyraceae Mahua Sapotaceae Flowers Its flowers mixed with wheat flour & used as mahuwar.
8 Ficus bengalensis (L) Bargad Moraceae Roots & Prop roots
Roots bark & prop roots powder boil in 1/2 lit. water and when 1/8 part is rest used daily in the morning.
9 Cassia tora (L) Chakrawat Causalpiniaceae Roots 10gm roots boiled in 100ml water & when ¼ is rest used daily.
10 Syzygiun cuminii (L) Jammun Myrtaceae Seeds
3 mg to 1 gm seeds powder thrice daily.
Barks Its assess of barks is very beneficial
11 Aegle marmelos (Corr) Bel Rutaceae Leaves Its tender leaves with piper nigrum daily at morning.
12 Melia azedarch Linn Bakain Meliaceae Leaves extract
Tender leaves used directly
13 Saraka indica Sita ashok Caesalpiniaceae Dried flower
Dried flower powder
14 Trichosanthes cucumerina
Kunari Cucurpitaceae Roots Fresh juice daily at the morning.
15 Mucuna pruriens Kawachh Fabaceae Fruits, Leaves & Stem
10 to 20ml juice before breakfast
The districts has been blessed by nature with one of the richest vegetation of medicinal plants from which the
crude drugs can easily be procured .The above table shows 15 ethno medicinal plants species which are used
against a lethal disease of the world DM. These plants available from the different locally growing plants are not
reported to have any adverse effects. However, its pharmocognostical investigations are needed to making their
better and effective applications. The detailed study of these plants needs proper utilization, collection,
popularization, processing and conservation.

International Conference On Recent Trends In Engineering Science And Management ISBN: 978-81-931039-2-0
Jawaharlal Nehru University, Convention Center, New Delhi (India), 15 March 2015 www.conferenceworld.in
1002 | P a g e
V. ACKNOWLEDGEMENT
Authors are thankful to Prof. (DR) R. Bimal, university department of Botany, BRA Bihar University
Muzaffarpur for required guidance and Mr. Rajendra Prasad, assistant, agriculture officer Gopalganj for
required knowledge of this paper.
REFERENCES
[1] G. Gjerstad and T.Riner,current stutus of Aloe as a cure, All American Pharmacy, 140(2),1975
[2] G. Gates, My favorit plant, Aloe-vera, American Horti - Culture,54(5),1975
[3] B.N.Singh and Pankaj Kumar, Cultivation of medicinal Plants for Poverty Alleviation in contex of
Bihar,Recent Advances in Medicinal Plants and Thair cuttivation,Manglan Publication Delhi-
110053(India).2012.
[4] B.P. Pandey, Economic Botany (S.chand& Company Ltd. Ram Nagar New Delhi, 2006.)
[5] Acharya BALKrishna, Aurbed jaddi Butti Rahaya, Divya Prakashan, Haridwar-249408, 2008.
[6] Brahmvarchas, Ayurbed ka Pran: Vannousadhi Vigyan, Mathura 39-2006.
[7] H.K. Bakhra, Foods That Heal, The Natural way to Goods Health, orient Paperbacks, New Delhi-
110002,2010 .
[8] S.K. Jain, Medicinal Plants, National Book Trust India New,Delhi-10070,2005.
[9] H.K. Bakhru, Hearbs That Heal, Natural Remedies for Good Health, Orlent Paper Backs,
Delhi,110006,1998.
[10] M.M.S. Ahuja,Learning to live with Diabetes, National Books Trust, India, New Delhi-110070,1994.
[11] S.Suresh Babu and M.Madhavi, Green Remedies,Pustak Mahal, New Delhi-110020,2006.

International Conference On Recent Trends In Engineering Science And Management ISBN: 978-81-931039-2-0
Jawaharlal Nehru University, Convention Center, New Delhi (India), 15 March 2015 www.conferenceworld.in
1003 | P a g e
EFFECTIVE MEASUREMENT OF FREQUENCY AND VOLTAGE USING ANDROID OSCILLOSCOPE
Bhagyashree D.Hatwar1, Amol C.Wani2
1,2Electronics & Telecommunication Dept., S.S.B.T’s COET, Bambhori, Maharashtra, (India)
ABSTRACT
This paper discusses the methodology for proposed system named “Wireless Oscilloscope powered by Android”.
The purpose of designing this wireless oscilloscope is to provide an efficient integration and reliable applications
This paper presents the proposed design and implementation of a light-weight, low power, portable, low-cost, single-
channel oscilloscope consisting of a hardware device and a software application. The device is embedded with a
Bluetooth module to provide connectivity to a device with Bluetooth, running the Android operating system (OS), in
order to display the waveforms. Android OS is selected because there are a decent number of Android device users
and most of these devices satisfy the requirements of the oscilloscope’s software application. The hardware device
includes circuitry to capture the input voltage signals and an embedded Bluetooth module for transmitting the
captured signal information to an Android device for displaying the waveform. The Software application developed
for Android receives the data transmitted from the hardware device and plots the waveform according to the display
settings configured by the user. These display configurations are transmitted to the hardware device, once they are
set by the user, and are used by the hardware device to set the sampling rate and the values of samples. For optimal
use of the available bandwidth, the application provides one mode of operation, namely single channel mode where
only one of the waveform is displayed. The user can select a mode from the application, which in turn sends a
message to the microcontroller which then changes the sampling frequency accordingly a higher sampling rate for
single channel.
Keywords: Oscilloscope, HC05, Android, Bluetooth I. INTRODUCTION Portable oscilloscopes currently in the market are very expensive, less power efficient and have small low resolution
displays. This paper presents the design and implementation of a light-weight, low power, portable, low-cost, single-
channel oscilloscope consisting of a hardware device and a software application. The device is embedded with a
Bluetooth module to provide connectivity to a device with Bluetooth, running the Android operating system (OS), in
order to display the waveforms. Android OS is selected because there are a decent number of Android device users
and most of these devices satisfy the requirements of the oscilloscope’s software application. The hardware device
includes circuitry to capture the input voltage signals and an embedded Bluetooth module for transmitting the
captured signal information to an Android device for displaying the waveform. The Software application developed
for Android receives the data transmitted from the hardware device and plots the waveform according to the display

International Conference On Recent Trends In Engineering Science And Management ISBN: 978-81-931039-2-0
Jawaharlal Nehru University, Convention Center, New Delhi (India), 15 March 2015 www.conferenceworld.in
1004 | P a g e
settings configured by the user. These display configurations are transmitted to the hardware device, once they are
set by the user, and are used by the hardware device to set the sampling rate and the values of samples [1].
For optimal use of the available bandwidth, the application provides one mode of operation, namely single channel
mode where only one of the waveform is displayed. The user can select a mode from the application, which in turn
sends a message to the microcontroller which then changes the sampling frequency accordingly a higher sampling
rate for single channel.
II. OBJECTIVES AND GOALS Our Aim in this paper is to:
1. To design a system to measure the signals and display it wirelessly on an Android OS based phone.
2. To design a low cost and effective measuring device.
3. To make a handy and user-friendly application, this can be effectively used by students and researchers.
The Inputs given will be processed by an embedded system and will be transmitted via a wireless communication
protocol (in our case Bluetooth Module). A java based application will be developed on the Android OS platform
which will accept this incoming data and visualize the same.
III. REVIEW OF THE STATE OF ART The Oscilloscope which are available in market like CRO, DSO etc. are bulkier, not portable, consumes large
power. The main aim is to design such scope which is dual channel, low-cost, consumes less power and portable. In
reference [2], there is description of timeline history of Oscilloscope. It shows the life history of Oscilloscope from
CRT which used vacuum tubes up to the Oscilloscope which are available now. [3] Shows that there is
implementation of Oscilloscope on MATLAB using PC.So we increase the range of oscilloscope from hardware to
software. The Oscilloscope control with PC [4] shows two different oscilloscope control methods are presented.
The first method is the classic method to send the SCPI commands via RS232 serial interface. The second method is
to use the Lab VIEW divers. The first oscilloscope is the HAMEG HM407, which has its control program
implemented in MATLAB. The second oscilloscope is the NI PXI-5412 with the control program in Lab VIEW. [5]
Paper presents a commercial audio codec chip with USB interface is used to design an oscilloscope and AC
generator that may be used together with any personal computer without specific software drivers. The
implementation of an oscilloscope with Bluetooth was previously reported, by Yus in 2010 [6]. It is an open source
prototype project called the “Android Bluetooth Oscilloscope”, which consisted of a Bluetooth enabled transmitter
circuit to send data to an Android phone which draws the waveforms on its screen. The transmitter circuit uses
Microchip’s DSPIC33FJ16GS504 and an LMX9838 Bluetooth 2.0 SPP module. The maximum input voltage to the
circuit is +8 V to -8 V. However, there is no mention about the bandwidth of the device. Furthermore, it is stated
that the application had been tested only with a Samsung Galaxy GT-i5700 Spica (rooted Android 2.1 OS) phoned.
Also reference [10], describes three modes of operation of android oscilloscope: digital mode, logger mode and
function generator mode very effectively.
International Conference On Recent Trends In Engineering Science And Management ISBN: 978-81-931039-2-0
Jawaharlal Nehru University, Convention Center, New Delhi (India), 15 March 2015 www.conferenceworld.in
1005 | P a g e
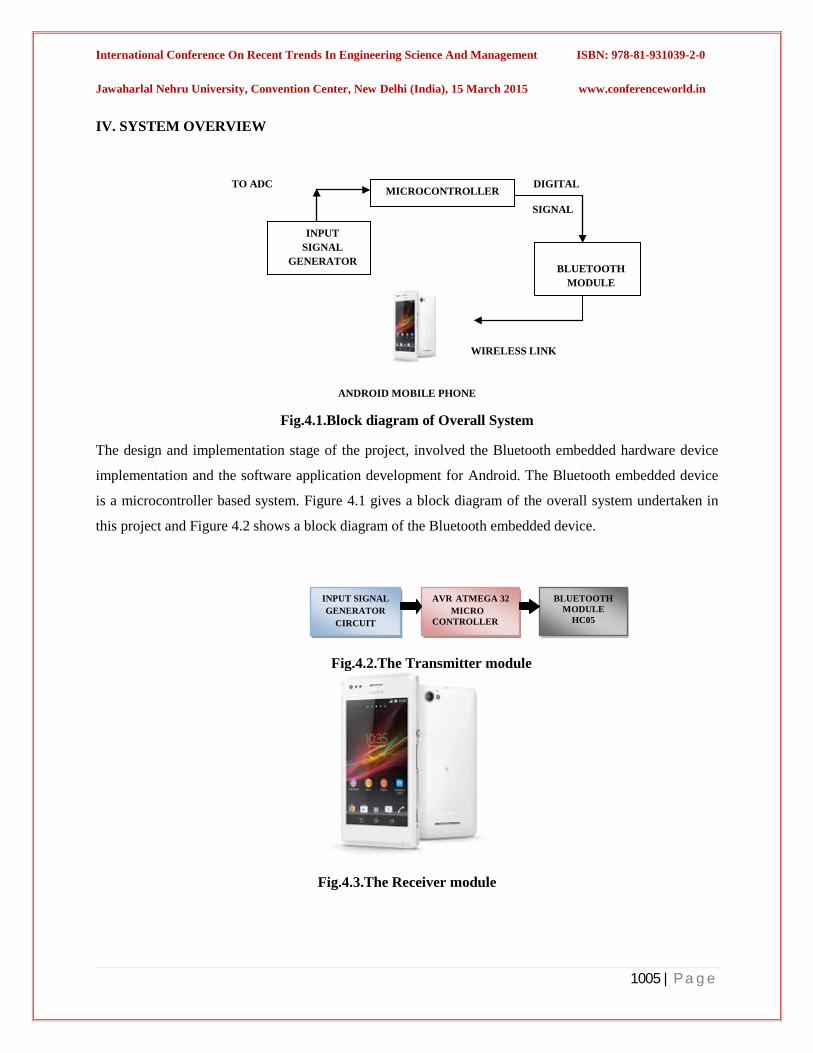
IV. SYSTEM OVERVIEW
TO ADC DIGITAL
SIGNAL
WIRELESS LINK
ANDROID MOBILE PHONE
Fig.4.1.Block diagram of Overall System
The design and implementation stage of the project, involved the Bluetooth embedded hardware device
implementation and the software application development for Android. The Bluetooth embedded device
is a microcontroller based system. Figure 4.1 gives a block diagram of the overall system undertaken in
this project and Figure 4.2 shows a block diagram of the Bluetooth embedded device.
Fig.4.2.The Transmitter module
Fig.4.3.The Receiver module
INPUT SIGNAL GENERATOR
CIRCUIT
AVR ATMEGA 32 MICRO CONTROLLER
BLUETOOTH MODULE
HC05
INPUT SIGNAL
GENERATOR
BLUETOOTH
MODULE
MICROCONTROLLER

International Conference On Recent Trends In Engineering Science And Management ISBN: 978-81-931039-2-0
Jawaharlal Nehru University, Convention Center, New Delhi (India), 15 March 2015 www.conferenceworld.in
1006 | P a g e
The receiver module consists of Android mobile. The android platform is selected because there are vast
applications available and, the Android application can be upgraded to provide more features without
doing changes to hardware, which helps to improve the device standards and user experience. V.HARDWARE DESIGN In this section we present the hardware description of the modules used for implementation of Bluetooth embedded wireless Android oscilloscope. 5.1 Bluetooth Module
Bluetooth Wireless technology is a short range communications technology intended to replace the cables
connecting portable or fixed devices. It transmits data via low power radio waves. Bluetooth technology has the
ability to handle both data and voice transmissions simultaneously. The key features of the Bluetooth technology are
robustness, low power, and low cost.
From research carried out it was found that data rates of 2 Mbps are not achievable with the existing software stacks
implemented on the module’s controller. Therefore, the approach suggested to fully utilize the Bluetooth bandwidth,
was to use the module in Host Controller Interface (HCI) mode [1].
Fig.5.1.shows the diagram of HC-05.The proper selection for our work is Bluetooth module HC05,because of
following features:
Table No.5.1.Bluetooth HC05 Specifications
Sr. No. Terminology Bluetooth HC05 1. Power consumption 100MW 2.
Lock in time on Battery Few Days
3. Range 10 meters 4. Data Rate 2 Mbps 5. Component cost Cheap
6. Topology Piconet of 8 devices, point to point
7. Security 128- bit AES 8. Connection time 3 seconds 9. Modulation FHSS 10. Frequency 2.4 GHz

International Conference On Recent Trends In Engineering Science And Management ISBN: 978-81-931039-2-0
Jawaharlal Nehru University, Convention Center, New Delhi (India), 15 March 2015 www.conferenceworld.in
1007 | P a g e
Fig.5.1.Diagram of HC-05[7]
Basic Specifications of the Bluetooth Embedded Device 1. Number of input channels: 2(Analog & digital)
2. Bandwidth: 1 KHz (single channel)
3. Input voltage range: 1V to 5V.
4.Samplingfrequency:5KHz(Single channel)
5. Provision to stop and start waveform.
6. Calibration of scale is done on android mobile.
5.2 Microcontroller Module A microcontroller would be essential to serve as the brain of our system by controlling all other IC’s. In our case, a
Microcontroller would be necessary to sample the input data and process it. Moreover it would also be required to
convert the data coming to data which follows UART protocol as majority of the Bluetooth have only UART ports.
Therefore we decided that any microcontroller we considered must have the following features.
For our work, we proposed to choose micro-controller AVR Atmega 32.Now following are the reasons of choosing
AVR micro-controller.
Table No. 5.2. Comparison between various controllers 89C51, PIC and AVR
PARAMETERS 8051 PIC AVR
ARCHITECTURE 8 bit based on CISC
8 bit based on RISC
8 bit based on RISC
INSTRUCTIONS
250 instructions which takes
1 to 4 cycles to execute
40 instructions which take 4
cycles to execute
131 instructions which takes 1
cycle to execute
ROM 64K 512 bytes EEPROM
64 bytes EEPROM
RAM 64K 1K internal 68 bytes data
TX (1) RX (2)
3.3V (12) GND (13)
LED (24)
KEY (26)

International Conference On Recent Trends In Engineering Science And Management ISBN: 978-81-931039-2-0
Jawaharlal Nehru University, Convention Center, New Delhi (India), 15 March 2015 www.conferenceworld.in
1008 | P a g e
SRAM RAM
SPEED FACTOR 1 million
instructions per second
3 million instructions per second
12 million instructions per
second POWER consumes
more power consumes less
power consumes less
power PROGRAMMING simple Complex Complex
PERIPHERAL
FEATURES less
available
SPI,I2C,ADC,USART,ISP,I
SA etc.
SPI,I2C,ADC,USART,ISP,ISA etc.
COST Low High High
VI. ANDROID SMARTPHONE The term “Android” has its origin in the Greek word andr-, meaning “man or male” and the suffix - eides, used to
mean “alike or of the species”. This together means as much as “being human”. Android is a software stack for
mobile devices which means a reference to a set of system programs or a set of application programs that form a
complete system. This software platform provides a foundation for applications just like a real working platform.
Fig.6.1. Android Architecture [9] VII. APPLICATION MODEL In Android’s application model [1], an application is a package of components, each of which can be instantiated
and run as necessary (possibly even by other applications).Components is of the following types:
1) Activity components form the basis of the user interface; usually, each window of the application is controlled by
some activity.
2) Service components run in the background, and remain active even if windows are switched. Services can expose
interfaces for communication with other applications.
3)Receiver components react asynchronously to messages from other applications.
4) Provider components store data relevant to the application, usually in a database. Such data can be shared across
applications.

International Conference On Recent Trends In Engineering Science And Management ISBN: 978-81-931039-2-0
Jawaharlal Nehru University, Convention Center, New Delhi (India), 15 March 2015 www.conferenceworld.in
1009 | P a g e
Important features integrated in Android. Android offers many features cover many areas such as application
development, internet, media and connectivity.Rich development environment including a device emulator, tools
for debugging, memory and performance profiling, and a plugin for the Eclipse IDE.
Now we are suppose to establish the connection between a Bluetooth based hardware and android phone. To
establish a connection between both devices we need to consider android device as a master slave and another
Bluetooth device as a slave to pair both devices. After establishing a connection we can send commands between
both devices and start operating and receiving data for Oscilloscope device. This device communication receives
data in continuous form through listeners events and collects received data into a vector form. Vector form is
required to prepare graph plot on GUI [9].
VIII.BUILDING AN ANDROID BLUETOOTH APPLICATION To develop an application we need to first install android software development tool.
8.1 New Project Wizard
The first step is to create a new project. Select the wizard for Android project, as shown below.
Fig.8.1. New project application window
The requirements for the application are:
• Name
• Location
• Package name
• Activity name
• Application name
8.2 New Working Set Window

International Conference On Recent Trends In Engineering Science And Management ISBN: 978-81-931039-2-0
Jawaharlal Nehru University, Convention Center, New Delhi (India), 15 March 2015 www.conferenceworld.in
1010 | P a g e
Fig.8.2. New working set window
This will create a default application ready to be built and run. The components may be seen in the Package
Explorer.
8.3 The Package Explorer
The Package Explorer (found in the Java perspective in Eclipse) displays all the components of the sample Android
application.
Fig.8.3.Package Explorer Window
src folder
Includes the package for the sample application, namely
com.example.bluetooth
R.java
The Android Developer Tools create this file automatically and represents the constants needed to access various
resources of the Android application.
bluetooth.java
Implementation of the application's primary activity class.
Referenced libraries
Contains android.jar, which is the Android runtime class jar file, found in the Android SDK.
res folder
Contains the resources for the application, including:

International Conference On Recent Trends In Engineering Science And Management ISBN: 978-81-931039-2-0
Jawaharlal Nehru University, Convention Center, New Delhi (India), 15 March 2015 www.conferenceworld.in
1011 | P a g e
• Icons
• Layout files
• Strings
AndriodManifest.xml
Deployment descriptor of the sample application.
8.4 The primary activity of the application
The sample application consists of a single activity, namely bluetooth. As described above, the bluetooth class is
implemented in the file bluetooth.java.
Fig.8.4. Primary activity of application
LAYOUT OF ANDROID OSCILLOSCOPE
Fig.8.5.Layout of Android Oscilloscope
IX.PERFORMANCE ANALYSIS

International Conference On Recent Trends In Engineering Science And Management ISBN: 978-81-931039-2-0
Jawaharlal Nehru University, Convention Center, New Delhi (India), 15 March 2015 www.conferenceworld.in
1012 | P a g e
A performance analysis is a technical investigation done to determine or validate the responsiveness, speed,
scalability, and stability characteristics of the product under test.
Table.No.9.1.PERFORMANCE ANALYSIS ON FREQUENCY MEASUREMENT
Sr.No. Range Of Frequencies
Readings Undertaken Measured on CRO
Measured on Mobile
1. 10Hz 10 Hz 9 Hz 2. 20Hz 20.83 Hz 22.70 Hz 3. 35Hz 35 Hz 34.5 Hz 4. 40Hz 41.67 Hz 42.30 Hz 5. 100Hz 100 Hz 99 Hz 6. 130Hz 131 Hz 132 Hz 7. 135Hz 138 Hz 134 Hz 8. 330Hz 333 Hz 325 Hz 9. 500Hz 500 Hz 500 Hz
10. 1KHz 1 KHz 1K Hz The basic aim is to just measure the frequency and voltage using android oscilloscope. Further implementation can
results into that our android oscilloscope can be exactly working like CRO with same features. Above table shows
the readings of CRO are approximately equal to that of Android oscilloscope.
X OUTPUT SCREENSHOTS 1. SQUARE WAVE SCREENSHOT
Fig.9.1.Square waveform on Android Oscilloscope
2. SAWTOOTH WAVE SCREENSHOT

International Conference On Recent Trends In Engineering Science And Management ISBN: 978-81-931039-2-0
Jawaharlal Nehru University, Convention Center, New Delhi (India), 15 March 2015 www.conferenceworld.in
1013 | P a g e
Fig.9.2.Sawtooth waveforms on Android Oscilloscope
3. SINE WAVE SCREENSHOT
Fig.9.3.Sine waveform on Android Oscilloscope XI.CONCLUSION AND FUTURE WORK The Android is an emerging technology in mobile platform. It is the software stack for mobile applications. Various
applications can be created by using Android. In this paper we are actually implementing one of the applications of
Android i.e., Oscilloscope. It is nothing but the Bluetooth embedded oscilloscope which sends the data towards
android mobile serially and waveform is plotted on display.
However, this Oscilloscope until now works only at 50Hz and 5V, but still further implementation may result into
increase its range just like CRO and DSO. We are actually focusing on idea of Oscilloscope on android mobile
which is portable, low-cost, less power consumption.
XII ACKNOWLEDGEMENT I, Bhagyashree D.Hatwar acknowledge with thanks the guidance received from my guide Amol C.Wani.The matter
taken from the various sources in preparing this paper has been duly cited in references.

International Conference On Recent Trends In Engineering Science And Management ISBN: 978-81-931039-2-0
Jawaharlal Nehru University, Convention Center, New Delhi (India), 15 March 2015 www.conferenceworld.in
1014 | P a g e
REFRENCES [1]“H.M.D.B.Seneviratne and K.N. Abhayasingh”,“Bluetooth Embedded Portable Oscilloscope” [SAITM – RSEA
2013].
[2]Kirsten Hogg, “Timeline of the development of the oscilloscope” School of Physics, The University of Sydney.
[3] “PC based Oscilloscope”, Electronics for You Magazine, December 2008.
[4] Roland Szabo, Aurel Gontean, Ioan Lie, and Mircea BabaiNa”Oscilloscope control with PC” International
Journal of computer and communication, Issue 3,volume 3,2009.
[5] Martin Jannus and Andres Udal “USB Audio Chip Based Oscilloscope and Signal Generator for Mobile
Laboratories”(June 2011).
[6]Yus “Android Bluetooth Oscilloscope” (2010, Sep. 23).
[7]HC Bluetooth module user datasheet.
[8] AVR Atmega 32 micro-controller module datasheet.
[9] Kalyani Ganvir and Hemant Waghmare, “Oscilloscope on Android Phone” IRAJ International Conference, 21
July 2013.
[10] Rajmane Sainath Bhagwanrao, Bahir Rahul Shivaji, Jeughale Shivam Sadashiv, Prof.Aher Vishal A,”Android
Based Wireless Electronics Workbench System”, IJETAE, Volume 4, Issue 3, March 2014.

International Conference On Recent Trends In Engineering Science And Management ISBN: 978-81-931039-2-0
Jawaharlal Nehru University, Convention Center, New Delhi (India), 15 March 2015 www.conferenceworld.in
1015 | P a g e
SURVEY ON DISCRIMINATION PREVENTION TECHNIQUES IN DATA MINING
Anju Sundaresan1, Lakshmi S2 PG Department of Computer Science and Engineering, University of Kerala, Sree Buddha College of
Engineering, Pattoor, Alappuzha, Kerala, (India)
Asst. Professor, Department of Computer Science and Engineering Sree Buddha College of
Engineering, Pattoor, Alappuzha, Kerala, (India)
ABSTRACT Extracting useful information hidden in large collection of data is known as data mining. Discrimination is a
very important issue when considering the legal and ethical aspects of data mining. Discrimination means
unfairly treating people on the basis of their cast , religion , gender etc. Discrimination can be either direct or
indirect To solve this problem there are some algorithm presented by various authors world wide. The main
goal of this survey paper is to understand the existing prevention technique .
Keywords: Data Mining, Discrimination, Privacy Preserving, Decision Tree, Rules.
I. INTRODUCTION
Data mining and knowledge discovery in databases are two new research areas that investigate the automatic
extraction of previously unknown patterns from large amounts of data. Data mining involves the extraction of
implicit previously unknown and potentially useful knowledge from large databases. Data mining is a very
challenging task since it involves building and using software that will manage, explore, summarize, model,
analyses and interpret large datasets in order to identify patterns abnormalities.
Discrimination is a very important issue when considering the legal and ethical aspects of data mining.
Discrimination can be viewed as the act of illegally treating people on the basis of their belonging to a specific
group. For instance, individuals may be discriminated because of their race, ideology, gender, etc. Especially
when those attributes are used for making decisions about them like giving them a job, loan, insurance, finance,
etc. Discovering such potential biases and eliminating them from the training data without harming their
decision-making utility is therefore highly desirable. For this basis, Antidiscrimination techniques including
discrimination discovery and prevention have been introduced in data mining.
Discrimination can be either direct or indirect. Direct discrimination consists of set of law or procedures that
explicitly mention minority or deprived groups based on sensitive discriminatory attributes related to their
membership on a specific group. Indirect discrimination consists of set of laws or procedures that, while not
clearly mentioning discriminatory attributes, deliberately or not deliberately could generate discriminatory
decisions. Redlining by financial institutions is an archetypal example of indirect discrimination.

International Conference On Recent Trends In Engineering Science And Management ISBN: 978-81-931039-2-0
Jawaharlal Nehru University, Convention Center, New Delhi (India), 15 March 2015 www.conferenceworld.in
1016 | P a g e
II. LITERATURE SURVEY
There are different methods proposed to avoid such discriminatory behavior in data mining. Those methods can
be analyzed and provide a limitations are given below.
2.1 Two Naïve Bayes Model In this method naive Bayes is modify for discrimination classification. Discrimination laws do not allow the use
of these rules of attributes such as gender, religion. Using decision rules that base their decision on these
attributes in classifier. The approaches are used in this paper Navies Bayes model, Latent variable model, and
Modified naives Bayes. The naives bayes model is A bayes classifier is a simple possibility classifier based on
applying bayes theorem with strong statistical independence assumption. Depending on precise nature of the
probability model, naive bayes classifiers can be trained very efficiently in supervised learning. A latent variable
model is a numerical model that relates a set of variables to set of latent variables. The responses on the
indicators or manifest variables are the results of an individual’s position on the latent variables. The modified
naive bayes is Modify the probability distribution p(s/c) of the sensitive attribute values s given the class values.
2.1.1 Result 2 naive Bayes models method has the lowest dependence on S, resulting in only about 5% discrimination if S is
removed. This is somewhat surprising since this model uses S to split the data and then learn two separate
models. It
appears that, these two separate models are good at estimating S from the other attributes A1,...,An. This method
performs best: it achieves high accuracy scores with zero, and has the smallest dependency on S.
2.1.2 Drawbacks The main drawback of this approach is not applicable for indirect discrimination and the accuracy of data could
be low, it cannot measure the utility rate of discrimination from the original data set.
2.2 Preferential Sampling Introduced the idea of Classification with No Discrimination (CND). We propose a new solution to the CND
problem by we introduce a Preferential Sampling (PS) scheme to make the dataset bias free. Instead, PS changes
the distribution of different data objects for a given data to make it
discrimination free. To identify the borderline objects , PS starts by learning a ranker on the training data. PS
uses this ranker to class the data objects of DP and PP in ascending order, and the objects of DN and PN in
descending order both with respect to the positive class probability. Such understanding of data objects makes
sure that the higher the rank an element occupies, the closer it is to the borderline.PS starts from the original
training dataset and iteratively duplicates and removes objects in the following way Decreasing the size of a
group is always done by removing the data objects closest to the borderline. Increasing the sample size is done
by duplication of the data object closest to the borderline.
PS works in the following steps:
(i) Divide the data objects into the four groups, DP,DN, PP, and PN.
(ii) Any ranking algorithm may be used for calculating the class probability of each data tuple. This ranking will
be used to identify the borderline data objects.
(iii) Calculate the expected size for each group to make the dataset bias free.
International Conference On Recent Trends In Engineering Science And Management ISBN: 978-81-931039-2-0
Jawaharlal Nehru University, Convention Center, New Delhi (India), 15 March 2015 www.conferenceworld.in
1017 | P a g e
(iv)Finally apply sampling with replacement to increase the size of DP and PN. And decrease the size of DN
and PP.
2.2.1 Result Classification with No Discrimination by Preferential Sampling is an excellent solution to the discrimination
problem. It gives promising results with both stable and unstable classifiers give more accurate results but do
not reduce the discrimination.
2.2.2 Drawbacks Low data utility rate and minimum discrimination removal.
This PS is also not applicable for Indirect discrimination.
2.3 Decision Tree Learning This approach in which the non-discriminatory constraint is pushed deeply into a decision tree learner by
changing its splitting criterion and pruning strategy by using a novel leaf relabeling approach. We propose the
following two techniques for incorporating discrimination awareness into the decision tree construction process:
Dependency-Aware Tree Construction: When evaluating the splitting criterion for a tree node, not only its
contribution to the accuracy, but also the level of dependency caused by this split is evaluated.
Leaf Relabeling: Normally, in a decision tree, the label of a leaf is determined by the majority class of the
tuples that belong to this node in t he training set. In leaf relabeling we change the label of selected leaves in
such a way that dependency is lowered with a minimal loss in accuracy.
2.3.1 Result This method gives high accuracy and low discrimination scores when applied to non-discriminatory test data. In
this scenario, our methods are the best choice, even if we are only concerned with accuracy. The enrichment in
discrimination reduction with the relabeling method is very satisfying. The relabeling methods out-perform the
baseline in almost all cases. As such it is reasonable to say that the straightforward solution is not satisfactory
and the use of dedicated discrimination-aware techniques is justified.
2.3.2 Drawbacks The result of this approach has mostly similar to the Naïve Bayesian Approach and it only concerned with
accuracy. Discrimination removal is very low using relabeling method.
2.4 Indirect Discrimination Prevention This Method regarding discrimination prevention is considering indirect discrimination other than direct
discrimination and another challenge is to find an optimal trade-off between anti-discrimination and usefulness
of the training data. The main contributions of this method are as follows: (1) a new pre-processing method for
indirect discrimination prevention based on data transformation that can consider several discriminatory
attributes and their combinations (2) some measures for evaluating the proposed method in terms of its success
in discrimination prevention and its impact on data quality. This solution is based on the fact that the dataset of
decision rules would be free of indirect discrimination if it contained no redlining rule.
Data Transformation Method for Indirect Discrimination:
Rule Protection
The indirect discriminatory measure to convert redlining rules into non-redlining rules, we should enforce the
following inequality for each redlining rule r: D, B→C in
International Conference On Recent Trends In Engineering Science And Management ISBN: 978-81-931039-2-0
Jawaharlal Nehru University, Convention Center, New Delhi (India), 15 March 2015 www.conferenceworld.in
1018 | P a g e
RR: elb (γ, δ )< α
In order to implement this data trans-formation method for indirect discrimination prevention, we simulate the
availability of a large set of background rules under the assumption that the dataset contains the discriminatory
items. The utility measures of indirect discrimination is same as the above preprocessing approach based on the
redlining rule dataset RR
2.4.1 Result The values of DDP and DPD achieves a high degree of indirect discrimination prevention in different cases. In
addition, the values of MC and GC demonstrate that this proposed solution incurs little information loss,
especially when α is not too small. By decreasing the value of α,the amount of redlining rules is increased,
which causes further data transformation to be done, there by increasing MC and GC.
2.4.2 Drawbacks The execution time of this algorithm increases linearly with the number of redlining rules and α-discriminatory
rules. This method is only deal with indirect discrimination and it cannot measure the direct discriminatory
items.
2.5 Direct and Indirect Discrimination Prevention Method This new technique applicable for direct or indirect discrimination prevention individually or both at the same
time and effective at removing direct and/or indirect discrimination biases in the original data set while
preserving data quality. This method can be described in terms of two phases:
Discrimination measurement- Direct and indirect discrimination discovery includes identifying α
discriminatory rules and redlining rules.
(i) Based on predetermined discriminatory items in DB, frequent classification rules in FR are divided in two
groups: PD and PND rules.
(ii) Direct discrimination is measured by identifying α- discriminatory rules among the PD rules using a direct
discrimination measure and a discriminatory threshold (α).
(iii) Indirect discrimination is measured by identifying redlining rules among the PND rules combined with
background knowledge, using an indirect discriminatory measure (elb), and a discriminatory threshold (α).
Data transformation- Transform the original data DB in such a way to remove direct and/or indirect
discriminatory biases, with minimum impact on the data and on legitimate decision rules, so that no unfair
decision rule can be mined from the transformed data.
2.5.1 Transformation Method The key problem of transforming data with minimum information loss to prevent at the same time both direct
and indirect discrimination. We will give a pre-processing solution to simultaneous direct and indirect
discrimination prevention. There are two transformation method used in both direct and indirect discrimination
removal.
(i) Direct Rule Production - In order to convert each α-discriminatory rule into a α-protective rule, based on the
direct discriminatory measure. elift (rˊ) <α
(ii) Indirect Rule Protection - In order to turn a redlining rule into an non-redlining rule, based on the indirect
discriminatory measure we should enforce the following inequality for each redlining ruler: D,BàCin RR: elb
(γ, δ ) < α These two data transformation method for used simultaneous direct and indirect discrimination
prevention.

International Conference On Recent Trends In Engineering Science And Management ISBN: 978-81-931039-2-0
Jawaharlal Nehru University, Convention Center, New Delhi (India), 15 March 2015 www.conferenceworld.in
1019 | P a g e
2.5.2 Utility Measures These techniques should be evaluated based on two aspects
· To measure the success of the method in removing all evidence of direct and/or indirect discrimination from
the original data set.
· To measure the impact of the method in terms of information loss
2.5.3 Drawbacks The main drawbacks of this method contain Low privacy assurance and Limited utility ratio of data. The
association of privacy is not analysed from the transformed dataset.
III. PROPOSED SOLUTION
The main negative impacts of data mining is discrimination and privacy. The privacy is connection with current
privacy models, like differential privacy. It will provide the high privacy rate. This method is integrated with the
previous existing method of direct and indirect discrimination prevention mechanism and to find synergies
between rule hiding for privacy preserving data mining and association rule hiding for discrimination removal.
Rule privacy is optimized with rule generalization mechanism. These methods provide the competent outcome
of removing the discrimination with high privacy rate.
IV. CONCLUSION
In this paper, we have completed a wide overview of the distinctive methodologies for discrimination
prevention for data mining. We discussed the issues and limitation of the recent state of the approaches. Based
on the same issues, we study an approach that uses transformation method. This approach helps to prevent direct
discrimination and indirect discrimination.
REFERENCES
[1] Sara Hajian and Josep Domingo-Ferrer, “A Methodology for Direct and Indirect Discrimination Prevention
in Data Mining”, IEEE Transactions On Knowledge And Data Engineering, Vol. 25, No. 7, July 2013.
[2] S. Hajian, J. Domingo-Ferrer, and A. Martı´nez-Balleste´, “Discrimination Prevention in Data Mining for
Intrusion and Crime Detection,” Proc. IEEE Symp. Computational Intelligence in Cyber Security (CICS
’11), pp. 47-54, 2011.
[3] S. Hajian, J. Domingo-Ferrer, and A. Martı´nez-Balleste´, “Rule Protection for Indirect Discrimination
Prevention in Data Mining,” Proc. Eighth Int’l Conf. Modelling Decisions for Artificial Intelligence (MDAI
’11), pp. 211-222, and 2011.
[4] T. Calders and S. Verwer, “Three Naive Bayes Approaches for Discrimination-Free Classification,” Data
Mining and Knowledge Discovery, vol. 21, no. 2, pp. 277-292, 2010.
[5] F. Kamiran and T. Calders, “Classification with no Discrimination by Preferential Sampling,” Proc. 19th
Machine Learning Conf. Belgium and The Netherlands, 2010.

International Conference On Recent Trends In Engineering Science And Management ISBN: 978-81-931039-2-0
Jawaharlal Nehru University, Convention Center, New Delhi (India), 15 March 2015 www.conferenceworld.in
1020 | P a g e
EXHAUST EMISSION EVALUATION OF COPPER COATED DIESEL ENGINE
D. C. Gosai1, Dr. H. J. Nagarsheth2
1Mechanical engineering Department, SVMIT, Bharuch, Gujarat, (India) 2Mechanical engineering Department, SVNIT, Surat, Gujarat, (India)
ABSTRACT
To meet the present requirement of the automotive industries there is continues research to improve
performance, exhaust emission and life of the internal combustion (I.C.) engine. Automotive industries are
constantly apply the effort on reduce fuel consumption and reduce exhaust emission. Thermal barrier ceramic
coating material use for to reduce the heat loss of IC engine. The concept low heat rejection engine (LHRE)
with bimetallic copper coating, which improves break power and reduces exhaust emission of IC engine. [1-3]
The present investigation has been made to study mainly emission characteristics of copper coated diesel
engine. An experimental investigation is carried out on twin cylinder, water cool, 1500 RPM constant speed
type vertical diesel engine. The cylinder heads surfaces, engine pistons top surfaces and engine valves surfaces
are coated with copper material by electroplating processes with 100 microns thickness. The diesel engine
combustion chamber inner walls insulated by electroplating copper coating. The exhaust emissions were
compared with base engine and without copper coated diesel engine. The results strongly indicate that
improvement of exhaust emission. It is observed that the reduction in NOx and smoke level for Copper catalyst
coated combustion chamber. It is also indicate that to change the coating technology for better life of copper
coating.
I. INTRODUCTION
Air pollution means the presence of one or more contaminates in the atmosphere such as dust, gas fumes, mist
odour, smoke or vapor which causes injuries to human, plant, animal like. The main pollutants can contributed
by the internal combustion engines were carbon monoxide (CO), carbon dioxide (CO2) unburned hydrocarbons
(HC), oxide of nitrogen (NOx), smoke density and particulate. Hence it is necessary to control the emission
from I.C. Engine. In the present investigation, has been made to study emission characteristics of a diesel engine
with the use of electroplating copper coated combustion chamber. Thus attempt has been to study the emission
control from direct injection diesel engine using catalyst coated piston. Materials such as copper, nickel, zinc,
chromium and cadmium have been used as catalyst. [4-8]
II. THEORY OF CATALYST CHARGE ACTIVATION
In conventional combustion systems, the control is maintained by manipulating with gas temperature,
equivalence ratio and fluid mixing. Introducing catalyst surface in to a combustible environment supplies as
additional control parameter, namely the surface reaction rate. This can be adjusted in a manner bellows a
critical surface temperature. Above this temperature the reaction rate increase dramatically and the chemistry of
the nearby gas phase can be modified. In the case of platinum catalyst, the surface ignition temperature is 300-

International Conference On Recent Trends In Engineering Science And Management ISBN: 978-81-931039-2-0
Jawaharlal Nehru University, Convention Center, New Delhi (India), 15 March 2015 www.conferenceworld.in
1021 | P a g e
400 oC less than the corresponding gas phase ignition temperature, the ambient gas temperature, which directly
controls the catalyst reaction rate; it is possible to catalytically treat homogenous mixtures, which are below the
surface ignition temperature. In the internal combustion engine, this means that the onset of catalytic activity
does not depend on the compression temperature. [4, 9-12]
III. ELECTROPLATING COATING
Electroplating is the application of a metal coating to a metallic or other conducting surface by an
electrochemical process. The article to be plated (the work) is made the cathode (negative electrode) of an
electrolysis cell through which a direct electric current is passed. The article is immersed in an aqueous solution
(the bath) containing the required metal in an oxidized form, either as an equated action or as a complex ion.
The anode is usually a bar of the metal being plated. During electrolysis metal is deposited on to the work and
metal from the bar dissolves. Copper Coating Specification mention as below.
Table 1: Electro plating of Copper Coating Specification
Coated Material : Copper
Coating thickness : 400 Microns
Power required : 12.5 KW
Voltage : 50 V
D. C. Current : 100 Amp.
Process time : 90 mins full dipped
Table 2: Properties of Copper
Properties
Name, symbol, number copper, Cu, 29
Density (near r.t.) 8.96 g·cm−3
Melting point 1357.77 K, 1084.62 °C, 1984.32 °F
Boiling point 2835 K, 2562 °C, 4643 °F
Heat of fusion 13.26 kJ·mol−1
Heat of vaporization 300.4 kJ·mol−1
Thermal conductivity 401 W·m−1·K−1
Thermal expansion 25 °C) 16.5 µm·m−1·K−1
Poisson ratio 0.34
Brinell hardness 369 mpa

International Conference On Recent Trends In Engineering Science And Management ISBN: 978-81-931039-2-0
Jawaharlal Nehru University, Convention Center, New Delhi (India), 15 March 2015 www.conferenceworld.in
1022 | P a g e
Fig
ure 1: Electroplating Process
IV. EXPERIMENTAL PROCEDURE
The experiments were carried out on a vertical twin cylinder water cool DI diesel engine. The engine was
converted in to a catalyst-coated engine coating copper, on the pistons bowl, engine heads, and engine valves
surfaces. Different experiments were carried out with base engine without copper coating and along with the
copper coated combustion chamber. The overall coating thickness is 400 microns.
The engine was coupled to a generator and electrical load bank was applied through resistance used to measure
the power output at constant engine speed. The engine is instrumented to measured parameters like fuel
consumption, load, speed of engine, cooling water temperature, inlet air and exhaust gas temperature etc. The

International Conference On Recent Trends In Engineering Science And Management ISBN: 978-81-931039-2-0
Jawaharlal Nehru University, Convention Center, New Delhi (India), 15 March 2015 www.conferenceworld.in
1023 | P a g e
NOx level is measured by using NOx analyzer. Smoke is measured by using smoke density meter. Experiments
were conducted at constant speed with various loads to determine the emission parameters. In this study the
effect of copper coating on emission were measured with multi gas analyzer and smoke meter and same also
were measured for base engine.
4.1 Engine Data Table 3: Engine Specification
Engine type : Multi cylinder vertical water cooled self-governed constant speed diesel engine
Injection pressure = 200bar I.V.O= 5° BTDC
Piston dia = 80 mm I.V.C = 35° ABDC
Compression ratio = 16 E.V.O = 35° BBDC
Power = 7.5 kw = 10 HP E.V.C = 5° ATDC
Lubrication oil = 20w/40. Injection timing = 23° BTDC
Lubrication oil required = 7 litrs Mass flow rate of cooling water = 0.25
litr/sec
Dynamometer = 12 KVA A/F ratio = 14.8 : 1
Speed (N) = 1500rpm BMEP = 15 kg/cm2
Rated power = 7.35 kw Calorific value = 42000 kjg/kg k
Figure 3: The Block Diagram of Experimental Set-Up
V. RESULT AND DISCUSSION
5.1 Specific Fuel Consumption (SFC) The variation of specific fuel consumption was higher at no load than full load conditions which shown in figure
for without copper coated engine and with copper coated engine. The SFC of with copper coated engine has
shown little improvement fuel consumption at almost all load conditions. There is no much more effect on SFC
of copper coated engine because it is coated by electroplating. The copper coating is worn out after certain
operation of the engine.

International Conference On Recent Trends In Engineering Science And Management ISBN: 978-81-931039-2-0
Jawaharlal Nehru University, Convention Center, New Delhi (India), 15 March 2015 www.conferenceworld.in
1024 | P a g e
Figure 4: Comparisons of Brake Power (BP) V/S SFC
Figure 5: BP V/S Smoke Density
5.2 Smoke Density Graph shows the variation of smoke level with brake power of the engine for copper coated engine and base
engine. It is observed from the figure that the smoke level increase with increase in load in all load conditions.
There is little decreasing in smoke level in all load conditions of copper coated engine. At full load condition
smoke density level is decrease about 2 % to 3.33. %. The smoke emissions of copper coated engine were
comparatively lesser than the Base engine. It was found that from the results the thin copper coating reduced the
smoke emissions for all the configuration of the engine. This was due to higher gas temperatures and
enhancement in oxidation, which resulted in reduction of soot particles.
Figure 6: Brake Power V/S Carbon Monoxide
Figure 7: Brake Power V/S Carbon Dioxide

International Conference On Recent Trends In Engineering Science And Management ISBN: 978-81-931039-2-0
Jawaharlal Nehru University, Convention Center, New Delhi (India), 15 March 2015 www.conferenceworld.in
1025 | P a g e
Figure 8: Brake Power V/S Oxygen
Figure 9: Brake Power V/S Hydro Carbon
5.3 Emission Test It is seen that from all graph of emission increase with increase in brake power with maximum emission occurs
at maximum load condition in both the engine. Carbon monoxide (CO) a colourless, odourless, poisonous gas is
generated in engines which nearly remain same in copper coated and base engine. In case of carbon dioxides
(CO2) were also exhausted remain nearly same in both type of engine. But slightly positive result observed in
case of unborn hydro carbon (HC). HC reduced almost at all load condition in case of copper coating compare
to base engine. Unburned hydro carbons reduce by 1% to 9.1% that shows better combustion due to copper
coating in combustion chamber. Oxygen level O2 found nearly same as base engine.
Figure 10: Brake Power V/S Nitrogen Oxide
5.4 Nitrogen Oxide (Nox) Chart shows the variation of NOX in the exhaust with brake power for copper and Base engine. It is increased in
all load condition for both engine conditions. It is observed that the NOX level decreased in with copper coated
engine with increase in load at all load conditions. At no load condition in case of copper coated engine NOx is
decreased by 2.77%, at rated power load condition it is reduced by 20.31% and it is also reduce at over load
condition by 7.78%. These results were due to copper coating in combustion & chemical reaction accrued at
higher operating temperature.
International Conference On Recent Trends In Engineering Science And Management ISBN: 978-81-931039-2-0
Jawaharlal Nehru University, Convention Center, New Delhi (India), 15 March 2015 www.conferenceworld.in
1026 | P a g e
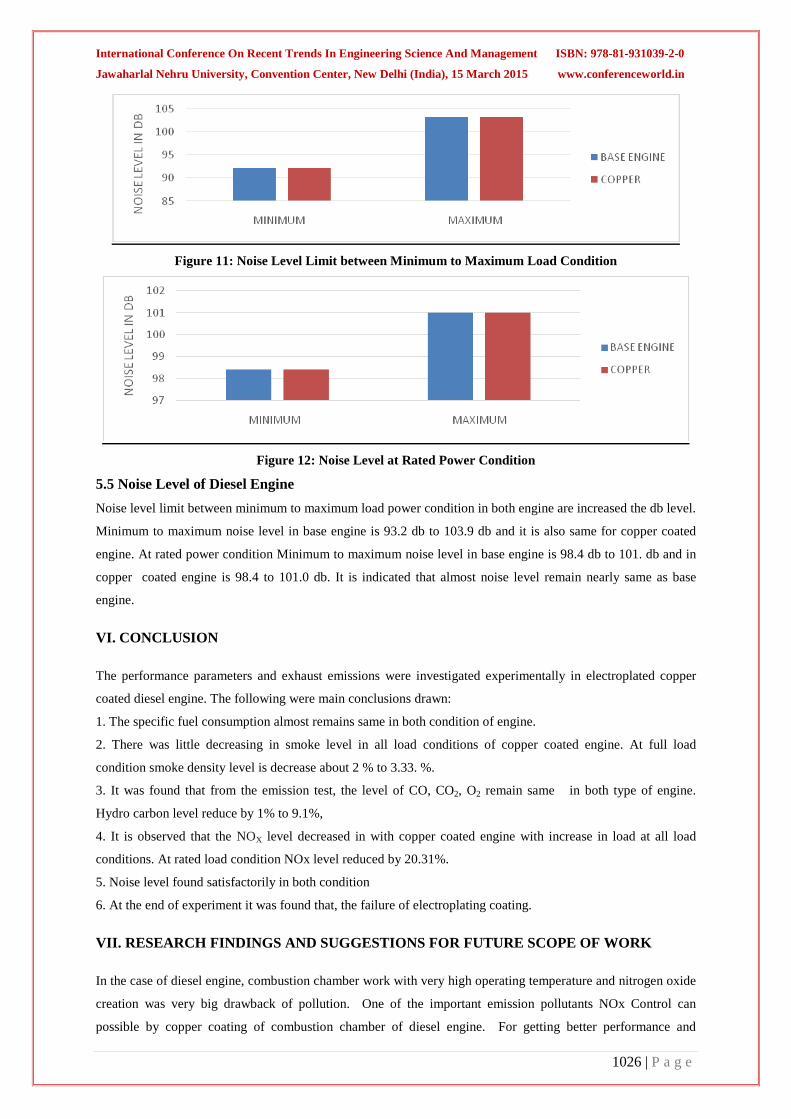
Figure 11: Noise Level Limit between Minimum to Maximum Load Condition
Figure 12: Noise Level at Rated Power Condition
5.5 Noise Level of Diesel Engine Noise level limit between minimum to maximum load power condition in both engine are increased the db level.
Minimum to maximum noise level in base engine is 93.2 db to 103.9 db and it is also same for copper coated
engine. At rated power condition Minimum to maximum noise level in base engine is 98.4 db to 101. db and in
copper coated engine is 98.4 to 101.0 db. It is indicated that almost noise level remain nearly same as base
engine.
VI. CONCLUSION
The performance parameters and exhaust emissions were investigated experimentally in electroplated copper
coated diesel engine. The following were main conclusions drawn:
1. The specific fuel consumption almost remains same in both condition of engine.
2. There was little decreasing in smoke level in all load conditions of copper coated engine. At full load
condition smoke density level is decrease about 2 % to 3.33. %.
3. It was found that from the emission test, the level of CO, CO2, O2 remain same in both type of engine.
Hydro carbon level reduce by 1% to 9.1%,
4. It is observed that the NOX level decreased in with copper coated engine with increase in load at all load
conditions. At rated load condition NOx level reduced by 20.31%.
5. Noise level found satisfactorily in both condition
6. At the end of experiment it was found that, the failure of electroplating coating.
VII. RESEARCH FINDINGS AND SUGGESTIONS FOR FUTURE SCOPE OF WORK
In the case of diesel engine, combustion chamber work with very high operating temperature and nitrogen oxide
creation was very big drawback of pollution. One of the important emission pollutants NOx Control can
possible by copper coating of combustion chamber of diesel engine. For getting better performance and
International Conference On Recent Trends In Engineering Science And Management ISBN: 978-81-931039-2-0
Jawaharlal Nehru University, Convention Center, New Delhi (India), 15 March 2015 www.conferenceworld.in
1027 | P a g e
emission control in direct injection diesel engine using bimetal catalyst coated and thermal barrier ceramic
coated combustion chamber materials can use, such as copper, nickel, zinc, chromium, aluminums oxide and
cadmium have been used as catalyst. It was also found that for getting coating life plasma spray coating
technology can be use.
VIII. ACKNOWLEDGEMENT
The author would like to express gratitude to Dr.H. J. Nagarsheth, Head & Professor, Department of Mechanical
Engineering, S.V.N.I.T. Surat, and India for providing necessary guidance. I greatly acknowledged by All India
Council for Technical Education, New Delhi for providing financial support.
REFERENCES
[1] Modi, A. J., Experimental Study of Energy Balance in Low Heat Rejection Diesel Engine, SAE Technical
Paper 2012, 2012-01-0389, doi:10.4271/2012-01-0389.
[2] Modi A. J., Gosai D.C., Experimental Analysis of Performance of Low Heat Rejection (LHR) Diesel
Engine, International Journal of Advances in Thermal Science and Engineering, June 2010, Vol. 1 (1),
pp.17-25.
[3] J. B. Heywood, Internal combustion engine fundamentals, (New York, Mcgraw-Hill, 1988).
[4] S. Narasimha Kumar, Experimental investigation of two stroke copper coated spark ignition engine
withgasoline and gasohol, International Journal of emerging Science and Engineering, ISSN:2319-6378,
March 2014, Vol. 2, Issue-5, pp.1-7.
[5] Ch.Kesava Reddy, Control of oxides of nitrogen emissions from high grade low heat rejection diesel
engine with crude pongamia oil by catalytic reduction, IJASETR, ISSN:1839-7239, April-2014, Vol.1,
Issue-2, pp.10-25.
[6] Md. Nurun Nabi., Theorital investigation of engine thermal efficiency, adiabatic flame temperature, NOx
emission and combustion related parameters for different oxygenated fuels , Applied thermal
engineering,30, 2010, pp839-844.
[7] Adnan Parlak, The effect of injection timing on NOx emissions of low heat rejection diesel injection
engine, applied thermal engineering, 25, 2005, pp3042-3052.
[8] Ekren Buyukkaya, Muhammet Cerit, Experimental study of NOx emission and injection timing of a low
heat rejection diesel engine, International Journal of thermal science,47, 2008, pp1096-11106.
[9] Dr. Ibtihan Al-Namie, Study the effect of ceramic coating on the performance and emission of diesel
engine, Journal of engineering,Number 8, august 2012, Vol.18,pp935-942.
[10] P.N. Shrirao, A.N.Power, Evaluation of performance and emission characteristics of turbocharged diesel
engine with mullite as thermal barrier coating, International Journal of Engineering and technology,3,
2011, Vol. 3,pp256-265.
[11] Ganapathi, Performance evaluation of ceramic coated with air insulated four stroke diesel engines,
International Journal of current Engineering and technology, No.5, Vol. 3, December 2013, pp1858-1862.
[12] Murthy P.V.K., Performance Evaluation of Low heat rejection diesel engine with pure diesel, International
Journal of applied Engineering research dindigul,3, Vol. 1, 2010, pp428-451.
International Conference On Recent Trends In Engineering Science And Management ISBN: 978-81-931039-2-0
Jawaharlal Nehru University, Convention Center, New Delhi (India), 15 March 2015 www.conferenceworld.in
1028 | P a g e
BALANCED ENERGY UTILIZATION USING EDOCR PROTOCOL IN WIRELESS SENSOR NETWORKS
Pooja Raj H.R1, Hanumanthappa.S2, Dr.Y.P.Gowramma3 1Mtech 4th Sem, 2Asst. Proff of IS &E, 3Proff & H.O.D of CS &E
Kalpataru Institute of Technology, Tiptur, Karnataka, (India)
ABSTRACT Energy management is one in every of the crucial parameters in Wireless detector Networks. during this paper
we have a tendency to try for an answer to balance the energy usage for maximizing the network period of time,
increase the packet delivery magnitude relation and output. Our planned algorithmic rule is predicated on
Energy Density of the clusters in Wireless detector Networks. The cluster head is chosen victimization 2 step
technique and on-demand routing approach to calculate the balanced energy shortest path from supply to sink.
This distinctive approach maintains the balanced energy utilization among all nodes by choosing the various
cluster heads dynamically. Our simulation results have compared with one in every of the plain routing theme
(EBRP) and cluster based mostly routing (TSCHS), that shows the many enhancements in minimizing the delay
and energy utilization and maximizing the network period of time and output with regard to these works.
Index Terms: Balanced Energy Shortest Path, Cluster, Network Lifetime, Wireless Sensor
Network (WSN).
I. INTRODUCTION
Wireless sensor Networks(WSNs) square measure employed in varied applications like Traffic management,
Battle field police work, Environmental observation, Health care systems, Underwater applications and etc.,
Energy utilization is one in all the many parameter for battery powered wireless sensing element networks. It is
essential to scale back energy consumption altogether the sensing element nodes to extend the network lifespan .
In WSNs, the nodes encompassing the sink have tendency to empty their energy presently compared to the
nodes removed from the sink and such irregular energy drain can decrease the network lifespan . Unbalanced
energy utilization will cause network partition despite the fact that several of the nodes might have most residual
energy that square measure removed from the sink . Thus, it is necessary that each node ought to consume
energy equally so as to extend the lifespan of the network.
Energy potency and balanced energy utilization square measure 2 completely different aspects. Shortest path
routing uses energy with efficiency however might not lead to balanced energy utilization. Topology,
Applications and Routing protocols square measure main causes for unbalanced energy utilization. However,
eventually variety of solutions square measure projected by several of the routing protocols resembling :
optimum readying of sensing element nodes relative to applications , Organization of dynamic Topology of
nodes supported transmission power necessities , the readying of Mobile sinks or Relay nodes and economical
information aggregation techniques to manage uniform energy utilization across all nodes within the network.
International Conference On Recent Trends In Engineering Science And Management ISBN: 978-81-931039-2-0
Jawaharlal Nehru University, Convention Center, New Delhi (India), 15 March 2015 www.conferenceworld.in
1029 | P a g e
1.1 Motivation Wireless device Networks square measure battery powered and thence the scarce energy could be a crucial and
desires to be used effectively and efficiently. The goal of the WSNs is to increase its life and maximize its
production. In earlier works, cluster based routing protocols have used totally completely different parameters
love residual energy, distance from cluster head to the lowest station, etc to elect the cluster head. The cluster
head drains out energy faster than all completely different nodes at intervals the cluster. and extra over density
of clusters may vary at intervals the network. thence it\\\'s quiet necessary to ponder residual energy of all the
nodes at intervals the cluster adoptively. to boot, the density of nodes in an exceedingly very cluster plays the
essential role in overall average energy of the cluster, a parameter that has got to be computed for the
disconnection of the cluster resulting in the partition of the network. There ought to be a mechanism that permits
uniform utilization of energy across all nodes at intervals the cluster. And equally as use those nodes in
conjunction with a gaggle of shut nodes with higher residual energy as cluster head to increase the life and
minimize the production at intervals the network.
1.2 Contribution We have designed a cluster primarily based routing protocol to utilize energy with efficiency and effectively
among all the nodes terribly very given cluster. The cluster head is chosen supported two parameters (i) the
residual energy (ii) energy density of a given node. The energy density of each node relies on the relation of add
of the residual energy of the neighbor nodes(including itself) and so distance from the native cluster head and
coverage space. On-demand routing is employed through the cluster head to urge the balanced energy shortest
path. This approach consumes lower energy and utilizes energy uniformly across all nodes among the complete
network resulting in increasing period and output.
1.3 Background Most of the present energy economical routing protocols forward the packets solely through minimum energy
path to reduce the energy consumption. however it causes AN unbalanced distribution of residual energy within
the network and leads to early network partition.
So as to beat this downside the Energy Balanced Routing Protocol (EBRP) is meant by constructing a mixed
virtual potential field in terms of depth, residual energy and energy density. the most goal of this system is to
force the packet to sent through the a lot of energy dense space towards the sink, so it will shield the nodes with
comparatively low residual energy. This protocol has significantly improved network time period, coverage
quantitative relation and turnout. however it will solely realize the route from every supply node to a typical sink
and conjointly needs to investigate the dynamics of time-varying potential field. any it is necessary to visualize
the process issues to enhance the integrated performance of the complete network.
Cluster Head choice (TSCHS) is planned to avoid the cluster head variety variability downside of the LEACH
protocol. Here, the cluster head is chosen in 2 completely different stages. within the 1st stage, the temporary
cluster heads is hand-picked and therefore the numbers of cluster heads is over optimum price. within the
second stage, the optimum variety of cluster heads is chosen supported the residual energy and therefore the
distance to the bottom station. Finally, the temporary cluster heads is replaced with optimum price. Thus, the
network energy load is a lot of balanced and prolongs the network time period. In our work, we've known the
cluster head supported energy density, residual energy and distance. This methodology effectively balances the
energy utilization, prolongs the network time period and maximizes the turnout.

International Conference On Recent Trends In Engineering Science And Management ISBN: 978-81-931039-2-0
Jawaharlal Nehru University, Convention Center, New Delhi (India), 15 March 2015 www.conferenceworld.in
1030 | P a g e
II. RELATED WORK
This section presents a quick outline of connected works. "Joint quality and Routing for life Elongation in
Wireless sensing element Networks" [1] says that though several energy efficient/conserving routing protocols
are planned for wireless sensing element networks, the concentration of information traffic towards a tiny low
variety of base stations remains a serious threat to the network life. the most reason is that the sensing element
nodes settled close to a base station got to relay information for an oversized a part of the network and therefore
eat their batteries terribly quickly. the answer he provides during this paper suggests that the bottom station be
mobile; during this manner, the nodes settled near to it modification over time. information assortment protocols
will then be optimized by taking each base station quality and multi-hop routing into consideration.
“Geography-Informed Energy Conservation for Ad- Hoc Routing,” [2] proposes a geographical reconciling
fidelity(GAF) rule that reduces energy consumption in impromptu wireless networks. This rule conserves
energy by distinguishing nodes that area unit equivalent from a routing perspective and so running off surplus
nodes, keeping a continuing level of routing fidelity. GAF moderates this policy victimization application- and
system-level information; nodes that supply or sink knowledge stay on and intermediate nodes monitor and
balance energy use. it is freelance of the underlying impromptu routing protocol.
"Energy-Optimal And Energy-Balanced Sorting during a Single-Hop Wireless detector Networ" [3] concentrate
on style of an energy-balanced, energy-optimal algorithmic program for sorting during a single-hop detector
network. Energy optimality implies that the general energy dissipation within the system is reduced. Energy-
balancedness ensures that everyone the sensors pay asymptotically equivalent quantity of energy within the
system. Uniform energy dissipation is fascinating because it permits the network to stay absolutely practical for
the utmost time.
“Energy Aware Routing for Low Energy circumstantial device Networks,” [4] proposes a read that perpetually
use lowest energy methods which will not be optimum from the purpose of read of network period and long
property. To optimize these measures, we have a tendency to propose a brand new theme known as energy
aware routing that uses sub-optimal methods sometimes to produce substantial gains. Simulation results are
given that show increase in network lifetimes of up to four-hundredth over comparable schemes like directed
diffusion routing. Nodes additionally burn energy during a additional equitable approach across the network
making certain a additional swish degradation of service with time.
“Spatial Energy equalization through Proactive Multipath Routing in Wireless Multihop Networks,” [5]
investigates the employment of proactive multipath routing to attain energy-efficient operation of impromptu
wireless networks. the main focus is on optimizing tradeoffs between the energy value of spreading traffic and
therefore the improved spatial balance of energy burdens. He propose an easy theme for multipath routing
supported spatial relationships among nodes. Then, combining random geometric and queuing models, he
develop a time model for such networks, allowing associate degree analysis of various kinds of eventualities,
i.e., with and while not energy replenishing and storage capabilities. He propose a parameterized family of
energy equalization ways and study the spatial distributions of energy burdens supported their associated
second-order statistics.
“Energy economical agglomeration and Cluster Head Rotation theme for Wireless detector Networks,” [6]
propose a location based mostly protocol for WSN- supporting an energy economical agglomeration, cluster
head selection/rotation and information routing methodology to prolong the period of detector network. planned
agglomeration protocol ensures balanced size cluster formation inside the sensing field with least variety of

International Conference On Recent Trends In Engineering Science And Management ISBN: 978-81-931039-2-0
Jawaharlal Nehru University, Convention Center, New Delhi (India), 15 March 2015 www.conferenceworld.in
1031 | P a g e
transmit-receive operations. Cluster head rotation protocol ensures balanced dissipation of node energy despite
the non-uniform energy necessities of cluster head and detector nodes in a very cluster. The cluster head rotation
protocol has been planned to realize the balanced energy consumption among the nodes inside the cluster
therefore prolonging the period of network Simulation results demonstrate that planned protocol prolongs
network period because of the employment of economical agglomeration, cluster head selection/rotation and
information routing.
III. EXISTING SYSTEM
Leach is that the existing answer. Its operation contains 2 stages: initial stage and stable stage. within the initial
stage, the bottom station selects variety of nodes as cluster heads supported random thresholds. All alternative
nodes be a part of their close clusters by causing out signals and see the nearest cluster heads. once clusters
square measure fashioned, the wireless device network goes into a stable stage. every node starts to gather and
transmit knowledge to its cluster head, and also the cluster head forward these knowledge to the bottom station
in conjunction with their own collected knowledge.
IV. PROPOSED SYSTEM
The projected answer adopts the high-energy-first technique to pick cluster heads in every spherical to remedy
this downside. once collection knowledge, every device node must send knowledge along with the knowledge
concerning its remaining wattage, and so the bottom station will decide that nodes area unit to be elect as cluster
heads within the next spherical victimization broadcast messages.
V. SYSTEM DESIGN
5.1 Mathematical Model and Architecture The projected model for EDOCR protocol is illustrated as shown within the Fig5.1. The system design is split
into 5 totally different phases. Within the 1st section, nodes square measure deployed every which way to form
a network. The second section involves cluster formation whereas the third section generates the cluster head
supported residual energy and energy density. On-Demand Shortest Path (ODSP) is employed within the fourth
section supported the depth calculation. The fifth section represents forwarding the packet from the supply to the
sink through the shortest path. The inputs to our system model square measure every which way deployed
nodes. Here the cluster head choice section and On-Demand Shortest Path (ODSP) square measure the 2 crucial
phases. the subsequent sub section describes the mathematical model and also the totally different modules of
the system design.
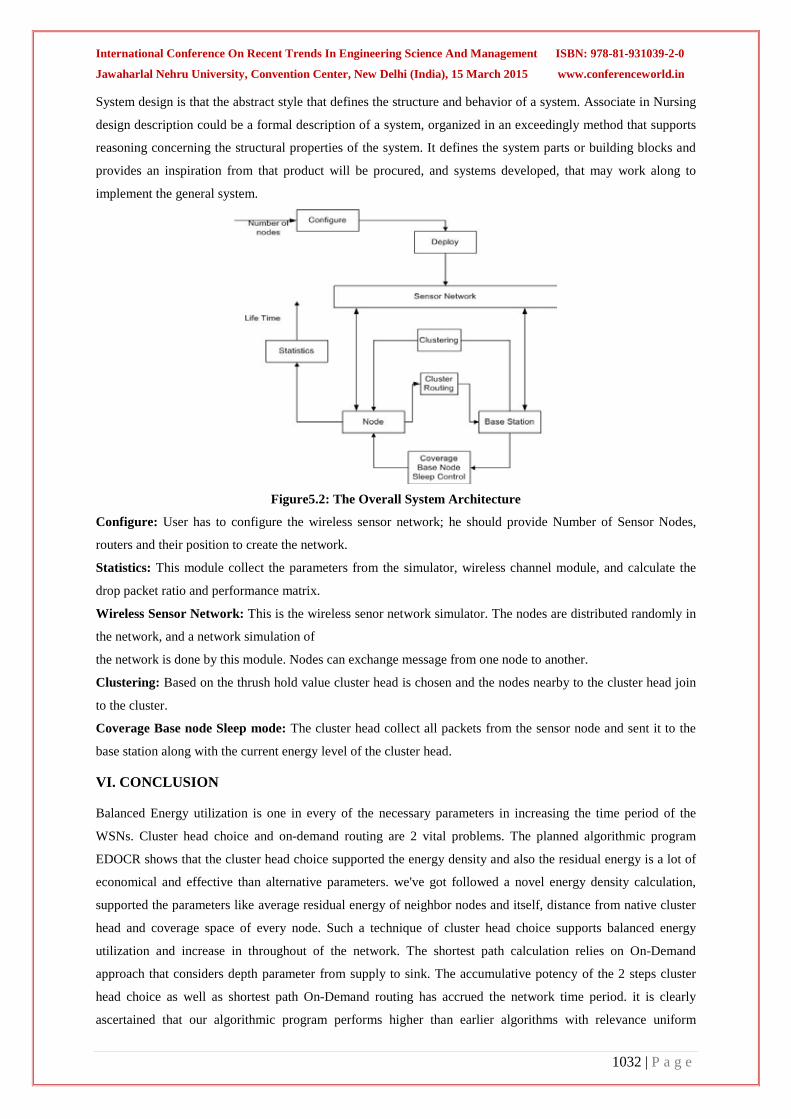
International Conference On Recent Trends In Engineering Science And Management ISBN: 978-81-931039-2-0
Jawaharlal Nehru University, Convention Center, New Delhi (India), 15 March 2015 www.conferenceworld.in
1032 | P a g e
System design is that the abstract style that defines the structure and behavior of a system. Associate in Nursing
design description could be a formal description of a system, organized in an exceedingly method that supports
reasoning concerning the structural properties of the system. It defines the system parts or building blocks and
provides an inspiration from that product will be procured, and systems developed, that may work along to
implement the general system.
Figure5.2: The Overall System Architecture
Configure: User has to configure the wireless sensor network; he should provide Number of Sensor Nodes,
routers and their position to create the network.
Statistics: This module collect the parameters from the simulator, wireless channel module, and calculate the
drop packet ratio and performance matrix.
Wireless Sensor Network: This is the wireless senor network simulator. The nodes are distributed randomly in
the network, and a network simulation of
the network is done by this module. Nodes can exchange message from one node to another.
Clustering: Based on the thrush hold value cluster head is chosen and the nodes nearby to the cluster head join
to the cluster.
Coverage Base node Sleep mode: The cluster head collect all packets from the sensor node and sent it to the
base station along with the current energy level of the cluster head.
VI. CONCLUSION
Balanced Energy utilization is one in every of the necessary parameters in increasing the time period of the
WSNs. Cluster head choice and on-demand routing are 2 vital problems. The planned algorithmic program
EDOCR shows that the cluster head choice supported the energy density and also the residual energy is a lot of
economical and effective than alternative parameters. we've got followed a novel energy density calculation,
supported the parameters like average residual energy of neighbor nodes and itself, distance from native cluster
head and coverage space of every node. Such a technique of cluster head choice supports balanced energy
utilization and increase in throughout of the network. The shortest path calculation relies on On-Demand
approach that considers depth parameter from supply to sink. The accumulative potency of the 2 steps cluster
head choice as well as shortest path On-Demand routing has accrued the network time period. it is clearly
ascertained that our algorithmic program performs higher than earlier algorithms with relevance uniform

International Conference On Recent Trends In Engineering Science And Management ISBN: 978-81-931039-2-0
Jawaharlal Nehru University, Convention Center, New Delhi (India), 15 March 2015 www.conferenceworld.in
1033 | P a g e
utilization of energy, lifetime, packet delivery magnitude relation and output. This work will be extended to
mobile sinks to cut back latency and additional increase the time period of the network.
REFERENCES
[1] J. Luo and J. P. Hubaux, (2005)“Joint Mobility and Routing for Lifetime Elongation in Wireless Sensor
Networks,” Proceedings IEEE INFOCOM.
[2] Y. Xu, J. Heidemann, and D. Estrin, (2001) “Geography-Informed Energy Conservation for Ad- Hoc
Routing,” Proceedings ACM Mobi Com.
[3] M. Singh and V. Prasanna, (2003)“Energy-Optimal and Energy-Balanced Sorting in a Single-Hop Wireless
Sensor Network,” Proceedings First IEEE International Conference Pervasive Computing and
Communication.
[4] R.C Shah and J.M Rubey (2002)“Energy Aware Routing for Low Energy and Ad- Hoc Sensor networks
Proceedings IEEE Wireless communications and Networking Conference (WCNC),pp. 350-355.
[5] S. J. Baek and G. de Veciana, (2007) “Spatial Energy Balancing through Proactive Multipath Routing in
Wireless Multihop Networks,” IEEE ACM Transactions Networking, vol. 15, no. 1, pp. 3-104, February
[6] Ashok Kumar and Vinod Kumar, (2011) “Energy Efficient Clustering and Cluster Head Rotation Scheme
for Wireless Sensor Networks,” IJACSA vol. 3, no. 5.
[7] WANG Jun1, Zhang Xin, Xie Junyuan, and Mi Zhengkun, (2011) “A Distance based Clustering Routing
Protocol in Wireless Sensor Networks,” National Science & Technology Specific Projects.
International Conference On Recent Trends In Engineering Science And Management ISBN: 978-81-931039-2-0
Jawaharlal Nehru University, Convention Center, New Delhi (India), 15 March 2015 www.conferenceworld.in
1034 | P a g e
MULTICAMARA AN IMPROVED ADAPTIVE BACKGROUND SURVEILLANCE SYSTEM AND
TRACKING SYSTEM WITH SHADOW DETECTION
RashmiB1, Sowmya B2, Dr. Y.P.Gowramma3
M.Tech 2nd Sem1, M.Tech 4th Sem2, Professor & H.O.D3
Kalpataru Institute of Technology, Tiptur, Karnataka, (India)
ABSTRACT In recent years, police investigation systems have gained exaggerated importance so as to extend the security
and security of individuals. These systems have applications in numerous domains like home or bank security,
traffic observation, defense; and publicly places like railway stations, malls, airports, etc. Our goal is to develop
Associate in Nursing intelligent period of time closed-circuit television that may facilitate in increasing the
potency of the system. so as to hide an oversized space, we\\\'d like to put in a lot of variety of cameras that ends
up in a lot of variety of videos that ar to be monitored at the same time. This successively will increase human
intervention and makes it error prone. Therefore, it\\\'s of utmost importance to automatise the entire system
Understanding objects in video information is of explicit interest because of its increased automation publicly
security police investigation in addition as in control and pedestrian flow analysis. Here, a system is conferred
that is ready to sight and classify folks and vehicles outdoors in several atmospheric condition employing a
static camera. The system is capable of properly pursuit multiple objects despite occlusions and object
interactions.
Keywords- Multi-Camera, Police Investigation, Homography, Shake, Occlusion.
I. INTRODUCTION
Surveillance system helps to monitor a given area of interest. Multiple cameras are used to cover a large area. In
order to track objects successfully inmultiple cameras, one needs to handshake among objects captured in
multiple cameras. The key elements of our proposed surveillance system include change detection, tracking,
camera coordination, occlusion handling and suspicious activity monitoring. Change detection is a basic module
of any surveillance system. The detected changes can be considered as foreground objects by modeling the
background. Generally, background subtraction and its variants are used to extract the foreground objects from
the video stream taken from a stationary camera [1, 2]. However, detecting the foreground objects becomes hard
when the background includes variations due to light, shadows and insignificant periodic changes of background
objects (e.g. swaying trees).. The value of each pixel is modeled as a mixture of Gaussians. According to the
persistence and variance of each mixture of Gaussians, the pixel is determined whether it belongs to foreground
or background. Once an object is detected, tracking is required to estimate its trajectory in the image plane. In
other words, a tracker assigns consistent labels to the tracked objects across different frames of a video.This skill
is also important for autonomousvehicles. An autonomous vehicle needs to be able to react in a predictable and
rational manner, similar to or better than a human operator. Onboard sensors are the primary means of obtaining

International Conference On Recent Trends In Engineering Science And Management ISBN: 978-81-931039-2-0
Jawaharlal Nehru University, Convention Center, New Delhi (India), 15 March 2015 www.conferenceworld.in
1035 | P a g e
environment information but suffer from occlusions. However ,offboard sensors such as webcams commonly
deployed around worksites can be used for thispurpose. We present our system for offboard dynamic object
tracking and classification using a static webcam mounted outside a building that monitors a typical open work
area.As the preliminary step towards integrating the extractedinformation to improve an autonomous vehicle’s
situationalawareness, information about the objects such as location, trajectory and type is determined using a
tracking and classification system. The system consists of several existing subsystems with improvements in the
detection and classification phases. The system is capable of working in differentweather conditions and can
distinguish between people andvehicles by identifying recurrent motion.
II. RELATED WORK
The common architecture of classification systems consists of the following three main steps: motion
segmentation, object tracking and object classification [1] [2]. The steps are described as follows.
In the motion segmentation step, the pixels of each moving object are detected. Generally, the motion
segmentation consists of background subtraction and foreground pixel segmentation. [3] use the mixture of to
perform background subtraction and apply a two-pass grouping algorithm to segment foreground pixels. Simple
and common techniques are based on frame differencing [4] or using a median filter [5]. In this work a
technique based on the Approximate was used. Better results were obtained by introducing a step factor in the
filter. Following background subtraction, the mobile objects are tracked. Tracking of objects is the most
important but error prone component. Problems arise when objects of interest touch, occlude and interact with
each other, and when objects enter and leave the image and introduced a method termed to track objects are
construct an invariant bipartite graph to model the dynamics of the tracking process use a linearly predictive
multiple hypotheses tracking algorithm. a merging and splitting algorithm to relate the measured foreground
regions to the tracked objects. Many algorithms have been proposed in the literature, but the problem of multiple
interacting objects tracking in complex scene is still far from being completely solved. Model based algorithms
are computationally more expensive, because the number of parameters to estimate the model is usually large.
They are also sensitive to background clutter. Overall, many of those algorithms can only deal with partial
object occlusions for a short duration and fail to deal with complete object occlusions.
2.1 Background Modelling In this section, we discuss the work and its shortcomings. The authors introduces a method to model each
background pixel different Gaussians are assumed to represent different colours. The weightparameters of the
mixture represent the time proportions that those colours stay in the scene. Unlike work, the background
components are determined by assuming that the background contains B highest probable colours. The probable
background colours are the ones which stay longer and more static. Static single-colour objects trend to form
tight clusters in the colour space while moving ones form widen clusters due to different reflecting surfaces
during the movement. The measure of this was called the fitness value in their papers. To allow the model to
adapt to changes in illumination and run in real-time, an update scheme was applied. It is based upon selective
updating. Every new pixel value is checked against existing model components in order of fitness. The first
matched model component will be updated. If it finds no match, a new Gaussian component will be added with
the mean at that point and a large covariance matrix and a small value of weighting parameter.
International Conference On Recent Trends In Engineering Science And Management ISBN: 978-81-931039-2-0
Jawaharlal Nehru University, Convention Center, New Delhi (India), 15 March 2015 www.conferenceworld.in
1036 | P a g e
2.2 Shadow Detection and Colour Model As it is evidence in their papers [1,2,3], tracker can not identify moving shadows from theobjects casting them.
The reason behind this is that no heuristic exists to label Gaussian components asmoving shadows. One
solution is to use a chromatic colour space representation which reduces susceptibility. As many colour spaces
can separate chromatic and illumination components, maintaining a chromatic model regardless of the
brightness can lead to an unstable model especially for very bright or dark objects. This conversion also requires
computational resources particularly in large images. The idea of preserving intensity components and saving
computational costs lead us back to the RGB space. As the requirement to identify moving shadows, we need to
consider a colour model that can separate chromatic and brightness components. It should be compatible and
make use of our mixture model. This is done by comparing a non-background pixel against the current
background components. If the difference in both chromatic and brightness components are within some
thresholds, the pixel is considered as a shadow We use an effective computational colour model similar to the
one proposed to fulfil these needs.
2.3 Mutiple Object Trackin With Occlusion Handing The goal of tracking is to establish correspondences between objects across frames. Robust classification of
moving objects is difficult if tracking is inaccurate. The flow diagram of the implemented object tracking
algorithm is shown in fig 1.
Fig.1 Flow diagram of the multiple objects tracking algorithm
III. LITAREATURE SURVEY
A system that observes an outside surroundings by onestatic camera is developed and tested. The goal is to trace
objects like walking folks or moving vehicles visible of the camera and to see their sort and position. The
motion segmentation step detects the moving objects mistreatment the current image within the image stream.
This output (the moving objects) is needed by the thing following algorithmic rule that provides the motion
history of every object. A particular characteristic of the following algorithmic rule is its ability to trace objects
with complete occlusion for an extended duration while not information concerning their form or motion.
Theoutput of the following algorithmic rule is employed by the classification system. Our classification
algorithmic rule could be a changed version of the system conferred [1]. The algorithmic rule uses on the motion
history of every object and by deciding the type of motion. Motion sort is set by any recurrent, motion of the

International Conference On Recent Trends In Engineering Science And Management ISBN: 978-81-931039-2-0
Jawaharlal Nehru University, Convention Center, New Delhi (India), 15 March 2015 www.conferenceworld.in
1037 | P a g e
object’s form. This property is used to classify between folks and vehicles. The motion segmentation, following
and classification steps are keen about one another.
Multicamara set up model[2] Understanding objects in video data is of particular interest due to its enhanced
automation in public security surveillance as well as in traffic control and pedestrian flowanalysis. Here, a
system is presented which is able to detect and classify people and vehicles outdoors in different weather
conditions using a static camera. The system is capable of correctly tracking multiple objects despite occlusions
and object interactions.
Association beween the camaras[3Real-time segmentation of moving regions in image sequences is a
fundamental step in manyvision systems including automated visual surveillance, human-machine interface, and
very low-bandwidth telecommunications. A typical method is background subtraction. Many background
models have beenintroduced to deal with different problems. One of the successful solutions to these problems
is to use a multi-colour background model per pixel proposed by [1,2,3]. However, the method suffers from
slow learning at the beginning, especially in busy environments. In addition, it can not distinguish between
moving shadows and moving objects. This paper presents a method which improves this adaptive background
mixture model.
In video surveillance systems[4], more intelligent functions are being embedded into cameras. In this paper,
wepropose a novel approach for detecting moving objects with fewer false alarms and low computational
complexity.
Contrary to traditional temporal differencing, we suggest a new feature based on signed difference, which
represents the pattern of motion in a given region. The pattern is measured by calculating the Earth Mover’s
Distance between regions with opposite signs in the signed difference. The robustness of the perceptive metric is
exploited to detect moving objects accurately. We also propose an efficient algorithm to approximate the value
along four given directions and to locate the regions of moving objects. Experimental results show that, without
prior knowledge or training, our method is able to detect moving objects with very low false alarm rate even
under the challenging environments.
(a) (b) Before themerging. (c) After the merging. (d) After the splitting
Fig. 2 Multiple Object Tracking (Left). Merging and Splitting Of Two People in A Scene (Right)
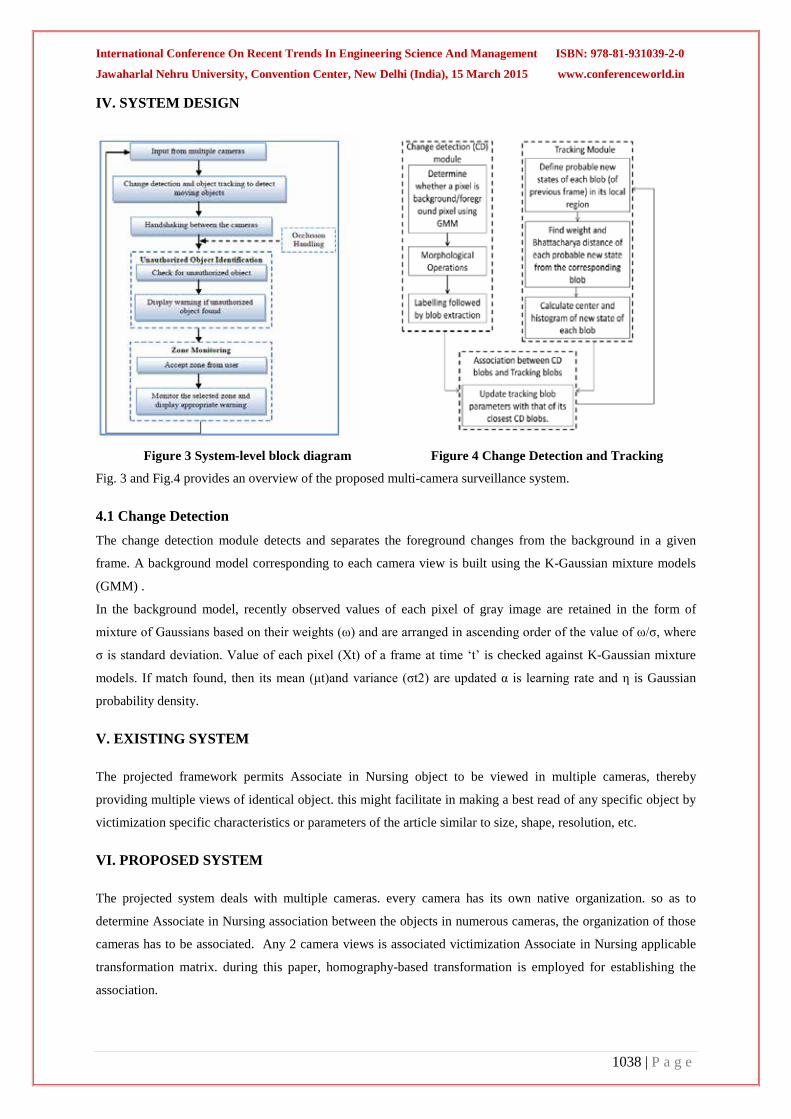
International Conference On Recent Trends In Engineering Science And Management ISBN: 978-81-931039-2-0
Jawaharlal Nehru University, Convention Center, New Delhi (India), 15 March 2015 www.conferenceworld.in
1038 | P a g e
IV. SYSTEM DESIGN
Figure 3 System-level block diagram Figure 4 Change Detection and Tracking
Fig. 3 and Fig.4 provides an overview of the proposed multi-camera surveillance system.
4.1 Change Detection The change detection module detects and separates the foreground changes from the background in a given
frame. A background model corresponding to each camera view is built using the K-Gaussian mixture models
(GMM) .
In the background model, recently observed values of each pixel of gray image are retained in the form of
mixture of Gaussians based on their weights (ω) and are arranged in ascending order of the value of ω/σ, where
σ is standard deviation. Value of each pixel (Xt) of a frame at time ‘t’ is checked against K-Gaussian mixture
models. If match found, then its mean (μt)and variance (σt2) are updated α is learning rate and η is Gaussian
probability density.
V. EXISTING SYSTEM
The projected framework permits Associate in Nursing object to be viewed in multiple cameras, thereby
providing multiple views of identical object. this might facilitate in making a best read of any specific object by
victimization specific characteristics or parameters of the article similar to size, shape, resolution, etc.
VI. PROPOSED SYSTEM
The projected system deals with multiple cameras. every camera has its own native organization. so as to
determine Associate in Nursing association between the objects in numerous cameras, the organization of those
cameras has to be associated. Any 2 camera views is associated victimization Associate in Nursing applicable
transformation matrix. during this paper, homography-based transformation is employed for establishing the
association.

International Conference On Recent Trends In Engineering Science And Management ISBN: 978-81-931039-2-0
Jawaharlal Nehru University, Convention Center, New Delhi (India), 15 March 2015 www.conferenceworld.in
1039 | P a g e
VII. CONCLUSIONS
We have developed AN intelligent real time multi-camera closed-circuit television that may find and track
individuals. This framework, by virtue of its simplicity, permits trailing those that square measure encroaching
restricted zones and find suspicious objects that square measure left unattended. so as to associate objects in
multiple cameras, homography based mostly transformation is employed. Changes square measure detected
exploitation Gaussian Mixture Model (GMM) and trailing is finished exploitation particle filtering. each the
outputs square measure passed to the association module. This module links the amendment detection blob with
corresponding trailing blob. The projected system is additionally capable of police investigation and handling
occlusion. The projected system is enforced on CPU platform comprising of Intel twin core with four GB RAM
on a 320*240 resolution image accessing four informatics cameras at the same time with a frame rate of 10fps.
The interval is about 100ms per instance.
REFERENCES
[1] I. Haritaoglu, D. Harwood, and L. Davis,“W4: Real-time surveillance ofpeople and their activities,” IEEE
Trans. Pattern Analysis and Machine Intelligence, VOL. 22, NO. 8, pp-809–830, August 2000.
[2] C. Stauffer and W. Grimson, “Learning patterns of activity using real-time tracking,” IEEE Trans. Pattern
Analysis and Machine Intelligence, 22(8):747–757, August 2000.
[3] Liyuan Li, Weimin Huang, Irene Y.H. Gu and Qi Tian, “Foreground ObjectDetection fromVideos
Containing Complex Background,” Proceedings of the eleventh ACM international conference on
Multimedia, Berkeley, CA, USA, November 02-08, 2003.
[4] Chris Stauffer and W.E.L Grimson,“Adaptive background mixture models for real-time tracking,”
Proceedings of IEEE Computer Society Conference on Computer Vision and Pattern Recognition, 1999.
[5] Rafael C. Gonzalez and Richard E. Woods, Digital Image Processing, Prentice-Hall, Inc., second edition,
2001.
[6] FatihPorikli, OncelTuzel, “Multi-Kernel Object Tracking,” IEEE International conference on Multimedia
and Expo (ICME), pp. 1234-1237, July 2005.
[7] Peter E. Hart, Richard O. Duda and David G. Stork, Pattern Classification, Wiley & Sons, Inc., second
edition, 2001.

International Conference On Recent Trends In Engineering Science And Management ISBN: 978-81-931039-2-0
Jawaharlal Nehru University, Convention Center, New Delhi (India), 15 March 2015 www.conferenceworld.in
1040 | P a g e
ENHANCING VIDEO DISSEMINATION USING JOINT ROUTING IN CELLULAR AND ADHOC NETWORK
K.R.Priyanga1, M. Lalithambigai ,2
1,2M.E., Communication Systems, Department of ECE
Sri Shakthi Institute of Engineering and Technology,Coimbatore (India)
ABSTRACT In my research work to improve disseminating videos to mobile users by using a hybrid cellular and ad hoc network.
In particular, we formulate the problem of optimally choosing the mobile devices that will serve as gateways from
the cellular to the ad hoc network, the ad hoc routes from the gateways to individual devices, and the layers to
deliver on these ad hoc routes. We develop a Mixed Integer Linear Program (MILP)-based algorithm, called POPT,
to solve this optimization problem. We then develop a Linear Program (LP)-based algorithm, called MTS, for lower
time complexity. We, therefore, propose a greedy algorithm, called THS, which runs in real time even for large
hybrid networks. We conduct extensive packet-level simulations to compare the performance of the three proposed
algorithms. We found that the THS algorithm always terminates in real time, yet achieves a similar video quality to
MTS. Therefore, we recommend the THS algorithm for video dissemination in hybrid cellular and ad hoc networks.
The videos are secured using the Misbehavior Routing Authentication and digital signature method. Load and
distribution method is used to transmit the secured videos.
Keywords: Wireless Networks, Video Streaming, Quality Optimization, Resource Allocation
I INTRODUCTION
MOBILE devices, such as smart phones and tablets, are getting increasingly popular, and continue to generate
record-high amount of mobile data traffic. For example, a Cisco report indicates that mobile data traffic will increase
39 times by 2015. Sixty six percent of the increase is due to video traffic [1]. Unfortunately, existing cellular
networks were designed for unicast voice services, and do not natively support multicast and broadcast. Therefore,
cellular networks are not suitable for large-scale video dissemination. This was validated by a measurement study,
which shows that each HSDPA cell can only support up to six mobile video users at 256 kbps [2]. Thus,
disseminating videos to many mobile users over cellular networks could lead to network congestion and degraded
user experience. This network capacity issue may be partially addressed by deploying more cellular base stations,
installing dedicated broadcast networks [3] or upgrading the cellular base stations to support Multimedia Broadcast
Multicast Service (MBMS) [4]. However, these approaches all result in additional costs for new network
infrastructure, and might not be fully compatible with existing mobile devices. Hence, a better way to disseminate
videos to many mobile users is critical to the profitability of cellular service providers.

International Conference On Recent Trends In Engineering Science And Management ISBN: 978-81-931039-2-0
Jawaharlal Nehru University, Convention Center, New Delhi (India), 15 March 2015 www.conferenceworld.in
1041 | P a g e
In this paper, we study video dissemination in a hybrid cellular and ad hoc network. Fig. 1 depicts the underlying
network, consisting of one or several base stations and multiple mobile devices equipped with heterogeneous
network interfaces. Mobile devices not only connect to the base station over the cellular network, but also form an
ad hoc network using short-range wireless protocols such as WiFi and Bluetooth. Mobile devices relay video traffic
among each other using ad hoc links, leveraging such a free spectrum to alleviate bandwidth bottlenecks and cut
down the expense of cellular service providers. Throughout the paper, we denote mobile devices that directly
receive video data over the cellular network and relay the receiving data to other mobile devices over the ad hoc
network as gateways. Notice that although we do not explicitly consider centralized access points in the short-range
network, our formulation and solutions are general enough, and can be readily applied to WiFi and Bluetooth access
points.
Figure 1 shows the block diagram of hybrid cellular and ad hoc network. Disseminating videos over a hybrid
cellular and ad hoc network is not an easy task because transmission of video data must adhere to timing constraints
inherent in the delivery and playback of video content.
Traditionally, video servers use computationally complex transcoders [5] to reduce the video coding rates to
guarantee on time delivery of video data. However, in a hybrid network, real-time transcoding is not feasible on
resource-constrained mobile devices. Thus, we employ scalable videos [6] for in-network video adaptation [7]. More
precisely, at the base station, scalable coders encode each video into a scalable stream consisting of multiple layers,
and each mobile device can selectively forward some layers to other mobile devices in a timely fashion.
Fig 1. A Hybrid Cellular And Ad Hoc Network
To deliver the highest possible video quality, we study an optimization problem that determines: 1) the mobile
devices that will serve as gateways and relay video data from the cellular network to the ad hoc network, 2) the
multihop ad hoc routes for disseminating video data, and 3) the subsets of video data each mobile device relays to
the next hops under capacity constraints. We formulate the optimization problem into a Mixed Integer Linear
Program (MILP), and propose an MILP-based algorithm, called POPT, to optimally solve it. We found that both
MTS and THS achieve a similar video quality, which is close-to-optimum video quality with at most a 2 dB gap
International Conference On Recent Trends In Engineering Science And Management ISBN: 978-81-931039-2-0
Jawaharlal Nehru University, Convention Center, New Delhi (India), 15 March 2015 www.conferenceworld.in
1042 | P a g e
observed. More importantly, the THS algorithm has a much lower time complexity than POPT and MTS. It always
terminates in real time, and supports large hybrid networks with 70+ mobile devices. Hence, we recommend the
THS algorithm for video streaming over hybrid cellular and ad hoc networks. Last, we also build a real video
dissemination system among multiple Android smart-phones over a live cellular network. Via actual experi-ments,
we demonstrate the practicality and efficiency of the proposed THS algorithm.
The rest of this paper is organized as follows: We give our system’s overview, build up notations, define, and
formulate our optimization problem in Section 2. This is followed by the proposed algorithms presented in Section
3. We evaluate the algorithms using extensive simulations and experiments in Sections 4. The paper is concluded in
Section 5.
II VIDEO DISSEMINATION IN HYBRID NETWORKS In this section, we first describe our system’s overview and notations used frequently in the paper. We then state our
problem that schedules to stream videos optimally, and formulate this problem as an MILP problem.
2.1 System Overview and Notations We consider a hybrid network (see Fig. 1), which consists of a cellular base station and several mobile devices.
Table 1 summarizes the notations used in the paper. The base station concurrently transmits K videos to U mobile
devices, where each mobile device receives and renders a video chosen by its user. Throughout this paper, we use
node to refer to both the base station and mobile devices. All mobile devices are equipped with two network
interfaces for cellular and ad hoc networks, respectively. Examples of cellular networks include EDGE, 3G, and 4G
cellular networks, and examples of ad hoc networks are WiFi ad hoc and Bluetooth networks. Mobile devices can
always receive video data from the base station via cellular links. They also form an ad hoc network and exchange
video data over it. Unlike cellular networks, ad hoc connectivity is not guaranteed because ad hoc networks, such as
WiFi ad hoc and Bluetooth networks, have a rather short range, less than a few hundreds of meters, and are prone to
disconnections due to user mobility.
Distributing videos in a hybrid network is challenging because: 1) wireless networks are dynamic in terms of
connectivity, latency, and capacity, and 2) video data require high throughput and low latency. To cope with these
challenges, we employ layered video coding [6], such as H.264/SVC [8], to encode each video into L layers. Layer 1
is referred to as the base layer, which provides a basic video quality. Layers 2; 3; . . . ; L are enhancement layers,
which provide incremental quality improvements. An enhancement layer is decodable if all layers below it are
received. With layered videos, we can dynamically adjust the number of layers sent to each mobile device. While
the adjustments may be done very frequently, a subject user study [9] reveals that frequent quality changes lead to
degraded viewer experience. Therefore, we divide each video into multiple D sec video segments, where D is a
small number (e.g., 1 or 2 seconds). Quality changes are only allowed at boundaries of segments. We study an
optimization problem of selecting transmission units from W consecutive segments to transmit to mobile devices
over the hybrid network. The W consecutive segments considered for selection form a scheduling window.
Given that the base station maintains a global view of the hybrid cellular and ad hoc network, the scheduler on the

International Conference On Recent Trends In Engineering Science And Management ISBN: 978-81-931039-2-0
Jawaharlal Nehru University, Convention Center, New Delhi (India), 15 March 2015 www.conferenceworld.in
1043 | P a g e
base station computes the schedule for all cellular and ad hoc links. The base station sends a new schedule to mobile
devices every DW0 secs. The mobile devices then distribute transmission units following the schedule. To maintain
the tractability, our schedule does not explicitly specify the transmission time of each transmission unit. Rather, the
order of transmission units is determined by the importance of transmission units. We denote the list of transmission
units sorted by their importance as a precedence list. Mobile devices skip transmission units that have not been
received, and check their availability again whenever a transmission unit is completely sent.
2.2 Optimization Problem Formulation We first build up the video and network models. Then, we formulate the considered scheduling problem.
2.2.1 Rate-Distortion (R-D) Model
Our objective is to maximize the video quality under network bandwidth constraints. A popular method to achieve
such quality-optimized system is to use a rate-distortion model, which describes the mapping between video rates
and degrees of quality degradation in reconstructed videos. R-D models capture the diverse video characteristics and
enable media-aware resource allocation. Due to flexible and complicated prediction structures of layered video
streams, existing scalable R-D models [10] are fairly complex and may not be suitable for real-time applications.
Hence, we adopt a low-complexity discrete R-D model below. The distortion caused by not sending a transmission
unit tk;s;l to a mobile device can be divided into two parts [11], [12] : 1) truncation distortion and 2) drifting
distortion. Truncation distortion refers to the quality degradation of pictures in segment s itself, and drifting
distortion refers to the quality degradation of pictures in other segments due to imperfect reconstruction of reference
pictures. We assume each segment s contains multiple groups-of-picture (GoPs) and, thus, can be independently
decoded. This practical assumption eliminates the needs to model drifting distortion. More specifically, we
empirically measure the mapping between the node location and link capacity several times, and use the resulting
values for capacity estimation.
Cellular networks control the interference via various multiple access methods (such as FDMA, TDMA, and
CDMA) and via proper network planning (to avoid intercell interference). At a high level, the base station runs a
centralized algorithm to allocate air-time to mobile parameter. Interference in ad hoc networks is harder to control
as the air-time allocation is done by distributed media access control (MAC) protocols. We model the air-time
allocation using the conflict graphs. A conflict graph is used to learn links that cannot be simultaneously activated
due to interference. This happens in ad hoc networks because mobile devices use the same frequency for
transmission. Two links interfere each other if at least one end of a link is in the transmission range of one or two
ends of the other link. An independent set refers to a subset of vertices where no two of them are adjacent.
2.2.2 Controlling Dissemination Latency
Our optimization problem only determines which transmission units to send in the current scheduling window, but
does not model the fine-grained delivery time of each transmission unit. We should mention that the unit delivery
time could be modeled using time-indexed Integer Linear Program (ILP) [13] . In time-indexed ILP formulations, all

International Conference On Recent Trends In Engineering Science And Management ISBN: 978-81-931039-2-0
Jawaharlal Nehru University, Convention Center, New Delhi (India), 15 March 2015 www.conferenceworld.in
1044 | P a g e
time intervals are expressed as (rounded to) multiples of a sufficiently small time slot. In these formulations, short
time slots are essential for good performance, but short time slots also lead to a large number of decision variables
and render the formulation computationally intractable.
We do not employ time-indexed ILP in our formulation, but use two other approaches to control latency. First, we
limit each unit to be sent over at most H hops in each scheduling window, where H is a small integer and a system
parameter. Second, we employ the paths on the breadth-first trees for unit delivery, which is detailed in the
following: Let Ak;s;l be the set of nodes that already have unit tk;s;l. Nodes in Ak;s;l are potential sources for
distributing tk;s;l and all other mobile devices are receivers of that transmission unit. To avoid inefficient paths, we
only consider the paths that follow the breadth-first tree from the source a to all mobile devices not in Ak;s;l. Figure 2
presents an example of a breadth-first tree, which is formed to deliver unit tk;s;l from device 1 in Ak;s;l to four
receivers. Device 1 is the root of the tree, and nodes 2 and 3 are in level 1.
Fig 2. An Illustrative Breadth-First Tree for Unit Delivery
Distributing transmission units over breadth-first trees not only limits the distribution latency and avoids loops, but
also reduces the complexity of the considered problem without sacrificing the solutions’ quality. This is because
paths that do not follow breadth-first trees are inefficient and should be avoided.
III SCHEDULING ALGORITHMS In this section, we present three algorithms to solve the scheduling problem in a hybrid cellular and ad hoc network.
3.1 An MILP-Based Algorithm: POPT The formulation consists of linear objective functions and constraints with integer decision variables (xa;v;u
k;s;l) and
real-value variables (_u and _q). Hence, it is an MILP problem and may be solved by MILP solvers. However,
observe that constraints in (2d) and (2e) include all the maximal independent sets Iq (1 _ q _ Q) in the conflict graph,
and finding all Iq itself is an NP-Complete problem [14]. Therefore, it is computationally impractical to consider all
Q maximal independent sets. Jain et al. [16] propose a random search algorithm for deriving a subset of maximal
independent sets that is sufficient for optimal schedulers. Li et al. [15] show that this random search algorithm is
inefficient, and propose a priority-based algorithm to find the maximal independent sets that will be used in the
optimal schedule with high probability. The priority-based algorithm works as follows: First, the shortest path
between the source-destination pair of each flow is calculated. Then, the number of shortest paths traversing through
each link is used as its priority. Next, the algorithm uses an anchor link to iterate through the links from high to low
priority. For each anchor link, the algorithm scans through all links that are not its neighbors in the conflict graph,
and creates a set of new maximal independent sets, where every maximal independent set contains the anchor link.

International Conference On Recent Trends In Engineering Science And Management ISBN: 978-81-931039-2-0
Jawaharlal Nehru University, Convention Center, New Delhi (India), 15 March 2015 www.conferenceworld.in
1045 | P a g e
A link covered by any maximal independent set will not be considered as an anchor link. The algorithm stops once
all links are covered by at least a maximal independent set. Readers are referred to Li et al. for more details on this
algorithm.
3.2 A Throughput-Based Heuristic Algorithm: MTS Since MILP problems are NP-Complete, the POPT algorithm does not scale well with the number of mobile
devices. Hence, we develop a heuristic algorithm, called Maximum Throughput Scheduling (MTS) algorithm that
was first presented in Do et al.[17].This algorithm consists of two steps. In step 1, we derive the demand capacity
c^u;v for each link from mobile device u to v. We iterate through the transmission units following the precedence list,
which generally starts from lower to higher layers and from earlier to later segments. For each transmission unit, we
first schedule it to be delivered to all mobile devices that have not received that unit yet, over the ad hoc links.
Mobile devices that cannot receive the transmission unit from peer mobile devices are scheduled to receive the unit
from the base station over the cellular network if their cellular data rate is enough to do so. More specifically, among
mobile devices that do not have the unit, the base station selects a device with the highest number of children in an
ad hoc tree rooted at that device, and sends it the unit.
3.3 A Tree-Based Heuristic Algorithm: THS Both POPT and MTS algorithms employ optimization problem solvers. Although commercial and open-source
solvers are available, these solvers might lead to long running time in the worst-case scenarios. Hence, we next
propose a greedy scheduling algorithm that does not rely on any solvers. We call it Tree-Based Heuristic Scheduling
(THS) algorithm, and it works as follows: We first sort all the transmission units in the W-segment scheduling
window in descending order of importance, by layer, segment, and video. We then go through these WL units, and
sequentially schedule the transmissions to all mobile devices. For each transmission unit, we first consider
dissemination over the ad hoc network. If the ad hoc network cannot deliver this unit to all mobile devices in time,
we fall back to the cellular network. The scheduler sends the unit to a device with highest cellular data rate among
those which have not received the unit. The parameters such as end-to-end delay, throughput are calculated with the
existing system system and they are increased compared with the existing system.
IV SIMULATION RESULTS We conduct extensive packet-level simulations to evaluate our proposed algorithms in this section.
4.1 Settings We employ a well-known network simulator, NS2. We emphasize that NS2 captures many more details in a hybrid
cellular and ad hoc network, and provides simulator results closer to real life, compared to the flow-based
simulations used in earlier work. We implement all the proposed scheduling algorithms in the simulator. The video
file which is in .DAT format is employed in the program to check parameters for the existing and proposed method
and also the error rate for the video is calculated as video before sending and after sending is calculated. In DAT

International Conference On Recent Trends In Engineering Science And Management ISBN: 978-81-931039-2-0
Jawaharlal Nehru University, Convention Center, New Delhi (India), 15 March 2015 www.conferenceworld.in
1046 | P a g e
format the video classified as Inter frame, Predictive frame and Bipredictive frame. Based on the priority, time and
length of the frame the videos are transmitted. The negative acknowledgement is also calculated. The error rate is
minimized after the transmission so that the video received is viewed clearly.
Fig 3. Video Before Sending
Figure 3 shows the graph between time and the packet size in bytes of the video before sending. Figure 4 the graph
between time and the packet size in bytes of the video after
sending.
Fig 4. Video After Sending
V CONCLUSION
We studied the problem of optimally leveraging an auxiliary ad hoc network to boost the overall video quality of
mobile users in a cellular network. We formulated this problem as an MILP problem to jointly solve the gateway
selection, ad hoc routing, and video adaptation problems for a global optimum schedule. We proposed three
algorithms: 1) an MILP-based algorithm, POPT, 2) an LP-based algorithm, MTS, and 3) a greedy algorithm, THS.
Via packet-level simulations, we found that neither POPT nor MTS scale to large hybrid networks. This is because
they both employ numerical methods to solve optimization problems. Therefore, we recommend the THS algorithm,

International Conference On Recent Trends In Engineering Science And Management ISBN: 978-81-931039-2-0
Jawaharlal Nehru University, Convention Center, New Delhi (India), 15 March 2015 www.conferenceworld.in
1047 | P a g e
which terminates in real time even when there are 70+ mobile devices in the hybrid network. In the THS algorithm
the security is added to the video and it can be various applications where Security is an important thing. It can be
used in military command-and-control and in some emergency cases.
VI ACKNOWLEDGMENT
First and foremost, we wish to express our deep gratitude and indebtness to our institution and our department for
providing us a chance to fulfill our long cherished of becoming Electronics and Communication engineers.
We wish to acknowledge with thanks the excellent encouragement given by the management of our college .We
wish to express our hearty thanks to the Principal of our college and HOD. We are committed to place our heartfelt
thanks to all teaching and supporting staff members, lab technicians and friends, and all the noble hearts that gave us
immense encouragement towards the completion of our project. Finally we thank almighty for bestowing the gifts of
life on us and also for providing us the necessary help through his lovely creations in this endeavor of us.
REFERENCES [1] “Cisco Visual Networking Index: Forecast and
Methodology,”http://www.cisco.com/en/US/solutions/collateral/ns341/ns525/ns537/ns705/ns827/white_paper_
c11-481360_ns827_ Networking_ Solutions_White_Paper.html, 2012.
[2] F. Hartung, U. Horn, J. Huschke, M. Kampmann, T. Lohmar, and M. Lundevall, “Delivery of Broadcast
Services in 3G Networks,” IEEE Trans. Broadcasting, vol. 53, no. 1, pp. 188-199, Mar. 2007.
[3] M. Kornfeld and G. May, “DVB-H and IP Datacast - Broadcast to Handheld Devices,” IEEE Trans.
Broadcasting, vol. 53, no. 1, pp. 161-170, Mar. 2007.
[4] S. Parkvall, E. Englund, M. Lundevall, and J. Torsner, “Evolving 3G Mobile Systems: Broadband and
Broadcast Services in WCDMA,” IEEE Comm. Magazine, vol. 44, no. 2, pp. 30-36, Feb. 2006.
[5] J. Xin, C. Lin, and M. Sun, “Digital Video Transcoding,” Proc. IEEE, vol. 93, no. 1, pp. 84-97, Jan. 2005.
[6] Y. Wang, J. Ostermann, and Y. Zhang, Video Processing and Communications, first ed. Prentice Hall, 2001.
[7] I. Kofler, M. Prangl, R. Kuschnig, and H. Hellwagner, “An H.264/ SVC-Based Adaptation Proxy on a WiFi
Router,” Proc. ACM 18th Int’l Workshop Network and Operating Systems Support for Digital Audio and Video
(NOSSDAV ’08), pp. 63-68, May 2008.
[8] H. Schwarz, D. Marpe, and T. Wiegand, “Overview of the Scalable Video Coding Extension of the H.264/AVC
Standard,” IEEE Trans. Circuits and Systems for Video Technology, vol. 17, no. 9,1103-1120, Sept. 2007.
[9] P. Ni, A. Eichhorn, C. Griwodz, and P. Halvorsen, “Fine-Grained Scalable Streaming from Coarse-Grained
Videos,” Proc. Int’l Workshop Network and Operating Systems Support for Digital Audio and Video
(NOSSDAV ’09), pp. 103-108, Sept. 2009.
[10] C. Hsu and M. Hefeeda, “On the Accuracy and Complexity of Rate-Distortion Models for FGS-Encoded Video
Sequences,” ACM Trans. Multimedia Computing, Communications, and Applications, vol. 4, no. 2, pp. 15:1-
15:22, May 2008.
[11] C. Hsu, N. Freris, J. Singh, and X. Zhu, “Rate Control and Stream Adaptation for Scalable Video Streaming

International Conference On Recent Trends In Engineering Science And Management ISBN: 978-81-931039-2-0
Jawaharlal Nehru University, Convention Center, New Delhi (India), 15 March 2015 www.conferenceworld.in
1048 | P a g e
over Multiple Access Networks,” Proc. Int’l Packet Video Workshop (PV ’10), pp. 1-8, Dec. 2010.
[12] N. Freris, C. Hsu, X. Zhu, and J. Singh, “Resource Allocation for Multihomed Scalable Video Streaming to
Multiple Clients,” Proc. IEEE Int’l Symp. Multimedia (ISM ’10), pp. 9-16, Dec. 2010.
[13] M. Pinedo, Scheduling: Theory, Algorithms, and Systems, third ed. Springer, 2008.
[14] M. Garey and D. Johnson, Computers and Intractability: A Guide to the Theory of NP-Completeness, first ed.
W.H. Freeman, 1979.
[15] H. Li, Y. Cheng, C. Zhou, and P. Wan, “Multi-Dimensional Conflict Graph Based Computing for Optimal
Capacity in MR-MC Wireless Networks,” Proc. IEEE 30th Int’l Conf. Distributed Computing Systems (ICDCS
’10), pp. 774-783, Aug. 2010.
[16] K. Jain, J. Padhye, V. Padmanabhan, and L. Qiu, “Impact of Interference on Multi-Hop Wireless Network
Performance,” Proc. ACM MobiCom, pp. 66-80, Sept. 2003.
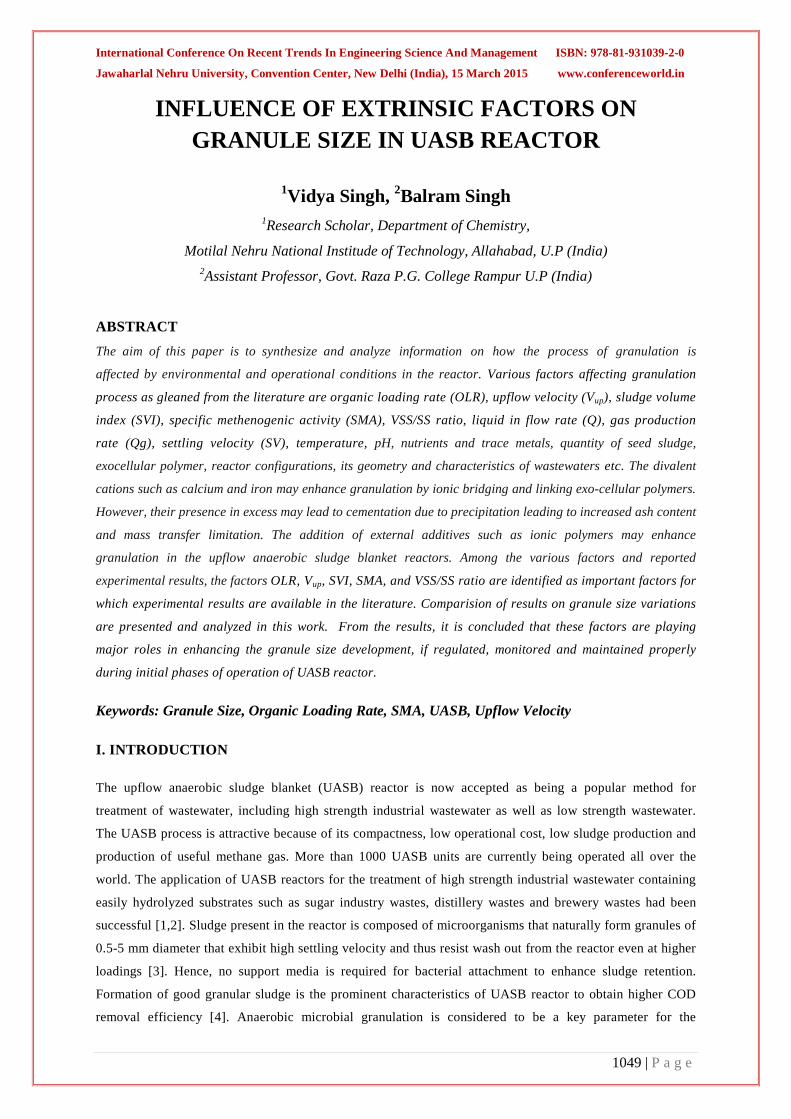
International Conference On Recent Trends In Engineering Science And Management ISBN: 978-81-931039-2-0
Jawaharlal Nehru University, Convention Center, New Delhi (India), 15 March 2015 www.conferenceworld.in
1049 | P a g e
INFLUENCE OF EXTRINSIC FACTORS ON GRANULE SIZE IN UASB REACTOR
1Vidya Singh, 2Balram Singh
1Research Scholar, Department of Chemistry,
Motilal Nehru National Institude of Technology, Allahabad, U.P (India) 2Assistant Professor, Govt. Raza P.G. College Rampur U.P (India)
ABSTRACT
The aim of this paper is to synthesize and analyze information on how the process of granulation is
affected by environmental and operational conditions in the reactor. Various factors affecting granulation
process as gleaned from the literature are organic loading rate (OLR), upflow velocity (Vup), sludge volume
index (SVI), specific methenogenic activity (SMA), VSS/SS ratio, liquid in flow rate (Q), gas production
rate (Qg), settling velocity (SV), temperature, pH, nutrients and trace metals, quantity of seed sludge,
exocellular polymer, reactor configurations, its geometry and characteristics of wastewaters etc. The divalent
cations such as calcium and iron may enhance granulation by ionic bridging and linking exo-cellular polymers.
However, their presence in excess may lead to cementation due to precipitation leading to increased ash content
and mass transfer limitation. The addition of external additives such as ionic polymers may enhance
granulation in the upflow anaerobic sludge blanket reactors. Among the various factors and reported
experimental results, the factors OLR, Vup, SVI, SMA, and VSS/SS ratio are identified as important factors for
which experimental results are available in the literature. Comparision of results on granule size variations
are presented and analyzed in this work. From the results, it is concluded that these factors are playing
major roles in enhancing the granule size development, if regulated, monitored and maintained properly
during initial phases of operation of UASB reactor.
Keywords: Granule Size, Organic Loading Rate, SMA, UASB, Upflow Velocity
I. INTRODUCTION
The upflow anaerobic sludge blanket (UASB) reactor is now accepted as being a popular method for
treatment of wastewater, including high strength industrial wastewater as well as low strength wastewater.
The UASB process is attractive because of its compactness, low operational cost, low sludge production and
production of useful methane gas. More than 1000 UASB units are currently being operated all over the
world. The application of UASB reactors for the treatment of high strength industrial wastewater containing
easily hydrolyzed substrates such as sugar industry wastes, distillery wastes and brewery wastes had been
successful [1,2]. Sludge present in the reactor is composed of microorganisms that naturally form granules of
0.5-5 mm diameter that exhibit high settling velocity and thus resist wash out from the reactor even at higher
loadings [3]. Hence, no support media is required for bacterial attachment to enhance sludge retention.
Formation of good granular sludge is the prominent characteristics of UASB reactor to obtain higher COD
removal efficiency [4]. Anaerobic microbial granulation is considered to be a key parameter for the
International Conference On Recent Trends In Engineering Science And Management ISBN: 978-81-931039-2-0
Jawaharlal Nehru University, Convention Center, New Delhi (India), 15 March 2015 www.conferenceworld.in
1050 | P a g e
successful operation of a UASB reactor. It is a biological process under favorable conditions due to the
tendency of bacteria to self-immobilize. The granulation is often initiated by adsorption of bacteria to inert
material, or with each other due to syntrophic relationship between methanogenic and acetogenic species in
mixed consortia [5]. UASB process for the treatment of domestic wastewater (low strength) also suffers from
a number of shortcomings, such as long start-up time, poor gas production, susceptibility to shock loadings,
inability to form self-immobilized bacterial granules and necessity for post-treatment of the effluent.
Granules may range from 0.1 to 5 mm in size and are differentiated from flocculated sludge by higher shear
strength [5]. It is believed to be the most critical parameter affecting successful operation of a UASB reactor
because granulated sludge has better settling property allowing higher hydraulic and organic loading,
granules can withstand high gas and liquid shear stress without disintegrating and granules provide increased
resistance to process shocks and toxins compared to dispersed microorganisms [2,5].
The granulation process is commonly believed to be sensitive to the sudden change of environmental and
operational conditions. Factors governing granulation have been extensively studied on a variety of
wastewaters. Some of these factors are operating conditions [6,7], pH and alkalinity [8], temperature [9],
strength and composition of wastewater [10], reactor hydrodynamics [9,11], presence of metal ions and trace
metals [12-14], presence of polymers [15-16], microbial ecology [17] and production of exocellular
polymeric substances by anaerobic bacteria [18-19]. A number of reviews are available on functioning of
UASB reactor, its applicability to sewage treatment, treatment of some of the toxic wastes, nutrient
requirements for UASB reactor [8] and mechanisms of granulation [5,20,21].
This paper presents an analysis of various factors such as OLR, Vup, SVI, SMA, and VSS/SS ratio affecting
granulation and granule size development in UASB reactor using the data available in literature.
II. DATA COLLECTION AND METHODOLOGY
In the analysis of granule size development in UASB reactor, the experimental results of [22, 23] have been
used. These experimental data were read either from the figures or taken directly from the tables provided in
[22,23]. In [22], influent substrate concentration (S0) was maintained at 4000mg COD/L in all the four
reactors R1 to R4 and OLR was varied in the range of 0.8-19.2 g COD/L.d. Reactor R4 provided the shortest
period of granulation compared to other reactors. In [23], influent substrate concentration was varied in range
of 550 mg/L to 650 mg/L throughout the study in all four reactor R1 to R4. OLR was varied in the range of
0.5-5.89 g COD/L.d. Reactor R2 provided the shortest period compared to other reactors. Subsequent
granules characterization indicated that the granule developed in R4 reactors in [22] and R2 reactor in [23]
exhibited the best settleability, short start-up period and good methanogenic activity at all OLRs.
III. INFLUENCE OF FACTORS AFFECTING GRANULE SIZE DEVELOPMENT
3.1 Organic Loading Rate (OLR) The organic loading rate (OLR) in the reactor can be varied either by varying influent COD concentration or
by varying in flow rate. Using the experimental results of [22, 23] the variation of granule size as a function
of OLR is shown in figure 1. From fig. 1, it is evident that as OLR increases, size of granules also increases
upto an OLR of 12.8 g COD/L.d, but at an OLR of 13 g COD/L.d, granule size is decreased due to possible
wash-out and shearing of granules in [22]. In [23], no wash-out and shearing of granules are observed with
increasing OLR upto 5.49 g COD/L.d.

International Conference On Recent Trends In Engineering Science And Management ISBN: 978-81-931039-2-0
Jawaharlal Nehru University, Convention Center, New Delhi (India), 15 March 2015 www.conferenceworld.in
1051 | P a g e
The successful operation of UASB reactor depends on the formation of granules with good settleability and
high degradation activities. It was observed that the large granules may also exhibit loose structure and lots of
white and black fluffy flocs may get attached on the surface. At higher OLR granule diameter may be
reduced due to possible shearing of loose flocs and washout of loosely attached microorganisms [22, 23].
3.2 Upflow velocity (Vup) Granule formation and characteristics are strongly influenced by the liquid upflow velocity and at high
upflow velocities (>1m/h), the granules may disintegrate due to shearing and resulting fragments may wash
out of the reactor [11]. Vigorous gas evolution at high organic loading and upflow veloity may result in
vigorous shearing of bacterial cells from granule surface leading to granule erosion [24]. In [22-23] upflow
velocity are calculated from given data. The variation of granule size as a function of upflow velocity is
shown in figure 2. From this figure, it is evident that As the organic loading rate increases, granule size as
well as upflow velocity of the reactor continuously increases [22, 23].
From fig. 2 in [22] upflow velocity are not more higher than 0.2 m/h, large size of granules [2.5-2.6 mm] are
observed and at higher Vup reach upto 0.14 m/h shearing of granules occurs then diameter of granules
decreases. Due to higher upflow velocity, shearing of granules and wash-out of microorganism occurs in the

International Conference On Recent Trends In Engineering Science And Management ISBN: 978-81-931039-2-0
Jawaharlal Nehru University, Convention Center, New Delhi (India), 15 March 2015 www.conferenceworld.in
1052 | P a g e
reactor size of granules decreases from their peak values. In [23] upflow velocity lies upto 0.6 m/h, higher
upflow velocity but due to low organic loading rate small size of granules are observed as shown in fig. 2.
3.3 Sludge Volume Index (SVI) Reduction of SVI, which is an important physical parameter, was generally considered as an indicator of
improvement in granule settleability. SVI of granules in reactors, which has inverse ratio with settling
velocity. Variation of SVI values with granule size is oscillating in nature, at maximum granule size 2.62mm
SVI value is 0.016 L/g [22]. As SVI values decreases, size of granule increases continuously [23].
Enhanced granule settleability as indicated by settling velocity and SVI results could be due to improved
bacterial adhesion. In reactor SVI fell more sharply as COD loading increased initially but rose again at the
higher levels of COD loading. Enhanced granule settleability in reactor as indicated by the SVI values could
be due to improved bacterial adhesion [22]. The sludge first became loose, the SVI of the sludge in reactor
increased, then, because of improved bacterial adhesion, the SVI of sludge in reactor decreased [23]. In [22,
23] SVI values are decreased then better settleability of granules occurs, granule size increases.
3.4 Specific Methenogenic Activity (SMA) Metabolic activities of granules can be expressed in term of specific methonogenic activity (SMA). In [22]
maximum SMA value are 2.37 g CH4-COD /g VSS.d and observed diameter of granule is 1.89 mm. After
OLR 16 g COD/L.d SMA values are decrease with increasing granule size. SMA values are continuously
increasing with increasing granule size and reach upto 1.21g CH4-COD /g VSS.d at 1.18mm granule size
because there is no shearing occurs [23].

International Conference On Recent Trends In Engineering Science And Management ISBN: 978-81-931039-2-0
Jawaharlal Nehru University, Convention Center, New Delhi (India), 15 March 2015 www.conferenceworld.in
1053 | P a g e
SMA is important characteristics of granular sludge, as organic loading rate was increases activity of granules
in reactor decreases. At very higher organic loading rate diameter of granule decreases as well as SMA values
due to shearing of granules [22]. When OLR exceeded 16 g CH4-COD /g VSS.d in reactor, the SMA
decreased, indicating that methanogenic activity may have been inhibited by accumulation of fatty acids,
although this is tentative suggestion since there was no direct determination of VFAs [23].
3.5 VSS/SS Ratio The SS and VSS of the reactor contents increased with increasing granule size, indicating a corresponding
increase in the biological solids inventory. VSS/SS ratio oscillating in nature with granule size in [22],
VSS/SS ratio range varies in the order of 0.59 to 0.78. VSS/SS ratio continuously increasing with increasing
granule size in [23], at maximum granule size 1.18mm VSS/SS ratio observed 0.69.
From fig. 5 when granules achieved good settling characteristics, VSS/SS ratio become constant (0.86-0.89)
at different granule size [22]. The amount biomass wash-out had likely exceeded with increasing organic
loading rate [23]. The better retention of sludge in the reactors could be attributed to higher settleability and
strength of granules developed in the reactors. These data indicated the extent of biomass wash-out had been
reduced by increasing the organic loading capacities of the reactors. As the seed sludge was taken from
digested anaerobic sludge, high suspended solids content resulted in low SVI values, when microorganisms
multiplied in the reactors, the VSS/SS of the sludge increases [24].
IV. CONCLUSION
In this paper described the five factors OLR, Vup, SVI, SMA, and VSS/SS ratio studied is on granule size
development in UASB reactor. It has been informed that OLR and upflow velocity are more critical parameters
controlling the granule size variations in UASB reactors. The fluctuation in VFA may arise due to fluctuation in
OLR, either in form of HRT or influent COD. The optimum range of OLR and HRT can only be decided after
considering the influent characteristics and other operating conditions. Layer formation in granules is due to
interaction of intragranular diffusion and degradation kinetics of the substrate. SVI is an important physical
parameter, was considered as an indicator of granule settleability. Low SVI values show good granule settling
property. . Good settling properties are obtained through the flocculation of the biomass in the form of dense
granules with diameters up to several millimetres. SMA parameter shows the metabolic property of granule,
activity of granules increases with increasing granule diameter. VSS/SS ratio was also increasing with granule
size, when no any shearing of granules occurs in the reactor. The evolution of size distribution is of vital
importance for the monitoring of UASB reactors.

International Conference On Recent Trends In Engineering Science And Management ISBN: 978-81-931039-2-0
Jawaharlal Nehru University, Convention Center, New Delhi (India), 15 March 2015 www.conferenceworld.in
1054 | P a g e
Nomenclature
OLR organic loading rate (g.COD/L.d)
Vup upflow velocity (m/h)
SVI sludge volume index (L/g)
SMA specific methenogenic activity (g CH4-COD/g VSS.d)
VSS/SS volatile suspended solids/suspended solid % ratio
Q liquid inflow rate (l/d)
Qg gas production rate (l/d)
SV settling velocity (m/h)
S0 influent COD concentration (g/L)
V. ACKNOWLEDGEMENT
Authors are grateful to MHRD, New Delhi and the director, MNNIT, Allahabad for their help in completing
and preparing this paper.
REFERENCES
[1] Fang, HHP., Chui, HK., Li, YY., Chen, T., “Microstructural analysis of UASB granules treating brewery
wastewater,” Water Sci Technol, Vol. 31, 1995, 129-135.
[2] Lettinga, G., Hulshoff Pol, L.W.,. “UASB-process design for various types of wastewaters,” Water
Science and Technology, Vol. 24, No. 8, 1991, 87-107.
[3] Bhunia, P., Ghangrekar, M.M.,. “Required minimum granule size in UASB reactor and characteristics
variation with size,” Bioresource Technology, Vol. 98, No. 5, 2007, 994-999.
[4] Ghangrekar, M.M., Asolekar, S.R., Ranganathan, K.R., Joshi, S.G., “Experience with UASB reactor start-
up under different operating conditions,” Water Science and Technology, Vol. 34 (5-6), 1996, 421-428.
[5] Schmidt, J.E., Ahring, B.K., “Granular sludge formation in upflow anaerobic sludge blanket (UASB)
reactors,” Biotechnology and Bioengineering, Vol. 49, No. 3, 1996, 229-246.
[6] Kalyuzhnyi, SV., Sklyar, VI., Davlyatshina, MA., Parshina, SN., Simankova, MV., Kostrikina, NA.,
Nozhevnikova, AN., “Organic removal and microbiological features of UASB reactor under various
organic loading rate,” Bioresour Technol, Vol. 55, 1996, 47-54.
[7] Shayegan, J., Ghavipanjeh, F., Mirjafari, P., “The effect of influent COD and upward flow velocity on the
behaviour of sulphate reducing bacteria,” Process Biochem, Vol. 40, 2005, 2305-2310.
[8] Singh, RP., Kumar, S., Ojha, CSP., “Nutrient requirement for UASB process: a review,” Biochem Eng J,
Vol. 3, 1999, 35-54
[9] Singh, KS., Viraraghavan, T., “Impact of temperature on performance , microbiological and hydrodynamic
aspects of UASB reactors treating municipal wastewater,” Water Sci Technol, Vol. 48, 2003, 211-217.
[10] Fang, HHP., Chui, HK., Li, YY., Chen, T., “Degradation of phenol in wastewater in an upflow anaerobic
sludge blanket reactor,” Water Res, Vol. 30, 1996, 1353-1360.
[11] Kosaric, N., Blaszezyk, R., Orphan, L., “Factors influencing formation and maintenance of granules in
upflow anaerobic sludge blanket reactors (UASBR),” Water SciTechnol, Vol. 22, 1990, 275-282.

International Conference On Recent Trends In Engineering Science And Management ISBN: 978-81-931039-2-0
Jawaharlal Nehru University, Convention Center, New Delhi (India), 15 March 2015 www.conferenceworld.in
1055 | P a g e
[12] Kalogo, Y., M’Bassiguie´ Se´ka, A., Verstraete, W., “Enhancing the start-up of a UASB reactor treating
domestic wastewater by adding a water extract of Moringa oleifera seeds,” Applied Microbiology and
Biotechnology, Vol. 55, No. 5, 2001, 644-651.
[13] Tiwari, M., Guha, S., Harendranath, C., Tripathi, S., “Enhanced granulation by natural ionic polymer
additives in UASB reactor treating low-strength wastewater,” Water Research, Vol. 39, No. 16, 2005,
3801-3810.
[14] El-Mamouni, R., Leduc, R., Guiot, SR., “Influence of the starting microbial nucleus type on the anaerobic
granulation dynamics,” Appl Microbiol Biotechnol, Vol. 47, 1997, 189-194.
[15] Morgan, JW., Forster, CF., Evison, LM., “A comparative study of the nature of biopolymers extracted
from anaerobic and activated sludge,” Water Res, Vol. 24, 1990, 743-750.
[16] Jai, XS., Fang, HHP., Furumai, H., “Surface charge and extracellular polymer of sludge in the anaerobic
degradation process,” Water Sci Technol, Vol. 34, 1996, 309-316.
[17] Hulshoff Pol, LW., de Castro Lopes, SI., Letttinga, G., Lens, PNL., “Anaerobic sludge granulation,”
Water Res, Vol. 38, 2004, 1376-1389.
[18] Liu, Y., Xu, HL., Yang, SF., Tay, JH., “Mechanisms and models for anaerobic granulation in upflow
anaerobic sludge blanket reactor,” Water Res, Vol.37, 2003, 661-673.
[19] Shen, CF., Kosaric, N., Blaszezyk, R., “The effect of selected heavy metals (Ni, Co and Fe) on anaerobic
granules and their extracellular polymeric substances (EPS),” Water Res, Vol. 27, 1993, 25-33.
[20] Yu, H.Q., Fang, H.H.P., Tay, J.H., “Effects of Fe2+ on sludge granulation in upflow anaerobic sludge
blanket reactors,” Water Science and Technology, Vol. 41, No. 12, 2000, 199-205.
[21] Yu, H.Q., Fang, H.H.P., Tay, J.H., “Enhanced sludge granulation in upflow anaerobic sludge blanket
(UASB) reactors by aluminum chloride,” Chemosphere, Vol. 44, No. 1, 2001b, 31-36.
[22] Wang, Y., Show, K.Y., Tay, J.H., Sim, K.H., “Effects of cationic polymer on start-up and granulation in
upflow anaerobic sludge blanket reactors,” Journal of Chemical Technology & Biotechnology, Vol. 79,
No. 3, 2004, 219-228.
[23] Wang, JS., Hu, YY., Wu, CD., “Comparing the effect of bioflocculant with synthetic polymers on
enhancing granulation in UASB reactors for low-strength wastewater treatment,” Water SA, Vol. 31,
2005, 177-182.
[24] Syutsubo, K., Harada, H., Ohashi, A., Suzuki, H., “An effective start-up of thermophilic UASB reactor
by seeding mesophilically grown granular sludge,” Water Sci Technol, Vol. 24, 1997, 35-59.
International Conference On Recent Trends In Engineering Science And Management ISBN: 978-81-931039-2-0
Jawaharlal Nehru University, Convention Center, New Delhi (India), 15 March 2015 www.conferenceworld.in
1056 | P a g e
SECURITY CHALLENGES AND CRYPTOGRAPHY IN EMBEDDED SYSTEMS
Meeta Gupta Ph.D Scholar, Computer Science and Engineering Department, JIIT, Noida, (India)
ABSTRACT
Embedded systems now days are integral part of our lives. They are used for various industrial
automation purposes, service oriented applications like power, water distribution, healthcare and low
cost systems like smart cards and PDA’s. Today, already more than 98% of all manufactured
microprocessors are employed in embedded applications rather than in traditional personal
computers. Embedded processors are already an integral part of many communications devices and
their importance will continue to increase. Embedded systems exchange data and information both
locally and globally using networking and wireless communication, thus making them vulnerable to
various kinds of active and passive attacks. In this paper we provide an overview of the security
requirements, security challenges and need of light weight cryptography in embedded systems.
Keywords: Security, Attacks, Cryptography, Light Weight Cryptography I. INTRODUCTION
Embedded devices are increasingly integrated into personal and commercial infrastructures. Security has
emerged as a prime concern in the design and development of embedded systems. Today security[1] is a
requirement for an increasing number of embedded systems ranging from low end systems such as PDA’s,
wireless handsets, networked sensors and smart cards to high end embedded systems such as routers, gateways,
firewalls, storage servers and web servers. Embedded systems are used to capture, sense, store, process, transmit
private, and vital data in computing systems like in automobiles, planes, trains, consumer electronics, medical
equipments, network appliances, smart cards, cell phone, PDA’s, time limited and on demand digital services
etc. The users are endless so the numbers of new applications, both are increasing in this new world of pervasive
computing. Security concerns are not new for embedded systems, but internet and wireless connectivity makes
them more vulnerable to attacks. Security in embedded systems is usually considered as an afterthought, as
security is not an economic priority for companies and users also pay more attention to saving money, and
adding more features and functionalities. But as more and more security breaches have reported, the awareness
and importance of security is raised and there is a need to incorporate security from the beginning of the design
of embedded systems to the throughout entire life cycle[2]. The security attacks on embedded systems [3][6]
target the weaknesses in the implementation of embedded systems, which mainly occur due to the following
reasons:
· Network connectivity: embedded systems are now a days have networking capabilities including
wireless, which makes them vulnerable to many sources of attack.
· Dynamic and configurable environment: Embedded systems are generally deployed in environments
that are highly dynamic and configurable.

International Conference On Recent Trends In Engineering Science And Management ISBN: 978-81-931039-2-0
Jawaharlal Nehru University, Convention Center, New Delhi (India), 15 March 2015 www.conferenceworld.in
1057 | P a g e
· Software induced vulnerability: third party software downloaded from internet on embedded devices
are used in launching security attacks.
· Complexity : advances in embedded systems hardware and software technology enable the
development of increasingly complex embedded systems
The security techniques developed for enterprise and desktop computing cannot be directly applied to embedded
applications because of the strict design constraints of embedded systems such as cost, battery, size, processing
power and changing functional requirements of embedded systems with time. The software security techniques
developed mainly focus on detection and prevention, but do not focus on recovery from failures. Embedded
systems deployed in mission critical applications have chances of failure so recovery from failure is important in
embedded systems.
The paper is organized as follows. Section 2 presents the security requirements of embedded systems. Section 3
presents the attacks on embedded systems. Section 4 discusses the cryptographic requirements in embedded
systems and section 5 conclusion.
II. SECURITY REQUIREMENT OF EMBEDDED SYSTEMS
Embedded systems are employed in emerging applications in everyday life and are used in services that need
security. Security has long been a concern in computing and communications systems, and substantial research
effort has been devoted to addressing it. Especially the connectivity of embedded systems to networks or to the
Internet, places a significant requirement on the security. Considering the different types of attacks that have
been developed for the overall system and the context of the system use, the term security is used to indicate
different properties and services. To specify the requirements placed on systems for security, one needs to
identify the areas of applications and services where embedded systems are used. The requirements for security
should be considered from all perspectives, vendors, providers and customers [4]. Applications define the
security requirements, which need to be met through appropriate security mechanisms and policies. Thus it is
essential for embedded device to secure sensitive information, ensure availability and provide a secure
communication system. The common security requirements of many embedded systems are:
· Confidentiality: Ensures the protection of stored or transmitted sensitive data from accidental for
deliberate disclosure.
· Integrity: verifies the correctness and ensures that stored and transmitted sensitive data is protected against
corruption.
· Availability: ensures that system can perform its intended function and service users at all the times.
· Dependability: ensures that the system is fault tolerant and can run continuously for years without errors
and faults.
Cryptographic algorithms, including symmetric ciphers, public-key ciphers, and hash functions, form a set of
primitives that can be used as building blocks to construct security mechanisms that ensures authentication,
confidentiality and integrity of communicated data [3][5]. These mechanisms are known as functional security
mechanisms, since they only specify what functions are to be performed, irrespective of how these functions are
implemented. In order to provide complete security, one need to consider other factors such as profile of
attackers and the available resources for the provision of secure applications, as well. Dependability is basically

International Conference On Recent Trends In Engineering Science And Management ISBN: 978-81-931039-2-0
Jawaharlal Nehru University, Convention Center, New Delhi (India), 15 March 2015 www.conferenceworld.in
1058 | P a g e
a system requirement providing reliability, Availability, safety and maintainability in the event of accidental
and non malicious failures.
III ATTACKS ON EMBEDDED SYSTEMS
Attacks on embedded systems can be broadly categorized in two categories:
3.1 Hardware Attacks The hardware attacks on embedded systems can be classified in two categories:
(a) Physical Attacks: refer to the attacks that require physical intrusion into the embedded system to observe,
manipulate, and interfere with the system internals. For an embedded system on a circuit board attacks can
be launched by using probes to eavesdrop on inter-component communications. However, for a system-on-
chip, sophisticated microprobing techniques are used . The physical attacks are also known as invasive
attacks. Because invasive attacks typically require relatively expensive infrastructure, they are much harder
to deploy[1].
(b) Side Channel Attacks: attempts to exploit weakness in the implementation of design. They are also known
as non-invasive attacks. They are based on observing properties of the system while it performs
cryptographic operations. In the case of side channel attacks[7], the attacker treats the embedded system as a
black box and analyzes the inside of the system by feeding it various types of inputs and then observing the
behavior of the system and its output. These types of attacks are normally used to extract some secret
information from the embedded system. Generally, side channel attacks are mounted against hardware
implementations of various encryption algorithms so as to infer the secret key stored inside the hardware
security modules. The side channel attacks are of four types:
· Timing analysis: tries to infer the cryptographic key, by observing the execution times of
cryptographic computations on different data sets.
· Power Analysis: tries to infer the key used in cryptographic algorithm, by power consumption statistics
of cryptographic hardware over a wide range of data sets. Power analysis attacks are of two types:
Simple power analysis (SPA) attacks and Differential power analysis (DPA) attacks.
· Electromagnetic radiation analysis (EMA): attacks try to infer sensitive information by measuring the
electromagnetic radiation emitted by a device. Two classes of EMA attacks are: Simple EMA and
Differential EMA.
· Fault induction: the hardware module under attack is falsely activated or damaged and output pattern
for a given input is obtained. Fault injection attacks rely on varying the external parameters and
environmental conditions of a system such as the supply voltage, clock, temperature, radiation, etc., to
induce faults in its components. These attacks can be used to corrupt the secure or non-secure code or
data stored in components such as memories. Fault injection techniques are also useful as a pre-cursor
to software attacks.
3.2 Software Attacks
The software attacks refer to the attacks which are launched through software agents such as viruses, Trojan
horses, and worms and can compromise the security of the system from all stand points – confidentiality,
Integrity and Availability . These attacks exploits weakness inherent in the design and algorithm of the
embedded system. The software attacks are very cheap and does not requires any big infrastructures like

International Conference On Recent Trends In Engineering Science And Management ISBN: 978-81-931039-2-0
Jawaharlal Nehru University, Convention Center, New Delhi (India), 15 March 2015 www.conferenceworld.in
1059 | P a g e
physical attacks. The buffer overflow problem is a common problem in operating system and application
software, which can be exploited during software attacks. The buffer overflow effects can include overwriting
stack memory, heaps, and function pointers. The attacker can use buffer overflows to overwrite program
addresses stored nearby. This may allow the attacker to transfer control to malicious code, which when executed
can have undesirable effects. Software attacks can also be mounted by exploiting weakness in the end system
architecture. These are knows ass software vulnerabilities, which allows attacker to gain direct access to the end
system or may provide an entry point to indirectly exploit to gain access.
Fig-1 Attacks on embedded systems [1] IV. CRYPTOGRAPHY IN EMBEDDED SYSTEMS
The advent of worldwide communication system like Internet has made all companies, government agencies and
home users largely dependent on digital information and if security system is not implemented, then users have
a fear that their sensitive information can be monitored and stolen. Data security plays a central role in the
design of systems dependent on embedded systems. Specifically, unauthorized access to information must be
prevented, privacy must be protected, and the authenticity of electronic documents must be established. Thus
there is a need to develop security systems and the cryptographic algorithms are the core of such security
systems. [8]The field of cryptography started as a simple encryption technique, now can be used for
confidentiality, integrity, authentication and non repudiation of information. Cryptographic algorithms are cost
and computation power intensive, hence the cryptographic techniques applicable to desktop computers cannot
be directly applied to resource constraint embedded systems. The cost is one of the important aspect in design of
cryptography in embedded systems, therefore specialized implementations are done on embedded systems.
There are two major classes of algorithms in cryptography: Private-key or Symmetric-key algorithms and
Public-key or asymmetric algorithms. Symmetric algorithms are much faster to execute than asymmetric ones.
Symmetric ciphers serve mainly for message integrity checks, entity authentication, and encryption, whereas
asymmetric ciphers additionally provide key-management advantages and nonrepudiation. Asymmetric ciphers
are computationally far more demanding, in both hardware and software. Most often these two techniques are
used together, the encryption key is used to encrypt the actual message using a symmetric algorithm and an
asymmetric algorithm is used to exchange the encryption key. The cryptographic algorithms can be
implemented in hardware as well as software. Hardware based implementations have high performance but
International Conference On Recent Trends In Engineering Science And Management ISBN: 978-81-931039-2-0
Jawaharlal Nehru University, Convention Center, New Delhi (India), 15 March 2015 www.conferenceworld.in
1060 | P a g e
have less flexibility and high cost. On the other hand software based implementations are very flexible. The
main challenge is to design cryptographic techniques which can be efficiently executed on various platforms and
gives performance and cost tradeoffs.
· Symmetric key algorithms : two distinguished categories of symmetric key algorithms are stream and
block ciphers. The various symmetric key algorithms that have been implemented on 8 and 16 and 32
microcontrollers and microprocessor platforms are DES, 3DES, AES, IDEA, BLOWFISH, RC4, RC6 etc.
These have been implemented with variable length key sizes like 112 and 12 bit both in hardware as well
as software. The performance evaluation [9] of the algorithms shows that encryption throughput is highest
for AES. One major issue with symmetric ciphers is the secure key exchange .
· Asymmetric key algorithms: the various asymmetric or public key algorithms implemented in embedded
systems can be categorized in three families. The first category includes RSA algorithm based on integer
factorization problem, the second category includes Diffie-Hellman key exchange algorithm based on
discrete logarithm problem and last category includes elliptic curves algorithm(ECC). The performance
investigation of public key algorithms RSA (both 256 bit and 2048 bit ) and ECC on 8 bit and 32 bit
embedded platform [10][11] using a separate coprocessor shows that ECC gives same security as RSA
with less key size.
· The upcoming era is of pervasive computing[12], where there is an increasing demand for security in
applications such as smart cards and RFIDs to mobile devices. These devices have tight cost constraints
leading to the demand of efficient hardware and software implementations of cryptographic algorithms.
The existing methods of security [8]are very complex and expensive requiring more resources and time,
hence cannot be directly applied to these low cost and highly constraint pervasive devices.
· Light Weight cryptography : is one which can perform computationally intensive operations with limited
memory and power at an acceptable speed and without compromising on security emerges as a strong
security solution for pervasive devices like smart cards and RFIDs. The light weight cryptographic
solutions have to optimize the three design goals security, cost and performance. Several light weight
cryptographic variants of already existing algorithms have been proposed[12] and several new lightweight
cryptographic algorithms have also been proposed. Under light weight symmetric key algorithms are the
hardware implementation of DESL , DESXL, Present and Hight. And under light weight asymmetric key
algorithms is the hardware implementation of low area, stand alone coprocessor for ECC. The research is
going in this area for designing new ciphers with low implementation cost and providing acceptable level
of security.
V. CONCLUSION
We have introduced the basic security requirements and challenges of embedded systems and its applications .
It has been shown that embedded systems are essential parts of most communications systems today and wiill
be integral part of most of future IT applications, thus making then attractive as a potential platform for
hardware and software attacks discussed here. Thus data security plays an important role in the design of future
embedded systems and a platform for implementing cryptographic algorithms. We have shown that previous
implementations of symmetric and asymmetric algorithms are not efficient on resource constraint embedded
systems used in pervasive devices as they are very arithmetic intensive and expensive. The pervasive devices is
an upcoming field having tight cost and power constraints, thus there is a need to develop lightweight

International Conference On Recent Trends In Engineering Science And Management ISBN: 978-81-931039-2-0
Jawaharlal Nehru University, Convention Center, New Delhi (India), 15 March 2015 www.conferenceworld.in
1061 | P a g e
cryptographic algorithms for these devices. Several light weight variants of already existing cryptographic
algorithms have already been proposed, but still more research needs to be done in this area.
REFERENCES [1]. Srivaths Ravi , Anand Raghunathan , Paul Kocher , Sunil Hattangady, “ Security in embedded Systems :
Design Challenges” ACM Transactions on Embedded Computing Systems (TECS), v.3 n.3, p.461-491,
August 2004.
[2]. S. H. Mirjalili and A. Lenstra, “Security Observance throughout the Life-Cycle of Embedded Systems,”
ESA 2008, pp. 186-192.
[3]. Ravi, S.,Raghunathan, A., And Chakradhar,S,“Tamper resistance mechanisms for secure embedded
systems”, In Proceedings of the International Conference on VLSI Design. 605–611,2004.
[4]. Dimitrios N. Serpanos, Artemios G. Voyiatzis, “Security Challenges in Embedded systems”,ACM
Transactions on Embedded Computing Systems (TECS), v.12 n.1, March 2013.
[5]. Bruce Schneier, “Applied Cryptography: Protocols, Algorithms, and source code in C”, 2nd edition”,
Wiley October 1995.
[6]. Somesh jha,“Software Security Issues In Embedded Systems”, In Proceedings of the ARO Planning
Workshop on Embedded Systems and Network Security, North Carolina, February 22-23, 2007
[7]. Muhammad Farooq-i-Azam, Muhammad Naeem Ayyaz, “Embedded System Security”, In book “Cyber
security standards, practices and Industrial applications”, Junaid Ahmed and Athar Mahboob, chapter 10.
[8]. S. Sadanandan and R. Mahalingam,“Light weight cryptography and applications,” Novel Algorithms and
Techniques in Telecommunications , Automation and Industrial Electronics , 2008, pp. 484-488
[9]. Ondrej Hyncica, Pavel Kucera, Petr Honzik, Petr Fiedler,“Performance evaluation of symmetric
cryptography in Embedded systems”, in IEEE 6th international conference on Intelligent data acquisition
and Advanced computing systems(IDAACS),2011,pp 277-282.
[10]. HoWonKim, Sunggu Lee, “Design and Implementation of a private and public key crypto processor and
its application to a security system”, IEEE transactions on consumer electronics, vol.50, No. 1, Feb 2004.
[11]. Wang Long, Zhao Hue, Bai Guoqiang, “A Cost-efficient Implementation of Public-key Cryptography on
Embedded Systems”, Proc. of International Workshop on Electron Devices and Semiconductor
Technology, Beijing, China, 2007.
[12]. T. Eisenbarth, S. Kumar, C. Paar, A. Poschmann, and L. Uhsadel,"A Survey of Lightweight Cryptography
Implementations", IEEE Design and Test , vol. 24, no. 6, Nov. 2007, pp. 522-533.

International Conference On Recent Trends In Engineering Science And Management ISBN: 978-81-931039-2-0
Jawaharlal Nehru University, Convention Center, New Delhi (India), 15 March 2015 www.conferenceworld.in
1062 | P a g e
WIRELESS NETWORK DATA TRANSFER ENERGY OPTIMIZATION ALGORITHM
Alka P.Sawlikar1, Dr.Z.J.Khan2, Dr.S.G.Akojwar3 1, 3 Department Electronics Engineering, RCERT, Chandrapur, MS, (India)
2 Department Electrical Engineering, RCERT, Chandrapur, MS, (India)
ABSTRACT
Orthogonal Frequency Division Multiplexing (OFDM) is the most promising modulation technique. It has been
adopted by most wireless and wired communication standards. The idea is to utilize a number of carriers,
spread regularly over a frequency band, in such a way so that the available bandwidth is utilized to maximal
efficiency. The objective of this paper is to carry out an efficient implementation of the OFDM system (i.e.
transmitter and receiver) using different Encryption and compression algorithm for the energy optimization on
data transmission. The best combination for the algorithm is finding for the encryption and compression of the
data for the transmission and energy optimization.
Keywords: AES, Compression, Decompression, Decryption, ECC, Encryption, OFDM, RSA.
I. INTRODUCTION
In some applications, it is desirable to transmit the same information bearing signal over several channels. This
mode of transmission is used primarily in situations where there is high probability that one or more of the
channels will be unreliable from time to time. One form of this multichannel signaling is sometimes employed
in wireless communications systems as means of overcoming the effects of interference of the transmitted
signal.[1] By transmitting the same information over multiple-channels, provides signal diversity, which the
receiver can exploit to recover the information. Another form of the multichannel communications in multiple
carrier transmission, where the frequency band of the channel is subdivided into a number of sub-channels and
information is transmitted on each of the sub channels. In non-ideal linear filter channels it is observed that such
channels introduce ISI, which degrades performance compared with the idea channel. The degree of
performance degradation depends on the frequency response characteristics [1][2]. Furthermore, the complexity
of the receiver increases as the span of ISI increases. In this system, we consider the transmission of information
on multiple carriers contained within the allocated channel bandwidth. The primary motivation for transmitting
data on multiple carriers is to reduce ISI and thus, eliminate the performance degradation that is incurred in
several methods to implement the system.
Smartphone’s have become the essential components of our daily life; however, we are also frustrated with their
short battery life. One major source of the power consumption comes from the cellular interface which is used
for supporting mobile data[3]. In UMTS 3G network or 4G (HSPA+) network, multiple timers are used to
control the cellular interface, and the timeout value for releasing the radio resource can be more than 15
seconds. Thus, it is possible that the cellular interface continues to consume a large amount of energy (also
referred to as the long tail problem) before the timer expires, even when there is no network traffic. For
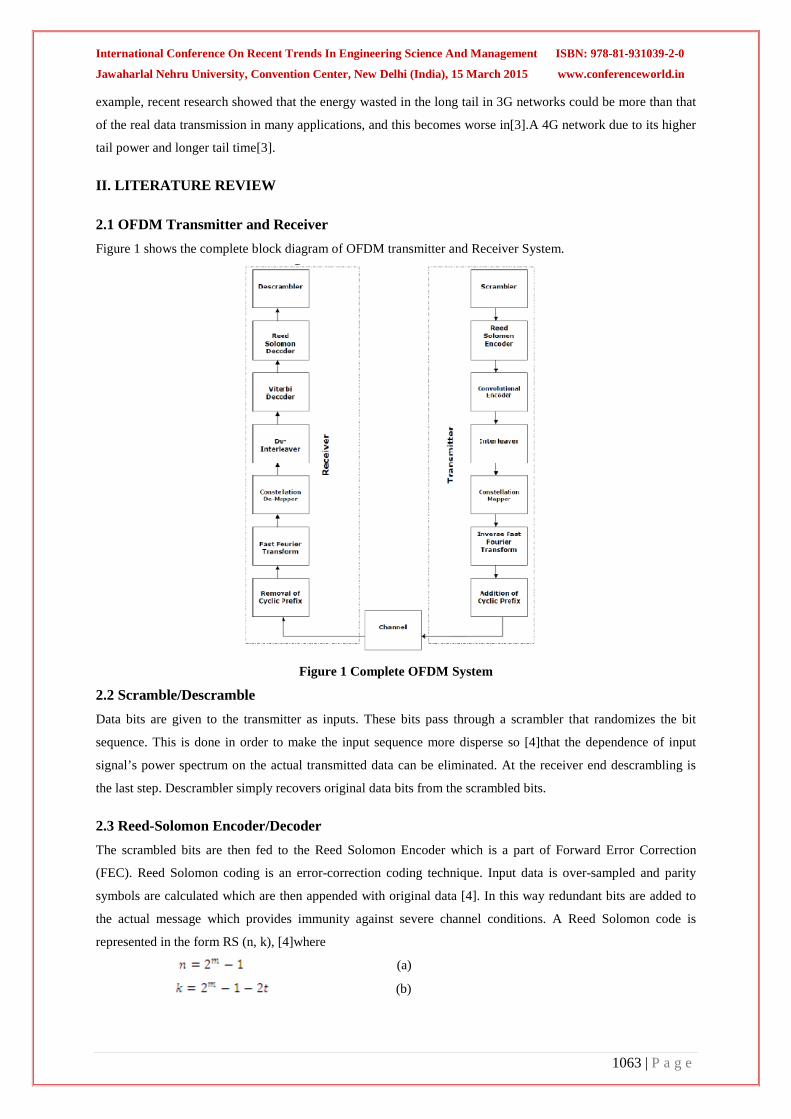
International Conference On Recent Trends In Engineering Science And Management ISBN: 978-81-931039-2-0
Jawaharlal Nehru University, Convention Center, New Delhi (India), 15 March 2015 www.conferenceworld.in
1063 | P a g e
example, recent research showed that the energy wasted in the long tail in 3G networks could be more than that
of the real data transmission in many applications, and this becomes worse in[3].A 4G network due to its higher
tail power and longer tail time[3].
II. LITERATURE REVIEW
2.1 OFDM Transmitter and Receiver Figure 1 shows the complete block diagram of OFDM transmitter and Receiver System.
Figure 1 Complete OFDM System
2.2 Scramble/Descramble Data bits are given to the transmitter as inputs. These bits pass through a scrambler that randomizes the bit
sequence. This is done in order to make the input sequence more disperse so [4]that the dependence of input
signal’s power spectrum on the actual transmitted data can be eliminated. At the receiver end descrambling is
the last step. Descrambler simply recovers original data bits from the scrambled bits.
2.3 Reed-Solomon Encoder/Decoder The scrambled bits are then fed to the Reed Solomon Encoder which is a part of Forward Error Correction
(FEC). Reed Solomon coding is an error-correction coding technique. Input data is over-sampled and parity
symbols are calculated which are then appended with original data [4]. In this way redundant bits are added to
the actual message which provides immunity against severe channel conditions. A Reed Solomon code is
represented in the form RS (n, k), [4]where
(a)
(b)

International Conference On Recent Trends In Engineering Science And Management ISBN: 978-81-931039-2-0
Jawaharlal Nehru University, Convention Center, New Delhi (India), 15 March 2015 www.conferenceworld.in
1064 | P a g e
Here m is the number of bits per symbol, k is the number of input data symbols (to be encoded), n is the total
number of symbols (data + parity) in the RS codeword and t is the maximum number of data symbols that can
be corrected. At the receiver Reed Solomon coded symbols are decoded by removing parity symbols.[4]
2.4 Convolution Encoder/Decoder Reed Solomon error-coded bits are further coded by Convolutional encoder. This coder adds redundant bits as
well. In this type of coding technique each m bit symbol is transformed into an n bit symbol; m/n is known as
the code rate. This transformation of m bit symbol into n bit symbol depends upon the last k data symbols,
therefore k is known as the constraint length of the Convolutional code[4]. Viterbi algorithm is used to decode
convolutionaly encoded bits at the receiver side. Viterbi decoding algorithm is most suitable for Convolutional
codes with k_10.
2.5 Interleaver/De-Interleaver Interleaving is done to protect the data from burst errors during transmission. Conceptually, the in-coming bit
stream is re-arranged so that adjacent bits are no more adjacent to each other. The data is broken into blocks and
the bits within a block are rearranged[4]. Talking in terms of OFDM, the bits within an OFDM symbol are
rearranged in such a fashion so that adjacent bits are placed on non-adjacent subcarriers. As far as De-
Interleaving is concerned, [4]it again rearranges the bits into original form during reception.
2.6 Constellation Mapper/De-Mapper The Constellation Mapper basically maps the incoming (interleaved) bits onto different sub-carriers. Different
modulation techniques can be employed (such as QPSK, BPSK, QAM etc.) for different sub-carriers. The De-
Mapper simply extracts bits from the modulated symbols at the receiver.[4]
2.7 Inverse Fast Fourier Transform/ Fast Fourier Transform This is the most important block in the OFDM communication system. It is IFFT that basically gives OFDM its
orthogonality.[4] The IFFT transform a spectrum (amplitude and phase of each component) into a time domain
signal. It converts a number of complex data points into the same number of points in time domain[5]. Similarly,
FFT at the receiver side performs the reverse task i.e. conversion from time domain back to frequency domain.
2.8 Addition/Removal of Cyclic Prefix In order to preserve the sub-carrier orthogonality and the independence of subsequent OFDM symbols, a cyclic
guard interval is introduced. The guard period is specified in terms of the fraction of the number of samples that
make up an OFDM symbol. The cyclic prefix contains a copy of the end of the forthcoming symbol. Addition of
cyclic prefix results in circular convolution between the transmitted signal and the channel impulse response.
Frequency domain equivalent of circular convolution is simply the multiplication of transmitted signal’s
frequency response and channel frequency response, therefore received signal is only a scaled version of
transmitted signal (in frequency domain),[4] hence distortions due to severe channel conditions are eliminated.
Removal of cyclic prefix is then done at the receiver end and the cyclic prefix–free signal is passed through the
various blocks of the receiver.

International Conference On Recent Trends In Engineering Science And Management ISBN: 978-81-931039-2-0
Jawaharlal Nehru University, Convention Center, New Delhi (India), 15 March 2015 www.conferenceworld.in
1065 | P a g e
2.9 AES Algorithm The algorithm originates from the initiative of the National Institute of Standards and Technology (NIST) in
1997 to select a new symmetric key encryption algorithm. From the initial candidates [4]. Rijndael algorithm
was selected as the Advanced Encryption Standard (AES) [5] due to the combination of security, performance,
efficiency, ease of implementation and flexibility[6]. Rijndael is a symmetric byte-oriented iterated (each
iteration is called a round) block cipher that can process data blocks of 128 bits (4 words), using keys with
length of 128, 192 and 256 bits. Rijndael is capable of processing additional block sizes (160, 192 and 244 bits)
and key lengths (160 and 244 bits), however they are not adopted in AES. Our implementation refers to AES
algorithm.
2.10 RSA Algorithm In 1978, Ron Rivest, Adi Shamir, and Leonard Adleman introduced a cryptographic algorithm, which was
essentially to replace the less secure National Bureau of Standards (NBS) algorithm[7]. Most importantly, RSA
implements a public-key cryptosystem, as well as digital signatures[8]. RSA is motivated by the published
works of Die and Hellman from several years before, who described the idea of such an algorithm, but never
truly developed it [8][9].
2.11 ECC Algorithm Elliptic curve cryptography (ECC) is an approach to public-key cryptography based on the algebraic structure of
elliptic curves over finite fields. Elliptic curves are also used in several integer factorization algorithms that have
applications in cryptography, such as Lenstra elliptic curve factorization. Elliptic curves were proposed for use
as the basis for discrete logarithm-based cryptosystems, independently by Victor
Miller of IBM and Neal Koblitz At that time, elliptic curves were already being used in various cryptographic
contexts, such as integer factorization and primality proving. The use of elliptic curves in cryptography was
suggested independently by Neal Koblitz and Victor S. Miller in 1985[10][11][12][13].
2.12 Hill Algorithm In classical cryptography, the Hill cipher is a polygraphic substitution cipher based on linear algebra. Invented
by Lester S. Hill in 1929, it was the first polygraphic cipher in which it was practical (though barely) to operate
on more than three symbols at once. The following discussion assumes an elementary knowledge of matrices.
Each letter is represented by a number modulo 26. (Often the simple scheme A = 0, B = 1, ..., Z = 25 is used, but
this is not an essential feature of the cipher.) To encrypt a message, each block of n letters (considered as an n-
component vector) is multiplied by an invertible n × n matrix, again modulus 26. To decrypt the message, each
block is multiplied by the inverse of the matrix used for encryption[14].
III. PROPOSED METHOD
In this paper we proposed the method for transfer the data from the network by using the encryption and
compression method. We used the several combination of the encryption and compression algorithm to obtain
the best combination for the energy optimization. For transmission and Receiver of the data in the network we
used OFDM.
Block Diagram shows the overall implementation of the proposed methodology.

International Conference On Recent Trends In Engineering Science And Management ISBN: 978-81-931039-2-0
Jawaharlal Nehru University, Convention Center, New Delhi (India), 15 March 2015 www.conferenceworld.in
1066 | P a g e
IV. FIGURES AND TABLES
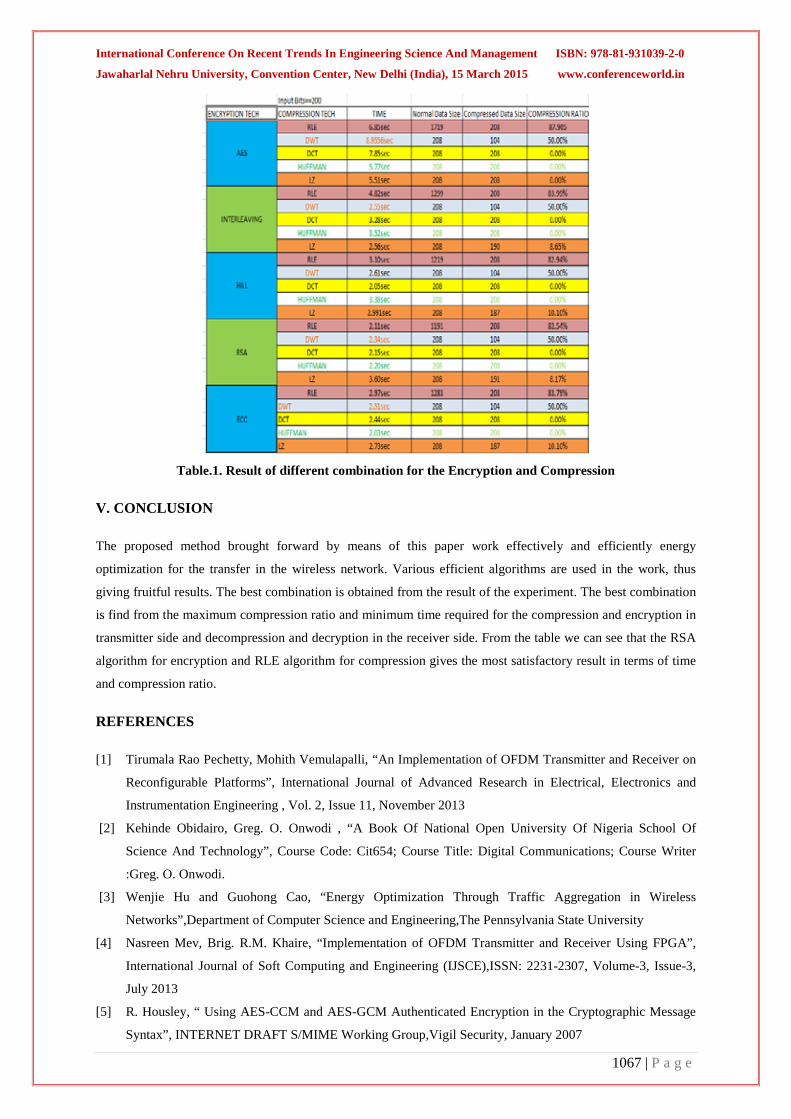
International Conference On Recent Trends In Engineering Science And Management ISBN: 978-81-931039-2-0
Jawaharlal Nehru University, Convention Center, New Delhi (India), 15 March 2015 www.conferenceworld.in
1067 | P a g e
Table.1. Result of different combination for the Encryption and Compression
V. CONCLUSION
The proposed method brought forward by means of this paper work effectively and efficiently energy
optimization for the transfer in the wireless network. Various efficient algorithms are used in the work, thus
giving fruitful results. The best combination is obtained from the result of the experiment. The best combination
is find from the maximum compression ratio and minimum time required for the compression and encryption in
transmitter side and decompression and decryption in the receiver side. From the table we can see that the RSA
algorithm for encryption and RLE algorithm for compression gives the most satisfactory result in terms of time
and compression ratio.
REFERENCES
[1] Tirumala Rao Pechetty, Mohith Vemulapalli, “An Implementation of OFDM Transmitter and Receiver on
Reconfigurable Platforms”, International Journal of Advanced Research in Electrical, Electronics and
Instrumentation Engineering , Vol. 2, Issue 11, November 2013
[2] Kehinde Obidairo, Greg. O. Onwodi , “A Book Of National Open University Of Nigeria School Of
Science And Technology”, Course Code: Cit654; Course Title: Digital Communications; Course Writer
:Greg. O. Onwodi.
[3] Wenjie Hu and Guohong Cao, “Energy Optimization Through Traffic Aggregation in Wireless
Networks”,Department of Computer Science and Engineering,The Pennsylvania State University
[4] Nasreen Mev, Brig. R.M. Khaire, “Implementation of OFDM Transmitter and Receiver Using FPGA”,
International Journal of Soft Computing and Engineering (IJSCE),ISSN: 2231-2307, Volume-3, Issue-3,
July 2013
[5] R. Housley, “ Using AES-CCM and AES-GCM Authenticated Encryption in the Cryptographic Message
Syntax”, INTERNET DRAFT S/MIME Working Group,Vigil Security, January 2007

International Conference On Recent Trends In Engineering Science And Management ISBN: 978-81-931039-2-0
Jawaharlal Nehru University, Convention Center, New Delhi (India), 15 March 2015 www.conferenceworld.in
1068 | P a g e
[6] Nithya, Dr.E.George ,Dharma Prakash Raj, “ Survey on asymmetric key cryptography algorithms”,
Journal of advanced computing and communication technologies,vol no. 2,issue no,1,ISSN-2347-2804.
[7] Evgeny Milanov ,”A Report on:The RSA Algorithm”.,3 June 2009.
[8] Pabitra Kumar Das, Crocmaster ,“A research paper on RSA Encryption part I” , Hackshark , Aug 27,
2012
[9] Daniel J. Bernstein and Chitchanok Chuengsatiansup and Tanja Lange , “A Report on :New ECC Curve
Bumps Speed/Security Baseline”, July 10 2014.
[10] Kristin Lauter, “The Advantages Of Elliptic Curve Cryptography For Wireless Security”,IEEE Wireless
Communications , February 2004,1536-1284
[11] International journal of advanced scientific and technical research Issue 3 volume 3, May-June 2013
[12] An article on Hill cipher , Wikipedia February 2012
[13] B. Zhao, Q. Zheng, G. Cao, and S. Addepalli, “Energy-Aware Web Browsing in 3G Based Smartphones,”
in IEEE ICDCS, 2013.
[14] Hero Modares, Amirhossein Moravejosharieh, Rosli Salleh, “Wireless Network Security Using Elliptic
Curve Cryptography”, 2011First International Conference on Informatics and Computational Intelligence.
[15] Nguyen Toan Van, “Hardware Implementation Of OFDM TransmitterAnd Receiver Using FPGA”
[16] C.K.P.Clarke,” Reed Solomon Error Correction”, Research & Development British Broadcasting
corporation July 2002


![=QX;CO=][G==JPU? K=RWR31L30ODH0IO:OBKFNT0J:D?DDN … · 2015. 8. 24. · gp@=odb v9c =oc4c@f u@4d@pbf k=rwr31l30odh0io:obkfnt0j:d?ddn p55o? jo1ogp4o0od>dpkod0odhr0io](https://static.fdocuments.in/doc/165x107/6114ca0ab8ed6321385bf796/qxcogjpu-krwr31l30odh0ioobkfnt0jdddn-2015-8-24-gpodb-v9c-oc4cf.jpg)