INTERNATIONAL COMMISSION ON IRRIGATION AND DRAINAGE
101
INTERNATIONAL COMMISSION ON IRRIGATION AND DRAINAGE
Transcript of INTERNATIONAL COMMISSION ON IRRIGATION AND DRAINAGE

INTERNATIONAL COMMISSION ON IRRIGATION AND DRAINAGE

THE WATSAVE SCENARIO ( i i )
GLOSSARY OF TERMS AND ABBREVIATIONSUSED IN THE TEXT OR TABLES
BCM ............................................... Billion Cubic Meter (Km3)MCM ............................................... Million Cubic MeterCum/m3 .......................................................................... Cubic Meterha ................................................... HectareM .................................................... Millionm .................................................... MeterTIA .................................................. Total Irrigated AreaIA .................................................... Irrigated AreaGW ................................................. Ground WaterSW ................................................. Surface WaterBI .................................................... Border IrrigationCI .................................................... Contour IrrigationFI .................................................... Furrow IrrigationSp ................................................... SprinklerNP .................................................. Non-point SourceMunic. ............................................. Municipalindus. ............................................. Industrialagr. ................................................. AgricultureEPA ................................................ Environmental Protection AgencyFEPA .............................................. Federal Environmental Protection AgencyO&M ............................................... Operation & MaintenanceMC .................................................. Main CanalDC .................................................. Distributory CanalFC .................................................. Field Channelsys. oper ........................................ System OperationNL .................................................. National LevelMO/Min. .......................................... Ministry ofR&D................................................ Research and DevelopmentDOE ............................................... Department of EnvironmentMOAG ............................................ Ministry of AgricultureMONR ............................................ Ministry of Natural ResourcesMOPH ............................................ Ministry of Public HealthMOPWWR ..................................... Ministry of Public Works and Water ResourcesConstn. ........................................... ConstructionVeg ................................................. VegetablesDO .................................................. District OfficerWDD .............................................. Water Development DepartmentCoop. ............................................. CooperativeMultidisc. ........................................ MultidisciplinaryExt. ................................................. Extension

THE WATSAVE SCENARIO ( i i i )
TABLE OF CONTENTS
Foreword (iv)
Glossary of terms (ii)
I. Introduction 1
II. An overview of responses 3
III. Country specificities 25
IV. Pace setting successes 63
V. Looking forward 73
Acknowledgement 85
Appendices 89
THE WATSAVE SCENARIO ( i v )
FOREWORD
The Earth Summit’s Agenda 21 adopted by the 178 participating countries atRio-de-Janeiro in June 1992 stressed the need for ensuring adequate foodand water for all the people on this globe. Crop production is to be increased
by 3-4 percent per annum amongst others, mainly by increase in the productivity ofthe agricultural use of water. Demands on available fresh water are bound toincrease due to growth of population and improved life styles. Use of water inagriculture must therefore be handled very meticulously. Towards this end ICID hasinitiated a Watsave movement through its Hague declaration in 1993.
Pursuant to this, an informative booklet was published in 1995 on the basis of thepreliminary information received by ICID about the Water Saving practices adoptedby some of its leading member countries. Soon thereafter, a questionnaire was sentto 66 countries inviting detailed information on their activities for water saving. Thequestionnaire sought information about all aspects of water uses and about theprocedures and controls established for saving water. Information was also requestedabout the potential for reuse of municipal waste water, industrial effluents and/or useof recycled drainage water or desalinated water.
ICID was very happy to receive responses from as many as 27 countries aroundthe world. Four of those submitted only brief notes about their activities but sevencountries furnished data from their case studies also. The coverage in terms of areairrigated in the world as represented by these 27 responses is quite large i.e. 60%of the world’s irrigated area. The responses from Africa represent 40% of theirrigated area of the continent and Asian responses constitute 92% of the irrigatedarea in Asia. It is true that the south American experience is not yet well reflected-with only 14% of irrigated area being represented by the responses received. Thepurpose of this document is to share the compiled information with all the managersof water and agriculture and to promote greater interest in the management ofwater at large and in the management of irrigation water in particular to achieve theobjective of Watsave. ICID is grateful to the National Committees of Australia,Austria, Bangladesh, Chile, China, Cyprus, Egypt, France, Germany, India,Indonesia, Israel, Italy, Republic of Korea, Malaysia, Mongolia, Nigeria, Pakistan,Slovenia, South Africa, Spain, Thailand, Turkey, United Kingdom, United States ofAmerica and Zambia and Chinese Taipei Committee for the valuable informationfurnished by them in response to the questionnaire. This document would not havebeen possible but for their efforts in compiling and transmitting the neededinformation.
Inspite of some limitations of the responses from the Committees, some patterns inWatsave practices are clearly discernible from the replies. They have beenhighlighted in this compilation. Examples of the Watsave practices already in vogueand the important features of some of the Watsave programs are also highlighted

THE WATSAVE SCENARIO ( v )
in this publication. These together indicate the path that may have to be taken in thefuture.
The information received from the responding National Committees ran into severalhundred pages. It was a herculean task to collate all this information into ameaningful form and present it in useful manner. Mr. B.S. Rajvanshi, who wasspecially appointed in the central office as officer on special duty for the purposecarried out this task admirably well. He deserves our grateful thanks for thestupendous work.
Here I would also like to gratefully acknowledge the continuous encouragement andsupport provided to the ICID Central office, and individually to me also, in theconceptualisation and the development of this document, by Mr. John Hennessy,President Hon. ICID and the Chairman of the ICID Watsave team. It wasMr. Hennessy, who, as a president ICID. had initiated the launching of the Watsaveprogramme of ICID in the year 1993 at the ICID congress at the Hague on the subjectof “Water management in the Next Century.” Again it was Mr. Hennessy, whoorganised the development of a critical and exhaustive questionnaire to seekinformation on the water-use practices and regulatory measures from ICID membercountries. His constructive suggestions on the outline and the preliminary text of thisdocument had been very helpful in shaping the document in a proper andmeaningful form.
Undertaking of intensive work on the analysis of the voluminous informationreceived from the member Committees in response to the ICID. questionnaire andthe development of a useful format and a meaningful text for the document waspossible only because of the generous financial support of US $ 10,000 received bythe ICID. Central Office from USBR. ICID is grateful to USBR for the initialpacesetting innovative work on the setting up of the questionnaire as a member ofthe Watsave team and their subsequent financial support for the required follow up.
In compiling, summarizing and interpreting the information received, it is possiblethat there may have been some omissions and even alterations. But rather thanwithholding or delaying this book for further checks or cross-checks, it wasconsidered desirable to make it available to the water community at large early forgenerating further active interest in the topic of Watsave. Hopefully a revised andmore refined enlarged version should be possible after a couple of years.
It is hoped that this ICID compilation will serve as a useful source of informations andinspirations for all the managers of water and agriculture.
New Delhi M.A. Chitale28 December 1997 Secretary General
THE WATSAVE SCENARIO 1
I. INTRODUCTION
The availability of fresh water in the world is finite, whereas demands on thisfinite quantity are continuously increasing. For ensuring food security ofthe increasing population, the agricultural productivity must increase.
Production of foodgrains is very much dependent on availability of water. Around70% of the harnessed water is currently diverted for use in agriculture. Whileaiming at the increases in crop production, agriculture will have to make do withlesser-than-present fresh water quantum by adopting scientific methods forirrigation and by resorting to improved technologies for saving water so that watercan be made available for other competing uses in municipal and industrialsectors.
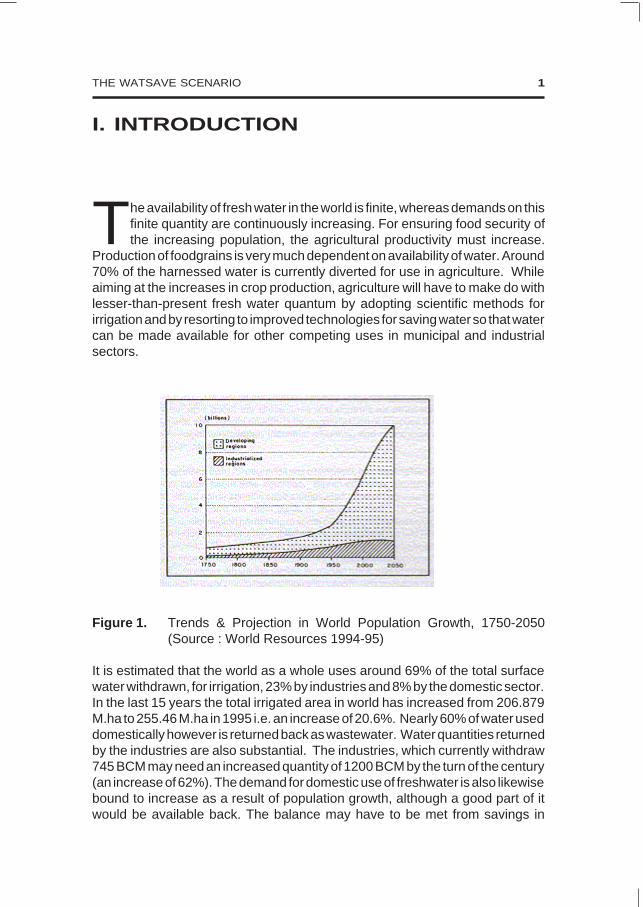
Figure 1. Trends & Projection in World Population Growth, 1750-2050(Source : World Resources 1994-95)
It is estimated that the world as a whole uses around 69% of the total surfacewater withdrawn, for irrigation, 23% by industries and 8% by the domestic sector.In the last 15 years the total irrigated area in world has increased from 206.879M.ha to 255.46 M.ha in 1995 i.e. an increase of 20.6%. Nearly 60% of water useddomestically however is returned back as wastewater. Water quantities returnedby the industries are also substantial. The industries, which currently withdraw745 BCM may need an increased quantity of 1200 BCM by the turn of the century(an increase of 62%). The demand for domestic use of freshwater is also likewisebound to increase as a result of population growth, although a good part of itwould be available back. The balance may have to be met from savings in

THE WATSAVE SCENARIO 2
agriculture-wherever water uses have been stretched to the limit of their naturalavailability. On the other hand, irrigated areas in the world are expected toincrease by about 19% during the next fifteen years, drawing 17% more from theavailable fresh waters. Unless new policies for sustainable irrigated agricultureare chieseled out to implement water savings, the future may be grim in manyparts of the world.
International Rice Research Institute (IRRI), Philippines, rendering Yeoman’sservice to the rice growers of Asia have promoted practices or developedvarieties for increasing water productivity in the rice crop. Successes have beennoticed in central Luzon of Philippines and Muda irrigation scheme of Malaysia.A key note “More rice with less water”, specially contributed by Mr. Kenneth S.Fischer, Deputy Director General for Research in the IRRI has been included inthis compilation as an appendix to the Chapter on WatSave Successes. As riceis regarded as one of the high water consuming crop, this note has a specialsignificance in the WatSave document of ICID.

THE WATSAVE SCENARIO 3
II. AN OVERVIEW OF RESPONSES
Encouraged by the responses to the first WatSave questionnaire circulatedin 1993-94, the ICID WatSave Team, as a second step in the learningmode devised another questionnaire seeking more detailed and systematic
information on issues and concerns which have complex inter-relationship in theWater Resource Management for understanding the procedures for administrationof water and for identifying the achievements in WatSave. It also sought forinformation on case studies and about the examples of successful waterconservation programmes with data on measures adopted, quantum of watersaved and the costs of programmes to assess as to how far could those bereplicated elsewhere. The questionnaire was sent to 66 active membercountries of ICID. It called for information not only about the aspects of irrigationwater use but also about the procedures and controls for other water uses.Information was also sought on efforts for augmentation of supplies through thereuse of municipal wastewater, industrial effluents, and of recycled drainagewater or desalinated water.
Detailed responses from 23 countries were received, four having furnished onlybrief general notes about their activities. Seven countries furnished detailedinformation about some specific case studies also. The responses from the 27countries together form the main basis of this document. To supplement itfurther, related information pertaining to some other countries has been obtainedfrom published journals and other published documents such as FAO ProductionYearbook’95/96, World’s Water Resources’94-95, workshop/seminarproceedings, country papers, Proceedings of International Conferences, includingthose of ICID. In cases where the replies furnished appeared incoherent, someefforts were made to reconcile the position with information available in publisheddocuments.
The responding countries together represented 60% of the world’s irrigated areaof 255.46 M.ha [FAO Production Book Vol.50, 1996]. The responses werereceived from the following countries from the different regions of the world.
(i) Africa - Responding countries; Egypt, Nigeria, South Africa and brief notefrom Zambia. [Irrigation area of the continent represented : 40%].
(ii) Asia - Responding countries; China, Cyprus, India, Israel, Indonesia,Korea, Malaysia, Mongolia, Pakistan and Turkey. [Irrigated area ofcontinent represented: 92%]
(iii) Europe - Responding countries; Austria, France, Germany, Italy, Slovenia,United Kingdom. [Irrigated area of the continent represented : 51%]

THE WATSAVE SCENARIO 4
ARAL SEA TEAM OF ICID
A special Work Team of ICID has been established in 1994 to work with theinternational agencies like the World Bank, UNDP, UNEP who are supportingthe development of a plan of action to tackle Aral Sea Basin issues such assalinity control, conjunctive use of water, quality of agricultural water,automated control and reuse of drainage water. A special technical sessionwas organised by the ICID on 24 April 1996 on the problems of the basinat the International Drainage Workshop held in Slovenia when the basinstates could also participate with the active financial support from the WorldBank. An Aral Sea Basin programme’s Phase I costing US$ 470 M hasbeen in place. It is being implemented through multilateral funding by theWorld Bank, UNDP, UNEP and others. Major regional issues to beaddressed are, informative improvement, management of transboundaryresources, increasing water use efficiency, water quality control, salinitymanagement and improving the implementation capability of the basinstates. ICID proposes to play an active role in providing the requiredtechnical inputs for the successful implementation of the programmes.
(iv) North and Central America: United States of America [Area representedof the continent : 60%]
(v) Oceania: Australia
(vi) South America: Chile [A brief note representing 14% of the irrigated areaof the continent]
In addition, Chinese Taipei Committee and the National Committee of Spainhave furnished notes on the states of water resources and other activities whichhave also been taken note of while compiling this book.
Agroclimatic Significance
Looked at from the agroclimatic point of view, large countries like Australia, India,Pakistan, China and USA represent the aggregate experience of manyagroclimatic regions, while others broadly represent one or two specificagroclimatic characteristics. Thus, Austria, China, Cyprus, France, Germany,Italy and Turkey have areas representing dry, sub-tropical climate with hot anddry summers, cool and moderately rainy winters. Slovenia, Chinese (Taipei),UK have areas in Humid sub-tropic climate with cold winters and precipitation inall seasons, the maximum being in the long and warm summers.
Chile and Pakistan have large areas with semi-arid mid-latitude climate with lightprecipitation, warm or hot summers and cool or cold winters. Mongolia has aridmid-latitude pattern with extremely light precipitation, warm or hot summers withcool or cold winters. South Africa is faced with light precipitation, rapid

THE WATSAVE SCENARIO 5
evaporation in all the months. Egypt, North-West India, South-East Pakistan andIsrael lie in hot arid climatic zone with negligible precipitations, rapid evaporationand with all months as hot or warm.
Korea has Temperate marine climate with rainy days in all seasons, moderatetotal precipitation, warm runners and cool winters.
The countries also have different irrigation practices. The three respondingcountries from the African region irrigate about 70% of their areas under Border/Contour/Furrow surface gravity methods and only about 30% lies under modernpractices. In fact only two African countries, Egypt and South Africa adoptmodern methods. In the eleven countries of the Asian region the traditionalmethods of irrigation are followed in 96% of their irrigated area, only 2% of thearea is under modern methods like sprinkler or drip. On the other hand EuropeanRegion has 82% of its irrigated area under modern methods and only 14% isunder surface gravity system. In USA area under modern methods is significant.
Source of irrigation water is widely different in different countries with Indiahaving as much as nearly 50% of their irrigation from groundwater followed by43% of USA 27% of China and 25% of Pakistan. It is interesting to note that themain stay of Austrian and German irrigation is groundwater (80% and 90%respectively). Physiography, climate and hydrology have a dominant role in thisrespect. The balance of these is that the different countries clearly stand on adifferent footing with reference to the WatSave practices.
The current status of water supply, withdrawals, augmentation by reuse andirrigated area is compiled in Table 1, while areas under surface or ground watersources and that irrigated by gravity or modern techniques is summarised inTable 2.
The comprehensive assessment of the world’s water resources carried out onbehalf of the UN Agencies in 1997, placed the worlds’ countries under four broadcategories: (i) High income countries with low water stress, (ii) High incomecountries with high water stress, (iii) Low income countries with low water stressand (iv) Low income countries with high water stress. The first two categorieshave the financial resources to deal with the situations as they arise. But the nexttwo categories may suffer flooding or acute water shortages as they do not haveenough financial resources to tackle the problems. It is hoped that countriesfacing the water stress will be able to get some clues from this compilation forovercoming their problems arising from water shortage.
(i) In the high income group countries with low water stress, the mainproblem is water pollution but they can meet with the situation owing totheir financial resources.
(ii) As regards the high income countries with high water stress, they facestress due to continuous overuse or pollution, groundwater depletion in

Country
AustriaChinaCyprusFranceGermanyItalySpainTurkey
SloveniaUKChinese Taipei
IndonesiaMalaysia
MongoliaSouth AfricaIndiaPakistanNigeriaThailandBangladesh
EgyptIsrael
Korea
Australia
USA
Table 1. Current supply, withdrawals, use and irrigated areas
SW
7044760100<–40
94.395
500INA5.6
7.25566
.2253.5362178267210–
55.5.65
23.2
117.6
<–
GW
2088.5301
<–1220
13.8
––
7.1
N64
.245.419053532.5–
0.71.05
1.7
2.04
<–
RU
––
1.67.6N.5.86–
––
4.9
––
.034.6–––––
–.22
N
–
N
DS
––
0.66––>.05.03–
–––
––
–N–––––
.4.008
N
–
–>
Total
90535.591.6108.6
–>52.55115.19108.8
500–
17.6
7.25630
.4963.5552231320
212.5–
61.51.928
24.9
119.64
–>
Current Supply BCM Anticipated Supply BCM (2015)
SW
–514105100–>46––
––N
<––
<–107700––––
57.5.6
29.5
120
–>
GW
–108301
–>14.5
N–
––N
N–
N17350
––––
1.2.92
2.15
5.6
–>
RU
–N4
8.7–
.15–>–
––N
–>–
–N–––––
3.4,12.8.50
–
Yes
–>
DS
–N––––––
––N
–>–
–N–––––
.5.08
–
–
–>
Total
90622139
109.7–>
63.6––
700–23
–>–
–124
1050231320
212.5–
75.42.10
31.6
125.6
–>
Currentwithdr.BCM
(1995)
2.55525215.752.444.737.140.2
N11.617.6
0.2611.6
0.4721552N
8.9788.7
–
63.31.8
30.2
16.84
563.5
Qty
0.238515.52.42.1
22.924.2
N
–.14
13.5
N9
0.2810.664601315.4648.17
–
50.83
21
16
195.5
%
873744244965N
–177
–77
605183–6155–
7946
69
95
35
Current allocationto irrigation BCM
(1995)
Antici.w i t h d r .2015 AD
BCM(2015)
3.868231.17.273.345.337.140.2
–11.7
23(2021)
N15.2
0.4723
750–N
118–
85.32.1
42.8
18.5
788
Antici.alloca.to Agr.BCM
INA38518.72.62.723
24.2–
–.1615
–10.4
0.2812.7630–N
50.27–
62.85
21
17.7
195
Irrigated areaM.ha
Current(1995)
.0850
.0332.38.532.713.43.8
.0065N
.46
.080.29
.0351.2276
13.960.254.83
–
3.23.22
.96
1.80
19.99
Antici.2015
.09660.3.0753.98.64N
3.725.80
4.5N
0.61
N0.29
Reducing1.40139
20.640.756.10
–
4.07.22
0.63
2.34
23.98
RU – Reuse, DS – Desalinated, N – Information not available/not furnished, Antici – Anticipated. 6

PercentageModern.6/2 x 100
8
11001.497144710013N1.1.6–91N–826033N
1.3N27
Country
1
AustraliaAustriaChinaCyprusEgyptFranceGermanyItalyIndonesiaIsraelIndiaKoreaMalaysiaMongoliaNigeriaPakistanSloveniaSouth AfricaSpainThailandTurkeyUKUSA
Table 2. Irrigated Areas and Cultivation Practices (1994-1995)
Irrigated Area (M.ha) Irrigation Practices (M.ha) adopted
Modern
7
.019.08.83.032.451.12.53.345
N0.220.78.006
N.032
NExp.005.72
1.132N
.050N
5.27*
Surface Gravity
6
1.791N
48.62.0012.781.25
–NN–N
.95.294
NN
13.96N.5
2.268N
3.75N
14.72
Total
2
1.81.0850
.0333.232.37.532.71
N.22
76.16.956.294.035
N13.96.0061.223.4
4.8353.8N
19.99
Surface
3
1.71.0036.7.0142.78INA.106
NN
.07537.58.801.294.034
N10.47.0011.0N
4.8353.4N
11.34
Ground
4
0.10.0813.3.0190.12
N.424
NN
.10538.58.155
N.001
N3.49.005.22NN.4N
8.64
Percentage areaof total under-ground water
5
5.59027
57.53.7–80––
47.750.616–28–25
23.318––
10.5–43
* Includes sub-surface irrigation, N = Not furnished, Exp. = Experimental 7
THE WATSAVE SCENARIO 8
near future. They would be left with little water for supply to human usesthrough conventional means and/or without causing a damage on aquaticecosystem or further/serious depletion of groundwater aquifers.
(iii) Low income countries (income less than US $ 796) with low water stressare large countries of tropical region having abundant water resourcesand may suffer from too much water by way of floods due to short rainyseasons. But, being poor they are unable to supply drinking water orsanitation. Another sub-category under this set is of those who have littlewater and owing to poor resources are not able to tap much of theresources or resort to reuse of their wastewaters.
(iv) Low income countries with high water stress. A number of countries in aridor semi-arid regions of Africa and Asia fall under this country. Currentlythey use water heavily, mostly for food production. They are also unableto prevent pollution. The constraints in future development will furtheraggravate the problems. Thus the net availability of water in the future willhave to be correctly understood in the context of the country’s capacity toprevent pollution or treat the polluted waters for reuse, particularly wherethe natural availability of water is very low.
Water Pollution and Pollution Control
Water pollution and its control will have a significant and distinct impact not onlyon the environment but on the sustainability of the irrigation activity also. Of the23 responding countries, 16 countries namely Australia, Austria, China, Egypt,France, Israel, India, Indonesia, Korea, Mongolia, Germany, Italy, Pakistan,Slovenia, USA and Thailand have reported about polluting sources. The countrieswho have already experienced limitation in the use of water for agriculture onaccount of pollution situation are UK, China, France, Italy, Indonesia, Korea,Mongolia, Pakistan, Slovenia, South Africa, Thailand and USA.
Various point or non-point sources in the descending order of their mentions asmade by the responding countries are listed below:
A. Point Sources (in descending order of mentions)
Industrial Wastewater 16
Municipal Wastewater 14
Farms/Dairy/Piggery 4(Israel, Italy, Slovenia, China)
Agriculture Drainage 2(Egypt, Italy)
Thermal releases 1(Egypt)
Leather Industry 1(Mongolia)
Mining Industry 1(Mongolia)

THE WATSAVE SCENARIO 9
B. Non-point sources (in descending order)
Nutrients washoff 4(USA, Israel, Italy & China)Agriculture Land Washings 4(Egypt, France, Slovenia & Mongolia)Land use 2(Austria, Egypt)Fertilizers/pesticides 2(Italy, Israel)Ground water flux 1(Egypt)
From this list it is clear that the major risk is from the Industrial and Municipalwaste waters. But agricultural wash-off and livestock farms also pose a problemin many developed countries. Standards established for water quality by countriesare shown in Appendix G.
Monitoring of Water Pollution
Fortunately most of the countries have reported that water pollution controlagency (s) do exist in their countries. Water quality standards for monitoringhave also been set by Austria, Australia, China, Cyprus, Egypt, France, Germany,India, Israel, Italy, Indonesia, South Africa, Turkey, USA, United Kingdom and inmost of them, relevant acts/rules have also been promulgated. In large countrieslike India, the states play a key role in monitoring the water quality while someapex body (s) at the National level such as a Central Pollution Control Boardsoversee the activities in States and also set the national standards. Cyprus andIsrael have adopted the International standards in toto. European communityhave developed standards as applicable to the countries of the community. Itappears that the pollution prevention and control measures will have a major rolein the water conservation programme at large alongwith “WatSave” activities forphysically saving the quantity of water in use.
Water Savings
Farm Level
As regards the physical saving of water in use, Australia, Cyprus, China, Egypt,Italy, Malaysia, Pakistan, Thailand, Turkey and USA have reported that they doconduct surveys to monitor losses and water-use at the farm level. On that basisthe quantum of water savings have also been identified by Australia, China,Egypt, Italy, India and Turkey. The main reasons for excessive use of water atthe farm level have been stated as below:
• Evaporation• Seepage• Wind drift• Absence of proper farm management• Lack of O&M
• Lack of farmers know-how

THE WATSAVE SCENARIO 10
• Over irrigation
• Poor flooding of fields
• Ground water accession
• Low water price
Australia, Cyprus, China, Egypt, France, Germany, Italy, India, Pakistan, Thailandand Turkey have also further informed that they have a mechanism for collectingand publishing the data on the use of water. Country indications are given inAppendix A.
As regards the adoption of improved methods of irrigation, the responses revealthat the first priority, by and large is for Drip irrigation and the second one isSprinkler. Surface irrigation methods with improved O&M like small borders,proper scheduling and computerised scheduling come thereafter. Automationin flow control and furrow surface method, on-farm development works, floodingin a better way are also mentioned by some. The specific preferences indicatedby the responding countries have been listed in Appendix B.
System Level
In the four countries, Austria, Cyprus, Israel, Mongolia the canal systems arereported to be fully lined, whereas they are partially lined in China, France,Australia, Egypt, Indonesia, India, Korea, Malaysia, Nigeria, Pakistan, SouthAfrica and Thailand. Two countries namely Germany and Slovenia haveadopted totally piped distribution systems.
Twelve of the responding countries, Australia, China, Cyprus, Egypt, France,India, Korea, Mongolia, Nigeria, Pakistan, South Africa and USA have conductedsurveys to assess losses from canals. The reasons for system level losses areattributed to (i) Improper irrigation system, (ii) Inefficient distribution of water, and(iii) Farmers lack of training and knowledge. Egypt, China, France, Pakistan andSouth Africa have also given data about the losses incurred by their canalsystems as shown in Table 3 :
Table 3. Water losses in canals
Country Lined Unlinedchannels channels
per annum per annum
China 20-30% 40-50%
Pakistan 2.7 BCM 22 BCM
Egypt 3% 20%
France 25000 m3 2.7 MCM
South Africa 1.5 l/s per Th.cum 30%

THE WATSAVE SCENARIO 11
The cost of lining of canals has been reported by the different countries asshown in Table 4 :
Table 4 . Cost of Lining of Canals
Cost in Million US$/km length
Country Main canal Dist. Minor Fieldcanal canal channels
Australia 1.12 1.12 0.45 –
China 0.25 0.15 0.10 0.01
Egypt 0.25 to 0.3 0.2 to 0.25 0.15 –
France 1200 US$ 800 US$
per sq.m per sq.m
Italy 0.40 0.25 .075 .05
Indonesia:
Concrete .08 .052 0.029 –
Stone .04 .03 .019 –
Malaysia – .01 – .009
Pakistan 12.9 US$ per sq.m
Spain .13 .07 .01 –
Thailand 80 US$ per cum of concrete
USA .061 .022 .0147 .013
Table 5. Losses in Reservoirs
Country Losses BCM Surface %
Summers Winters Total water losssupply BCM
Cyprus 9.03 3.35 12.38 60 21
Egypt 2 2 2 55.5 12.5
France 600 mm 800 mm – 108.6 –
Israel 0.17 0.08 0.25 0.65 38
Pakistan 3.16 178 1.8*
India 27 362 7*
Italy 8.5 4.5 13 40 33
Spain .001 BCM/sq.km in Humid regions and .002 BCM/sq.km in dry areas
* These percentages are apparently very small because a large proportion of the surface watersupply by canal is from the direct run of the river
Reservoir Losses
The losses from Reservoirs are found to be substantial. They have beenreported by Cyprus, Egypt, France, Israel, Pakistan, India, Italy and Spain asshown in Table 5 :

THE WATSAVE SCENARIO 12
Some measures are said to have been adopted for reducing the reservoir lossesbut fuller quantification thereof are not available. The measures mentioned bysome of the countries are :
• Plastic lining to reduce infiltration (Israel)
• Clay lining of small reservoirs (Australia)
• Improved system operation efficiency (South Africa)
• Treatment with chemicals, use of water-evapo-retardants (WEP) (India)
• Integrated operation of reservoirs to first deplete the shallow portions(India)
• Reduction in Lake surface area in shallow portion with dykes (India)
In addition, weed control and channel cleaning, and rotational or intermittentrunning of canals have also been mentioned by Egypt and Korea respectively.
Reuse of Municipal and Industrial Wastewaters
Australia, Cyprus, China, Egypt, France, Germany, Italy, Israel, South Africa andUSA have assessed the potential for reuse of the wastewaters. Ten countriesin the table 6 are actually putting the treated or untreated wastewaters into usefor different purposes, have also indicated the costs experienced.
The total area reported from three countries is seen to be a relatively very smallproportion of the current withdrawals (in 1995) except in Egypt and Israel. Majoruse of the treated water is for irrigating vegetables, landscaping and golf courses,or for cooling purposes in industries. Israel has been using the water so availablefor specified crops with controlled farm management.
Data on costs also show that the treated water for reuse is available at high cost.
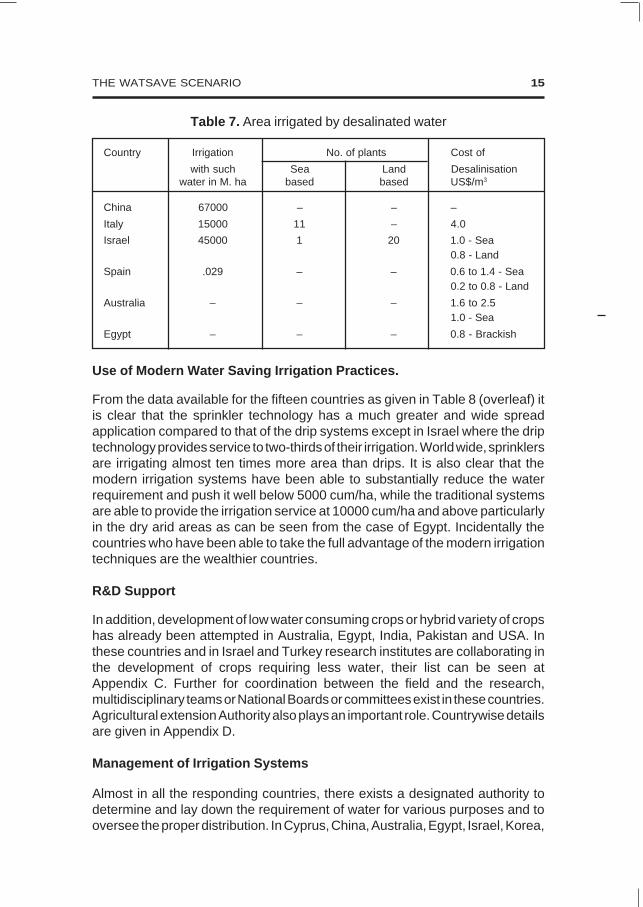
Use of Saline, Brackish and Sea Water
Another supplementary source for irrigation water is from the treatment ofsaline/brackish and the sea water out right. China, Italy, Israel and Spainhave reported the irrigation areas and/or the costs of obtaining such wateras shown in Table 7.
In Australia the costs are said to be within the range of 1.6 to 2.5 per cum whilein Egypt these are $ 1.0 for sea water and 0.8$ for brackish water. In Egypt theuse of desalination plants is limited to the coastal areas and mainly for summerresorts. Egypt also has a state funded programme to encourage the use ofSaline/Brackish/Sea water. Surveys in Cyprus have shown that potential existsfor developing this type of a source but no plants are yet installed. The major useof this water is in agriculture for vegetables or for land scaping and Golf coursesor for industrial cooling purposes.

Table 6. Use of waste waters
Australia[16.84]
China[525]
Cyprus[21]
Egypt[63.3]
Italy[44.7]
Israel[1.8]
Country[Total waterwithdrawn
BCM]
(1)
Use of Municipal Waste WaterTreated
Purpose
(2)
Qty BCM
(3)
Use of IndustrialWaste Water Treated
Purpose
(4)
Qty BCM
(5)
No. of sewageeffluent treat-ment plantsproviding irri-gation water
(6)
Treatmentcapacity
BCM
(7)
Cost of treatment US $ per cum
Municipal
(8)
Industries
(9)
Sewage
(10)
–
–
–
3.8, 0.4,4.5 = 8.7
40%
0.22
–
–
–
Agriculture
Irrigation
–
–
3.1 treated +2.9 others
–
0.4
35%
–
–
–
346
22
–
80
–
2.95
1.66
.45 MM3
–
–
0.385
.1
–
–
0.26
0.1 to 0.25
0.385
.1
–
–
0.19
1 to 15
0.385
.03(Irrigation)
–
–
0.32
0.1 to 0.3(For irrigation)
Recreat ion,back to river,pastures andfarms, forestry
Agriculture
G a r d e n s ,g r o u n d s ,agriculture
Agr icul turalground water,agr icu l tura ldrainage
Irrigation
Farming
13

(1) (2) (3) (4) (5) (6) (7) (8) (9) (10)
Mongolia
South Africa[21]
Spain[37.1]
USA
–
Return to river
Farming, Golfcourse
G r o u n dr e c h a r g e ,agr icu l ture,land scapes,industries.
–
55%
0.59,0.01 = 0.60
0.778, 0.803,0.574, 0.360
= 2.515
–
Industrial use,irrigation
–
–
–
5%, 5%
–
–
–
–
–
–
–
–
0.059
–
.042
↔
↔
–
.15
0.28
0.25 to 0.60
–
–
↔
↔
–
14
THE WATSAVE SCENARIO 15
Table 7. Area irrigated by desalinated water
Country Irrigation No. of plants Cost of
with such Sea Land Desalinisationwater in M. ha based based US$/m3
China 67000 – – –
Italy 15000 11 – 4.0
Israel 45000 1 20 1.0 - Sea0.8 - Land
Spain .029 – – 0.6 to 1.4 - Sea0.2 to 0.8 - Land
Australia – – – 1.6 to 2.51.0 - Sea
Egypt – – – 0.8 - Brackish
Use of Modern Water Saving Irrigation Practices.
From the data available for the fifteen countries as given in Table 8 (overleaf) itis clear that the sprinkler technology has a much greater and wide spreadapplication compared to that of the drip systems except in Israel where the driptechnology provides service to two-thirds of their irrigation. World wide, sprinklersare irrigating almost ten times more area than drips. It is also clear that themodern irrigation systems have been able to substantially reduce the waterrequirement and push it well below 5000 cum/ha, while the traditional systemsare able to provide the irrigation service at 10000 cum/ha and above particularlyin the dry arid areas as can be seen from the case of Egypt. Incidentally thecountries who have been able to take the full advantage of the modern irrigationtechniques are the wealthier countries.
R&D Support
In addition, development of low water consuming crops or hybrid variety of cropshas already been attempted in Australia, Egypt, India, Pakistan and USA. Inthese countries and in Israel and Turkey research institutes are collaborating inthe development of crops requiring less water, their list can be seen atAppendix C. Further for coordination between the field and the research,multidisciplinary teams or National Boards or committees exist in these countries.Agricultural extension Authority also plays an important role. Countrywise detailsare given in Appendix D.
Management of Irrigation Systems
Almost in all the responding countries, there exists a designated authority todetermine and lay down the requirement of water for various purposes and tooversee the proper distribution. In Cyprus, China, Australia, Egypt, Israel, Korea,

THE WATSAVE SCENARIO 16
Pakistan, South Africa, Germany, Italy, India, USA, Austria, Thailand, Malaysia,Mongolia, the authority has to fix the allocation for all the four categories of wateruse namely Domestic, General Municipal, Industries and Irrigation. The concernedagencies namely, the Agriculture department, Water Resources department,Industrial department, Local Municipalities or Local/State Governments are alsoinvolved in the related exercises from time to time and play an important role inthe process. The users are involved either through the water agencies, irrigationauthorities or the Agriculture extension wing. Generally the above said nodalagencies carryout the task of allocation of water on a basin wise consideration.To ensure that the account of allocated water is properly kept, Cyprus, UK, Egypt,Israel, Mongolia, South Africa, Austria, China, Italy, India, Pakistan and USAhave some system or the other to conduct water audit. However a multiplicity incontrol is there in some cases.
In Australia, Egypt, India, Malaysia and Pakistan, the operation of irrigationsystem is done wholly by the government agencies, but in Austria, UK, Mongoliaand USA, it is done mainly by the water user associations while in France,Germany, Italy, Indonesia, Israel, Korea, Nigeria, Slovenia, South Africa, Turkey
Table 8. Table showing area irrigated by sprinkler, drip and other irrigationmethods (Principal crops)
Country Area Irrigated Total As a Remarks
Sprinkler Drip Others modern % of TIA
1 2 3 4 5 6 7
Austria 0.76 .003 .001 .08 100
China .676 .034 – 0.71 1.4
Cyprus .02 .0029 – .0229 69
Egypt .45 – – .45 14
France .89 .14 .087 1.11 47
Germany .53 – – .53 100
Israel .07 .15 – .22 100
Italy .345 – – .345 13
Korea .005 – – .005 0.5
Mongolia .032 – – .032 91
Turkey .05 – – .05 1.3
India 0.78 – – .78 .1
Slovenia .005 – – .005 82
South Africa .67 .05 – .72 59
Spain .9 .23 – 1.13 33
USA 3.38 0.34 0.17 3.89* 27*Does noti n c l u d esubsur faceirrigation

THE WATSAVE SCENARIO 17
and Thailand the systems are operated jointly with users and governmentagencies together. In some countries, there are some that are operated eitherby the government or by the users exclusively, practices in respect of funding ofO&M activity however differ greatly from country to country as is clear from thetable below. The country Governments have still been playing a dominant rolein many countries with large irrigation areas. Most of them are the developingcountries. These governments will have to be involved in a major way forimprovements in Irrigation system and for affecting the desirable water saving.
Table 9. Funding of O&M activity and agencies collecting the water charges.
Country Funding %, for O & M Agenciescollecting
Govt. Users From other the waterwater levies charges
agency
Australia 85 12 3 Government
Austria – 100 – Water agencies
China 80 20 – Government
Cyprus 100 – – Govt. & agencies
France – 100 – Agencies
Germany – 100 – Agencies
Israel 30 70 – Agencies
India 100 – – Govt.
Korea 90 10 – Agencies
Malaysia 100 – – Govt.
Mongolia 10 10 80 Govt.
Nigeria 60 20 20 Govt.
Pakistan 100 – – Govt.
Thailand 100 – – Govt.
USA – 100 – Agencies
South Africa 100 – – Govt./Agencies
Spain 50 50 – Govt./Agencies
Eventhough the methods and procedures for assessing the requirement of O&Mfunds vary from country to country, the O&M needs are determined on the basisof assessed actual needs in the majority of the countries (Australia, Austria,China, Cyprus, Israel, Germany, Korea, Mongolia, Slovenia, South Africa). Butthey are fixed on historical basis with respect to previous expenditure inIndonesia, India and Thailand. South Africa and UK have prescribed othermethods to arrive at the needs of O&M funds.
The water price is charged in India and Malaysia on the basis of fixed rates whichmay not have been revised. While in Australia, Austria, China and Pakistan the

THE WATSAVE SCENARIO 18
water price is levied with due consideration of intervening inflation. Average costpricing is followed in France, Germany, Italy, USA and Turkey. Egypt, Mongoliaand Indonesia do not charge for supply of irrigation water. In South Africa thecharges are fixed on a number of considerations specific to the different areas.Nigeria levies a lumpsum charge for each crop season but in Korea the chargesare leviable for the rice crop only. Slovenia charges the water price on avolumetric basis, while India, Korea, Mongolia, Nigeria and Turkey do so on cropand area basis. China, Cyprus, Malaysia, Pakistan and USA charge for wateronly on area basis. In Spain, the River Basin Agencies and Hydrographicconfederation (users) do the price fixation.
The collection of water charges is done annually in most of the countries(Australia, Austria, China, Cyprus, Germany, Italy, Indonesia, Korea, Malaysia,Mongolia, Nigeria, Spain, UK and USA); but it is bi-annual in Pakistan and India,and bi-monthly in Israel. Water users in 8 countries pay to the Govt. (Australia,China, Italy, Indonesia, India, Malaysia, Mongolia, Pakistan) while in 9 countriesthe water agencies or the other user groups collect the charges (Austria, China,Cyprus, France, Germany, Israel, Korea, Spain, Turkey).
The success in recovery of water charges varies from country to country. InAustralia, Austria, Cyprus, Germany, Italy, Malaysia, Spain, UK & USA it isreported to be 100%. It is between 50-100% in China, Indonesia and South Africawhile it is even less than 50% in India, Nigeria and Pakistan, eventhough therecovery of water charges is subject to the provisions and sanctions in thecountry’s Law. In Australia, China France, Israel, Korea, Nigeria, South Africa,Spain, UK & USA, the irrigation facility is liable to be withdrawn for non-payment,but in Austria, Cyprus, India and Pakistan the legal provision can be invoked onlyfor the recovery of the payments due. In Australia, India, Malaysia, Mongolia,Indonesia, Pakistan and Nigeria, the amounts collected go to the Government’sgeneral revenue. In France, Italy, Israel, Germany, Korea, UK & USA, therevenue goes to the water agencies or to the user groups directly. In Spain it ispayable to two agencies viz. River Basin Agency and Hydrographic Confederation.
The Water Price
The rates of water prevalent in 1995 for various types of uses as reported by theresponding countries can be seen in Table 10.
One thing is clear, worldwide, that the price for irrigation water per cum is far lessthan that for domestic/municipal and Industrial uses. Even in France, Germanyand Israel who are said to be developed countries and to be having their watermanagement on system on a self sustained financial basis, the irrigation waterrates are just one tenth of those for other uses. Elsewhere the difference is muchlarger. It is interesting to note that Australia, Cyprus, Egypt, India, France,Pakistan, South Africa, UK, USA have reported that they have a water pricing

Table 10. Water charges in US $ per cum (1995)
Country
(1)
Ruraldomestic
(2)
Municipaldomestic
(3)
Self
(4)
Supplied
(5)
Irrigation
(6)
Others
(7)
Kind orrates
(8)
GNP percap. (1994)
US $
(9)
Remarks
(10)
Industry
AustraliaAustriaChinaCyprus
EgyptFrance
GermanyItaly
IndonesiaIsraelKorea
MongoliaNigeria
PakistanIndia
SloveniaSouth Africa
TurkeyUSASpain
.01 to .12<– 0.5 to
.01–
–.51.5.40
.84<–––––
<– User pipeScheme and
––
0.25
.2 to .51.5.04
8.2 per BCMper month
.05.51.5.7
.008.34.27–
2/month––
dia– user –
––
0.75
.1 to .12–
.01
.33
<– .10.3–.7
.013<– 0.26
–,042
––––
specific––
Wide
. 1 to .50.5 to 1.0
.10
.66
–>.18–
.04––>–
.15–––––––
range
.005 to .07.10
.0025 – .012.11 to .14
Nil.7
.1 to .5.10
.16 to .19Nil –>
–10/season/ha
3.7/haCrop & area
––
.005.02 to .2
–
––––
–.70–––––––––
–>–>–––
Block––
Block
Flat
Local basisBlockBlock
–––
FlatFlat––
Flat for irrig.Flat for irrig. basedon local supply
–
1798024950530
8955+
710234702558019270980
144108220340280440310*71403010245025860
–
* Varies, Stateto State
Note : Block rate means rates charges on quantities in blocks.Flat rate means rate is without consideration of quantity used. 19

THE WATSAVE SCENARIO 20
policy. In Spain the water pricing is currently under review. Even countries withdefined water policy have adopted a large differential in the rates for irrigationwater and for other water uses. The relative difference between domestic andIndustrial rates is however not that large.
National Authority for Integrated/comprehensive planning of waterresources.
Most of the countries have made some agency or the other as responsiblefor comprehensive planning of the country’s water Resources. They aregenerally the agencies of the government working under the direct controlof a ministry and operate in accordance with the law of the country or by anexecutive order. The responsibilities entrusted to these however differwidely. In China, Cyprus, Egypt, France, Germany, Israel, India, Korea,Mongolia, Nigeria, Pakistan, Spain, South Africa, Turkey, UK and USA, thisagency has the responsibility for water allocation amongst different uses. InItaly, South Africa, Austria and Australia, the agency also monitors the wateruse. In Indonesia, Malaysia, Slovenia and Thailand this agency also monitorswater savings and measures therefor. In addition to the regular monitoringof water use, evaluation is also carried out by the designated agency inChina, Cyprus, Egypt, Israel, Indonesia, Pakistan and South Africa.Information about the national agencies entrusted with responsibilities forplanning, monitoring and evaluation is given at Appendix E.
The In-house valuation carried out in China, Cyprus, Egypt, Israel, Indonesia,India, Pakistan and South Africa have indicated the need for the followingmeasures to achieve better and more efficient management of the country’swaters.
• Introduction of centralised control (China)
• Establishment of water markets (China)
• Involving of the farmers in planning and operation of the systems. (Egypt,Turkey, India)
• Communication and coordination between intra and inter agencies on onehand and users on the other (Egypt)
• Building-up capacity of users and service agencies (Cyprus, Egypt,German, Nigeria, Thailand)
• Improvement in preservation of water and in the water quality standards(Israel)
• Long term considerations in water allocation to tackle drought conditions(Israel)
• Improving Drainage in irrigated areas (India, Pakistan)
• Improving conveyance efficiency (India)

THE WATSAVE SCENARIO 21
• Upgrading the physical system (India, Korea)
• Preventing of water wastages in farming (Korea)
• Greater attention to O&M and improved fuller utilisation (Nigeria)
• Introduction of water saving systems and improved farm management(Turkey)
National Policies and Programs for Saving Water
China, Slovenia, Egypt, Pakistan and Thailand have further reported that theyalready have a programme of water saving at the National level as indicated inTable 11 below.
Table 11. National Programs for water savings
Country Name of Proj. Cost Start Completing AnticipatedUS$ target saving
China 300 counties 375M 1996 2000 6 BCMfor water savingdemonstration
Egypt Irrigation 70 M 1984 1996 5 BCMimprovement
Pakistan (i) Programme 735M 1995 1998 8.46 BCMof lining canals
(ii) National 835M 1996 2002 –programme ofdrainage
Slovenia Irrgation – 1996 2002 –Programme
Thailand (i) Chhaya 1.6 M 1996 1997 –Managementand strategyproject
(ii) Pipe 8.0 M 1996 1997 –irrgationprogramme
Sectoral & National Priorities for Water Conservation and types ofmeasures
The country reports have also given some indication of their priorities. In Austria,the priority is for taking legal measures for water quality monitoring, rehabilitationof groundwater quality and redimensioning of water rights after 10 years. Priority

THE WATSAVE SCENARIO 22
in Cyprus is for dam construction and groundwater recharge. Israel has mentioned(i) Water saving devices, (ii) Automation and (iii) Improved O&M of the irrigationsystems as the priority elements of their future programs. Pakistan has stated(i) Lining of canals and preventing over-exploitation of groundwater, (ii) Providinginterceptor drains and (iii) demand based irrigation supply coupled with increasein water charges as their consideration. Appendix F contains country-wiseinformation about the national acts and policies which have a bearing on waterconservation.
Public Awareness
Australia has formally adopted a “Water-Wise” public awareness programme.Israel has indicated that, in addition, specific decrees are issued in drought yearscutting down water allocations and use. In many other countries also publicawareness is being promoted by using the media and other communicationsystems. Australia, Egypt, Israel, South Africa and USA have found that thelaunching of awareness programs did cause an impact. Australia has experiencedthat in the last two years the “Water-Wise” movement has made an impact andthe states who adopted the “Water-Wise” programme have shown reduction inwater use. Israel also finds that the impact is perceptible from demonstrablereduced water use and market purchases of water saving devices.
The Chinese Taipei Committee celebrates the world Water Day thro publishingeducative leaflets for the water agencies and the people. The resources Bureauof the country has assigned the status of “a Water Resources Month” to themonth of March. Activities during the month include release of educative posters,commemorative postal envelopes, Video Tapes, photographs, painting andwriting contests on water topics and ecology field trip. From the responses of thecountries it is seen that similar activities have become popular in other parts ofthe world also.
Gender Aspects
Traditionally women are involved in on-farm activities, in Australia, France, India,South Africa, USA and many other countries also. They work hand-in-hand withthe male members and assist them in their work. It is seen that women generallylook after the safety and security of the equipment on the farm but sparselyhandle operations, maintenance and repairs of the water equipment. But they dolook after the live stock. The women farmers receive some sort of training in 8countries which is through the visiting officials of the Agriculture Extensionservice or in their schools as in Austria, China, Cyprus, Egypt, France, Nigeria,South Africa and USA. The women are also already involved in water usergroups as its full members in fourteen countries namely Australia, Austria,China, Cyprus, France, Germany, Italy, India, South Africa and Mongolia,Slovenia, South Africa, Thailand and USA. In addition Australia, China, Italy,
THE WATSAVE SCENARIO 23
India, South Africa and Mongolia have some specific acts/rules/regulationswhich encourage the participation of women, in water user groups and in thewater management. But the quantitative impact of women’s involvement in watermanagement in the water saving measures do not appear to have been yet fullystudied anywhere.
Manpower Planning and Capacity building
A manpower planning policy for irrigation service personnel exists in China,Egypt, India, Pakistan and Thailand. alongwith the quantification of manpowerneeds. A specialised irrigation service exists in one form or the other in China,Australia, Cyprus, Egypt, Italy, Indonesia, India, Pakistan and Thailand. Perusalof details supplied by the mentioned countries reveal that in their staffing patternsgenerally have a “district-in-charge” who is supported by field deputies,subordinates and fieldmen. Many countries have expressed that there is a needfor the training of these personnel as well as training for the farmers, particularlythose directly involved in the management of water.
GLOBAL WATER PARTNERSHIPSupports Water Conservation
The Global Water Partnership (GWP) will be able to assist thedeveloping countries in implementing water savings in agricultureas a part of its water conservation programme through its various‘windows’ established for support to the water related activities.The associated programme for conserving water in agriculturewill provide information, synthesised knowledge and capacitybuilding support to the irrigation service agencies to bring abouta change in water use practices to save water.
ICID is an accredited member of GWP and has been active in itswork since its inception. The National Committees of ICIDparticularly those from developing countries have been requestedby ICID Central Office to identify their needs and formulateschemes for seeking financial support through GWP. The CentralOffice of ICID has separately proposed a number of workshops/seminars and International Conferences for helping thecountrywise/regionwise and continent efforts. The aim of ICID isto bring together through the support of GWP, senior policymakers and international irrigation experts to identify optionsavailable for effecting water savings in agriculture.

THE WATSAVE SCENARIO 25
III. COUNTRY SPECIFICITIES
This chapter provides information on the country specific plans andprograms which have an impact on watsave aspects. Actual achievementsfrom development of new techniques/studies are covered in chapter IV on
Watsave successes.
While the overview of prevalent water management and Watsave gives acomparative picture of the current situation in the world, it will be useful to havea closer look at some of the important features of the water situation in thesecountries. On the basis of the information received from them, a brief resume oftheir important characteristics in respect of Watsave is presented. It is notintended to provide any exhaustive information, here, about the countries’ waterscenarios, the objective is to invite attention to the features that supplement theglobal overview presented in Chapter II.
AUSTRALIA
Contrary to the position in Germany or Israel, surface flooding methods ofirrigation are still very much in vogue in Australia. But efforts have been launchedrecently to adopt modern methods. Lots of studies are in hand to demonstrateto the users of irrigation water, that they would grow more by conserving water,while earning more too. The potential for water savings at the field level havebeen studied and such savings for some of the crops have been quantified.Propagation of correct and scientific practices based on soil water relationshipsare being pursued. Agronomical institutes are working on different crops toevolve the varieties which use less water and give higher yields. Potential for thereuse of wastewater has also been assessed. Use of recycled water is so farlimited mainly to recreation areas, pastures and forestry. The users’ participationis growing, 20% of the area is already covered by joint management. The waterpricing is currently based on traditional approaches, but lately an awakening isclearly visible from the various programs of public consultation. It is being donein conjunction with New Zealand. Australian states have already promulgatedstatutory regulations for water conservation, prevention of pollution and wateruse. Public awareness is being promoted by adopting persuasive policies,education, advertisement and holding of water saving conferences/seminars.The women of Australia are involved in the agricultural activity and join the wateruser groups or associations. The irrigation services are manned jointly by theagricultural engineers and the civil engineers.

THE WATSAVE SCENARIO 26
New approach to meet the Watsave objectives.
• Water pricing and cost recovery to reflect true cost of water service.
• Appropriate organisational arrangements with separation of regulatoryfunction from delivery function.
• Clear allocation and water trading arrangements provide security andflexibility to water users.
• Integrated land and water management to mitigate any general adverseimpacts on water quality and the environment.
• Enhanced public education and consultation process to emphasise thevalue of water.
• Task force appointed on Water reforms (COAG)
Australia accords recognition and significance to the complexity of the waterreforms. The Agriculture and Resource Management Council of Australia andNew Zealand (ARMCANZ) established a task force comprised of senior waterpolicy representatives, Australian and New Zealand Environment andconservation, council representatives of water industry and National competitioncouncil. The Murray Darling Basin commission agreed to participate on thereforms, task force has the following terms of reference :
• Manage and report on the implementation of water reforms and associatedNational Competition Policy.
• In particular report on establishment of goals and milestones and progressof implementation of the reforms across jurisdiction.
• In addition consult the key stake holders the operators, and the economicand environmental regulators recommendations about inter-governmentalissues.
AUSTRIA
Austria is in a highly advanced stage of water management. Modern methods ofirrigation have been adopted by the users, and who operate the systemcollectively for irrigation water on volumetric basis to cover expenses of the entireO & M activity. The national water policy provides for water quality safeguards,the rehabilitation of ground water quality and redimensioning of water rightsevery ten years.
CHINA
China currently uses 385 BCM for irrigation out of its total withdrawal of 535.5BCM and irrigates an area of 50 M.ha. At the same time it aims at achieving anarea of 60 M.ha by the year 2015, without any increase in the allocation of 385BCM to the agriculture sector. This is indicative of the resolve to improve the

THE WATSAVE SCENARIO 27
management of water in quite a significant way. More areas are planned to becovered by the modern techniques at the rate of 0.16 M.ha. per year to raise thearea under modern methods from the current level of 1.4% to 6% by the year2015. China has already passed on 25% of its irrigated area to the operationalcontrol of the users with another 25% getting operated jointly by the Governmentagencies and the users together. The remaining 50% is however, still undergovernment operation. China is steadily identifying the possible water savings atthe farm level. A programme of water savings known as “300 counties for watersaving demonstration” costing US $ 375 M is in hand since 1986, to be completedby the year 2000. This programme and successes therefrom are being used forpromoting greater public awareness about potential for water saving. China ismaking good strides in monitoring of water quality also after establishing waterquality standards for each of the sector using water. It is augmenting its suppliesthrough reuse of 2.9 BCM of treated effluents. Even untreated municipalwastewater is being put to use to the extent of 3.1 BCM. They, together providefor more than 1% of the current supply of fresh water. The country has assessedthe potential for use of saline and/or brackish water and has introduced irrigationin an area of 67 Th.ha. by such waters.
China is examining the possibility of diverting water from the abundant south tothe thirsty north. Three alternative routes are under consideration. The westernroute involves 75 Km long tunnel to transfer 20 BCM of water. Eastern route canbring 15 BCM while the middle route can also bring 20 BCM. The last one, themiddle route, is thought to be operable and affordable. It also does not involvepumping unlike others and can bring water to Beijing by gravity. Alongwith otherprojects of reservoirs Building, diversion and ground water use, China’s supplyis expected to increase by 100 BCM in near future.
Having taken a conscious decision not to increase its present Agriculture waterallocation of 385 BCM (irrigating 50 M.ha), it aims at increasing irrigated area by0.667 M.ha a year by saving water and implementing improved managementapproaches and/or by exploiting non-conventional sources. To promotepropagation of modern methods of irrigation and improving water use efficiency,China has provided incentives by way of subsidized soft interest loan schemes.
The strategy is to improve overall irrigation efficiency by reconstructing majorcanal systems, adopting conjunctive use of water and by preventing seepagefrom canals by lining them. The first priority is to old main canals, second to thecanals performing at lowest efficiency and the third to canals with high waterlevels than the ground. Lower priority is to the networks which run for short terms.
CYPRUS
Cyprus is already engaged in augmenting its water resources. It currently uses1.6 BCM of the treated effluents and 0.66 BCM of desalinised water i.e. a total

THE WATSAVE SCENARIO 28
of 2.26 BCM which is 2.5% of its water resources. This proportion is expectedto increase in the coming years. Irrigation is practiced with modern methods withpiped (pressure) supplies. It has also laid down the criteria and the guide linesfor water pricing on volumetric basis. The women do work in the agriculturalactivities and have a high level of training.
EGYPT
The Aswan High Dam (AHD) was constructed to improve the long termavailability of Nile water for Egypt and Sudan and plays a key role in thedevelopment of irrigation in Egypt. Agriculture is using 85% of the available waterat an efficiency of 65-75% after accounting for pumping and drainwater reuses.The rest is used in domestic sector (3.1 BCM) and the industrial sector (4.6BCM). The effluents from these two sources are highly polluted. Yet theimportance of using and exploring non-convential water resources is very wellrealised for the future.
Out of a total irrigated area of 3.23 M.ha, modern methods are used on 14%which is proposed to be increased further at a rapid pace. The increases werenoticed to be nearly 9% within a span of 5-8 years. It is implementing an irrigationimprovement project with the support of the World Bank, which, during 1984-1996 has strengthened the country’s resolve for improving the infrastructure andthe management techniques. The causes for excessive use of water and lossof water have been identified. It is planned to achieve an irrigated area of 4.00M.ha. The organisational structure has undergone improvements coupled withinstitutional innovations to promote a large scale participation of the users andthe establishment of many research centers.
A National Conference on Exchange of Experiences in water savingirrigation technologies of Rice field was held in Gulin, Guanxi in China
from 3-7 May 1997, sponsored by the Ministry of Water Resources (MWR)and the State Science Technology Commission (SSTC). Vice Ministry ofMWR and Vice-Chairman of SSTC delivered important speeches. TheChinese Government in recent years has launched a programme forencouraging a new technology for growing rice called “Shallow WaterDepth, wet situation and sun drying field” instead of ‘deep submergence’method, which saves upto 1500 cum/ha of water and increases yield by 375Kg/ha. The total area under rice in main land China, (32.1 M.ha) produced188.5 M.Tons of rice in 1996 and consumed 65% of the water allocated toagriculture (35 BCM). The new technique has spread in 3 M.ha. It isestimated that if two thirds of the rice area (32 M.ha) could adopt thisapproach, the water savings of the order of 7.5 BCM can be achieved,simultaneously producing 7.5 billion tons of MORE rice.

THE WATSAVE SCENARIO 29
Egypt currently augments its water supply by reuse of 0.4 BCM of treatedmunicipal wastewater, another 0.4 BCM by reuse of industrial waste, and byreuse of drainage water to the extent of 4.5 BCM as also by the reuse ofgroundwater (from recharge by irrigation) to the extent of 3.80 BCM, addingaltogether 9.1 BCM or a little more than 16% to its available surface water supplyof 55.5 BCM and groundwater of 0.7 BCM. Egypt aims at stepping up theaugmentation to 16.7 BCM by the year 2010 when it will also have added adesalinised quantity of 0.5 BCM i.e. to reach a level of more than 28% of itsnatural resources of 58.7 BCM likely to be available by then, Egypt has plannedfor a significant increase in reuse category as shown in Table 12 below :
Table 12
Reuse-source Current Projected for(BCM) 2010 (BCM)
Municipal wastewater 0.4 1.6
Industrial effluent 0.4 1.8
Desalinated N 0.5
Drainage water 4.5 7.0
Ground water (Reuse) 3.8 5.8________ ________
9.1 16.7-------------- --------------
Supply
Nile River 55.5 57.5
Ground water 0.7 1.2________ ________
Sub. Total of supply 56.2 58.7-------------- --------------
Augmentation % 16 27
FRANCE
France, an industrialized country has a well organised irrigation infrastructure,policy framework, well developed irrigation service and the required institutionalset-up. Out of the current total irrigated area of 2.38 M.ha, modern methods areused in 47% of the area. France aims at raising its irrigated area to 3.98 M.ha bythe year 2015, an increase of nearly 67%. The water distribution is through wateragencies and water pricing is mostly on average cost price, though theseagencies may also charge an opportunity cost. Women are involved in the wateruser groups. France has a good system of management of water in each of itsbasin for which there are well developed basin organisations.
THE WATSAVE SCENARIO 30
France, whose current water resources are reported to be 101 BCM, withdraws11.4 BCM and augments the supply by reuse of 3.6 BCM of municipal wastewaterand 4 BCM of industrial wastewater. A quantity of 2.4 BCM is used in agriculturalsector.
Responsibilities in the water sector in France were consolidated in thecomprehensive legislation passed in 1992. In the country’s six river basins,coordination in each is provided by the Basin Committee. The latter acts as aregional water parliament where users confer and empower local communitiesand enhance the powers of the agencies Financier-de-Basins; now calledAgencies de I’eau.
GERMANY
Germany has evolved an effective set of rules and regulations to enable propermonitoring of allocations, water uses and savings. The women are joining theactivity of irrigation and associating themselves in water user groups also. Thewater pricing is on the volumetric measurements and the method of Average costprice is adopted by the water agencies. Number of studies to improve upon theirrigation techniques are in hand.
ISRAEL
Israel, a small country, has taken big strides in managing the limited waterresources through astute approaches and resolute implementation of its policies.All the area is irrigated by modern methods and conjunctive use is resorted to.Voices are being raised in Israel to treat the municipal effluents as a nationalresource to augment the fresh water supply.
Israel has a supply of 1.7 BCM, augmented by reuse of 0.22 BCM of municipalwastewater and 8 MCM of desalinated water. Waste water reuse is anticipatedto increase by 10% per year and that of desalinated water by about 5%. Allocationto agriculture sector is 0.83 BCM, the net water use works out to less then 5000cum/ha with the currently irrigated area of 0.22 M.ha.
Israel has taken very strong policy measures granting the status of a ‘scarce’resource to water. Water pricing is based on metered supply and perceivedaffordability.
INDIA
India’s withdrawal of fresh water which stood at 552 BCM in 1990 is likely to touch750 BCM by the year 2000, and to 1050 by 2025, an increase of nearly 90% over1990. The irrigated area in India in 1993-94 stood at 37.5 M.ha from surfacewater while that from groundwater was 38.5 M.ha and is planned to increase at

THE WATSAVE SCENARIO 31
the rate of 4% and 6% for surface and groundwaters respectively. By 2015, thetotal irrigated area is expected to increase to 138.6 M.ha. The table below depictsthe current and projected increase in water uses in various sectors:
Table 13. Water Withdrawals (BCM)
Usage Current Projected Projected(1990) (2000) (2025)
Irrigation 460 630 770
Domestic 25 33 52
Industry 15 30 120
Evap.loss and misc. 33 27 37
Energy 19 30 71
Total Withdrawals 552 750 1050
Percent increase 35.8 90
A movement for participatory management has been launched all over thecountry which is demonstrating encouraging response.
ITALY
Italy augments its supply by reuse of treated municipal wastewaters andindustrial effluents. Irrigation is organised by the Improvement agencies, PrivatePublic Associations of production and overseen by the regional Governmentsand is controlled by the Catchment Area Authorities. The irrigation systems areoperated both by the government and the users. The charges for water are basedon Average Cost Price by volume or per permit issued to the user.
JORDAN
Jordan an arid country is realigning its water management strategy since1986. Surface water resource have increased from 0.428 BCM (1986) to0.985 BCM (1996) and groundwater from 0.183 BCM to 0.318 BCM itpresently uses 0.31 to 0.34 BCM per year for agriculture allocating 61% fortrees, 30% for vegetables and 9% on crops. The treated effluents to theextent of 80% (0.64 BCM) are also used. Jordan proposes taking resort todemand management with new tariff and pricing policies. Irrigation channelsare to be changed to conduits for attaining efficiency of 85%.
With total water resources of 1.31 BCM contributed by Yarmuk river (35%), flowin river Zaraqa is augmented with treated sewage effluents. Irrigation uses 74%

THE WATSAVE SCENARIO 32
of water. The Jordan valley authority adopts surface methods in 52% area while48% is under modern methods. The uplands of the country employ surfacemethods in 84% areas and only 16% is under modern methods. The overdrawalin 1995 was found to be 0.480 BCM. Likely to reach 0.654 by 2010. Fresh waterwill thus have to be supplemented by reuse of water by installing/expandingtreatment facilities. The water quality standards are under review and measuresfor alerting the polluters are adopted, the WHO guidelines however may enableonly category ‘B’ irrigation and crop restrictions will have to be considered.
MAURITIUS
Mauritius uses 0.85 BCM of water of which 0.44 BCM is for agriculture. Itproposes to reduce the area under flood irrigation from 20% to 7%, increase thedrip area from 6% to 27%, attain field efficiency from 50% to 90% and reducecanal losses from 60% to 15%, take up reuse of water and reduce the irrigationrequirement to 0.42 BCM. Currently 48% of cultivable area is irrigated, of this50% is sugarcane.
PAKISTAN
The irrigation service in Pakistan is in the government hands. Irrigation systemsare operated by government agencies. The reasons for excessive use of wateror the loss of water have been identified. The water pricing is on land areairrigated, and may include a levy due to betterment of the lands. Two water savingprogrammes are in hand. The first is lining of canals and water courses, anaccelerated water management project to be completed in 1998 at a cost of US$ 735 M. The other is the National Drainage programme to be completed by 2002at a cost of US $ 853 M. The two programmes are aimed at the retrieval of 8.465BCM of water i.e. 6.5% of the water allocation to irrigation.
SLOVENIA
Slovenia uses modern methods for application of water and the water supply isthrough pipes. The irrigation systems are operated mostly by the users, thoughat places they may be operated jointly with the government. The matter of waterpricing which is on the basis of volumetric measurements is currently underreview, in conjunction with the country’s National Irrigation Programme.
SOUTH AFRICA
South Africa augments its water supply by reuse of 4.6 BCM of its municipal andindustrial waste waters adding 8% to its water resources. The use of desalinisedwater is presently insignificant but an acceleration of its use is planned for adding1% of supply per annum. South Africa is taking measures to balance its supply

THE WATSAVE SCENARIO 33
and demand through water savings and by promoting public awareness on thewater issues. Out of the total irrigated area of 1.22 M.ha, it is already employingmodern methods in nearly 60% of the area. It is expected that the improvementsin system operation policy could bring a saving of nearly 20%. The O & M fundsfor the systems are drawn from a trading account budget. Water prices indifferent areas are based on the considerations specific to the area or theschemes in that area. The farmers pay for the water quota while domesticconsumers make payment on the basis of pipe diameter that brings water tothem. A National Programme for 15% water savings in agriculture has beentaken up in 1995. The womenfolk do take part in the agricultural activity and areinvolved even in water user groups. Facilities for training them are available.
SPAIN
With 0.5 M. sq.Km. area, 39.3 M population, 114.3 BCM of natural water wealth,37.1 BCM of which is withdrawn, Spain allocates 65% of water (24.25 BCM) toirrigate 3.4 M.ha adopting surface irrigation methods in 67% area, and modernmethods in 33%. The management is controlled by “Hydrographic Confederation”under the Ministry of Public Works and Transport (MOPTMA) and ReservoirCommission (MAPA). The irrigators combine to form a community.
In Spain the water resources are managed by nine River Basin Agencies (RBA)under the Ministry of Environment and Hydraulic works, through hydrographicconfederation (users groups) in the field. While identifying the reasons forexcessive use it has been reported that pricing by land area results in lack ofincentive to save water. Faulty grading of the land is stated to be another mainfeature for excessive use.
Spain augments its supply by reuse of 0.86 BCM of treated effluents besides0.03 BCM of desalinated water for irrigation. Water allocations are made by theMinistry of Environment, Health and Agriculture in consultation with the RBAsand then managed by RBAs and the confederation (communities). The watercharges are fixed by the managing agencies and irrigators follow a dual paymentsystem. One part goes to RBA and the other to confederation. The actual costof O&M is recovered. The women participate in the irrigation activity while womenofficers also exist in irrigators communities.
A country with old tradition of irrigation enacted a water law in 1878 providingconcessions in water uses. The water law has since been revised in 1985 whichstill carries concessionary provisions. A need is being felt for improving thedeficient infrastructure, review of concessionary regime and support for Researchand development to effect water sowings.

THE WATSAVE SCENARIO 34
THAILAND
Thailand irrigates an area of 4.83 M.ha. The irrigation is by “Border” surfacegravity methods. Modern irrigation practices to effect water savings are nowbeing promoted. The country has identified that savings in water at farm levelhold a promise for the rice crop. The irrigation system are operated by governmentagencies and the water pricing policy is decided by the Royal IrrigationDepartment’s National Water Resources committee. Two programmes forwater savings have been taken up namely; A Chhaya Management StrategyProject taken up in 1994 (due for completion in 1997) while the second was apipe-irrigation study in the year 1996-97. The findings of these ventures are likelyto lead to improvements in water management. The womenfolk are involved inthe agricultural activity and are trained too by the extension service wing of theAgriculture Department and join the activities of water user groups also.
Irrigation systems in Thailand built on USBR guidelines of full supply level (FSL)control or controlled water surface (CWS) concept are now proposed to bemodernised. Improvements are also to be made in the management by (i) Properallocation of water (ii) Improving canal efficiency (iii) Land levelling in thecommand areas and (iv) Stabilisation of flows in canal networks. Similarmeasures for the run-of-the river systems and/or small/medium scale schemesare also under consideration.
TURKEY
Turkey irrigates an area of 3.8 M.ha. It is likely to increase to 6.00 M.ha by theyear 2015. Presently, only 1% is under modern irrigation methods. Large savingsof water at farm level have already been experienced in crops like Sugar-beet,Wheat, Fodder and Cotton. Potential for savings in other crops and on otherfarms have also been assessed. Operation of irrigation systems are handledboth by the users and the government agencies. The water charges are basedon average cost price and the perceived affordability, after evaluation. The waterprice is collected by the agency managing the system. The General Directorateof Hydraulic works (HGI) is the main controlling authority for water allocation, useand savings.
Turkey has undertaken a review of its National Water sector policy to provide forinstitutional changes, capability building, increased water use efficiency, improvedquality of water services, enhanced role of water users, privatisation, reorientationof cost recovery and support to regional developmental efforts. The draft policyincludes provision of several laws and regulations for private participation,environmental protection, accelerated transfer of O & M of systems to users andamendments for penalty-payment in water fees. The law enacted in 1994 toBuild, Operate and Transfer (BOT) for hydropower plants is proposed to coverwater supply sector too.

THE WATSAVE SCENARIO 35
UNITED KINGDOM
The National Rivers Authority is the statutory body for licensing water abstractionsand for keeping a balance between the environmental needs and the abstractors.Its sustainable Water Resources Development objectives are:
• Investment in new resources
• Management initiatives
• Improving efficiency
The management initiatives comprise cash buyout of licenses, pooling oflicenses, incentives for demand control, inter-farm transfers, reallocationsthrough tradable rights, reinforcing river flows from under-utilised sources anduse of surplus river flows early in the season. The efficiency increase is to beachieved by improving operational practices, artificial recharge, effluents reuseand desalination. Under-Sea pipe lines to divert water from surplus to deficitareas is also under consideration.
The water pricing and allocations is done by water agencies who also decide thedistribution options. There is a permanent user operated system for extractingof water. The water charges are based on duration of supply, the license holderbeing responsible for payments. The Environment Agency is authorised by law,to allocate, audit and monitor water savings.
Zambia is promoting modern water lifting devices to upgrade theefficiency in the indigenous use. National Master Plan for irrigationdevelopment has been drawn up with assistance from Japan. Nearly200 dams constructed earlier for water harvesting and conservation areproposed to be rehabilitated by (i) Desilting (ii) Restoring Spillway,diaphragm walls and (iii) Mobilising users in management.
USA
USA irrigates an area of 19.99 M.he (1995) and has 11.11 M.ha of it under“Furrow” method of irrigation. Sub-surface irrigation is also practiced. Increasein the area under modern methods is quite rapid with 27% currently undersprinkler and drip. There is a good and ample R&D support, the systems are useroperated. The dissemination of technology is also quite rapid and wide. Thereare a number of research centers who remain in regular touch with the user groupin the field. The water price is based on Average Cost Price and volumetricmeasurements, fixed by water agencies. The price covers O & M costs andadditional obligations of the Government for conservation.

THE WATSAVE SCENARIO 36
CHINESE TAIPEI COMMITTEE
The Chinese Taipei Committee has indicated that in addition to its surface andgroundwater resources it has 36 natural lakes too. The total supply was 17.6BCM in 1992 comprising 5.6 BCM of surface water, 7.1 BCM of groundwater and4.9 BCM from the lakes and has now increased to 20.5 BCM by 1996. Allocationto agriculture stood at 13.5 BCM (76.7%) with an irrigated area of 0.457 M.ha.A rise in demand is foreseen, likely to reach 15 BCM (from 13.5 BCM) by the year2012. Water allocation to agriculture has been steadily increasing since 1961when the total withdrawal was 9 BCM.
The Executive Council has promulgated guidelines on water resources planningand water conservation, promotion of new technologies, reuse of waste waters,increase in water use efficiency, prevention of wastage. Introduction of rewardsystem, rational pricing of water usages and Public education. A saving of 2 BCMwas targeted for the year 1996.
The Strategy of water conservation recently adopted lays down the objectives forwater users: Increase sale by 2% but maintain Zero growth of water use percapita, Increase wastewater reuse by 5%, increase channel lining by 2% andkeep zero growth of water use per unit area.
Further, to achieve efficient management of water, it will promote efficient waterdistribution and O&M, reuse at users level, use of water saving devices,forecasting/warning systems to combat drought and other exigencies, developtechnologies for conservation and water use. Dual water supply, drinking andflushing (reclaimed water for the later) establishing rational water use standardsfor each usage, development of water users’ groups, education and waterawareness and Campaigns for protection and saving of water.
It will thus be seen that all the responding countries are conscious about theincreasing demands for water and many of them have also initiated variousmeasures for supplementing their natural resources as well as for effectingsavings in the current pattern of water uses.
Tabulated Summary of Responses
A tabulated summary of responses of the Watsave Questionnaire from theresponding National Committees is given in the ensuing pages. The informationsupplied by the committees is generally as for the year 1995. Where it pertainsto other years, the same have been mentioned in the bracket. The tabulation hasbeen done, by and large, to cover all the points that were referred, but the columnnumbers do not necessarily tally with issue number in the questionnaire.Wherever information is not available or not reported or is unclear, a blank spacewith a small dash/dot appears.

Country
1. Australia
2. Austria
3. UK
4. China
5. Cyprus
6. Egypt
7. France
8. Germany
9. Italy
10. Indonesia
11. Israel
12. India
13. Korea
14. Malaysia
TIAha
IRRIGATED AREA
GWha
Future % per year
BI CI FI SPOthersha
Irrigation Practices (ha)
Others Future %ha + yr
SWha
Tabulated Summary of Responses to Watsave Questionnaire from the responding ICID Committees
19941.81 M
80000
–
199350 M
199433000
19963.23 m
19932.375 m
531120
16700ombrie(1982)199481360
Brantas220000
199476.1 m
1994956000
1994294000
1.71 M
8000
–
36.7 M
14300
2.84 M
–
20%
15600
81360
75000
37.5
801000
294000
0.108 M
72000
–
13.3
18500
0.12 M
–
80%
1100
–
105000
38.6
155000
–
–
–
–
–
200
0.26 M
–
5000(Reuse)
–
–
40000(Reuse)
–
INA
–
+5
<1
–
+1
<1
+1.3;+0.5+4.2;+8.5
+80000
+5000
4000
–
+900(Reuse)
–
-20000; -16740; -2200
No change
–
–
–
20 M
–
←
–
–
–
–
–
–
956000
294000
–
–
–
26.7 M
–
2.78 M
–
–
–
–
–
–
–
–
–
–
–
2.5 M
1650
–
–
–
–
–
–
–
–
–
–
7600
–
0.8 M
24760
0.45
1.16
0.53 M
850
–
65000
–
← 5810 →
–
–
4000
–
.033 M
6600
–
–
1120
150
–
155000
–
–
–
–
Spr. <1Drip >1-5
-
0.26 M.13 M/yr
Spr. 2Drip 2
Micro 9.3
–
Spr. 5000/yr
–
–
No change
–
BI -2Micro +1/2
–
(1) (2) (3) (4) (5) (6) (7) (8) (9) (10) (11) (12)
37

Country
15. Mongolia
16. Nigeria
17. Pakistan
18. Slovenia
19. South Africa
20. Thailand
21. Turkey
22. USA
23. Spain
TIA
IRRIGATED AREA
GW Future % per year
BI CI FI SPOthers
Irrigation Practices (ha)
Others Future %ha + yr
SW
Tabulated Summary of Responses to Watsave Questionnaire from the responding ICID Committees
199435652
250000
13.96 M
6500
19901.22 M
19944.835 M
3.8 M
199219.99 M
3.4
34180
70000
10.47 M
500
1
4.835 M
3.4 M
11.35 M
2.17
1247
180000
–
6000
.2
–
0.4 M
8.64 M
.919
–
Nil
3.49
–
–
–
–
–
.3
(-) 50; (-) 40;(-) 50.4
SW +7G/W +11
+2.5
SW 30%GW 5%
SW(-)1%,Ruse+5%
.22 M
0.1 M
< 1
1000
–
–
–
–
300000
4.835 M
–
–
–
–
–
–
–
–
–
3.75 M
–
–
3032
–
12.71
–
200000
–
–
11.11 M
.9
32600
–
–
>5500
670000
–
49000
3.38 M
.3
–
–
–
<1000
150000
–
877
0.338 M
–
–
–
–
Spr 70Micro 30
Spr -15; Mirco+1; Others +1;DI - 15
0.22 M/yr
–
BI, CIMisc. 10%
–
BI = Border Irrigation; CI = Contour Irrigation; FI = Furrow Irrigation; SP = Sprinkler System; MIC = Drip System
(1) (2) (3) (4) (5) (6) (7) (8) (9) (10) (11) (12)
38

Country
1. Australia
2. Austria
3. UK
4. China
5. Cyprus
6. Egypt
7. France
8. Germany
9. Italy
10. Indonesia
11. Israel
12. India
13. Korea
14. Malaysia
WATER QUALITY
Limitation in the qualityfor use of water
Survey forwater pollution
Point sourceof pollution
NP sourcesof pollution
Monitoring authorityfor pollution
Water qualitystandards
2
GenerallyNo
–
YES
YES
–
–
YES
–
YES
YES
–
YES
YES
–
Done
Done
–
Done
Done
Done
Done
Done
Done
DoneOnly for industries
Done
Done
Done
–
Waste dishcarge
Muni, Indus
–
COD, BOD, Heavymetals, Phenols
–
Agr. drainage, Indus,Sewage, Thermal
Collection, Indus
–
Chem, Indus, Urabn dis.Intensive farming
Industries
Indus, Waste water dairypiggeries runoff drai. waste
Indus, Munci. Agr.runoff
–
Waste discharge fromidentified points
Nutrient dis.
Landuse NH4
Nitrate, Pesticides
–
NH4, I & P
–
Agri. landGW flux
Agr.
–
Fertilizers, Agr. Water
–
Fertilizers &pesticides
–
–
–
State EnvironmentProtection Agency
Federal Min of Agr &Forests
–
National EnvironmentProtection Agency (NEPA)
MoL, Munic. [I M]MOAG.
MOPW&WR, MOHEnvironment Agency
Environment agency
Public Law
MOPH
BAPPEDAL
Ministry of EnvironmentWater Comm.
Pollution Control Boards
Ministry of Environment
DOE
Established
Established
Established
Established
Established
Established
Established
Establisheddin - 19650
Established(LM 60, LN 319)
Established
–
Established
Established
–
(13) (14) (15) (16) (17) (18)
39

Country
15. Mongolia
16. Nigeria
17. Pakistan
18. Slovenia
19. South Africa
20. Thailand
21. Turkey
22. USA
23. Spain
WATER QUALITY
Limitation in the qualityfor use of water
Survey forwater pollution
Point sourceof pollution
NP sourcesof pollution
Monitoring authorityfor pollution
Water qualitystandards
2
YES
–
YES
YESFor drinking supply
YES
YES
–
YES
–
YES
–
YES
YES
YES
YES
–
YES
YES
Waste water plant, mining,leather indus
–
Rise in G/W, Salinitywaterlog, drainage, Indus
Munci. Indus, big farm
Waste discharge fromidentifiable units
–
–
Bactaria, Viruses organics,nutrients, heavy metals,
suspended solids
–
Munic., Agr., Live stock
–
–
Intensive agr.
Diffused water reachessand runoff and others
–
–
Siltation, Pathogens,Pesticides, organic material
and nutrients
–
–
FEPA
Provincial Water Develop-ment EPA, Local Munci.
HydrometeorologyInstitute
Deptt. of Water Affairsand Forestry
–
Exists
Exists
River Basin Agencies
–
–
–
–
Established
–
EstablishedTS-266
Established
Established
(13) (14) (15) (16) (17) (18)
40
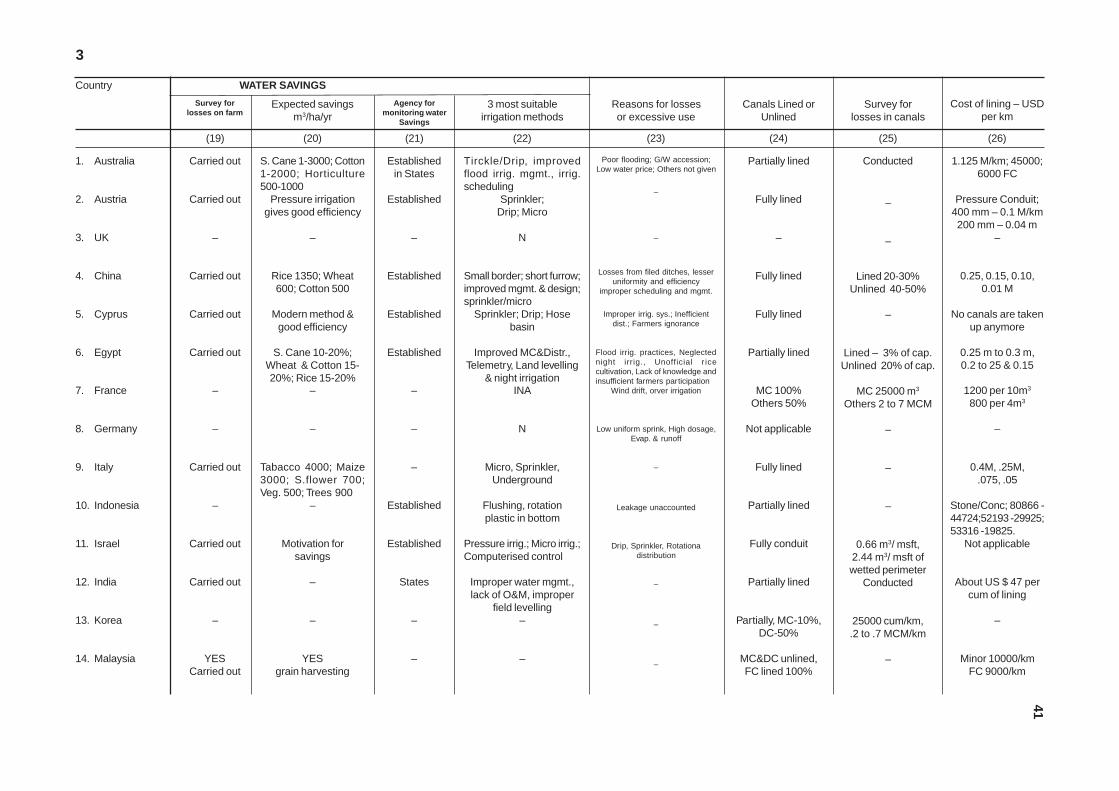
Country
1. Australia
2. Austria
3. UK
4. China
5. Cyprus
6. Egypt
7. France
8. Germany
9. Italy
10. Indonesia
11. Israel
12. India
13. Korea
14. Malaysia
WATER SAVINGS
Agency formonitoring water
Savings
3 most suitableirrigation methods
Cost of lining – USDper km
Survey forlosses on farm
3
Expected savingsm3/ha/yr
Survey forlosses in canals
Canals Lined orUnlined
Reasons for lossesor excessive use
Carried out
Carried out
–
Carried out
Carried out
Carried out
–
–
Carried out
–
Carried out
Carried out
–
YESCarried out
S. Cane 1-3000; Cotton1-2000; Horticulture500-1000
Pressure irrigationgives good efficiency
–
Rice 1350; Wheat600; Cotton 500
Modern method &good efficiency
S. Cane 10-20%;Wheat & Cotton 15-20%; Rice 15-20%
–
–
Tabacco 4000; Maize3000; S.flower 700;Veg. 500; Trees 900
–
Motivation forsavings
–
–
YESgrain harvesting
Establishedin States
Established
–
Established
Established
Established
–
–
–
Established
Established
States
–
–
Tirckle/Drip, improvedflood irrig. mgmt., irrig.scheduling
Sprinkler;Drip; Micro
N
Small border; short furrow;improved mgmt. & design;sprinkler/micro
Sprinkler; Drip; Hosebasin
Improved MC&Distr.,Telemetry, Land levelling
& night irrigationINA
N
Micro, Sprinkler,Underground
Flushing, rotationplastic in bottom
Pressure irrig.; Micro irrig.;Computerised control
Improper water mgmt.,lack of O&M, improper
field levelling–
–
Poor flooding; G/W accession;Low water price; Others not given
–
–
Losses from filed ditches, lesseruniformity and efficiency
improper scheduling and mgmt.
Improper irrig. sys.; Inefficientdist.; Farmers ignorance
Flood irrig. practices, Neglectednight irrig., Unofficial r icecultivation, Lack of knowledge andinsufficient farmers participation
Wind drift, orver irrigation
Low uniform sprink, High dosage,Evap. & runoff
–
Leakage unaccounted
Drip, Sprinkler, Rotationadistribution
–
–
–
Partially lined
Fully lined
–
Fully lined
Fully lined
Partially lined
MC 100%Others 50%
Not applicable
Fully lined
Partially lined
Fully conduit
Partially lined
Partially, MC-10%,DC-50%
MC&DC unlined,FC lined 100%
Conducted
–
–
Lined 20-30%Unlined 40-50%
–
Lined – 3% of cap.Unlined 20% of cap.
MC 25000 m3
Others 2 to 7 MCM
–
–
–
0.66 m3/ msft,2.44 m3/ msft ofwetted perimeter
Conducted
25000 cum/km,.2 to .7 MCM/km
–
1.125 M/km; 45000;6000 FC
Pressure Conduit;400 mm – 0.1 M/km200 mm – 0.04 m
–
0.25, 0.15, 0.10,0.01 M
No canals are takenup anymore
0.25 m to 0.3 m,0.2 to 25 & 0.15
1200 per 10m3
800 per 4m3
–
0.4M, .25M,.075, .05
Stone/Conc; 80866 -44724;52193 -29925;53316 -19825.
Not applicable
About US $ 47 percum of lining
–
Minor 10000/kmFC 9000/km
(19) (20) (21) (22) (23) (24) (25) (26)
41

Country
15. Mongolia
16. Nigeria
17. Pakistan
18. Slovenia
19. South Africa
20. Thailand
21. Turkey
22. USA
23. Spain
WATER SAVINGS
Cost of lining – USDper km
3
Survey forlosses on farm
Expected savingsm3/ha/yr
Agency formonitoring water
Savings
3 most suitableirrigation methods
Survey forlosses in canals
Canals Lined orUnlined
Reasons for lossesor excessive use
–
–
Carried out
–
–
Carried out
Carried out
(Not atNational
level)
Carried out
–
–
–
–
–
Rice - reduced waterfor prop.
S. Beet 40%; Wheat50%; Fodder 40%;
Cotton 30%–
–
–
–
Established
Planned
–
Established
Established
–
Hydrographicconfed.
N
Surface; Overhead;Drip (limited scale)
Furrow; Sprinkler;Drip
Drip; Micro;Sprinkler
Drip; Furrow;Dragline sprinkler
N
Sprinkler; Drip;Longline border
–
–
–
Lack of O&M, meas, farmersknowhow
Seepage evap.uncontrolled water
Conduit
–
Low efficiency control,coordination, training
Losses in conveyance, evap.,percolation
–
Pricing by land area, lack ofincentive to save faulty grading,
in appropriate methods, rigidrotational schedule
Fully
Partially lined , MC80%, Others 40%
MC 80%,Others 40%
Partially lined
Conduit
MC +90; Duty 70;MI 40; FC 15 %
Partially lined
–
Fully lined
Conducted
Conducted
Lined .7 - km3,Unlined 22 - km3
–
Lined 1.5 L/Sper 1000 m3,
Unlined : + 30%–
–
Yes
–
–
–
12.91/sq. m
–
–
80/m3; Concrete
–
55 m3/s – 61000; 10 m3/s –22200; 1m3/s – 14700;
0.5m3/s – 13400
.13 M, .07, .01
(19) (20) (21) (22) (23) (24) (25) (26)
42

Country
1. Australia
2. Austria
3. UK
4. China
5. Cyprus
6. Egypt
7. France
8. Germany
9. Italy
10. Indonesia
11. Israel
12. India
13. Korea
14. Malaysia
RESERVOIR LOSSES
Survey Summer Winter Measures in practicesfor reduction
Survey to assessavailable/potential
Users oftreated water
Users ofuntreated water
BY USE OF MUNICIPAL AND INDUS WASTE WATER
4
Done
Notapplicable
–
–
Done
Done
Done
–
Done
Done
Done
Done
Done
–
–
–
–
–
9.03 km3
2km3/yr
600 mm
–
8.5 km3
←
0.17 κµ3
(170 MCM)
← 27 km3
–
–
–
–
–
–
3.35km3
10 km3/YR(Naser lake)
900 mm
–
4.5 km3
.073 km3 →
0.08 km3
(80 MCM)
→
–
–
No attempts madeClay lining - small reservoirs
–
–
–
No attempts made so farfor reduction
Reducing lake surface area, Weedcontrol & channel cleaning
Control of water tightnessno other measure developed
–
–
–
Plastic lining to reduce infiltration
Use of retardants constructing ofdykes integerated operation to depleteshallow water
Reservoir operated by T/L, T/MRotating supply of water
–
YES, Done
–
–
Done
Done
Done
–
–
Done
–
Done
–
–
–
Recreation, Return to riverpastures & farms forestry
Agr.
INA
Indus, and Irrigation – 2.9 km3
Gardens, grounds, irrigation foragriculture
In agriculture – 0.4 km3
In indus – 0.4 km3
–
–
In irrigation 40%In indus 35%
–
In farm irrigation – 0.22 km3
In irrigation
–
–
–
–
–
In irrigation – 3.1 km3
–
–
–
–
–
Waste water flows to river,users extract water from river
–
In irrigation
–
–
(27) (28) (29) (30) (31) (32) (33)
43

Country
15. Mongolia
16. Nigeria
17. Pakistan
18. Slovenia
19. South Africa
20. Thailand
21. Turkey
22. USA
23. Spain
RESERVOIR LOSSES
Survey Summer Winter Measures in practicesfor reduction
Survey to assessavailable/potential
BY USE OF MUNICIPAL AND INDUS WASTE WATER
Users oftreated water
Users ofuntreated water
4
–
–
Done
–
Done
–
–
(Not at NL)
Done
–
–
←
–
←
–
–
–
Humid .001km3/km2
–
–
3.16 km3 →
–
1700 mm →per annum
–
–
–
Dry .002km3/km2
–
–
–
–
Water scoring by Sys. oper.policy + 20%
–
–
–
–
–
–
–
–
Done
–
–
–
Assessed
–
–
–
Not reused directly
To river – 55%, To sea – 25%Reused in irrigation – 5%
for Indus – 5%–
–
For G/W Recharge – 0.78 km3,Agr. – 0.60 km3, Landscape –0.57 km3 , Indus – 0.38 km3
.059 km3 For irigation.010 km3 For Golf courses
–
–
–
–
–
–
–
Treatment is required
–
(27) (28) (29) (30) (31) (32) (33)
44
NL = Natural level

Country
1. Australia
2. Austria
3. UK
4. China
5. Cyprus
6. Egypt
7. France
8. Germany
9. Italy
10. Indonesia
11. Israel
12. India
13. Korea
14. Malaysia
Facility available
Number Capacity Used Capacity Cost USD Major consumersLegal responsibility
of MuncipalityTreat. of M&I Cost USD
Agencymonitoring
5
URBAN AREA EFFLUENT AND IRRIGATION WATER EXCHANGE
–
–
–
–
346 nos.
22 nos.
Not done inFrance
–
–
–
80 nos. (Urban)
–
–
–
–
–
–
–
1660 – MCM
450000 m3/Day
–
–
–
–
0.45 km3
–
–
–
–
–
–
2.95 km3
–
NA
–
–
–
–
NA
–
–
–
–
–
–
0.1/m3
–
800/m3
(Constn. & O&M)
–
–
–
–
0.15 to 0.25per cum
–
–
–
ALL
Priority to irrig.,Golf courses
–
Irrigation
Landscape
Landscape irrig.veg. indus
–
–
–
–
Suitable crop withwater mgmt.
Irrig., Veg.Golf courses
–
–
0.385 cum
–
–
0.10/m3 forIndus0.030 for Irrg.
–
–
–
–
0.26 Munic0.19 Indus
–
0.10-0.25 Munic, 1to 15 Indust., Reusefor Irrg 0.1 to 0.3
–
–
–
YES
YES
YES
YES
YES
YES
–
–
YES
YES
YES
–
YES
–
Dept. of Land& EPA
Water quality1-5 years
Envi. Agency
NEPA
MOAG, MONR, EA
MOPWWR, DailyEEAA - yearly
–
Public Law
MOPH & MayorAnnual
Env. Control BodyJASA, TIRTA
MO Env. RegularYearly
Pollution ControlBoards
–
–
(34) (35) (36) (37) (38) (39) (40) (41)
45

Country
15. Mongolia
16. Nigeria
17. Pakistan
18. Slovenia
19. South Africa
20. Thailand
21. Turkey
22. USA
23. Spain
URBAN AREA EFFLUENT AND IRRIGATION WATER EXCHANGE
Facility availableNumber Capacity Used Capacity Cost USD Major consumers
Legalresponsibility of
MuncipalityTreat. of M&I Cost USD
Agencymonitoring
5
–
–
–
72 nos.
–
–
–
–
–
–
–
–
2.8 MCM (PU)
–
–
–
–
.069 km3
–
–
–
–
–
–
–
–
–
–
–
–
0.2 / m3
–
–
–
–
–
–
–
–
Indus cooling
Clooling, land-scaping, Golf. irrig.
–
–
–
Irrigation .059Golf courses .010
M – 0.042/m3
I – 0.150/m3
–
–
Per 1000m3–447;10000–360; 1X10⁵–254; 5X10⁵–175
0.28/M3
–
–
–
0.25 to 0.60per m3
YES
YES
YES
YES
YES
–
–
YES
YES
Deptt. of WaterFacultyMonthly
–
Muncipal & EPA
Hydro MeteorologicInstitute
DWAFDaily to quarterly
–
–
EPADaily, annually
–
(34) (35) (36) (37) (38) (39) (40) (41)
46

Country
1. Australia
2. Austria
3. UK
4. China
5. Cyprus
6. Egypt
7. France
8. Germany
9. Italy
10. Indonesia
11. Israel
12. India
13. Korea
14. Malaysia
By use of saline/brackish sea water
Survey to findpotential use
Areairrigated
Resulting cost USD/Cum
Sea waterbased
Land based
State FundedProg. for use of
desalinatedwater
Priority for Modern Irrigation Practices
Most promising (Priority)OthersSurfaceSprinkler Micro
6
The digits denote the priority indicated.
YES
–
–
–
YES
YES, Incoastal areas
–
–
YES(.05 km3)
–
YES (Not forsea water
–
–
–
–
–
–
67000 ha
Potentialfound
Limited tosummer resorts
–
–
15000 ha(Surface)
–
45000 ha
–
–
–
1.6 to 2.5
–
–
–
–
2.0
–
–
4/cum
–
1.0
–
–
–
–
–
–
–
–
–
–
–
–
–
0.8
–
–
–
–
–
–
–
–
Yes – Researchpurposes
–
–
–
–
–
–
–
–
3
1
–
3
2
3
1
–
2
–
2
–(71000 ha)
10%
2
2(Trickle)
2
–
4
1
2
2
–
1
–
1
–
10%
3
1(Improved)
Others
–
1
–
1
3
–
3
–
–
–
80%
1
–
–
–
2 (Pipe)
–
–
4
–
–
–
–
–
–
–
(42) (43) (44) (45) (46) (47) (48) (49) (50)
47

Country
15. Mongolia
16. Nigeria
17. Pakistan
18. Slovenia
19. South Africa
20. Thailand
21. Turkey
22. USA
23. Spain
By use of saline/brackish sea water
Survey to findpotential use
Areairrigated
Resulting cost USD/Cum
Sea waterbased
Land based
State FundedProg. for use of
desalinatedwater
Priority for Modern Irrigation Practices
Most promising (Priority)OthersSurfaceSprinkler Micro
6
–
–
–
–
YES
–
–
–
YES
–
–
–
–
Insignificant
–
–
–
–
–
–
–
–
780/1000 m3
–
–
–
0.6 to 1.4
–
–
–
–
200/1000 m3
–
–
–
0.2 to 0.8(Saline)
–
–
–
–
–
–
–
–
Incentives insame region
2
2
–
2
3
4
–
2
2
3
3
–
1
1
3
–
1
1
1
1
1(Furrow)
–
2
1
–
3
Land grading
–
–
–
–
2 (Drip)
–
–
–
–
The digits denote the priority indicated.
(42) (43) (44) (45) (46) (47) (48) (49) (50)
48
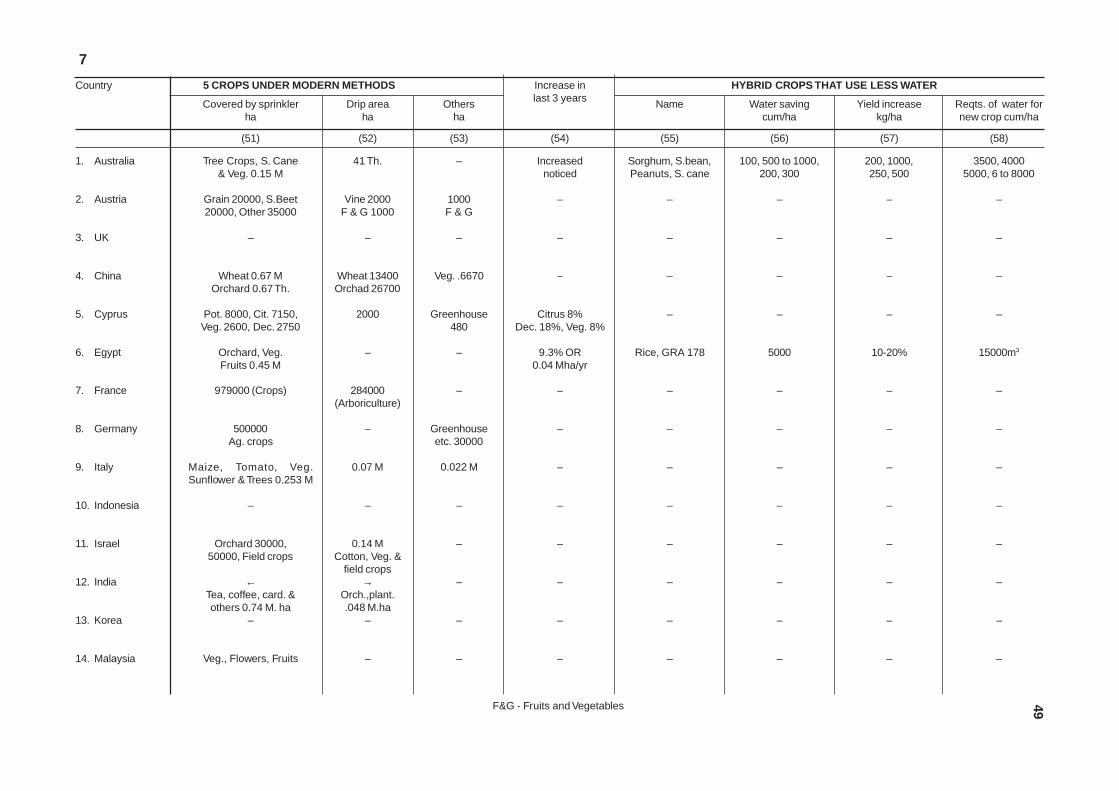
Country
1. Australia
2. Austria
3. UK
4. China
5. Cyprus
6. Egypt
7. France
8. Germany
9. Italy
10. Indonesia
11. Israel
12. India
13. Korea
14. Malaysia
5 CROPS UNDER MODERN METHODS
Covered by sprinklerha
Reqts. of water fornew crop cum/ha
Yield increasekg/ha
Water savingcum/ha
Name
HYBRID CROPS THAT USE LESS WATERIncrease inlast 3 yearsOthers
haDrip area
ha
7
F&G - Fruits and Vegetables
Tree Crops, S. Cane& Veg. 0.15 M
Grain 20000, S.Beet20000, Other 35000
–
Wheat 0.67 MOrchard 0.67 Th.
Pot. 8000, Cit. 7150,Veg. 2600, Dec. 2750
Orchard, Veg.Fruits 0.45 M
979000 (Crops)
500000Ag. crops
Maize, Tomato, Veg.Sunflower & Trees 0.253 M
–
Orchard 30000,50000, Field crops
←Tea, coffee, card. &others 0.74 M. ha
–
Veg., Flowers, Fruits
41 Th.
Vine 2000F & G 1000
–
Wheat 13400Orchad 26700
2000
–
284000(Arboriculture)
–
0.07 M
–
0.14 MCotton, Veg. &
field crops→
Orch.,plant..048 M.ha
–
–
–
1000F & G
–
Veg. .6670
Greenhouse480
–
–
Greenhouseetc. 30000
0.022 M
–
–
–
–
–
Increasednoticed
–
–
–
Citrus 8%Dec. 18%, Veg. 8%
9.3% OR0.04 Mha/yr
–
–
–
–
–
–
–
–
Sorghum, S.bean,Peanuts, S. cane
–
–
–
–
Rice, GRA 178
–
–
–
–
–
–
–
–
100, 500 to 1000,200, 300
–
–
–
–
5000
–
–
–
–
–
–
–
–
200, 1000,250, 500
–
–
–
–
10-20%
–
–
–
–
–
–
–
–
3500, 40005000, 6 to 8000
–
–
–
–
15000m3
–
–
–
–
–
–
–
–
(51) (52) (53) (54) (55) (56) (57) (58)
49

Country
15. Mongolia
16. Nigeria
17. Pakistan
18. Slovenia
19. South Africa
20. Thailand
21. Turkey
22. USA
23. Spain
7
5 CROPS UNDER MODERN METHODS
Covered by sprinklerha
Reqts. of water fornew crop cum/ha
Yield increasekg/ha
Water savingcum/ha
Name
HYBRID CROPS THAT USE LESS WATERIncrease inlast 3 yearsOthers
haDrip area
ha
Veg. 1000,S.beet 500
SugerVegetable
Nil
Orchard 3000Field 500
Wheat, Maiz, S. Cane,Vines? & Lisc. 575000
Duriam, Ranbutaes,Orange, flowers
–
Corn, Alfalfa,Orchad, Veg. →
Maize, colives, beats,vineyards
S. beet 600
Orchard S.
–
Veg. 1000
23000, Vines,& S. Cane
–
–
2.26 Mha, 1.05Mha, .55 Mha, .48
Mha, .38 Mha
–
–
–
Furrow
–
–
–
–
10152, 11154,109341, 834,34444 & 4977
–
S. beet
–
Experimental
–
–
Fruits / crops
–
–
Increase noticed
–
–
Under Researach
–
–
–
Developed
Developed
High yield or highvalue crops
–
–
–
–
–
Saving is there
–
–
–
-
–
–
–
–
–
–
–
–
–
–
–
–
–
–
–
–
–
(51) (52) (53) (54) (55) (56) (57) (58)
50

Country
1. Australia
2. Austria
3. UK
4. China
5. Cyprus
6. Egypt
7. France
8. Germany
9. Italy
10. Indonesia
11. Israel
12. India
13. Korea
14. Malaysia
Agr. Inst whodevelop cropsfor less water
Nature ofcoordination
Agency forcoordination
MANAGEMENT OF IRRIGATION SYSTEMWho lays downreqt. of water
Whetherwater audit
done/agency
Frequency
Who operatesirrig. systems
Funding ofOM&M
OM&M fundsdetermination
8
Direct % denotes the extent of charges paid by users.
HRS, CSIRO,JBRS, CRC,DDR, MUR
–
–
–
–
AGRC, ICS,WSRI, RRC
–
–
–
–
Appliedesearch Inst.
& 3 othersCSIR, IARI,
RAC
–
–
–
–
–
–
WDD & Localaut. h.
Membrs of BoardAdv. Council
–
–
National or Reg.Govt.
–
ARO, MOA, Agr.
CADA & Ext.Unit
–
MO Agr.
Local State Govt.,Deptt of Water & RuralWater Authority
Federal Ministry ofHealth – ALL
–
MOWR & M OConst.
Local agenciesand DO Agr.
Water Supply Auth.,Municip, MOI/Power
Governed byDemand/Supply
Publicregulation
National or RegionalGovt.
Local Govt.
Water Commissioner
Irrigation AuthorityMuncipality
Local agencies
Ministry of Transpt.MOAG, MOAF
Water Authority
–
Done
Done,Envi. Agncy
DoneMOWR
DoneWDD
Water SupplyAuthority
(On actual use)
–
Auth. of CA
–
All Govt.
Done
–
–
–
As per legalprocedure
Yearly
States
Yearly
Always
–
–
Annual
–
Regular
Each cropseason
–
–
Govt. 60%, User20%, Joint 20%
User 100%
User operated
Govt. >50%, User25%, Joint <25%
Govt. & users
Govt. 100%
–
User onealso jointly
Joint operate
Joint operate
Govt./User/Joint
Govt.
Joint
Govt.
Govt. 12%, Direct80%, Others levy3%,
Users 100%
–
Govt. 80%Direct 20%
Govt., Direct,other levies
–
Combination
Direct payment
–
–
Govt. 100%
Govt. 100%
Govt. 90%Direct 10%
Govt. 100%
By need & tosome extent onhistoric level
By need
Env. Agencychanging scheme
By need
By need &historic
By need rohistoric % of
capitalBy need historic
% of capital
Need, % ofcapital
By need & o/ocapital
Need on historiclevel
On capital outlay
Historic & byactual need
By need
By need &historic exp.
Very little betweenEngrs. &Scientists
–
–
–
Mutual Coop.
YESMultidisciplinary
–
–
Organisational
–
Multidisc.& Org.
–
Org.
Multidisc.
(59) (60) (61) (62) (63) (64) (65) (66) (67)
51

Country
15. Mongolia
16. Nigeria
17. Pakistan
18. Slovenia
19. South Africa
20. Thailand
21. Turkey
22. USA
23. Spain
Agr. Inst. whodevelop cropsfor less water
Nature ofcoordination
Agency forcoordination
MANAGEMENT OF IRRIGATION SYSTEMWho lays downreqt. of water
Whetherwater audit
done/agency
Frequency
Who operatesirrig. systems
Funding ofOM&M
OM&M fundsdetermination
8
P&ARI, WPI,TIPH
IAR, NCR,NIHR
PARC& U. Ag.
Bio. Fac. Inst.of Agr. HOPS
–
–
GDHS
Water Res.Colorado,Texas &
California–
Organisational
YES
Three extensionService
–
–
-
Tech. Researchmeetings
Exists
–
MOS&E
FederalMinisteries
MOA&FProvn. Irrig.
Experiencedspecialists
–
–
–
None, UOAg. &Research Center
–
Department of WaterMOFL Cos.
FederalMOWR & RD
Provincial Govt.
–
Consumer andDemand
–
–
Individual StateGovt.
River BasinAgencies
Done
–
Done by IndusBasin Authority
–
Done
–
–
Done byState Govts.
Done
3 months
–
Biyearly
–
DWAF & Irrg.Weekly
–
–
As needed
–
User
Joint
Govt.
User & Joint
Govt. 346000, haUser 854000, haJoin. 1000000 ha
–
–
Govt./User/Joint
>10m3, RBA<10m3, IA
Direct 10%,Levies 10%, Profit80%Govt. 60%, Direct20%, levies 20%
Govt. grant &Water Charges
Direct payment
Budget onTrading a/c
DWAFGovt. 99%Direct 1%
–
Direct 100%
Managementagencies
Need
Historic
Historic
Need
Need
Need
–
Need
Historic
(59) (60) (61) (62) (63) (64) (65) (66) (67)
52

Country
1. Australia
2. Austria
3. UK
4. China
5. Cyprus
6. Egypt
7. France
8. Germany
9. Italy
10. Indonesia
11. Israel
12. India
13. Korea
14. Malaysia
WATER CHARGES
Basis of water charges
Where doesthe money go
9
Payingperson
Sanction fornon-payment
Frequency ofcollection
CollectionAgency
Method ofassessment
ACP - Average Cost Price
On historic land &inflation
Average cost pricing
EnvironmentAgency
Charging schemeHistoric & Inflation
–
No charge, costrecovery for improve-
ment after 5 yrsAve. cost pricingopportunity cost
ACP
ACP
Mutual Agr.
Perceivedaffordablility
As per crop type
–
Historic &affordability
-
On volumetric basis
On duration of supply
On land area;Measured discharge;Duration; Volumetric
Criteria andguidelines
–
On crop area
On measureddischarge
By permit/discharge
On crop area
On volumetricbasis
By crop area
By crop area
On land area
Done by Govt.mostly
WUA
Govt. Agency
Other Agency WUA
Jointly with Govt.
No charges
Water Agencies
Other agency
Govt. agency
WUA
Water supply Co.
Govt.
Other agency
Govt.
Mostly annual
Annual / monthly
Yearly
Annual
Yearlybi-monthly
–
Yearly
Yearly
Yearly
Yearly
Bimonthly
Crop season
Yearly
Annual
Withdraw serviceLegal
Legal proceedings
Licence isrevoked
WithdrawService, legal acts
Withdraw servicelegal action
–
–
Withdraw service& legal action
Withdraw service
Withdraw &legal action
Withdraw Service& legal action
Legal procedure
Withdrawal ofservice
No Sanctions
Land owners
mostlyLand owners
Licence Holder
Land owners, Farmersgroup
Land owners
–
–
Land owners,Tenant
Permit holder
Tenants
Land owners
Land owners
Land owners
Land owners
Mostly Govt. O&Mmostly
WUA
NEA fund
Govt. gen. revenue
WUA & others
–
Water agencies
WUA
WUA
WUA & Govt.
WS Co.
Govt. GR
Other agency
Govt. GR
(68) (69) (70) (71) (72) (73) (74)
53
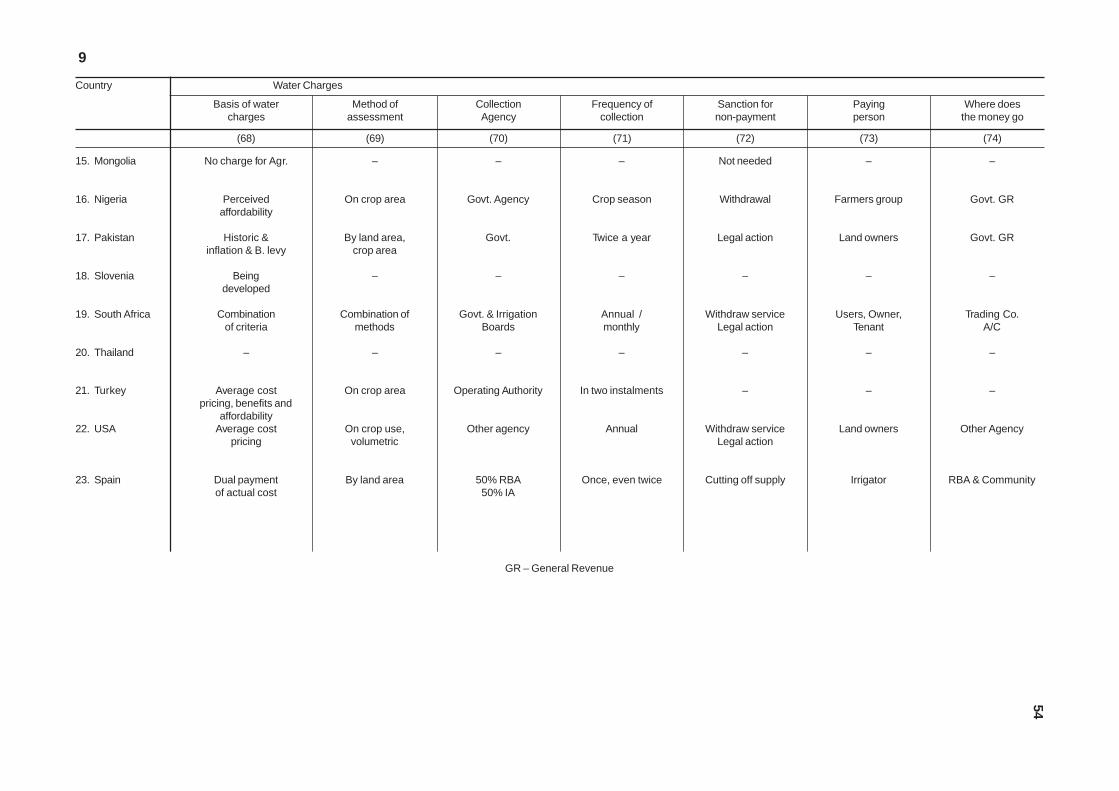
Country
15. Mongolia
16. Nigeria
17. Pakistan
18. Slovenia
19. South Africa
20. Thailand
21. Turkey
22. USA
23. Spain
9
Water Charges
Basis of watercharges
Where doesthe money go
Payingperson
Sanction fornon-payment
Frequency ofcollection
CollectionAgency
Method ofassessment
No charge for Agr.
Perceivedaffordability
Historic &inflation & B. levy
Beingdeveloped
Combinationof criteria
–
Average costpricing, benefits and
affordabilityAverage cost
pricing
Dual paymentof actual cost
–
On crop area
By land area,crop area
–
Combination ofmethods
–
On crop area
On crop use,volumetric
By land area
–
Govt. Agency
Govt.
–
Govt. & IrrigationBoards
–
Operating Authority
Other agency
50% RBA50% IA
–
Crop season
Twice a year
–
Annual /monthly
–
In two instalments
Annual
Once, even twice
Not needed
Withdrawal
Legal action
–
Withdraw serviceLegal action
–
–
Withdraw serviceLegal action
Cutting off supply
–
Farmers group
Land owners
–
Users, Owner,Tenant
–
–
Land owners
Irrigator
–
Govt. GR
Govt. GR
–
Trading Co.A/C
–
–
Other Agency
RBA & Community
GR – General Revenue
(68) (69) (70) (71) (72) (73) (74)
54

Country
1. Australia
2. Austria
3. UK
4. China
5. Cyprus
6. Egypt
7. France
8. Germany
9. Italy
10. Indonesia
11. Israel
12. India
13. Korea
14. Malaysia
10
Basin orientedsetup
Compre. waterpricing policy
Is it a flat ratePresent charges USD
Water pricing
Rural domest. per m3 Muncipal domest. m3 Industrial self/supply m3 Irrigation m3 or ha Others
0.01 to 0.12
0.5
–
0.01
8.2 to 8.10 perkm3 per month
–
0.5
1.5
0.4
0
0.34
VariablePlace to place
source to source–
–
0.2 to 0.5
1.5
–
0.04
.3 to .6
.05
0.5
1.5
0.7
.008
0.34
Variable
–
–
0.01 to 0.120.1 to 0.5
.5 to 1.0
–
.01
5.7 to 21 km3
0.10 supplied
0.3/0.70
–
0.70/0.4
0.013
0.26 (self)
Variable
about 0.27
–
0.005 to 0.07
0.1
–
.0025 to 0.012
0.11 to 0.14
No charge
0.18
0.1 to 0.5
0.1
No charge
0.16, 0.19, 0.2650%, 30% & 20%
of allocationsCrop based
differ from placeand source
Rice crop is onlycharged
–
–
–
–
–
Live stock0.26
–
–
–
–
–
–
–
–
–
Increasing block
–
–
–
Increasing blockrate
Flat rate
–
–
Local basin
Block
–
Flat
–
Flat
Established
–
EstablishedEnviron. Agency
MOWR by law
For irrigation it issubsidised & otherpay full cost
MPPWWR
Min. of Environ.
Not for irrig.
MOPW
–
Prices determinedyearly
Established
Established
Economic PlanningUnit
StatesExists
–
Yes, By lawBy Coop.
ExistsCoop.
–
Exists
Exists
–
Exists
–
Exists
Exists
Exists
–
(75) (76) (77) (78) (79) (80) (81) (82)
55

Country
15. Mongolia
16. Nigeria
17. Pakistan
18. Slovenia
19. South Africa
20. Thailand
21. Turkey
22. USA
23. Spain
10
Basin orientedsetup
Compre. waterpricing policy
Is it a flat ratePresent charges USDWater pricing
Rural domest. per m3 Muncipal domest. m3 Industrial self/supply m3 Irrigation m3 or ha Others
–
–
–
–
User specific
–
–
Determined bylocal water supply
1.25
–
2.00 per month
Depend on type ofcrop
–
Area andscheme specific
–
–
–
0.75
0.042 Self.15 Supplied
–
–
–
–
–
–
–
Wide range
–
10.00 per haper season
3.70/ha
–
Pipe dia and asper quota
–
.005
–
0.02 to 0.2
–
–
–
–
–
–
–
–
–
Flat rate
–
Crop based
–
User specific
–
Flat for irrigation,Rest block
Flat rates inirrigation
–
MONR & Env.
–
Established
Established
Departmentof Water
Royal IrrigationDepartment, NWRC
–
–
Under process
Exists
Exists
Exists
Exists
Exists
Exists
–
Exists
Exists
(75) (76) (77) (78) (79) (80) (81) (82)
56
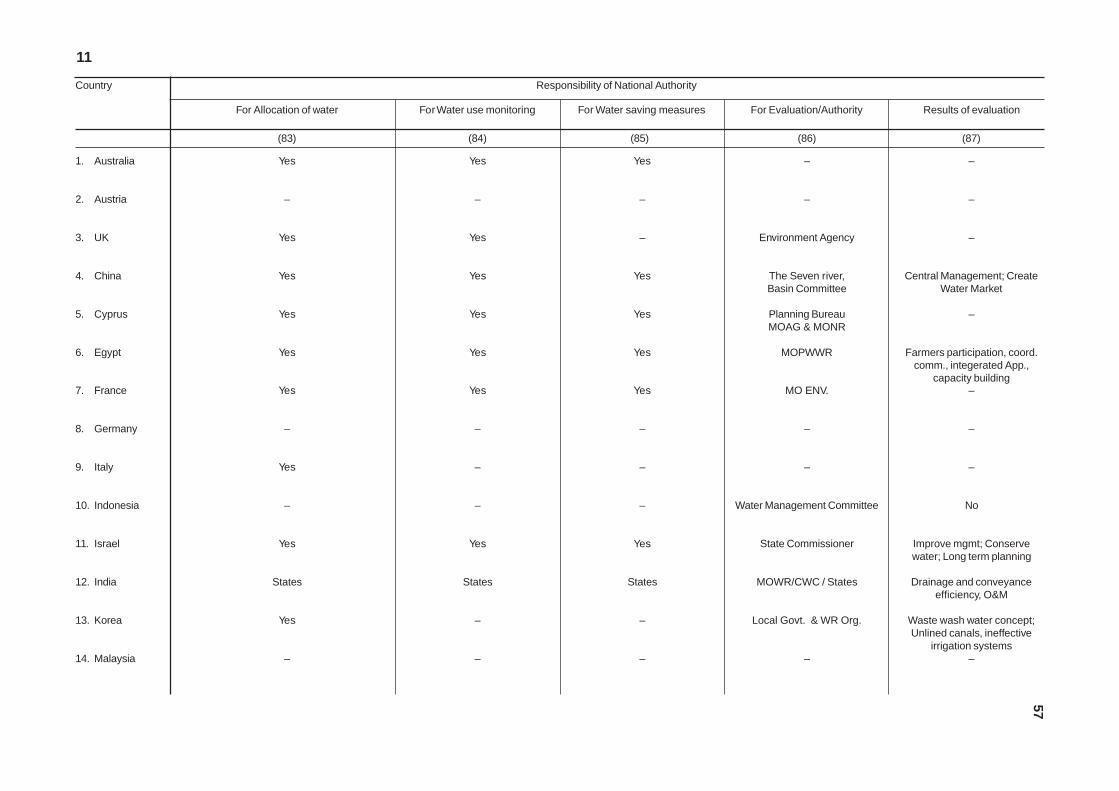
Country
1. Australia
2. Austria
3. UK
4. China
5. Cyprus
6. Egypt
7. France
8. Germany
9. Italy
10. Indonesia
11. Israel
12. India
13. Korea
14. Malaysia
11
Responsibility of National Authority
For Allocation of water For Water use monitoring For Water saving measures For Evaluation/Authority Results of evaluation
Yes
–
Yes
Yes
Yes
Yes
Yes
–
Yes
–
Yes
States
Yes
–
Yes
–
Yes
Yes
Yes
Yes
Yes
–
–
–
Yes
States
–
–
Yes
–
–
Yes
Yes
Yes
Yes
–
–
–
Yes
States
–
–
–
–
Environment Agency
The Seven river,Basin Committee
Planning BureauMOAG & MONR
MOPWWR
MO ENV.
–
–
Water Management Committee
State Commissioner
MOWR/CWC / States
Local Govt. & WR Org.
–
–
–
–
Central Management; CreateWater Market
–
Farmers participation, coord.comm., integerated App.,
capacity building–
–
–
No
Improve mgmt; Conservewater; Long term planning
Drainage and conveyanceefficiency, O&M
Waste wash water concept;Unlined canals, ineffective
irrigation systems–
(83) (84) (85) (86) (87)
57

Country
15. Mongolia
16. Nigeria
17. Pakistan
18. Slovenia
19. South Africa
20. Thailand
21. Turkey
22. USA
23. Spain
11
Responsibility of National Authority
For Allocation of water For Water use monitoring For Water saving measures For Evaluation/Authority Results of evaluation
Yes
Yes
Yes
MOEN
Yes
Yes
Yes
States
Yes
Yes
–
Yes
–
Yes
Yes
Yes
States
Yes
Yes
–
Yes
–
Yes
Yes
Yes
States
Yes
–
River basin and ruraldevelopment authority
River Basin Authorityand MOWP
Hydrometeorological Institute
Water Boards and LocalAuthority
–
DSI, GDMS, & Directorate ofRural Development
Yes
Bureau of Reclamation, Corpsof Engineers, Tenn. Authority
River Basin agencies
–
Inadequate O&M;Under use of resources
Yes
–
Keep on improving
–
Involve users; Water saving;Improve farmers management
–
Need to regulate water transferand strategic use of
groundwater
(83) (84) (85) (86) (87)
58

Country
1. Australia
2. Austria
3. UK
4. China
5. Cyprus
6. Egypt
7. France
8. Germany
9. Italy
10. Indonesia
11. Israel
12. India
13. Korea
14. Malaysia
Programme for saving water
National Prog. for WaterSavings Name
Cap. outlayUSD
Startingyear
Targetyear
Expectedwater saving
Public awarensssDoes a Statesponsored prog.
for waterconservation exit
Measuresadopted
Evaluationreports
Lesson
12
Each State has Programbased on considerations
–
–
300 counties watersavings demos
Improved Water UseProject
Irrigation ImprovementProject
–
–
Public Law
–
Public campaign to reduceconsumption in drought years
Participatory water report
–
–
–
–
–
375 M
–
70 M
–
–
–
–
–
–
–
–
–
–
–
1996
1965
1984
–
–
–
–
–
–
–
–
–
–
–
2000
Contd.
1996
–
–
–
–
–
–
–
–
–
–
–
6 km3
6 km3
5 km3
–
–
–
–
10%
–
–
–
YES‘Water wise’
–
–
YESDam contd. & G/
W rechargeYES
Water law
YES
Some Studiesin hand, watersaving 15-20%
–
Local Law
YESSpecific decrees
to save waterYes
YES
–
Media &other Means
–
–
Media & othermethods
Media conserve& save water
Media &others
Media&others
Applicationtechno. modified
–
Media&others
Water scarcity &save water
Media &others
Media &others
Media &others
Conducted
–
–
–
Conducted5 KM3
–
–
–
–
Conducted
–
–
–
–
The States haveadopted
measures–
–
–
–
Recently started
–
–
–
Water usersknowhow
Impact is mea-sured bylow use & sale ofdevices save water
–
–
–
(88) (89) (90) (91) (92) (93) (94) (95) (96)
59
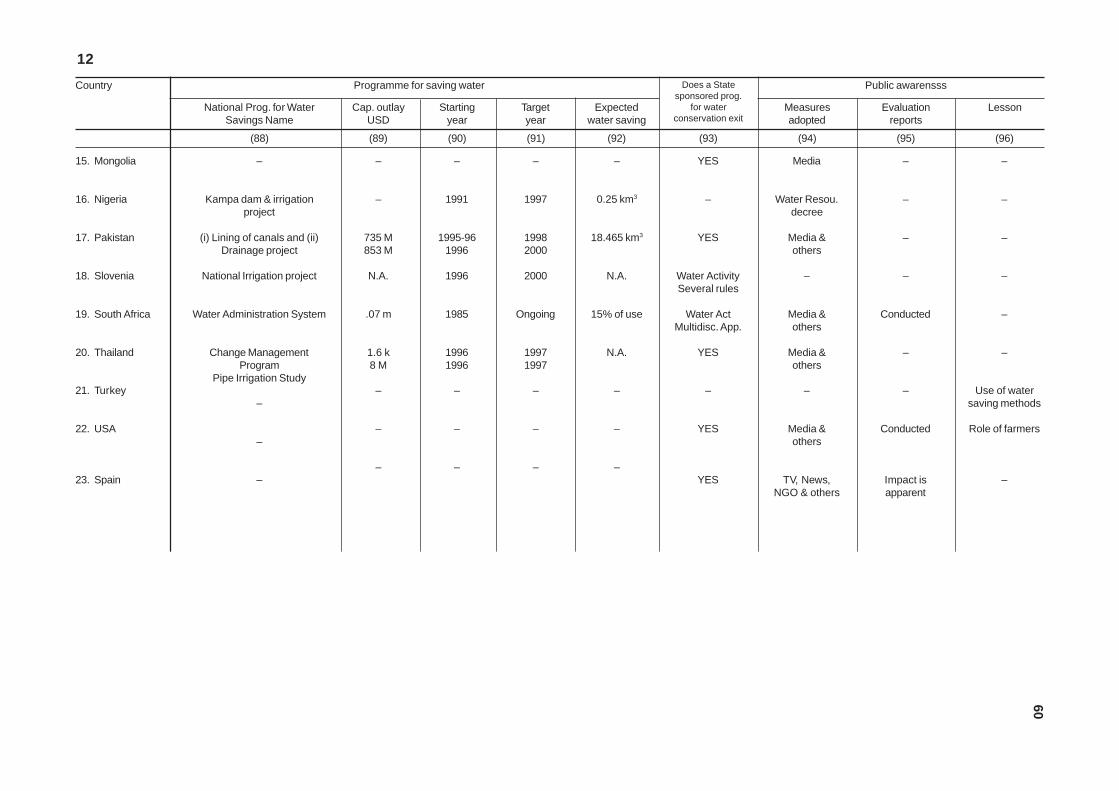
Country
15. Mongolia
16. Nigeria
17. Pakistan
18. Slovenia
19. South Africa
20. Thailand
21. Turkey
22. USA
23. Spain
Programme for saving water
National Prog. for WaterSavings Name
Cap. outlayUSD
Startingyear
Targetyear
Expectedwater saving
Public awarensssDoes a Statesponsored prog.
for waterconservation exit
Measuresadopted
Evaluationreports
Lesson
12
–
Kampa dam & irrigationproject
(i) Lining of canals and (ii)Drainage project
National Irrigation project
Water Administration System
Change ManagementProgram
Pipe Irrigation Study
–
–
–
–
–
735 M853 M
N.A.
.07 m
1.6 k8 M
–
–
–
–
1991
1995-961996
1996
1985
19961996
–
–
–
–
1997
19982000
2000
Ongoing
19971997
–
–
–
–
0.25 km3
18.465 km3
N.A.
15% of use
N.A.
–
–
–
YES
–
YES
Water ActivitySeveral rules
Water ActMultidisc. App.
YES
–
YES
YES
Media
Water Resou.decree
Media &others
–
Media &others
Media &others
–
Media &others
TV, News,NGO & others
–
–
–
–
Conducted
–
–
Conducted
Impact isapparent
–
–
–
–
–
–
Use of watersaving methods
Role of farmers
–
(88) (89) (90) (91) (92) (93) (94) (95) (96)
60

Country
1. Australia
2. Austria
3. UK
4. China
5. Cyprus
6. Egypt
7. France
8. Germany
9. Italy
10. Indonesia
11. Israel
12. India
13. Korea
14. Malaysia
Gender Aspects
Traditional Roleof Women
Nature ofinvolvement
Training forWomean
Are they inWUA
Any formal actto encourage
Manpower Planning & Capacity Building
Does a manpowerpolicy exist
Quantification ofneeds for OM&M
Staff in position forirrigation service
13
–
–
–
Yes
Yes
–
They work asfarmers
Yes
–
No
–
Yes
–
–
No seperate rolework in Tandemday-to-day work
–
–
–
Field irrigation8-16 hrs
Participate in someactivity 1-2 hrs
No specific role
–
–
–
–
Assisting6-8 hrs
–
–
Imparted
–
–
Imparted
High level
Limited level
–
Imparted
–
–
–
–
–
–
Yes in all capacity
Yes
–
Yes
Yes
–
Yes
Yes
Yes
–
Yes
–
–
Yes
Exists
–
–
Exists
–
–
–
–
–
–
Exists
Exists
–
–
–
–
–
Exists
–
Exists
–
–
–
–
–
Exists
–
–
–
–
–
Yes, Bluecertificate 1996
–
Done
–
–
–
Exists
–
Exists
–
–
Varies fromState to State
Water Mgmt. Dn.
–
Yes
Directorate ofIrrigation
MPWWR, SeveralUnits, State Units
–
No. of posts inState / Region
Organised by Inde-pendent Agencies
Directorate & OtherOfficers/Offices in
positive–
Chief, Supdg.,Execu. A.En. &
other staff–
–
(97) (98) (99) (100) (101) (102) (103) (104)
61
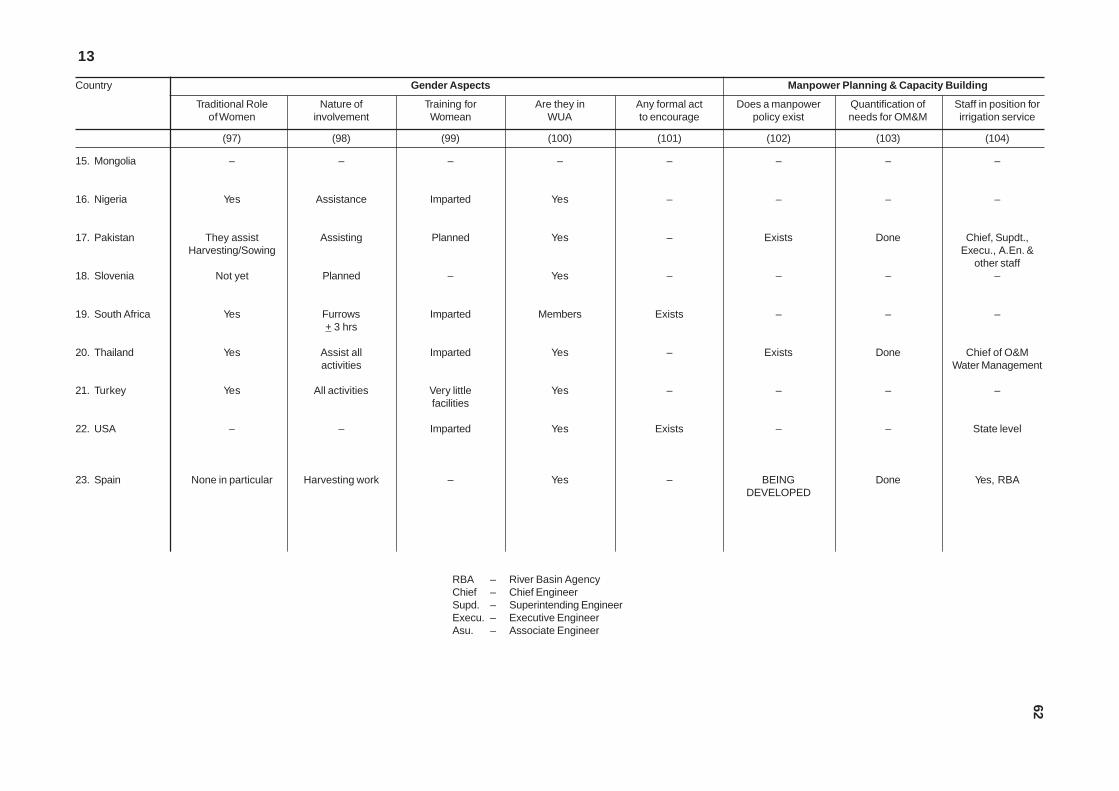
Country
15. Mongolia
16. Nigeria
17. Pakistan
18. Slovenia
19. South Africa
20. Thailand
21. Turkey
22. USA
23. Spain
Gender Aspects
Traditional Roleof Women
Nature ofinvolvement
Training forWomean
Are they inWUA
Any formal actto encourage
Manpower Planning & Capacity Building
Does a manpowerpolicy exist
Quantification ofneeds for OM&M
Staff in position forirrigation service
13
–
Yes
They assistHarvesting/Sowing
Not yet
Yes
Yes
Yes
–
None in particular
–
Assistance
Assisting
Planned
Furrows+ 3 hrs
Assist allactivities
All activities
–
Harvesting work
–
Imparted
Planned
–
Imparted
Imparted
Very littlefacilities
Imparted
–
–
Yes
Yes
Yes
Members
Yes
Yes
Yes
Yes
–
–
–
–
Exists
–
–
Exists
–
–
–
Exists
–
–
Exists
–
–
BEINGDEVELOPED
–
–
Done
–
–
Done
–
–
Done
–
–
Chief, Supdt.,Execu., A.En. &
other staff–
–
Chief of O&MWater Management
–
State level
Yes, RBA
RBA – River Basin AgencyChief – Chief EngineerSupd. – Superintending EngineerExecu. – Executive EngineerAsu. – Associate Engineer
(97) (98) (99) (100) (101) (102) (103) (104)
62

THE WATSAVE SCENARIO 63
IV. PACE SETTING SUCCESSES
The chapter on country specificities already recounts the general countryscenario with reference to the watsave aspects. In addition, there aremany notable outcomes of their studies and experiments with watsave
techniques and procedures. These have been summarised in this chapter toindicate the patterns in watsave activities that are likely to emerge in future.
AUSTRALIA
Australia is fastly improving its water management scenario through field studiesthat promote regional specific solutions.
• Use of modern techniques by measuring soil-moisture by installation ofwatershed Neutron probes for integrated crop management was tested inQueensland where cotton is grown in 20 Th.ha, when significant watersavings were demonstrated. Recycling of tail water and a new pricing systemprompted the irrigators for efficient water use for better returns.
• Adoption of Trickle/Drip irrigation enabled reduction in water and powerconsumption by 30% as was revealed by a study conducted by QueenslandDepartment of Primary Industries on yields of sugarcane.
• Experiments on adoption of sub-surface irrigation through buried pipes toallow the water to seep in, that were taken up by Sunreysia Rural WaterAuthority, have demonstrated the potential benefits for irrigators using furrowirrigation methods.
• Water management with appropriate investigation of soil characteristics inSouth Australia by a fruit grower enabled growing of more vines with lesswater, increasing his return from $ 7000 per ha to $ 20000 per ha.
• In Barrybank Farm, Windemere, a 12000 head piggery, producing 210 KL ofwastewater, a treatment/recycling plant was provided at a cost of US $ 2.3Mwhich reduced freshwater intake by 70%, and the plant is slated to recoverits cost in a period of 7 years.
AUSTRIA
Water metering, redimensioning of legal water allowances on stripfing-ZevendorfProject in Austria, and installation of 60 km conduit pipe line, 300 pressure outletsand water meters in an area covered by 200 small-medium size wells costing US

THE WATSAVE SCENARIO 64
$ 50M proved to be an automatic incentive for water savings while use of dieselpumping sets reduced pollution too.
BANGLADESH
Bangladesh has erected 2 rubber dam structures with expertise from China,having 3 and 3.5M height which can be inflated to volumes of 800 and 1200 cumto weigh 7 and 14 Tons respectively. Skin of the dam-bags is 7mm and 8 mmthick with a tensile strength of 25T and 37T per metre width. Water is storedduring the peak season for supply of water to the area of 2000 and 6000 harespectively during lean periods and is managed by the farmers. The unit costworked out to US $ 56 and 67 per ha. The dams also act as barriers to tidal waterinroads to prevent salinity.
In a case study conducted by Loughborough University of Technology andBangladesh Agriculture Research Institute, it was found that in a piped watersupply upto fields and with earthen field channels from canals/reservoirs in 50/100 ha areas, the size and spacing of the pipes will depend on the capability tocope with water hammer and pressure surge for which pressure controlstructures may be needed. It was also found that by following this method theland-intake could be reduced by 0.5 to 2% and transit losses reduced by 75 to90%. It was adjudged to be suitable for areas upto 100 ha to be preferred when(i) soils are poor in cohesion and cause significant seepage losses, (ii) Micro-topography inhibits construction of earthen channels or when the cost is high,and (iii) Water is limited and valuable or restrictions on abstraction (groundwater)are in vogue.
A study on the role of a NGO, Grameen Krishi Foundation - GFE-1991 {havinga bank as a subsidiary with a turnover of US $ 7.0M) revealed that the advent oftubewells.when crops could be grown all the year, significantly increased incomeby 78% and 100% for marginal and middle level households. The foundation(GFE) helped women in access to the land and water alongwith direct irrigationservices individually or in groups and discovered positive impacts since 1992. Anincrease in income, contribution to household, increased self confidence wasnoticed with less dependence on the male-folk. The GFE is emphasising on thebank to support better marketing facilities, control and education.
CHILE
A study on adoption of modern methods of irrigation (Drip) in place of furrowirrigation (Lliu-Lliu Project) on Avocado Pear Plantation demonstrated a bigincrease in application efficiency from 45% to 90% reducing the water input byhalf i.e. from 20198 cum/ha/yr to only 10198 cum/ha/yr.
Water is a tradable commodity and rights of use can be granted to private agents/enterprenuers who organise the best use of the water.

THE WATSAVE SCENARIO 65
CYPRUS
Cyprus is promoting piped (pressure) supplies, and constructing small tomedium scale irrigation schemes. The ‘Southern Conveyor’ Project in Cypruscovering 13500 ha (cost US $ 350M) includes one tertiary sewage treatmentplant. Treated water is blended with freshwater and supplied for irrigation usein five of its districts.
‘Vasilkos-Pendes-Kisiors’ Project contemplates conjunctive use of water in anarea of 1525 ha as also supplying water for domestic use (50%) at a cost of US$ 50M, and resorting to distribution of water through pipes.
‘Paphos’ Irrigation Project is providing irrigation to an area of 5110 ha using 24borewells and water-supply through pipes. Pumping stations and other regulatingstructures have been built for supply at constant discharge and pressure forSprinkler/Drip Irrigation.
EGYPT
An irrigation improvement project was implemented in the last 12 years ata cost of US $ 70M and with the support of USAID and UNDP for improvingoverall efficiency of water use as also, to over come the constraints inoptimum crop production. The major findings arrived at from this experiencenow constitute a model for others to be replicated in more areas. Theextension of the project is now supported by the World Bank, and theobjectives have under gone some refinements. The lessons/findingsreproduced here, have been highly revealing:
• Delivery efficiencies increased by 30-40%
• Pumping costs per unit area per season reduced
• Time-duration for irrigation was cut short by 50-60% with single point liftmesqa.
• Number of pumps required reduced
• Land savings were noticed
• Average mesqa O&M reduced
• Inequitable distribution between head and tail eliminated
• Farmers participation increased
• Crop yield increased, for example, Cotton increased by 9.2%, Maize by14.1%, wheat by 30% and sugarcane by 16%
Enriched with the experiences of its earlier MPWWR Project of 1984, the projecthas now been extended to another 147 Th.ha costing US $ 120M and renamedas irrigation management system project.
THE WATSAVE SCENARIO 66
It aims at upgrading of the system efficiency from 50% (1990) to 90% (Yr 2000).The old existing system is to be improved by reconstruction, realignment of alltypes of canals, lining of canals, elevated water courses, buried pipeline watercourses to save 10% of water. Water user groups are to be formed and irrigationadvisory body comprising of government authorities is to provide technologicalassistance to users groups wherever established. Replacement of all old andnon-functional small or medium sized structures has been undertaken. A goodnumber, 20000 structures had been completed by 1994.
The first use of treated wastewater in Egypt was made way back in 1915 in theeastern desert, north-east of Cairo, irrigating an area of 1000 ha under thisproject. It is now proposed to be increased to 61500 ha by the year 2000.
INDIA
Chambal Project (Rajasthan)
The project provides water to an area of 0.229 M.ha. A package of improved onfarm development includes improved water courses, surface drainage,landgrading, realignment of fields, farm roads and provision of main, carrier,seepage and field drains. Steps to arrest seepage from main canal in smalllength by providing diaphragm wall are also in hand. Sub-surface drainage isbeing provided with support from CIDA in some of the areas. A large number ofunauthorised or oversized outlets from canals have been removed to saveoverdrawal of water, thereby incurring a saving of 8 to 10 BCM of water. Theproject originally designed for irrigation at 76% intensity has now touched a levelof 137% of intensity. To lend agronomic support, the State Government providedtwo agricultural demonstration farms for evolving crops and crop culture.Participatory management of water has also been introduced with encouragingresults. The National bank for Agricultural Reconstruction and Development andthe World Bank are helping these measures.
ISRAEL
Achievement of successful irrigated agriculture in an arid country with only about5000 cum/ha (freshwater) has, by itself been a success story. A paper presentedby the Chairmen of Israel’s Public Commissioner on Reforms in Water Sectorin a recent workshop in April 1997, highlights the measures that Israel hasadopted to prosper with less than 300 cum of water per capita per year.Appropriate policies, legislative measures and acting on selected economicalissues had enabled the country to reach a high GDP of US $ 14,400 per capitaper annum and to meet much of its agricultural needs (except grains) throughexport of agricultural products and maintain a high standard of living, all with verylimited freshwater resources.

THE WATSAVE SCENARIO 67
The paper emphasised that the strategy for the future lies with a balancedcombination of measures: legislative, institutional, economic and technological,focussing on water demand management, increased efficiency of water use inagriculture and the industry and reuse of its total surface and groundwaterresources, future water markets (internal) and regional and continuous changesin water scarce conditions within the general background of supply and demandmanagement. A number of major policy options are available in changing thesupply and demand pressures. Israel is already using a host of such measureslike water rate adjustments, government incentives and penalties, investmentcredits to increase water use efficiency, enhanced research and development,wide scale use of soil conservation and extension service as well as localmanufacture of high quality technological systems. Israel has already gone along way in changing the basic production cycle leading to more economicalcropping patterns thus factually producing water through savings and water useefficiency coupled with emphasis on the need to reuse domestic and industrialwastewaters and creating a water market.
PAKISTAN
In Pakistan an examination by IIMI of the salinity balances in 3 differently placedregions which use water from different sources (canals, pumped groundwater)shows that adoption of suitable cropping pattern and agronomic practices cansustain irrigation. One of the three areas (Chasma) used only canal water whilethe other two used both sources of water. The sustainability solutions were foundto be (i) Application of less water, (ii) Lowering the intensity of irrigation and (iii)Lowering of water table by design. It was seen that in Chasma reduction in supplyreduced the rice crop. In another plot (Gugera) where the groundwater drawalswere twice the recharge, a reduction in cropping intensity was helpful.
UNITED STATES OF AMERICA
USA is promoting sub-surface method of irrigation besides the micro-irrigationtechniques which already cover a large chunk of its irrigated area of 19.99 m.ha.The USBR and various other institutions spread over the country provide a goodsupport in developing crops for specific regions, climatic conditions and wateravailability regimes. Several economic incentives for promoting modern cultivationtechniques have been introduced in USA.
• Impact of the programme of modern techniques came to be examined inBroad-View Water district where syphon-tubes were used for pre irrigationof rice crop and germination of tomato, using surface irrigation in summermonths. The data for five years (1989-94) revealed that pre-irrigationdepth for rice with the modern methods reduced from 0.28m (0.91ft) to0.17m (0.55ft) while in case of early irrigation for tomato the yieldincreased from 81 tons/ha(33T/acre) to 99 tons/ha (40T/acre). It was
THE WATSAVE SCENARIO 68
concluded that low interest soft loans for initial purchase of sprinklers andsupportive demonstration can promote the modern techniques withoutany change in the basic policies.
• USBR have introduced automated control for water delivery in ‘Dolores’Project. The system is controlled through a programmable Master SupervisoryControl Unit (PMSC) and 94 terminal units, this system attached a waterdelivery efficiency of 96% compared to a typical value of 80-90 on other canalprojects. This project is a model USBR showpiece of automated control.
• A study on Deficit Irrigation (with less water) in California basin over aperiod of 10 years demonstrated that deficit (less) irrigation providesbetter production per unit of water than per unit of land. After taking intoaccount direct as well as other costs, it was found that the net incomefrom farms practicing deficit irrigation may have been lower but theyearned higher income per unit of water indicating that the new irrigationpractices using less water were non-optional. The deficit irrigation hasbeen a profitable long-term strategy for all those who have limited watersupplies. Returns on land were low for such farms because the actualwater use therein was often less than half of the nominal waterrequirements.
• A five year study on reuse of tertiary municipal wastewater effluent forirrigation of crops that are eaten raw was conducted in response to thedemand from vegetable growers to establish that such reuse did not pose anyhealth hazard. Three different types of water were used, (i) filtered effluent,(ii) coagulated, flocculated, settled and filtered effluent and (iii) local wellwater in 96 sub-plots. Six crops were common to all. The data on quality ofwater and the crops was compiled and analysed.
The finding was that crops irrigated by the two types of tertiary waters did notdiffer from those grown with the well water. It was also found that there were noviruses in any of the effluent samples and that there was no significant differencein the growth or quality of food crops irrigated with reclaimed domestic wastewater; reclaimed with the currently acceptable norms for treated water or that byfiltration method. No degradation of soil or groundwater was observed. The risklevel from use of reclaimed water for the quality of food appeared to be within theacceptable range.
International Rice Research Institute (IRRI), Philippines
The IRRI is engaged in research and development in water savings in Rice Crop,a crop that is dominant in this part of Asia. Dr. Kenneth S. Fischer, DeputyDirector General for Research on request from ICID sent a keynote on theactivities undertaken by (IRRI) and in water savings, under the title “More rice

THE WATSAVE SCENARIO 69
with less water” which is reproduced here. The note depicts the success in theefforts and the dissemination being organised by IRRI. It speaks of strategiesand approaches for rice production by using less water.
More Rice with Less Water – keynote by Kenneth S.Fischer, Deputy Director General for Research,International Rice Research Institute, Manila.
The amount of water available to each person on this globe is decreasing. Andwith unprecedented growth in industrialisation and urbanisation, agriculture’sshare of water in many Asian countries is becoming smaller. Urbanisation andindustrial demands are generally given higher priority than agriculture. Sincemore than 90% of the agriculture water use in Asia is for rice it follows that riceproduction could be surely affected unless we can increase the efficiency ofwater use.
Irrigated rice land produce about three fourths of the 580 million tons of riceneeded to feed one half of the world people. In 30 years, that figure will rise toaround 800 million tons of rice annually. Increasing water-use efficiency of riceproduction is doubly important, not only because of less water but because of theincrease in production needed to meet demand of rice.
Strategies for increasing water productivity include reducing the non-productive components (wastes) of water input and increasing crop yield. Inrice farms, the amount of water that farmers apply to the field is about 2 to3 times higher than the evapo-transpirative demand of the rice plant. Asmuch as 50% of the applied water during the land preparation period canmove down the soil cracks, bypassing the top soil matrix. This is aggravatedby farmers practice of prolonging the land preparation duration more thannecessary. During the crop growth period, 50-80% of the amount of watersupplied leave the field via percolation and seepage. Indeed some estimatesindicate as much as 5000 liters of water are diverted at the source of thecanal system to produce 1kg. of rice.
But there are opportunities to greatly increase the efficiency of water use. Thebypass flow during land preparation can be reduced by soil surface managementthat minimise the formation of soil cracks or impede the flow of water in thecracks. An example is the practice of dry shallow tillage of the soil soon afterharvesting the previous crop, which is now widely practiced in Muda irrigationscheme in Malaysia. Numerous studies have demonstrated that water savingirrigation techniques such as maintaining soil at saturated or alternate wet anddry conditions could reduce 30-75 percent of the percolation water withoutsubstantially lowering yield compared with the continuous flooding. Thesepractices were particularly effective in light-textured soils.

THE WATSAVE SCENARIO 70
Changing crop establishment technique from transplanted to direct seededsystems can create a major opportunity for reducing the non-productive waterconsumption. In transplanted rice culture, the seedlings are grown in smallseedbeds for about one month before transplanting. During this period, farmerscontinue to use water in the main field for land preparation leading to high amountof percolation and evaporation. In wet-seeded rice, where pre-germinated seedare sown directly to the puddled fields, land preparation duration is not tied upwith seeding culture and can be much shortened. A reduction of land preparationperiod of 13-14 days and savings of 150-300 mm of water were assigned to thisprocess in Central Luzon of the Philippines and in Muda irrigation scheme.
In dry-seeded rice, the crop is established and nurtured initially as a dry-footedcrop by the early season rainfall. Later in the season the crop can be irrigatedwhen needed. The amount of irrigation water supply needed for wet landpreparation can be avoided. The process also leads to early crop establishmentand early harvest of the first crop, allowing irrigation systems to avoid or reducewater shortage toward the end of the second season. In Muda irrigation schemedry-seeded rice could save up to 500 mm of irrigation water compared totransplanted rice. Dry-seeded rice systems are very effective in utilising rainwater. In some countries such as Indonesia, Vietnam, Philippines the practiceof dry seeding allows two short duration rice crops to be grown entirely with about1600-1800 mm of rain water during the wet season.
By breeding for early maturity, high-yielding varieties of rice. IRRI has contributedgreatly to increasing water productivity in rice production. The adoption of thesevarieties during the last 25 years has increased the average yield of irrigated ricefrom 2-3 T/ha 1 to 5-6 T/ha and reduced the crop duration from about 140 daysto 110 days. In effect, this has contributed to a 2.5 - 3.5 fold increase in waterproductivity. The availability of hybrid varieties, which have 15-20% higher yieldpotentials than inbred high-yielding rice of comparable maturity periods, offersanother opportunity for increasing water productivity in rice culture. Improvedagronomic practices such as better nutrient and weed management, resulting inhigher rice yield with the same amount of water input, further increase the waterproductivity of rice cultivation.
Though promising, the above innovations will not make a major impact beyondthe farm scale unless they are widely implemented in the public sector riceirrigation systems. This will require an in-depth understanding of major changesin labour input, social and institutional arrangements, weed and fertilisermanagement and system infrastructures that are required for large scaleadoption of the innovations. Further more, th off-site effects of increasing waterefficiency at the farm level must be fully assessed. On-farm water savings maynot result in a net water savings at irrigation system or basin level if losses fromone field are already used in other fields.

THE WATSAVE SCENARIO 71
Because of the interdependence among different scales, economical andsustainable water-efficient irrigated rice system can only be achieved when weconsider it as a total entity and address its issues holistically, with full attentionto interactions among them. Policies and regulations to supply farmers andirrigation managers with adequate incentives in using water more effectively arealso urgently needed.
“We never know the worth of water till the well runs dry”, went the 17th centuryproverb. According to some observers, we may soon know it because theworld’s freshwater well is beginning to show signs of exhaustion. With the basicingredients of developing water-efficient rice production system now in place, weare better equipped for the declining resource. The immediate challenge lies inreplacing the long standing practices and operational procedures in the farm andthe irrigation system with the prospective elements. Bold, but scientifically soundand systematic actions are now needed. The cost of non-action may be too highto bear.

THE WATSAVE SCENARIO 73
V. TOWARDS THE FUTURE
Without dependable water supply to the agricultural plants the foodproduction is bound to suffer, jeopardising the chance of fulfilling theobject of food security for the increasing population. FAO has
observed that lack of freshwater is likely to be a major physical constraint to foodsecurity and rural development in future ... but the potential for water savings areenormous. It is anticipated that addition in irrigated areas in many countries willbe difficult because of the rising costs both in economic and environmentalterms. There is thus an obvious need for increasing the efficiency of the existingsupplies so that crops can be grown with less water. In many of the irrigationnetworks less than half of the water actually benefits crops, the rest is lost inseepage through lined or unlined canals, evaporation and as a run off from poorlyapplied water on the fields, riddled with poor management that fails to deliverright quantity of water at the appropriate time. On the other hand, over-extractionof groundwater is making the irrigation too costly and even forcing land out of theirrigation.
Pressures on irrigation water are being caused by the growing demands forwater from other sectors also due to rapid increase in urban population. This mayultimately result in transfer of water to non-irrigation uses and expandingindustrialisation, particularly for those who are able to pay more for the water.
And, such an eventuality will compel the exploration of non-conventionalresources which in the global context are adopted sporadically at present. As isseen from the information presented in the earlier chapters many countries likeCyprus, China, Egypt, France, Italy, Israel, South Africa and USA are meetingtheir part of the demand through reuse of wastewaters. Particularly, countrieswith limited resources when faced with water stress, will feel compelled foracceleration of programmes to increase reuse and the use of non-conventionalwaters for irrigation such as from the sea. As already noted in the earlier chapterviews are vociferous in Israel to lend a ‘national resource’ status to sewerage.The countries where no reuse of wastewaters is practiced, may shortly have tostart looking out to non-conventional sources for augmenting their supply.
The augmentation of water resources with reused wastewater however requiresa comprehensive planning, stringent monitoring and precise water qualitystandards as this reuse impinges on the health aspects and environmentalcomplexities, particularly when used in agriculture for eatable crops.
The goal of sustainable development is that the natural resources remainavailable in the future too. The limited natural availability balance of water and

THE WATSAVE SCENARIO 74
high rate of population growth is a major constraint for future agriculture andsocio-economic development. The increasing demand for water clearlynecessitates savings in good quality water by using low quality water inagriculture, not only using less water, use of non-conventional water resourcessuch as saline water, drainage water, groundwater and treated municipal andindustrial effluents could help to ease the situation in many cases.
The use of marginal quality water, that is the water that possess characteristicswhich can cause problems (like brackish water for agriculture can cause highsalinity or municipal wastewater could cause severe health hazards) requiresvery careful planning, very complex management practices and stringentmonitoring, covering Hydraulics, Physical, Chemical, Biological and HumanManagement components, only a multi-pronged management strategy canprovide a sustainable arrangement.
The assessment of losses at the farm level has revealed that improvements inmanagement of waters are necessary and possible, to achieve water savings.It is now emerging that suitable crop rotation recycles the soil fertility whencombined with other practices. Soils under mono culture, taking the same cropyear after year, reduces the water storage capacity of the soils with adverseeffects on the health of the plant whereby the lands ultimately turn non-productive. Proper water management on the farm is therefore necessarily tobe coupled with the proper soil and crop management practices. No generalprescription of water management as such can be provided, the strategy woulddiffer from soil to soil, climate to climate and environment to environment. Theskill lies in carving out area specific approaches.
The knowledge of the rooting characteristic of a crop plant and its water intakeis of prime importance. The volume of water exploited by the plant is determinedmostly by the plant rooting characteristic. The distribution and activity of plants’roots help determine water extracted from various depths of the soil profile.Computer technology is now available for simulating the movement of water inthe soil and help a precise forecast of water needs.
The farmers seldom have means to monitor soil water depletion. Schedules basedon soil moisture tension in the active root zone are useful but the farmers are unableto use them for want of availability of equipment (e.g. tensiometer) and/orunderstanding. With the advancement of technology it is now possible to know thesoil moisture status by using remote control probes, as can be seen from the studiesconducted in Australia, Germany and USA and many other countries.
Substantial saving in agriculture water can be attained if the correct and actualrequirements of water and the crop growth are kept in focus, modern andscientific cultivation and water application techniques are adopted, new varietiesof crops which require less water for the same nutritional output could be

THE WATSAVE SCENARIO 75
developed and by changing the crop types from high water consuming to lowerwater consuming. Under conditions of water scarcity the emphasis in theproductivity of crops per unit of land has to give way to criteria of production perunit of water. A multidisciplinary approach is therefore necessary for devising aproper strategy.
The water storage and delivery system will have to be managed to achievestorage and delivery efficiencies, including reduction in losses in the reservoirand in canals conveying water to the fields. Lining of canals with suitablematerials, proper maintenance of the system, suitable flow control, regulation,operation and communication procedures and rigorous and agile monitoring cansubstantially help to improve the efficiencies.
Advancements in automated controls will further improve the canal operation andreduce the water use. Adoption of automated control will however warrant somestructural modifications and provision of additional equipment for the system.
For improved efficiency in application of water, land grading, introduction ofmodern irrigation methods (sprinkler/drip) are also required.
A rigorous and agile monitoring of the system is where the success will finallyrest. System responses to climatic events, cropping activities and feed backresponses depend on the monitoring. With the development of telemetry andautomatic control for regulation or handling of structural fixtures to allow or stopthe flows to meet the demands of water between various zones of the commandarea has become very precise. A computer programme can be used andhooked-up with the Master Computer Unit to carry out the operation. Thecomputerised programme can be made to respond to all the major events withina cropping season, barring responses to the climatic events for which interventionis needed. ‘Dolores’ automated flow control in USA is a good showpiece ofUSBR, as an example of the automated control.
All these activities together call for considerable investment in the improvedinfrastructure for handling the water supply to agriculture. Information on theinvestment patterns in the water sector and in the irrigation sector has not beenavailable. But it is clear that watsave programmes will need substantial steppingup of investments in the irrigation sector.
Adoption of modern irrigation practices enables the management to cope up withsituations of supply, lesser than what the crops may otherwise require. Australia,Germany, USA and other countries have conducted studies on adoption of thesepractices and found that not only the input of water was reduced but even theyields were better. Induction of modern irrigation methods has therefore beensynonymous with modernisation of the irrigation system in many countries.Policies have been adopted which provide incentives for promoting theseirrigation techniques. Eight years performance of the subsidised interest loan

THE WATSAVE SCENARIO 76
scheme of the Government of China which supported modern methods was veryencouraging. The schemes strongly pushed forward the development ofsprinkler irrigation, conveying irrigation water through low-pressure pipe-linesystems and micro irrigation (Hague, 1993). To support use of modern watersaving practices some incentives will have to be built into the campaign ofconverting the conventional methods into modern techniques.
Research & Development support
Due to rapid advancements in scientific approaches in soil/salt and cropmanagement, development of crop varieties giving high yield using less thanconventional quantity of water are being developed by various AgriculturalResearch Institutes and Universities. Even though many countries have takensteps to transfer the improved technology to the field, yet the impact has not beenuniform. A much greater involvement and commitment appears necessary.Some Research Institutes may have to adopt the irrigation command areas anddemonstrate the success of the new techniques in the farmers fields on the linesof the “300 counties for water saving demonstration” programme in China whichcould save them nearly 6 BCM of water. There is also a necessity of evolvingan organisational interdisciplinary mechanism under which the research scientists,the extension specialists and irrigation service personnel could sit together, planthe strategy and implement the research findings in a big way in the field.
Queensland State in Australia has carved out its approach for implementingwater reforms mandated by the council of the Australian Governments (COAG)on the basis of a comprehensive and integrated approach which covers all therelated issues like cost recovery, water pricing, metropolitan bulk services,commercial focus for water services, trading in water entitlement, wastewater/storm water management, public consultations and public education.
Authority for comprehensive/integrated planning of water resources
In water short areas, there is a need for a clearly mandated authority at the basinor sub-basin level with a comprehensive responsibility for managing water intheir area of jurisdiction. A unified control can provide for proper allocations ofwater, monitoring of the use, conduct of water audit and thereby achieve thedesired water savings effectively which is otherwise not possible under asituation of fragmented water control. The “Seven Rivers Commission” in Chinain their evaluation of irrigation sector of the country found ̀ Centralised Control’as one of the essential requirements for improved management of water.
Water Users Association
As already observed at the 16th ICID Congress, Cairo, 1996 the most importantmeans to reduce intrinsic fields of conflicts in the sustained resource utilisation

THE WATSAVE SCENARIO 77
is undoubtedly the decentralisation of the operational structures by establishingappropriate water users organisations in which the water users themselvesregulate water distribution. The irrigation agencies can only mitigate the conflictpotential, but never remove it.
The individual goals of each farmer will have to be welded into a commoncollective strategy of all the user’s together. As long as the activity of O&M ishandled by the Government in one way or the other, this is difficult to happenin its true spirit. In industralised/developed countries, enough progress hasalready been made in this direction and irrigated areas in most of thosecountries are today wholly looked after by the water users themselves. Thedeveloping countries will have to understand this managerial reform very early.It also does not cost much, if at all, financially.
In the International Conference on Irrigation Management Transfer in September1994 at Wuhan-China (sponsored by IIMI and Wuhan University together)efforts in this direction made by Indonesia, Sri Lanka, Nigeria, Nepal, India,Egypt, Colombia, Dominican Republic, Philippines, Mexico, China, Sudan,USA and Colombia were reported. There was a model of leasing out oftubewells to cooperative societies in India (Gujarat). In Indonesia, the Ministryof Public Works had transferred about 1500 small irrigation systems irrigatingmore than 115 Th.ha. Sri Lanka had created a policy for Integrated Managementof Major Irrigation Schemes (INMAS) in 1984 requiring farmer participation inO&M activity in 35 major schemes, through distributory canal organisations andjoint management committees. In Egypt a flexible but systematic process wasevolved for helping farmers to form their private users associations. Othercountries too had carved out their approaches for addressing the local situations.The basic ingredient for implementing the philosophy of Irrigation ManagementTransfer (IMT) was a firm policy and political support creating a favourableenvironment and an efficiently working physical infrastructure (duly rehabilitatedas per need). A prelude to the IMT was the need of defining government policy,means of transfer and legislated rules, availability of budget and trained staff.Though no general prescription as such could be suggested for the differentground realities and the social scenarios in the different countries. It wasclear that government support for such a process was very important. Theexperiences presented there revealed that users participation had benefitedthe management and the productivity.
Irrigation service manpower
For managing the irrigation agency activity there is a need of a well organised anddistinct agency to lend service to the users, with a clear mandate on its functionsand accountability.
A manpower planning policy for organising the service is obviously needed fordetermining the personnel to be placed in the field. Most of the countries are

THE WATSAVE SCENARIO 78
found to have some irrigation service agency, it is hoped that the mandate givento them is clear and detailed. The management of the irrigational activity shouldin fact, better start at the manpower planning policy.
Water pricing
To efficiently use a resource, a set of economic instruments are helpful and besteffects become perceptible when one has to pay for the use of that resource orservice in a proper manner. Pricing of water thus has had a crucial role in anywater policy. Proper pricing also generates more funds for use in upkeep orrehabilitation of the systems and enables improved operating measures. But,because of the development lag perceivable in the rural communities, there isgenerally a hesitation in the governments of the developing countries. It is hopedthat with increasing scarcities of water, attitudes will change. Low value of waterdoes not motivate the users to employ the rightful minimum quantities only.
In Chile in South America, the water rights are a tradable commodity. Republicof China has also been contemplating water markets as a measure of ‘demandmanagement’, this is a very ‘strong tool’, which places irrigation use in directjuxtaposition with other uses of water.
FAO has observed in their paper No.52, that ‘one attendant legal issue is the legalstatus of water vis-a-vis the land it ‘serves’, i.e. whether water rights should betied to ownership or possession of the land and to a particular use, or should haveindependent status, success of market mechanism will greatly depend on thesocieties, approach to this largely socio-philosophical issue.
In Victoria (Australia), restricted water markets were allowed to develop in theirrigation sector alone, within the same irrigation district or among differentirrigation districts. Transfers were subject to prior screening and approval by theirrigation district authorities, who could impose restrictions to the affect ofminimum amount of water rights that must be retained by any landowner.Transfers could be seasonal or permanent, with water ‘attaching’ to the land ofthe transferee in the latter case.
In Mexico, the new Federal water act allows the transfer of water rights, subjectto prior government approval if the proposed transfer affects the right of thirdparties, or affects the hydrology or ecology of the basin or aquifer, in the case ofgroundwater. Water markets are also allowed to develop within a basin or aquiferon the basis of regional, basin-wide, state-wide or local stipulations made by thegovernment. Under the new Act however, groundwater cannot be transferredseparately from the land.
In Chile, water rights which have accrued under the existing legislation and thosewhich will be granted under the new legislation will remain freely transferable to

THE WATSAVE SCENARIO 79
different uses and places of use through market transactions. However, alltransactions involving water abstraction works will require prior governmentauthorisation. Furthermore, in the arid north of the country, transferability will beeffectively impeded in so far as water rights are made to terminate automaticallywhen the use for which they have been granted.
How far the irrigation countries will be able to adopt this approach is not yet veryclear. But, in any case water pricing reform is going to be a major issue in thenext decade. A realistic rate structure for O&M and cost effective recoveryprocesses appear to be an immediate urgency in many countries.
With heavy subsidisation of irrigation water, rationalisation of water use or watersavings will be difficult to achieve. Current rates in many countries make thewater appear as a cheap goods and do not reflect the scarcity value of water. Ahigher water price reflecting the marginal value of water in its productivity on thefarm can alone bring in the real savings finally. None-the less, the water pricinghas ramification in larger socio-economic and political implications. Manygovernments also tried to subsidise water as an instrument of food policy. Thequestion of pricing is also linked with the mechanism of water delivery. Evidenceis, that where measured and priced water is supplied to user group(s), thefarmers do not mind the increased price as they derive advantages of increasedproduction. The money realised should also not be diverted to general revenueor to other activities. It must be transparent that the funds are used on the sameirrigation system for O&M and improvements. That will generate a climateconducive for bearing the higher charges for water.
National Level Acts, Policies and Rules
One of the dominant factors in the shaping of a country’s Law/Act/Policy is itsgeo-climatic condition. In arid areas of water shortage, water law addressesissues in water allocation more clearly, while in humid areas, they tend to dwellon the requirements of drainage and flood control. But with the changingdemands on water, new situations call for a drastic change in the provisions inthe water law also. Policies are required to be reviewed and reframed due tochange of priorities. Sometime a higher priority could be for development of newresources while later, it could shift to optimum use of the created assets.Institutions, policies and acts are therefore bound to continue to be in transitionfor quite sometime, as is clearly seen from the frequent changes that have takenplaces in the water acts of many countries. It therefore appears that reflectionof the countries concerns on watsave issues will also pass through a process ofgradual evolution. But to expedite that process through exchange of lessons andexperiences the “watsave” rules of ICID will have to be kept active and clickingall the time over the next two decades atleast. Countries have reviewed theirnational policies in the background of the changing water availability, Waterquality, socio-economic changes and new developmental and management
THE WATSAVE SCENARIO 80
objectives. In the recent past we see such reviews being made by the Republicof China, Australia, Jordan, Chinese Taipei Committee, Spain, Germany andEgypt. It is hoped that other countries, particularly those that are identified aslikely to be under water stress by 2025 according to the recent water resourcesassessment made through the UN initiatives, will also undertake similar reviewsof their water policies/acts not before long.
Australia: Objectives identified for reforms
• Ensure a coordinated approach with particular attention to environmentalaspects.
• Develop methodology to quantify cost to the environment in deploymentof assets.
• Develop strategy to deal with unintended consequences of reformappropriate regulation structures, disappearing research and developmentinvestments and dimensioning skill base.
• Provide opportunities for “cross fertilisation” of generic approaches.
• Develop means and opportunities for implementation of the work of TaskForce and the Governments.
It is seen that water laws covering the quantity aspects are separate from thewater laws dealing with water quality and are not necessarily overseen by thesame agency. There is thus a necessity of integrating the two, e.g. in Mexico,the new Federal Water Act confers legal status and powers needed foreffectively managing the irrigation systems to water users groups proposed fortransfer from the government to the private sector. The service customers sit onthe Boards of Management of the public irrigation companies. Separately, at thestate level, legislation has been enacted to strengthen the financial and managerialflexibility of the urbanwater and sewerage utilities by turning them into commercialcompanies with authority to fix and collect service charges and to take otherpanel actions including cutting off the services. The managing boards of thesecompanies contain amongst others, customers’ representatives, to ensuresome accountability.
Women in irrigation
The role played by women in irrigation management as a whole and at farm levelin particular has remained unrecognised for long. In many countries, thewomenfolk work hand in hand with their male counterparts by tradition. They alsorear the family, manage the household, tend the livestock and participate in thefarming activity. But their special influence on the meticulous management ofwater did not receive much attention so far.

THE WATSAVE SCENARIO 81
GENDER PERFORMANCE
A study conducted by IIMI, Sri Lanka, in Burkina Faso where women ownedonly 9% plots (0.15 to 0.25 ha) and husbands too had plots, the incomes fromfarm households where only men had plots were found to be lower than whereboth had plots. The productivity of the land as well as labour increased sharplywhile proportion of labour remained the same. Productivity of the irrigatedlands also increased in comparison to men-only plots.
The role of women in agriculture has changed dramatically in developedcountries. Both farm-men and women have been drawn into industrial andservices sectors from the routine operation of farming. In developed countrieswhere mechanised agriculture is done, it is possible to manage with a smallnumber of work force and very few women remain in the agriculture sectorexcept in food processing industries and backyard live stock and vegetableproduction. In contrast, in developing countries there are strong linkagesbetween the welfare of an entire family and the ability of women to enhance totalfamily income. In many countries and particularly in Africa, East and SoutheastAsia, women play major roles in farm and financial management. Moreover,many of their agricultural roles require considerable skills, eg. in seed selection,storage and preservation, testing, organic recycling, the identification andcontrol of pests, pathogens and weeds, and post-harvest technology. As men’sdecision-making roles are more publicly visible, government policy makers,scientists, and manufacturers of agricultural machinery have generally tendedto neglect women’s technology needs. Women have also been generally by-passed by extension services. Their numbers in scientific and extensionservices are generally small. Consequently, they continue to remain ‘unskilledworkers’ with uncertain income.
A careful consideration is thus required for assessing the training needs forwomen particularly on the aspects of :
• Impact of new technologies on women=specific activities
• Developing technologies for women
• Involving women in technological development and transfer thereof
• Input in agricultural activity
• Marketing and trading of farm products, accounting and book keeping
• Seed production
• Soil fertility and fertiliser management
• Pest management
• Weed management
• Water management skill

THE WATSAVE SCENARIO 82
Women’s contribution in Extension Services is currently nominal while a largershare in this activity will be helpful particularly due to their ‘inherent’ instinctivepersuasion faculty.
Lessons of studies conducted in Bangladesh and Burkina Faso do affirm thatgiven the importance, women deserve a leading role in decision making,incomes of farm households can substantially increase leading to socio-economic upliftment.
An experience on “Women in tertiary unit development” (ICID – 15th Congress,1993) also demonstrated that efficiency could be introduced by conducting aspecial programme of training. With extension and intensive guidance, womenfarmers participated in the planning, construction and water management of thetertiary irrigation system. The participation was not limited to implementationtasks only but they were also given a say in decision making and organizationbuilding. Having been pleased with their involvement, they have taken upimportant roles in the Water Users Association boards and actively support themanagement of irrigation water in the field. In one village, women evenorganised literacy classes and in two of the villages they formed women’s groupsfor establishment of a collective money saving system and dry field cropcultivation on community fields.
Even otherwise women have played and will continue to play a key role in theconservation of basic life support systems eg. land, water, flora and fauna on thefarm. In many areas, when men have to go out for better economic earnings andfor socio-economic activities, it is the women who take care of the land and growcrops on them. They protect health of the soil and promote crop security.Women tend to look at the problems of the farm in their totality. For aneconomically and ecologically sustainable agriculture, involvement of womenfarmers or farm women (without assets) for modernisation of the farmingpractices is thus most essential. Particularly, for promoting water savings on thefarm, their role is likely to be very critical, as various studies carried out throughUSAID projects in India and elsewhere have shown. Hence as an important partof capacity building measures, women’s training in water application techniquesand management of water distribution systems will have a key role in the futuretraining programmes.
Public awareness and involvement
Australia has designed its public awareness movement by fully utilising theopportunities available through the nationwide celebration of the WaterConservation days at least twice a year; one week in October prior to high waterdemand, and second on World Water Day i.e. 22nd March. Water conservationis promoted by press release, community displays, public education activities,with political leaders and community groups recognising the values of integratedresource management.

THE WATSAVE SCENARIO 83
Water conservation has been Australia’s number one environmental priority.Messages as below are sent out during the national Water Week which do causeimpact. “Set water targets or face shortage”; “Without community involvementAustralia is not going to meet its future water demands let alone maintainingexisting standards”; “Implement policy that brings about water conservation inthe home, office and farm”
• Ensure development application in agriculture
• Plant high dollar yield crops that consume less water
• Do not over stock and over fertilise
• Protect groundwater resources
Australian Government jointly with New Zealand have also carved out a policywhich makes public consultation a mandatory process for enforcing waterpolicies/programmes. In this process, as planned in the Queensland State ofAustralia community consultation is ensured through community referencepanels which provide community input to discussions and negotiation onacceptable balance between the competing water uses. A steering groupcomprising water users and government representatives developed a programmefor consultation and negotiation with water users in 1997 and 1998 to implementthe water pricing and local management proposals outlined in the public policystatement.
In Israel also the public is educated on the water cycles in the country and theemerging necessities of a deficient resource availability. The countries watercommission issues special ‘decrees’ to cut down, the allocations on a transparentbasis. In fact, procedures are being inducted for public consultation.
Recently the European Community Council requested the ICID NationalCommittee of Germany to prepare a policy framework for reforms in the watersector commensurate with environmental safeguards. The National Committeelaboriously went through the process of consultation with the user groups,governmental agencies and authorities to finally come up with the proposal on“a frame work for community action in the field of water policy”.
These are some of the pace-setting mechanisms, which many countries faced withwater shortages of serious water conservation issues would like to emulate in thecoming years. It is expected that ICID WatSave Team will provide a continuousplatform for exchange of information and experiences in this respect also.
The ICID Action Programme
ICID, in its pursuit for promoting water conservation is developing programmesto spread awareness about the limitations on water availability and the pressures

THE WATSAVE SCENARIO 84
on the finite quantities of freshwater in the world. The need to strive for aneffective balance in the supply and demand regime is to be stressed. ICID willalso strive for the dissemination of successes and achievements in watsave, sothat countrys facing similar situations could benefit from the experiences ofothers.
Yet another step in this respect proposed is to conduct a study of the legalprovision for water conservation/savings vis-a-vis the organisational andinstitutional arrangements to implement the policies. Simultaneously, it proposedto promote development of country-wise action programmes to optimally utilisetheir water resources in a sustainable manner. A decision of ICID in its meetingheld at Oxford in September 1997 to launch an annual Watsave award forrecognising publicly the outstanding efforts in these directions by an individualor a group of individual and/or an Institution has now resulted in grant of an ICIDWatsave Innovative Management Award.
Roving Watsave National Seminars and Regional Workshops to campaign forwatsave worldwide are also proposed hopefully with the support and involvementof the international networks and mechanisms like the Global Water Partnership.Accordingly, the WatSave Team members of ICID will visit countries to focus onthe needs for better water resource management as a prelude to holding ofworkshops.
To begin with, and as a part of the phased programme, seminars are proposedto be held in Africa and Asia. Eastern Europe, Mediterranean countries and thetwo Americas will be covered in subsequent phases. Various and themes forregional workshops will emerge from the country level seminars. About 20seminars over next few years are in view. The seminars will identify project levelprovisions in physical and financial terms for effective water savings in thecoming decades.
An international conference will be held in the end to deliberate on the genericissues that emerge from the series of workshops. Experts and specialists fromdifferent parts of the world on different topics crucial to WatSave programmeswill be invited for evolving suitable long-term directions.
Looking to the experiences of the countries who have already taken strides in thewatsave activities, there is not likely to be any ‘quick-fix’ as such for the countriesthat are to follow hereafter in the pursuit of various measures required foreffecting water savings. It is going to be a long march. But, that is the one thatwill help the world to adjust to the realities of water shortages. ICID plans to playits modest role in actively supporting that process in the years to come.

THE WATSAVE SCENARIO 85
ACKNOWLEDGEMENTS
Responses to the Watsave questionnaire from ICID various memberCommittees:
Communication dated
Australia 1st Feb. 1996
Austria 29 May 1996
Bangladesh 13 Apr. 1996
China Feb. 1996
Cyprus 24 Nov. 1995
Chile 27 Jan. 1996
Chinese (Taipei) 9 July 1996
Egypt 19 June 1996
France 1 Aug 1996
Germany 15 Feb. 1996
India 9 June 1997
Indonesia 6 Feb. 1996
Israel 17 Dec. 1996
Italy 25 June 1996
Korea 10 June 1996
Malaysia 27 Jan. 1996
Mongolia 25 Jan. 1996
Nigeria 14 Feb. 1996
Pakistan 12 Dec. 1995
Slovenia 30 Jan 1996
South Africa 3 May 1996
Spain 8 Sept. 1997
Thailand 10 May 1996
Turkey 31 Jan. 1996
United States of America 14 Feb. 1996
United Kingdom 22 Apr. 1996
Zambia 5 June 1996

THE WATSAVE SCENARIO 86
ACKNOWLEDGEMENTS
BOOKS, JOURNALS AND OTHER PUBLICATIONS REFERRED TOIN BRINGING UP THIS DOCUMENT
♦ FAO Paper No. 24, 1997, Irrigation Water Requirements.
♦ FAO Paper No. 33, Yield Response to water.
♦ FAO Paper No. 52, 1996 Reforming water policies.
♦ FAO Production Year Book 1995, Vol. 49. and Vol.50
♦ Proceedings of ICID, 15th Congress at the Hague, 1993
♦ Proceedings of ICID, 16th Congress at Vol. IB Cairo 1996
♦ ICID Journal, 1995, Vol. 44 No. 2
♦ ICID Bulletin, 1993, Vol. 42, No. 2
♦ ICID, Annual Reports 1995 and 1996
♦ ICID, Watsave - Lessons and Experiences, 1995
♦ ICID, National Committee, France, August 1997
♦ ICID Journal 1996, Vol. 45 No. 1
♦ ICID, National Committee, Mexico August 22, 1997
♦ Global Environment, 1992-93. A guide to the Global Environment, 1992, Areport by the World Resources Institute in Collaboration with the UNEP andUNDP.
♦ Water-in-crisis, A guide to the Worlds Fresh Water Resources. Edited byPeter H Gleick, 1993
♦ Water Resources Management - World bank, 1993
♦ Proceedings of workshop on Water Saving, Prospects and Challenges (Oct.29 to Nov. 11, 1995) National Water Research Centre, Cairo, Egypt.
♦ Overseas, Development Institute, ODI-IIMI, Irrigation Pricing andManagement, 86/IC, April 1986.
♦ Proceedings of the Regional Seminar on Irrigation Service Fees held atManila 21-25 July 1986. Asian Development Bank and IIMI, 1986.
♦ Prof. S. Arlosoroff, Chairman of Public Commission on Reforms in WaterSector, Israel, 1997, Water Trading and Pricing in the Middle East (CaseStudy, Israel), April 1997, presented in Workshop on Demand Managementby WSSC at OSLO.
♦ Overseas Development Institute, ODI-IIMI Irrigation Management, 87/1b,1987.
♦ Ministry of Economic Affairs, Chinese Taipei, Feb, 3, 1994. Waterconservation Measures in Taiwan.

THE WATSAVE SCENARIO 87
♦ Ministry of Economic Affairs, Chairman, Water Resources PlanningCommission, Ministry of Economic Affairs, Chinese Taipei, May 1995,Regional Water Resources Development and Planning in Taiwan.
♦ News from China, June 11, Vol. IX, No. 24 Information office of the Embassyof People’s Republic of China, Editor Zhao Xing Min.
♦ Atlas Britannica - 1992
♦ National River Authority, UK, Annual Report, National Precious WaterResources.
♦ Director General, Natural Resources, Australia (22-7-97)
♦ Dr. M.S. Swaminathan, Sustainable Agriculture, Towards Food Security,1996.
♦ Mr. Rakesh Hooja, Secretary to the Government of Rajasthan, CAD & WU(7 July 1997)
♦ Eng. Hussain EI-Afty, Secretary General, NWRC, Egypt, 31 July 1997.
♦ IIMI, Annual Report 1995.
♦ Yang Xiao Liw, Prof and Deputy Director, Deptt. of Water resources, China,Water uses and supply in China, Paper presented at OSLO, April 1997
♦ A.Hamdy Director Mediterranean Agronomic Institute - Bari - Italy, compiledby, Advanced short course on water saving prospects and challenges, 1995.
♦ Demand management in Large scale irrigation projects, by Mohammed AliKadi, Director Agricultural Engg, MOAL, Morocco, 1995
♦ IIMI Research Report 1, (David Seckler), 1996
♦ IIMI Research Report 3, (Andrew Keller, Jack Keller and David Seekler)1996
♦ Mr. John Hennessy, Key-note address 1993 at the Hague as President ICIDon “Water management in the next century” 15th ICID congress.
♦ Selected Papers from the International Conference on Irrigation ManagementTransfer, Wuhan, China (Sept. 20-24, 1994) organised jointly by the IIMIand Wuhan University of Hydraulic and Electrical Engineering).
♦ “More Rice with Less Water”- A note from Mr. Kenneth S Fischer, DeputyDirector General, IRRI, Manila, Philippines, 1997.
♦ Comprehensive Assessment of the Freshwater Resources of the World -WMO for UN Agencies, 1997.

THE WATSAVE SCENARIO 88R
espo
ndin
g C
ount
ries

THE WATSAVE SCENARIO 89
APPENDICES

TH
E W
AT
SA
VE
SC
EN
AR
IO90
ICID Participating Countries as on 31 December 1997

THE WATSAVE SCENARIO 91
APPENDIX A
PREFERRED REPORTED REASONS FOR EXCESSIVE USEOR LOSSES OF WATER AT FARM LEVEL
Australia♦ Poor flooding and irrigation layout,
design and management♦ Ground water accession♦ Low water price
Bangladesh♦ Pricing by land area♦ Lack of incentive to save♦ Faulty grading of land♦ Inappropriate methods♦ Rigid rotation schedule
China♦ Losses from field ditches♦ Lower uniformity and efficiency
due to micro topography♦ Improper scheduling and
management
Cyprus♦ Not proper irrigation systems♦ Not efficient distribution systems♦ Farmers’ ignorance
Egypt♦ Flood irrigation practices♦ Neglect of night irrigation♦ Unofficial cultivation of rice♦ Lack of knowledge and insufficient
farmers participation
Germany♦ Wind drift♦ Over-irrigation
Italy♦ Low uniformity of sprinklers♦ High dosage of water♦ Excessive evaporation and run off
Israel♦ Leakage♦ Unaccounted use
India♦ Seepage losses♦ Over irrigation♦ High evaporation losses
Malaysia♦ High evaporation♦ Seepage losses♦ Lack of farm management
Nigeria♦ Lack of canal maintenance♦ Lack of measuring devices♦ Farmers inexperience in irrigation
Pakistan♦ Seepage through canals, water
courses and fields♦ High evaporation♦ Uncontrolled water supply to fields
Thailand♦ Low efficiency of control
structures♦ Lack of cooperation amongst
users♦ Lack of training
Turkey♦ Losses due to conveyance♦ High evaporation losses♦ Percolation during irrigation

THE WATSAVE SCENARIO 92
APPENDIX B
MOST SUITABLE IRRIGATION PRACTICES INDICATED BYTHE RESPONDING COUNTRIES
Country Practices identified as suitable in order of priority
Australia (i) Trickle and micro irrigation(ii) Improved flood irrigation management(iii) Irrigation scheduling
Austria Drip, micro, sprinkler
China Small border or short furrow, improved design and managementof surface irrigation with land levelling and sprinkler or microirrigation
Egypt Improved distribution and main canal, expansion of telemetrysystem and land levelling and light irrigation
Italy Micro, sprinkler, underground
Indonesia Flushing, rotation, plastic in bottom
Israel Pressure irrigation, border irrigation, development of irrigation
Nigeria Surface, overhead (sprinkler), drip (limited scale)
Pakistan Furrow irrigation, sprinkler, drip (for orchards in Quetta valley)
Slovenia Drip irrigation, micro sprinklers, sprinklers
South Africa Drip irrigation, basin furrow, dragline sprinkler
Turkey Sprinkler, drip, long line border irrigation

THE WATSAVE SCENARIO 93
APPENDIX C
THE REPORTED RESEARCH AND DEVELOPMENTCENTRES IN COUNTRIES
Australia • Heritage research centre for Sorghum• Central Soil & Irrigation Research for Soybeans• John Bjlke Research Station for Peanuts• Central Research Center, ODR, MVR Station for Cotton
Egypt • Agriculture Research Center• Institute for Crop Studies• Water & Soil Research Institute• Rice Research Center
Israel • Agriculture Research Organisation• Applied Research Institute• University of Agriculture
India • Indian Council of Agriculture Research• Indian Agriculture Research Institute• All Agricultural Universities in States (20)• Water Technology Centers (50)
Korea • Research development agencies & ministries
Mongolia • Plant Science and Agriculture Research Institute• Water Cereals Research Institute
Pakistan • Pakistan Agriculture Research Council, Islamabad• University of Agriculture, Faislabad
Slovenia • Bio-technical Faculty, Ljubljana• Institute of Agriculture• HOP’s Institute
Turkey • Gunera Directorate of Rural Services
US • Water Resources Center, University of California• Colorado Water Resources Research Institute, Fort Collins• Texas Water Resources Institute

THE WATSAVE SCENARIO 94
APPENDIX D
NATURE OF COOPERATION BETWEEN R&D AND IRRIGATIONAGENCIES INDICATED BY RESPONDING COUNTRIES
Australia – Very little cooperation between scientists and irrigationagencies in developing new crops
Cyprus – Cooperation exists
Egypt – Cooperation exists, coordinated by members ofBoards, National Committee of Irrigation and Drainage,Commissioner of irrigation duties, Advisory council oftop group level
Italy – Organisational cooperation, coordinated by NationalResearch Centre
Israel – Cooperation exists, coordinated by AgricultureResearch Organisation, Extension service, Faculty ofAgriculture & Engineering
India – Exists at organisational level, CADA, Extension serviceand agricultural farms
Malaysia – Exists at the level of Ministry of Agriculture
Mongolia – Exists at the level of Ministry of Science & Education
Nigeria – Exists at the level of Federal Ministries
Pakistan – Exists through extension services, Ministry of Food &Agriculture & provincial irrigation departments
Slovenia – Exists through extension services, Ministry ofAgriculture
Turkey – Exists through technical research meetings
USA – Exists at the level of many agriculture centres anduniversities
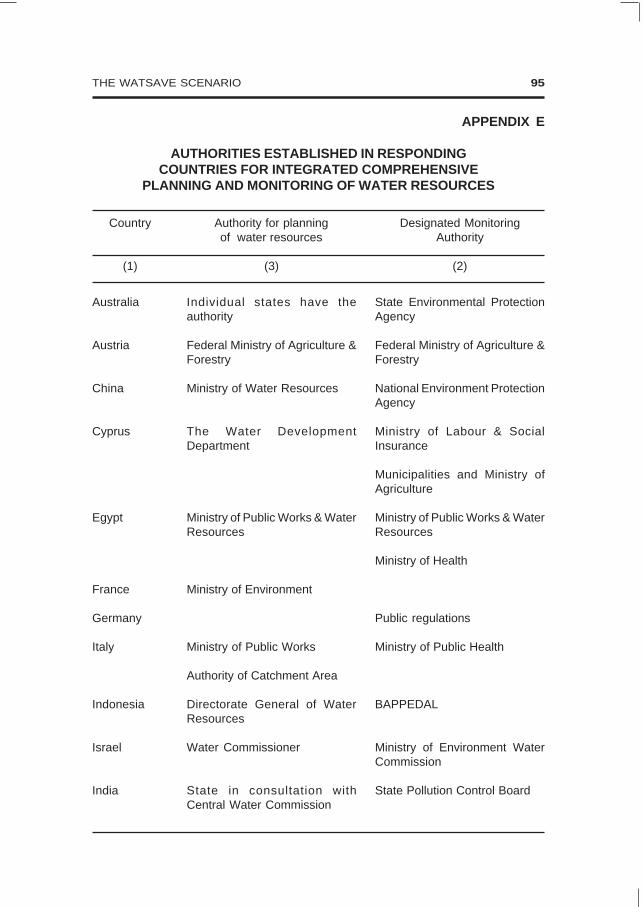
THE WATSAVE SCENARIO 95
APPENDIX E
AUTHORITIES ESTABLISHED IN RESPONDINGCOUNTRIES FOR INTEGRATED COMPREHENSIVE
PLANNING AND MONITORING OF WATER RESOURCES
Australia
Austria
China
Cyprus
Egypt
France
Germany
Italy
Indonesia
Israel
India
Country
(1)
Individual states have theauthority
Federal Ministry of Agriculture &Forestry
Ministry of Water Resources
The Water DevelopmentDepartment
Ministry of Public Works & WaterResources
Ministry of Environment
Ministry of Public Works
Authority of Catchment Area
Directorate General of WaterResources
Water Commissioner
State in consultation withCentral Water Commission
State Environmental ProtectionAgency
Federal Ministry of Agriculture &Forestry
National Environment ProtectionAgency
Ministry of Labour & SocialInsurance
Municipalities and Ministry ofAgriculture
Ministry of Public Works & WaterResources
Ministry of Health
Public regulations
Ministry of Public Health
BAPPEDAL
Ministry of Environment WaterCommission
State Pollution Control Board
Designated MonitoringAuthority
(2)
Authority for planningof water resources
(3)

THE WATSAVE SCENARIO 96
Korea
Malaysia
Mongolia
Nigeria
Pakistan
Slovenia
South Africa
Spain
Thailand
Turkey
USA
Country
(1)
Ministry of Construction &Transport
Economic Planning Unit
Institute of Water Policy
Ministry of Nature & Environment
Federal Ministry of WaterResources and RuralDevelopment
Ministry of Water & Power andProvincial Irrigation Departments
Ministry of Environment
White Paper N-84 Deptt. of WaterAffairs and Directorate ofScientific Planning
Directorate General of HydraulicWorks
Rural Irrigation Department,National Water ResourcesCommittee
General Directorate of StateHydraulics
State Authority
Ministry of Environment
Department of Environment
Federal EnvironmentalProtection Agency
Provincial Irrigation Department,Water Power DevelopmentAuthority, Federal EnvironmentProtection Agency (IndustrialWater Control)
Local municipalities
Hydrometeorologic Institute ofSlovenia
The Department of Water Affairs& Forestry
River Basin Agencies
Environment Protection Agency
Designated MonitoringAuthority
(2)
Authority for planningof water resources
(3)

THE WATSAVE SCENARIO 97
APPENDIX F
EXISTING ACTS, RULES AND REGULATIONSREPORTED BY COUNTRIES FOR
WATER CONSERVATION / DISTRIBUTION AND CONTROL
Australia – States have enacted laws
Austria – Water Act 1985 (Under review)
Cyprus – Govt. Water Works Law 1929
Egypt – Law Nos.4, 12 and 48
France – Water Law 1992
Indonesia – Local Law 1987 (Governors’ Decrees)
Israel – Specific decrees, year to year
India – State Irrigation and Drainage Acts
Mongolia – The Water Law 1995
Nigeria – National Water Resources Decree No.101-1993
Pakistan – State Acts of Irrigation and Drainage
Slovenia – Water law and several regulations
South Africa – Water Act 54 of 1956 (Under review)
Spain – Water Act 1985

THE WATSAVE SCENARIO 98
APPENDIX G
COUNTRYWISE REPORTING ON STANDARDSESTABLISHED FOR WATER QUALITY
Country Description of Standards or Acts
Australia – Australian drinking water guidelines– National water quality management strategy– Quality aspects of farm water supplies
Austria – Ground wasserclerwert-verondnung
Cyprus – International standards adopted
China – Environmental quality standards for surface water(GB 3838 - 88)
– Sanitary standards for drinking water (GB 5749-85)– Standards for irrigation water quality (GB 5084-85)– Standards for freshwater– Marine water quality standards (GB 3097-88)
Egypt – Law No.48 Protection of water coursesIrrigations drainage and environment
– Law No.12– Law No.4
France – European norms are followed
Germany – DIN-19650
Italy – Law No. LM 60/24.05.88– Law No. LM 319/10.05.70
Indonesia – Guberneer Kapala Daeral Tingkat/Jawra Timur– Nomor: 413 Tahun 1987
Israel – International standards adopted
India – Environmental & pollution control acts in states
Turkey – TS-266