West Wilkes Youth Basketball: Whirlie Basketball 2015-2016 season…….
Abstract
A collaboration between the CIES Sports Observatory academic team and FIBA, the International Basketball Migration Report provides a detailed analysis of official data on international transfers
for the period between July 2015 and June 2016.
The 80-page illustrated report outlines market trends and highlights new challenges within the field of basketball transfers and migration.
International Basketball Migration Report 2016
CIES OBSERVATORYAvenue DuPeyrou 12000 NeuchâtelSwitzerlandcies.ch
Tel: +41 22 545 00 00Fax: +41 22 545 00 99
FIBA - International Basketball Federation5, Route Suisse, PO Box 291295 MiesSwitzerlandfiba.com
© Copyright 2016 CIES Sports Observatory. All rights reserved.No part of this publication may be reproduced without the prior written permission of the authors.
international Basketball Migration Report 2016
2 International Basketball Migration Report 20162 International Basketball Migration Report
About FIBA
About the CIES SPORTS ObservatoryThe CIES Sports Observatory is a research group within the International Centre for Sports Studies (CIES). The CIES is an independent foundation located in the Swiss city of Neuchâtel and affiliated to the local university.
The CIES Sports Observatory research team gathers experts specialised in the statistical analysis of sport. Its aim is to provide top-level services for sports governing bodies in the areas of surveys, databases, data mining and sport business intelligence. The academic team are experts in the statistical analysis of all areas of sport and regularly undertake research activities and develop joint projects with a wide-range of sport industry stakeholders, both nationally and internationally.
For more information, please visit www.cies.ch or follow us on Twitter at: www.twitter.com/@sportCIES.
The International Basketball Federation (FIBA) is the world governing body for basketball and an independent association formed by 215 National Basketball Federations throughout the world.
FIBA is a non-profit making organisation based in Mies, Switzerland and is recognised by the International Olympic Committee (IOC) as the sole competent authority in basketball.
FIBA’s main purpose is to promote and develop the sport of basketball, to bring people together and unite the community. FIBA’s core activities include establishing the Official Basketball Rules, the specifications for equipment and facilities, the rules regulating international competitions and the transfer of players, as well as the appointment of referees.
FIBA’s main competitions include the FIBA Basketball World Cup and the FIBA Women’s Basketball World Cup (both held every four years), the FIBA U19 World Championships for Men and Women (held every odd calendar year), the FIBA U17 World Championships for Men and Women (held every even calendar year), the Olympic Qualifying Tournaments - as well as all senior and youth continental championships held in its various regions.
Additionally, FIBA oversees the organisation of the Olympic Basketball Tournaments for Men and Women. FIBA also promotes the worldwide development of 3x3 basketball by organising the FIBA 3x3 World Tour, as well as the FIBA 3x3 World Championships (for Men and Women) and the FIBA 3x3 U18 World Championships (for Men and Women).
For more information, visit fiba.com or follow FIBA on facebook.com/fiba, twitter.com/fiba and youtube.com/fiba.

3
ForewordWe are delighted to present our fifth International Basketball Migration Report (IBMR) which continues to build on the highly productive relationship between FIBA and the International Centre for Sport Studies (CIES). It is a collaboration which has already been responsible for the successful production of four previous reports. These have benefitted from the effective fusion between FIBA’s knowledge and data on international transfers, and the renowned expertise of the CIES Sports Observatory.
The main aim of the report is to monitor and provide feedback on the international migration of players during the basketball season, including the evolution of international transfers, the migratory balance per country and the flows of players between countries. Our analysis compares 24 national and international leagues on various criteria including the place of foreign and U21 players, player and league characteristics, the turnover of players and so forth.
The report further underlines how basketball truly is a global sport. This is evidenced by the 215 national federations and hundreds of millions of registered players all around the world. That worldwide appeal and popularity means we have to always be mindful of responsibilities to secure the continuous healthy development of basketball and certainly the information we collect on player movement remains absolutely integral to that process.
We are thrilled to have extended our valued partnership with the prestigious CIES Sports Observatory. Once again, the report plays an essential role in helping improve our knowledge of basketball – while also providing the entire FIBA Family (national federations, leagues, clubs, players, coaches and agents) as well as all other interested parties, with valued data and analysis on the international transfer of players.
Finally, I express my sincere gratitude to all FIBA and CIES collaborators who have contributed their hugely valuable expertise to this collaborative project and subsequent report; and we look forward to continuing this productive partnership in the future.
Patrick BAUMANNFIBA Secretary General and IOC Member
4 International Basketball Migration Report 20164 International Basketball Migration Report
ABA
VTB UnitedLeague
BLB
LNB
HEBA
Lega Basket TBL
LNBA
BBL
ACB
TBL
Super League
LNB
NBB
NBL
CBA
League composed by clubs from only one country
League composed by clubs from several countries
ABA (Bosnia H., Croatia, FYROM, Montenegro,
Serbia, Slovenia)
LNB (Argentina)
NBL (Australia, New Zealand)
BLB (Belgium)
CBA (China)
LNB (France)
BBL (Germany)
HEBA (Greece)
Super League (Israel)
Lega Basket (Italy)
NBB (Brazil)
TBL (Poland)
ACB (Spain)
LNBA (Switzerland)
TBL (Turkey)
VTB United League (Belarus, Czech Republic, Estonia, Finland, Georgia,
Kazakhstan, Latvia, Russia)
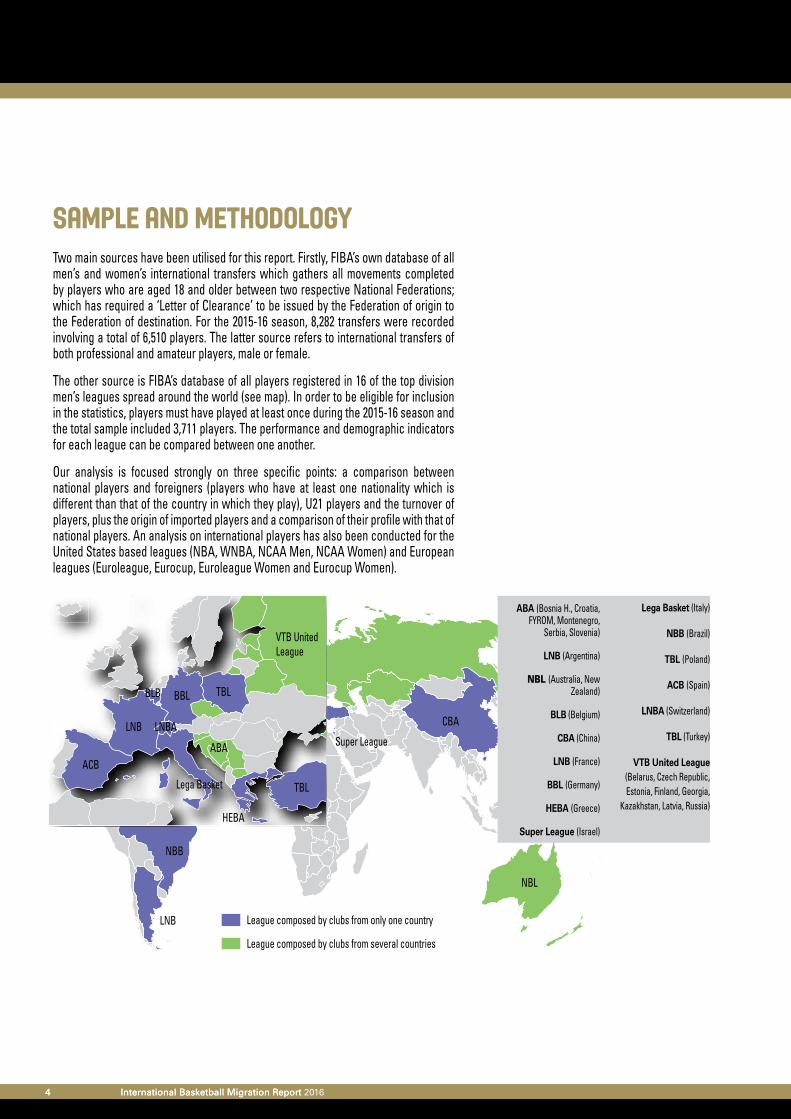
SAMPLE and methodologyTwo main sources have been utilised for this report. Firstly, FIBA’s own database of all men’s and women’s international transfers which gathers all movements completed by players who are aged 18 and older between two respective National Federations; which has required a ‘Letter of Clearance’ to be issued by the Federation of origin to the Federation of destination. For the 2015-16 season, 8,282 transfers were recorded involving a total of 6,510 players. The latter source refers to international transfers of both professional and amateur players, male or female.
The other source is FIBA’s database of all players registered in 16 of the top division men’s leagues spread around the world (see map). In order to be eligible for inclusion in the statistics, players must have played at least once during the 2015-16 season and the total sample included 3,711 players. The performance and demographic indicators for each league can be compared between one another.
Our analysis is focused strongly on three specific points: a comparison between national players and foreigners (players who have at least one nationality which is different than that of the country in which they play), U21 players and the turnover of players, plus the origin of imported players and a comparison of their profile with that of national players. An analysis on international players has also been conducted for the United States based leagues (NBA, WNBA, NCAA Men, NCAA Women) and European leagues (Euroleague, Eurocup, Euroleague Women and Eurocup Women).
5
• Exportsplayers leaving the country
• Importsplayers coming from abroad
• Migratory balanceplayers exported - players imported
• National exportsplayers leaving their home country
• National importsplayers returning to their home country
• Ageage of players on 01/10/2015
• International playersUS league players who have not the US nationality
• Foreignersplayers who have not the nationality of the country where they are playing
• Foreign U21 playersforeigner players born after 01/07/1994
• Nationalsplayers who have the nationality of the country where they are playing
• National U21 playersnational players born after 01/07/1994
• US playersplayers with US nationality
• U21 playersplayers born after 01/07/1994
• Fielded playersplayers who played at least one minute during the 2015-16 regular season
• Five most fielded playersthe five players having the highest playing time with their team during the 2015-16 regular season
• Games and minutes playedgames and minutes played during the 2015-16 regular season
• Association of recruitmentassociation where the players have been recruited after the end of the 2014-15 season. New players coming from the academy are considered as recruited in the country of the club.
• Foreigners already in the country/clubwith respect to the 2014-15 season. Percentage calculated among foreigners only.
• Players already in the country/clubwith respect to the 2014-15 season
• Players signed during the seasonplayers arrived in the team after having played in another team during the 2015-16 season
GlossaryINternational Transfers pLAYING TIME
TURNOVERPlayers characteristics
6 International Basketball Migration Report 20166 International Basketball Migration Report
HIGHLIGHTSAnother record for the number of international transfers per season
A new high tide mark has been set after the number of international transfers increased to a record 8,282 for the 2015-16 season. That eclipsed the previous record of 7,800 set during the 2014-15 season and continues the pattern of international transfers having increased since 2013-14. The 2015-16 increase was largely due to men’s transfers.
The trends of previous years largely continued, with Europe remaining the main focus of international transfers. However, the Americas region remains the biggest exporter of players to other continents – thanks to the impact of players exiting the USA and Canada. The USA also remains the most represented nationality of international transfers.
There was a big change during the 2014-15 season, when there was a big increase in Europe’s negative balance and a big increase in the Americas positive balance. During 2015-16, these numbers remained stable. One big difference in Europe from the previous year is that in a number of countries including Serbia, Lithuania, Bosnia and Herzegovina and Greece, a large percentage of inward international transfers were players returning to their home countries to play. Meanwhile at the global level, USA and Australia were both the biggest exporters and importers of players.
High number of foreign players within national leagues and an increase in different nationalities
The high representation of foreign players within the various national leagues continued in 2015-16, with the average percentage remaining stable at 41.9. Due to the local regulations, a total of 5 out of the 16 leagues had more foreign players than national players.
Spain remains the league with both the highest percentage of foreign players and most nationalities – with those numbers having further increased. Brazil has the lowest number of foreign players with 10.8%. After an increase in the number of nationalities represented during 2014-15, this past year saw that number remain stable with the exception of Greece (-7) and Argentina (+9). The playing time of foreign players is still high and underlines the impact this continues to have on the ongoing decline of national player development.
Limited court time and development opportunities within leagues for National U21 players
The lack of playing time for young players is another issue which continues to be prevalent. The development of the next generation is being affected by reduced court time for U21 players in most national leagues. The number of minutes handed out by coaches actually dropped during 2015-16, to further heighten concerns about the adverse impacts of leagues failing to recognise the importance of protecting the development of emerging players. These numbers are even lower in international leagues such as Euroleague, Eurocup and the NBA.
7
Instability due to a high turnover of players
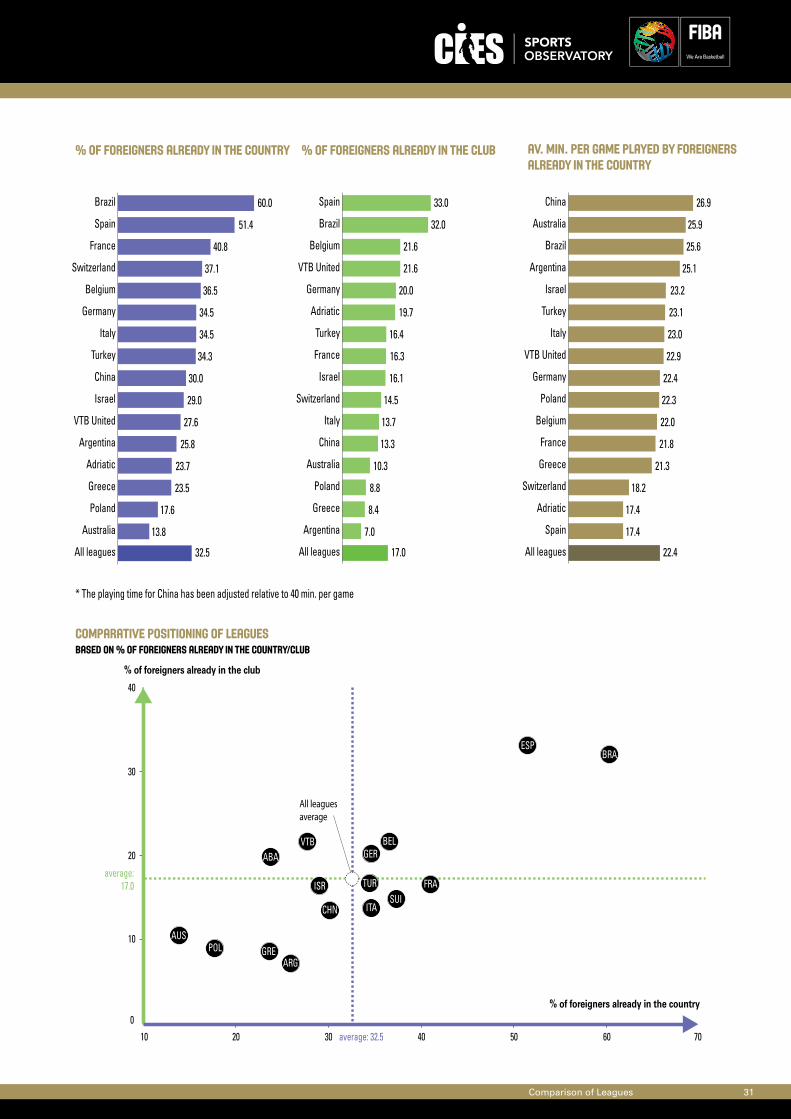
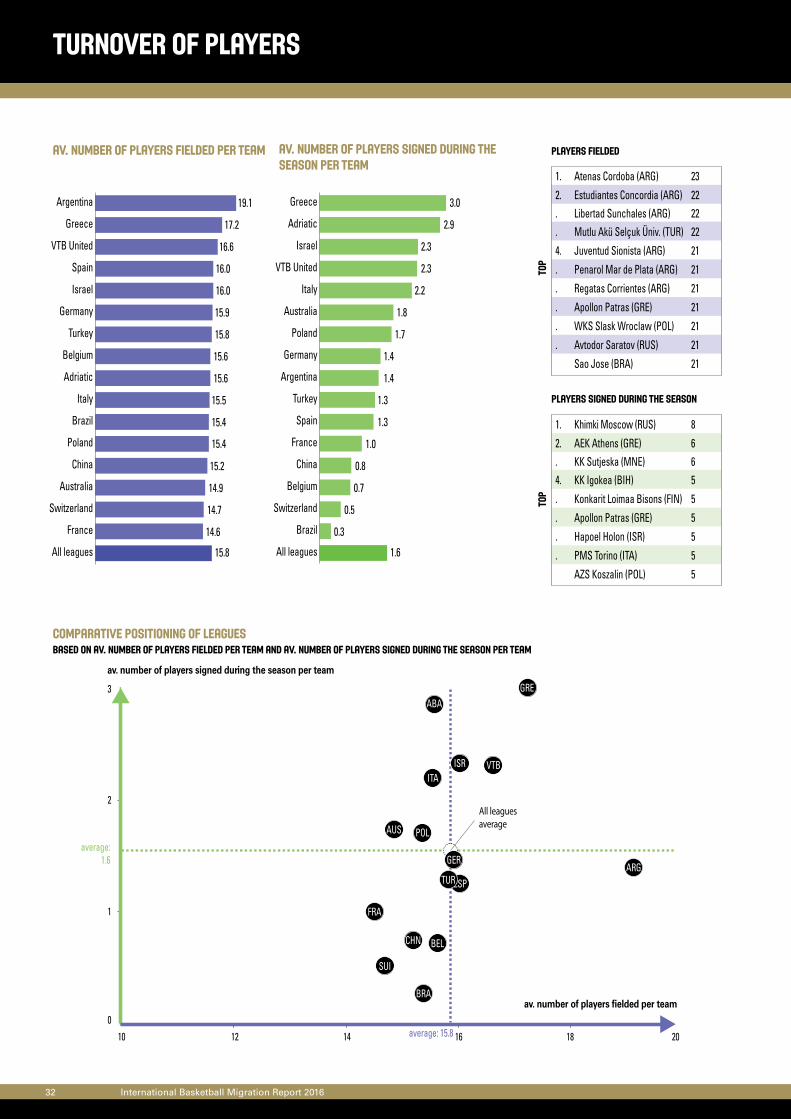
The turnover of players within leagues and clubs remains high, with numbers remaining stable in comparison to recent years. The16 leagues within the study presented an average turnover of a third of their players during the 2015-16 season. The turnover of players reaches 64.7% on a club scale. Figures for foreign players are even starker, since on average, only 32.5% of them played in the same country the previous season, and only 17.0 % of them played at the same club.
These key observations are accompanied by the number of players fielded per team (15.8 players on average), and the important number of players signed during the season per team (1.6 on average) – something which underlines how it is not rare for clubs to replace players after the start of the season.
The continuing trend of instability on club rosters in respect of the high volume of transfers is potentially impacting on the identity, credibility and growth of leagues. This is because fans are not being given time to develop the same affiliation to their teams and to players due to the constant number of changes in what has become an annual ‘churn’ of personnel.
International Leagues
The analysis of international leagues has produced some mixed outcomes. One of the most prominent is yet another increase of international players in the NBA, although this is perhaps diluted by their still limited presence on the court via a low number of minutes per game. There is a similar pattern in the WNBA, with a continued decrease in the number of years played in the league. The NCAA has witnessed a decrease in the number of international players in Division 1 for both men and women.
Meanwhile Euroleague and Eurocup (both men and women) still rely heavily on utilising American players. In terms of both men’s competitions in particular, this could be viewed as very concerning for Euroleague and Eurocup, since the new television contract for the NBA (and NBADL) is likely to lead to a decrease in the overall quality of American players coming to Europe, with potentially better salaries in the US encouraging more high-level players to remain in their home country.

international transfers 2015/2016
10 International Basketball Migration Report 2016
international transfers
Flows from EuropeAmericasAfricaAsiaOceania
International transfers
International transfers inside FIBA Zone
Only flows with at least 50 transfers are represented
1 372
50100200
136
138
3 978
616
136
51
international transfers, by Fiba zone
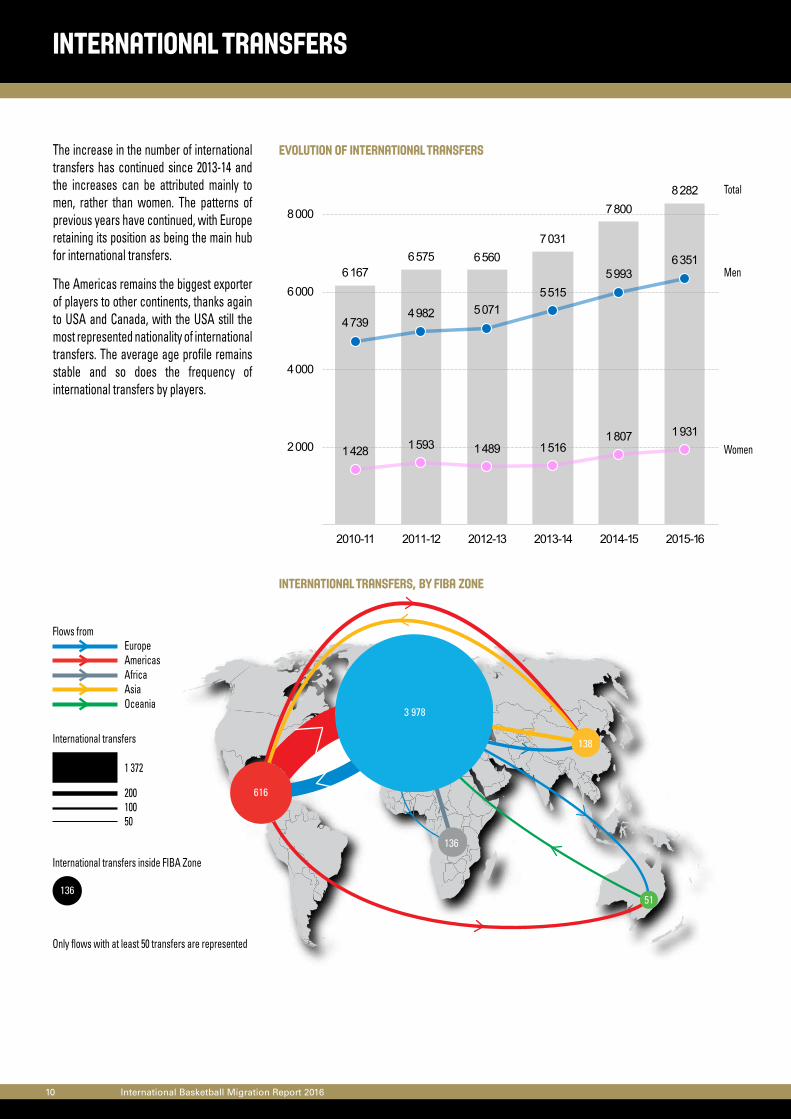
Evolution of international transfersThe increase in the number of international transfers has continued since 2013-14 and the increases can be attributed mainly to men, rather than women. The patterns of previous years have continued, with Europe retaining its position as being the main hub for international transfers.
The Americas remains the biggest exporter of players to other continents, thanks again to USA and Canada, with the USA still the most represented nationality of international transfers. The average age profile remains stable and so does the frequency of international transfers by players.
Men
Women
Total
6 1676 575 6 560
7 031
7 8008 282
1 428 1 593 1 489 1 5161 807 1 931
4 7394 982 5 071
5 5155 993
6 351
2 000
4 000
6 000
8 000
2010-11 2011-12 2012-13 2013-14 2014-15 2015-16
International Transfers 11
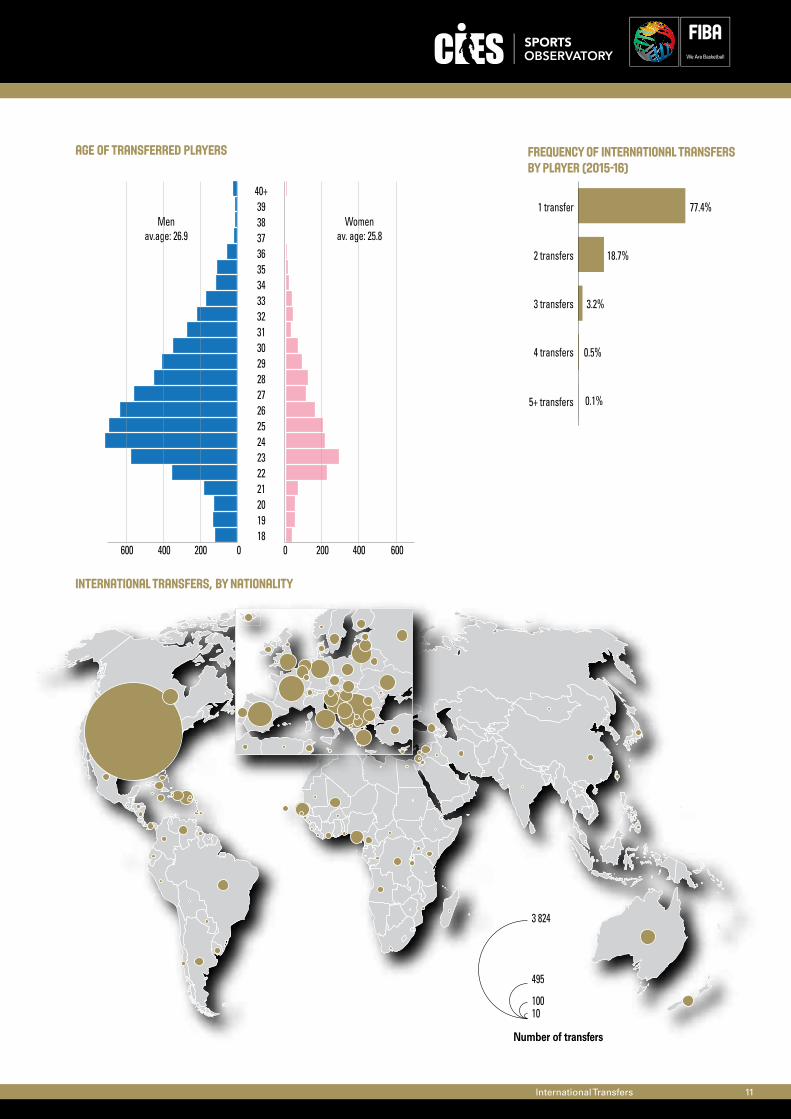
Age of transferred players FREQUENCY OF INTERNATIONAL TRANSFERS BY PLAYER (2015-16)
international transfers, by nationality
Number of transfers
495
3 824
10010
Menav.age: 26.9
Womenav. age: 25.8
18600 400 200 0 0 200 400 600
192021222324252627282930313233343536373839
40+1 transfer
2 transfers
3 transfers
4 transfers
77.4%
18.7%
3.2%
0.5%
0.1%5+ transfers
12 International Basketball Migration Report 2016
Migratory balance, by country
Negative balance
Positive balance
877
317
100
10Absolute balance
Migratory baLance, by FIBA ZONE
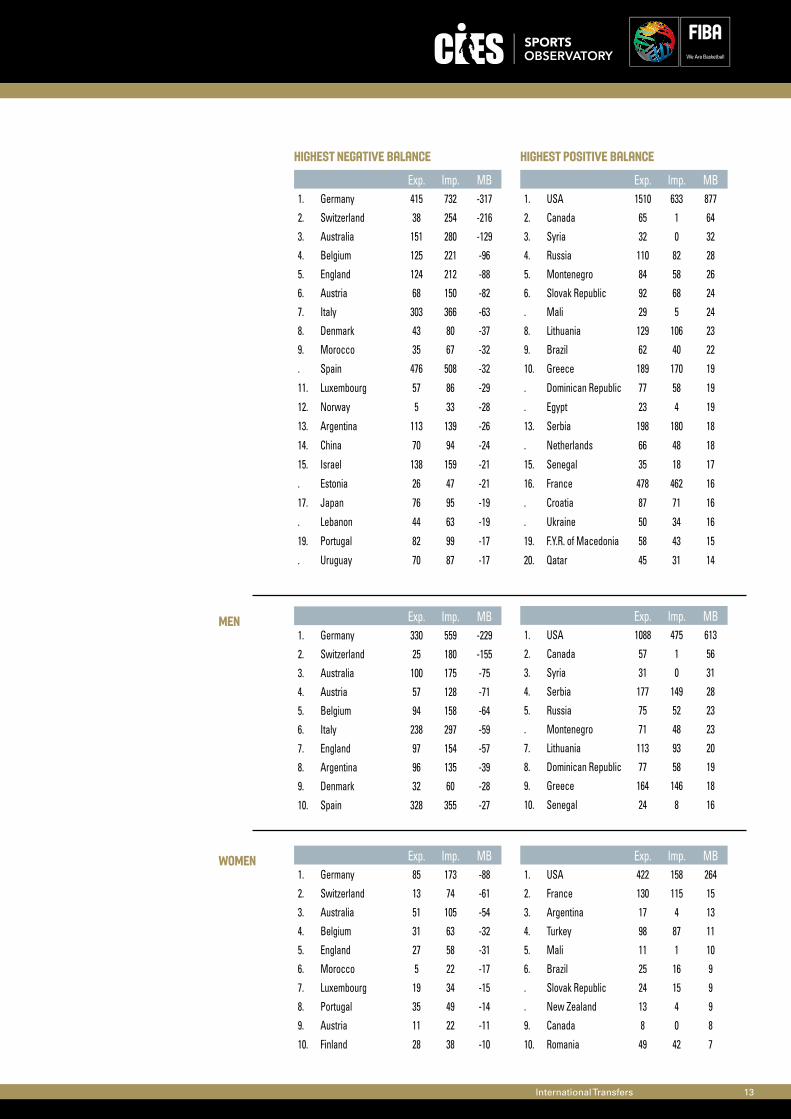
Migratory BALANCE
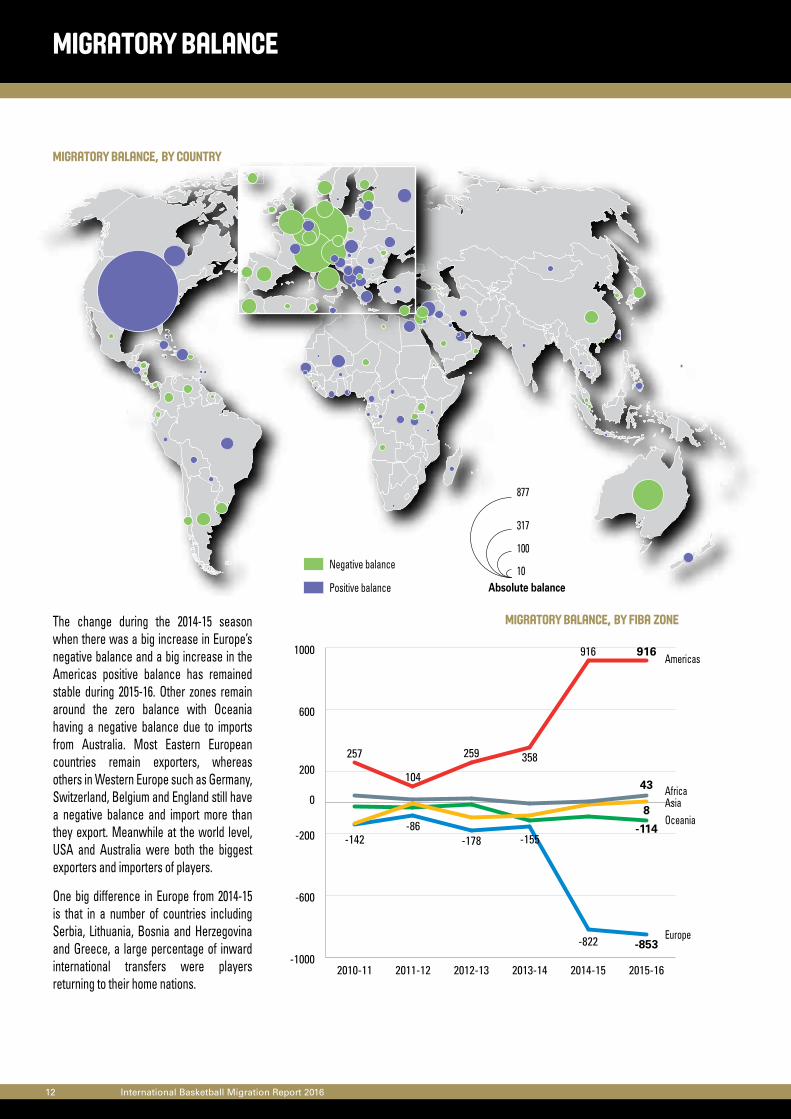
The change during the 2014-15 season when there was a big increase in Europe’s negative balance and a big increase in the Americas positive balance has remained stable during 2015-16. Other zones remain around the zero balance with Oceania having a negative balance due to imports from Australia. Most Eastern European countries remain exporters, whereas others in Western Europe such as Germany, Switzerland, Belgium and England still have a negative balance and import more than they export. Meanwhile at the world level, USA and Australia were both the biggest exporters and importers of players.
One big difference in Europe from 2014-15 is that in a number of countries including Serbia, Lithuania, Bosnia and Herzegovina and Greece, a large percentage of inward international transfers were players returning to their home nations.
-1000
-600
-200
200
0
600
1000
-114-142
-86-178 -155
-822 -853
8
257
104
259 358
916 916
43
2015-162014-152013-142012-132011-122010-11
Africa
Americas
AsiaOceania
Europe
International Transfers 13
Highest negative balance
MEN
Women
Highest Positive balance
Exp. Imp. MB1. USA 1510 633 877
2. Canada 65 1 64
3. Syria 32 0 32
4. Russia 110 82 28
5. Montenegro 84 58 26
6. Slovak Republic 92 68 24
. Mali 29 5 24
8. Lithuania 129 106 23
9. Brazil 62 40 22
10. Greece 189 170 19
. Dominican Republic 77 58 19
. Egypt 23 4 19
13. Serbia 198 180 18
. Netherlands 66 48 18
15. Senegal 35 18 17
16. France 478 462 16
. Croatia 87 71 16
. Ukraine 50 34 16
19. F.Y.R. of Macedonia 58 43 15
20. Qatar 45 31 14
Exp. Imp. MB1. Germany 415 732 -317
2. Switzerland 38 254 -216
3. Australia 151 280 -129
4. Belgium 125 221 -96
5. England 124 212 -88
6. Austria 68 150 -82
7. Italy 303 366 -63
8. Denmark 43 80 -37
9. Morocco 35 67 -32
. Spain 476 508 -32
11. Luxembourg 57 86 -29
12. Norway 5 33 -28
13. Argentina 113 139 -26
14. China 70 94 -24
15. Israel 138 159 -21
. Estonia 26 47 -21
17. Japan 76 95 -19
. Lebanon 44 63 -19
19. Portugal 82 99 -17
. Uruguay 70 87 -17
Exp. Imp. MB1. Germany 330 559 -229
2. Switzerland 25 180 -155
3. Australia 100 175 -75
4. Austria 57 128 -71
5. Belgium 94 158 -64
6. Italy 238 297 -59
7. England 97 154 -57
8. Argentina 96 135 -39
9. Denmark 32 60 -28
10. Spain 328 355 -27
Exp. Imp. MB1. Germany 85 173 -88
2. Switzerland 13 74 -61
3. Australia 51 105 -54
4. Belgium 31 63 -32
5. England 27 58 -31
6. Morocco 5 22 -17
7. Luxembourg 19 34 -15
8. Portugal 35 49 -14
9. Austria 11 22 -11
10. Finland 28 38 -10
Exp. Imp. MB1. USA 1088 475 613
2. Canada 57 1 56
3. Syria 31 0 31
4. Serbia 177 149 28
5. Russia 75 52 23
. Montenegro 71 48 23
7. Lithuania 113 93 20
8. Dominican Republic 77 58 19
9. Greece 164 146 18
10. Senegal 24 8 16
Exp. Imp. MB1. USA 422 158 264
2. France 130 115 15
3. Argentina 17 4 13
4. Turkey 98 87 11
5. Mali 11 1 10
6. Brazil 25 16 9
. Slovak Republic 24 15 9
. New Zealand 13 4 9
9. Canada 8 0 8
10. Romania 49 42 7
14 International Basketball Migration Report 2016
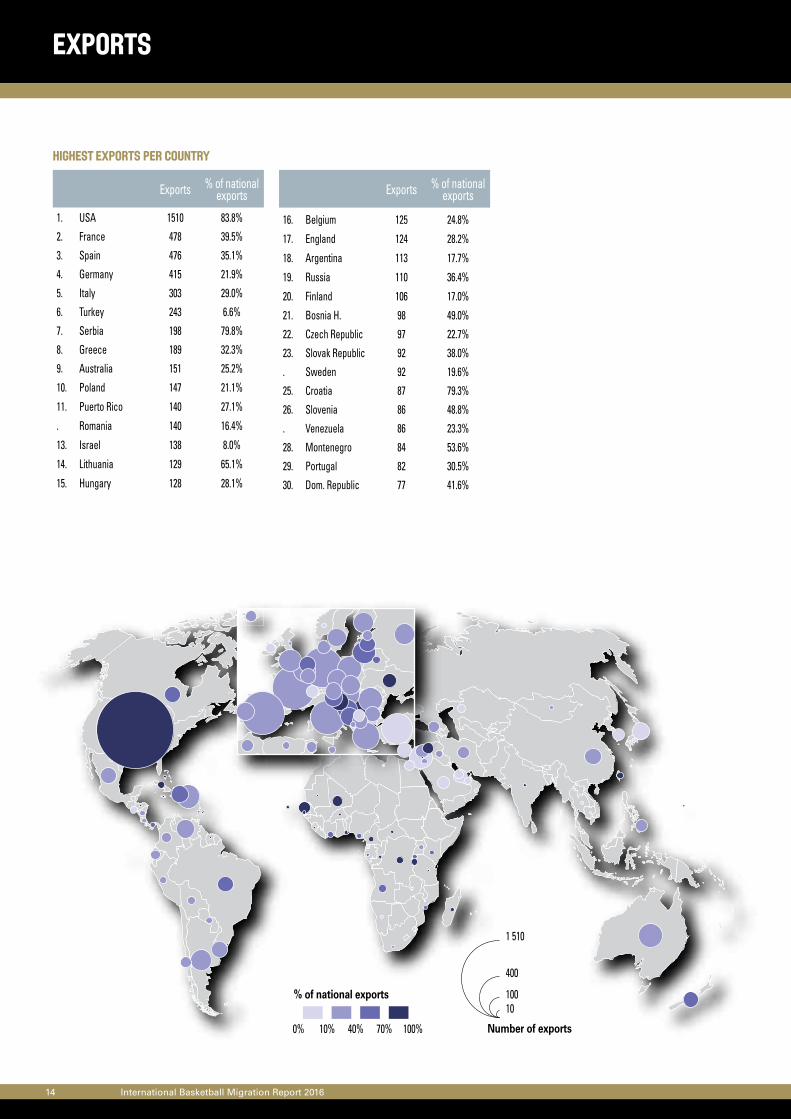
Highest exports per country
Number of exports
1 510
400
10010
100%70%40%10%0%
% of national exports
Exports % of national exports
1. USA 1510 83.8%
2. France 478 39.5%
3. Spain 476 35.1%
4. Germany 415 21.9%
5. Italy 303 29.0%
6. Turkey 243 6.6%
7. Serbia 198 79.8%
8. Greece 189 32.3%
9. Australia 151 25.2%
10. Poland 147 21.1%
11. Puerto Rico 140 27.1%
. Romania 140 16.4%
13. Israel 138 8.0%
14. Lithuania 129 65.1%
15. Hungary 128 28.1%
16. Belgium 125 24.8%
17. England 124 28.2%
18. Argentina 113 17.7%
19. Russia 110 36.4%
20. Finland 106 17.0%
21. Bosnia H. 98 49.0%
22. Czech Republic 97 22.7%
23. Slovak Republic 92 38.0%
. Sweden 92 19.6%
25. Croatia 87 79.3%
26. Slovenia 86 48.8%
. Venezuela 86 23.3%
28. Montenegro 84 53.6%
29. Portugal 82 30.5%
30. Dom. Republic 77 41.6%
Exports
Exports % of national exports
International Transfers 15
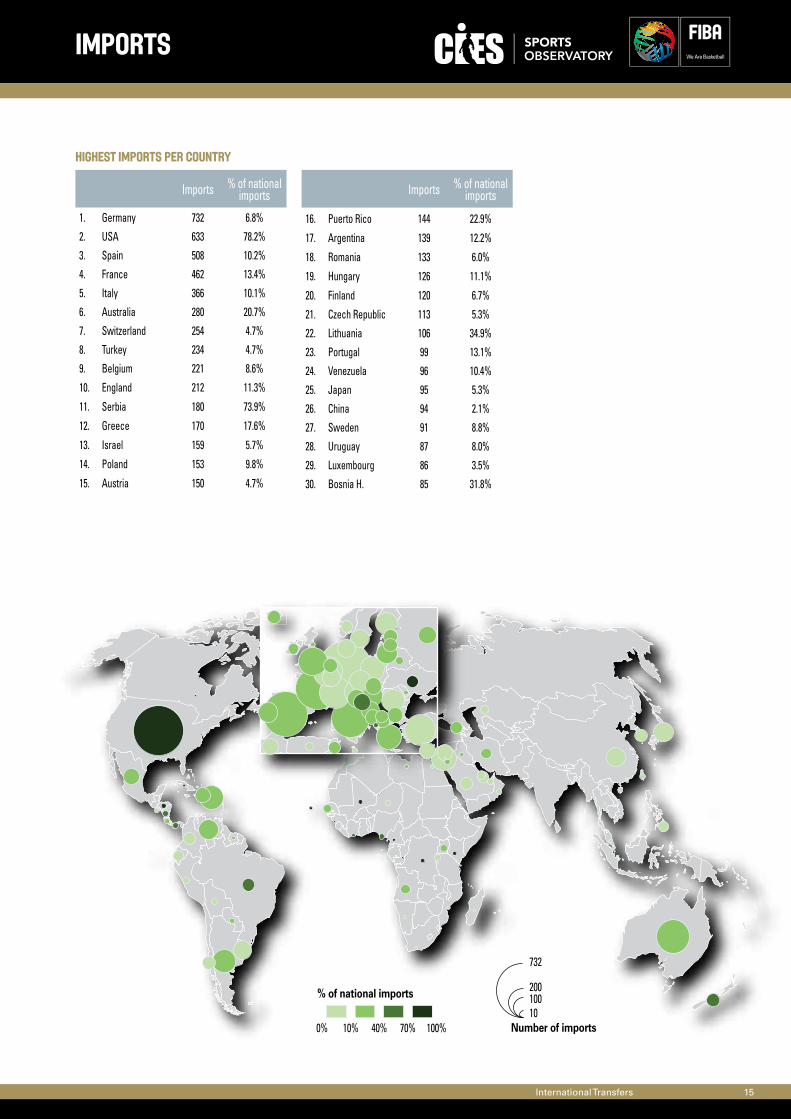
Highest imports per country
Number of imports
732
20010010
100%70%40%10%0%
% of national imports
Imports % of national imports
1. Germany 732 6.8%
2. USA 633 78.2%
3. Spain 508 10.2%
4. France 462 13.4%
5. Italy 366 10.1%
6. Australia 280 20.7%
7. Switzerland 254 4.7%
8. Turkey 234 4.7%
9. Belgium 221 8.6%
10. England 212 11.3%
11. Serbia 180 73.9%
12. Greece 170 17.6%
13. Israel 159 5.7%
14. Poland 153 9.8%
15. Austria 150 4.7%
16. Puerto Rico 144 22.9%
17. Argentina 139 12.2%
18. Romania 133 6.0%
19. Hungary 126 11.1%
20. Finland 120 6.7%
21. Czech Republic 113 5.3%
22. Lithuania 106 34.9%
23. Portugal 99 13.1%
24. Venezuela 96 10.4%
25. Japan 95 5.3%
26. China 94 2.1%
27. Sweden 91 8.8%
28. Uruguay 87 8.0%
29. Luxembourg 86 3.5%
30. Bosnia H. 85 31.8%
Imports
Imports % of national imports
16 International Basketball Migration Report 2016
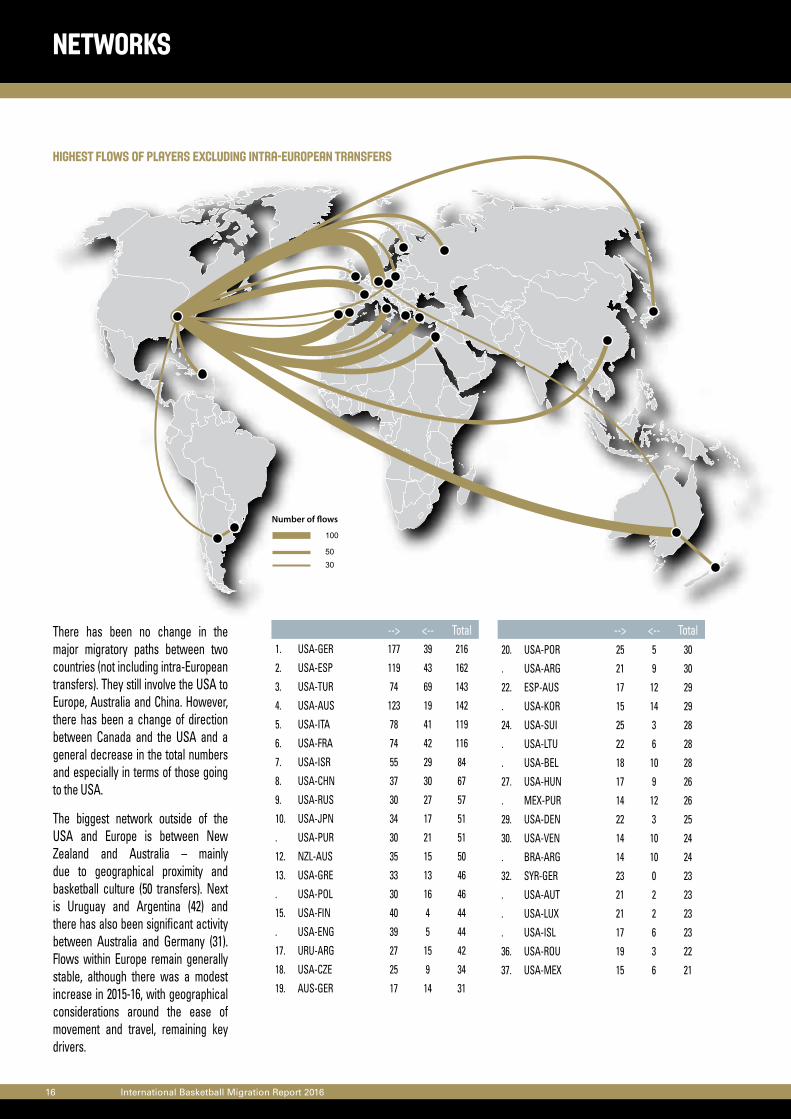
HIGHEST FLOWS OF PLAYERS EXCLUDING INTRA-EUROPEAN TRANSFERS
Number of �ows
100
5030
--> <-- Total1. USA-GER 177 39 216
2. USA-ESP 119 43 162
3. USA-TUR 74 69 143
4. USA-AUS 123 19 142
5. USA-ITA 78 41 119
6. USA-FRA 74 42 116
7. USA-ISR 55 29 84
8. USA-CHN 37 30 67
9. USA-RUS 30 27 57
10. USA-JPN 34 17 51
. USA-PUR 30 21 51
12. NZL-AUS 35 15 50
13. USA-GRE 33 13 46
. USA-POL 30 16 46
15. USA-FIN 40 4 44
. USA-ENG 39 5 44
17. URU-ARG 27 15 42
18. USA-CZE 25 9 34
19. AUS-GER 17 14 31
--> <-- Total20. USA-POR 25 5 30
. USA-ARG 21 9 30
22. ESP-AUS 17 12 29
. USA-KOR 15 14 29
24. USA-SUI 25 3 28
. USA-LTU 22 6 28
. USA-BEL 18 10 28
27. USA-HUN 17 9 26
. MEX-PUR 14 12 26
29. USA-DEN 22 3 25
30. USA-VEN 14 10 24
. BRA-ARG 14 10 24
32. SYR-GER 23 0 23
. USA-AUT 21 2 23
. USA-LUX 21 2 23
. USA-ISL 17 6 23
36. USA-ROU 19 3 22
37. USA-MEX 15 6 21
networks
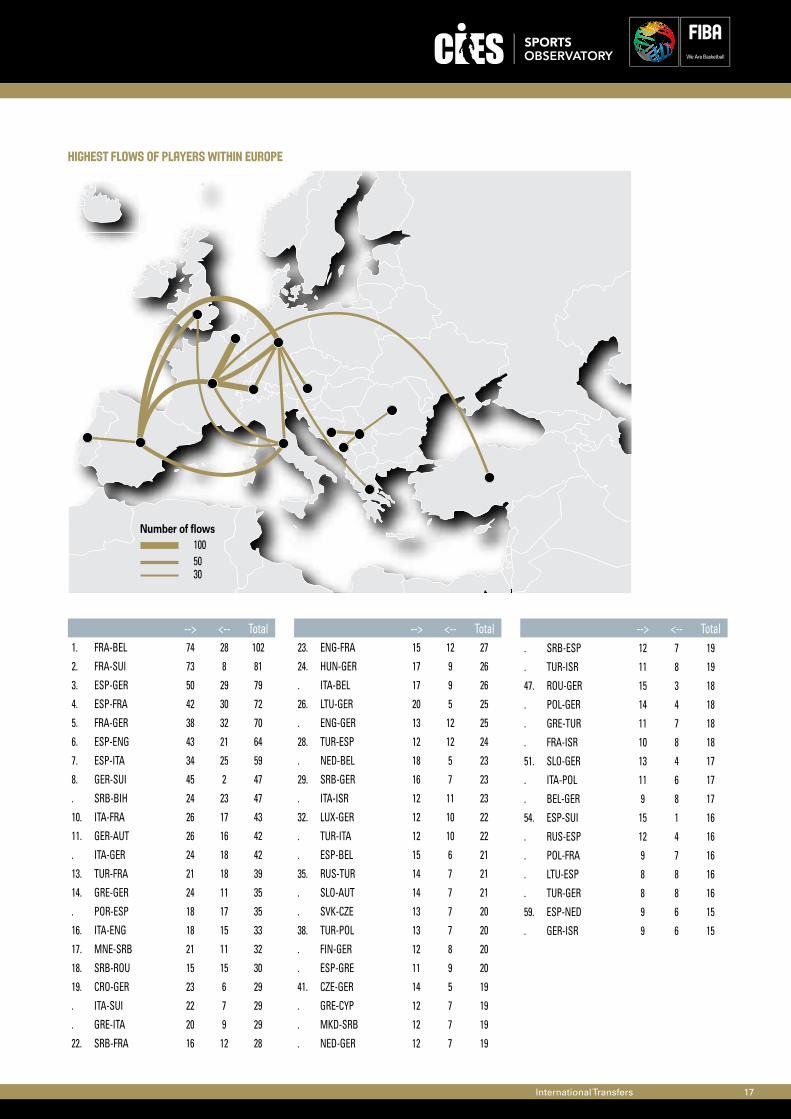
There has been no change in the major migratory paths between two countries (not including intra-European transfers). They still involve the USA to Europe, Australia and China. However, there has been a change of direction between Canada and the USA and a general decrease in the total numbers and especially in terms of those going to the USA.
The biggest network outside of the USA and Europe is between New Zealand and Australia – mainly due to geographical proximity and basketball culture (50 transfers). Next is Uruguay and Argentina (42) and there has also been significant activity between Australia and Germany (31).Flows within Europe remain generally stable, although there was a modest increase in 2015-16, with geographical considerations around the ease of movement and travel, remaining key drivers.
International Transfers 17
Highest FLOWS of players within europe
--> <-- Total1. FRA-BEL 74 28 102
2. FRA-SUI 73 8 81
3. ESP-GER 50 29 79
4. ESP-FRA 42 30 72
5. FRA-GER 38 32 70
6. ESP-ENG 43 21 64
7. ESP-ITA 34 25 59
8. GER-SUI 45 2 47
. SRB-BIH 24 23 47
10. ITA-FRA 26 17 43
11. GER-AUT 26 16 42
. ITA-GER 24 18 42
13. TUR-FRA 21 18 39
14. GRE-GER 24 11 35
. POR-ESP 18 17 35
16. ITA-ENG 18 15 33
17. MNE-SRB 21 11 32
18. SRB-ROU 15 15 30
19. CRO-GER 23 6 29
. ITA-SUI 22 7 29
. GRE-ITA 20 9 29
22. SRB-FRA 16 12 28
23. ENG-FRA 15 12 27
24. HUN-GER 17 9 26
. ITA-BEL 17 9 26
26. LTU-GER 20 5 25
. ENG-GER 13 12 25
28. TUR-ESP 12 12 24
. NED-BEL 18 5 23
29. SRB-GER 16 7 23
. ITA-ISR 12 11 23
32. LUX-GER 12 10 22
. TUR-ITA 12 10 22
. ESP-BEL 15 6 21
35. RUS-TUR 14 7 21
. SLO-AUT 14 7 21
. SVK-CZE 13 7 20
38. TUR-POL 13 7 20
. FIN-GER 12 8 20
. ESP-GRE 11 9 20
41. CZE-GER 14 5 19
. GRE-CYP 12 7 19
. MKD-SRB 12 7 19
. NED-GER 12 7 19
Number of flows1005030
. SRB-ESP 12 7 19
. TUR-ISR 11 8 19
47. ROU-GER 15 3 18
. POL-GER 14 4 18
. GRE-TUR 11 7 18
. FRA-ISR 10 8 18
51. SLO-GER 13 4 17
. ITA-POL 11 6 17
. BEL-GER 9 8 17
54. ESP-SUI 15 1 16
. RUS-ESP 12 4 16
. POL-FRA 9 7 16
. LTU-ESP 8 8 16
. TUR-GER 8 8 16
59. ESP-NED 9 6 15
. GER-ISR 9 6 15
--> <-- Total --> <-- Total
18 International Basketball Migration Report 2016
233
214
0
100
200
300
99-00 01-02 03-04 05-06 07-08 09-10 11-12 13-14 15-16
Lock
out
Summ
er Le
ague
s’ LO
Cs
NBA
EVOLUTION OF INTERNATIONAL TRANSFERS IN AND OUT OF NBA
zone of origin (2015-16)
All players
All players
non US players
non US players
zone of Destination (2015-16)
in NBA
out NBA
1%
5%
18%
74%
2%
Africa
Americas
Asia
Europe
Oceania
2%
3%
16%
77%
2%
Africa
Americas
Asia
Europe
Oceania
1%
7%
12%
78%
1%
Africa
Americas
Asia
Europe
Oceania
1%
10%
14%
73%
3%
Africa
Americas
Asia
Europe
Oceania
USA leagues
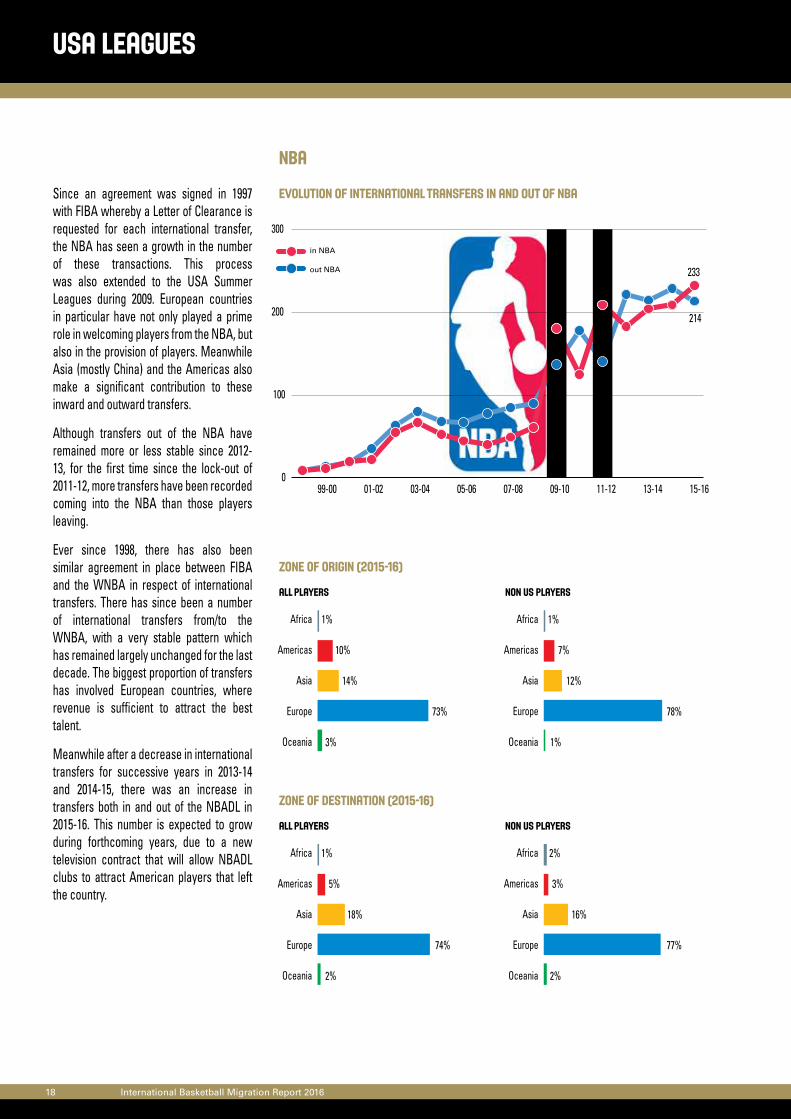
Since an agreement was signed in 1997 with FIBA whereby a Letter of Clearance is requested for each international transfer, the NBA has seen a growth in the number of these transactions. This process was also extended to the USA Summer Leagues during 2009. European countries in particular have not only played a prime role in welcoming players from the NBA, but also in the provision of players. Meanwhile Asia (mostly China) and the Americas also make a significant contribution to these inward and outward transfers.
Although transfers out of the NBA have remained more or less stable since 2012-13, for the first time since the lock-out of 2011-12, more transfers have been recorded coming into the NBA than those players leaving.
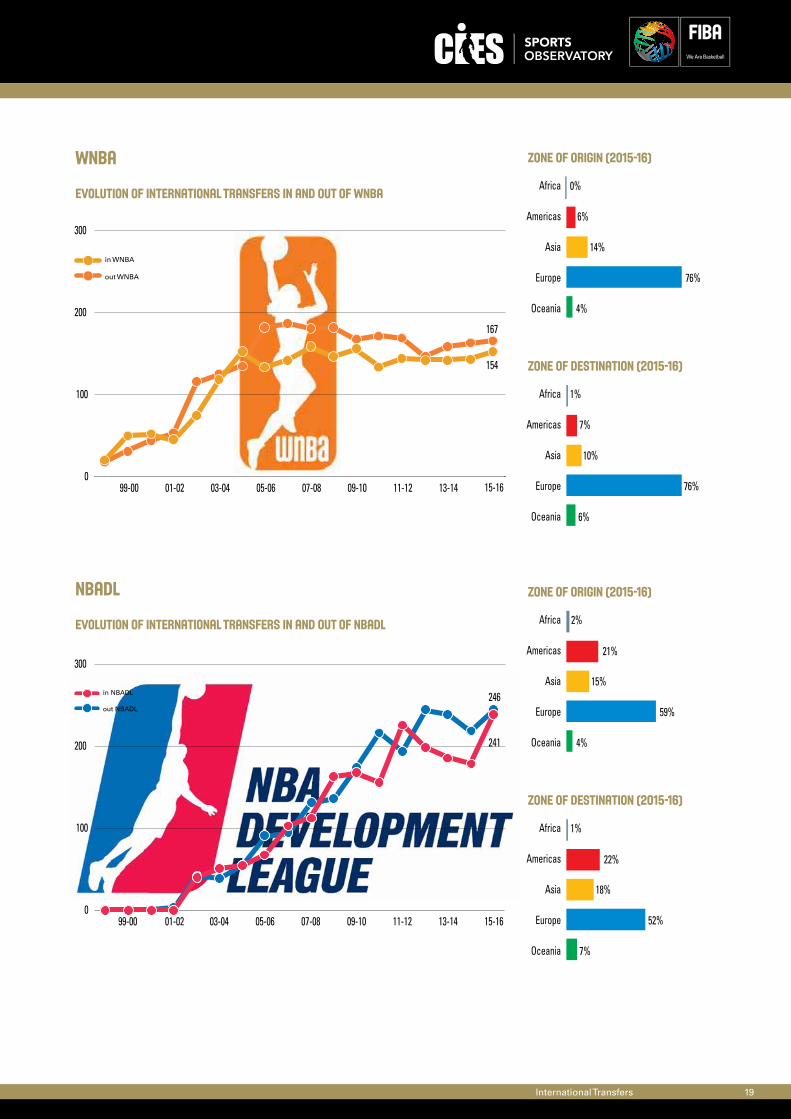
Ever since 1998, there has also been similar agreement in place between FIBA and the WNBA in respect of international transfers. There has since been a number of international transfers from/to the WNBA, with a very stable pattern which has remained largely unchanged for the last decade. The biggest proportion of transfers has involved European countries, where revenue is sufficient to attract the best talent.
Meanwhile after a decrease in international transfers for successive years in 2013-14 and 2014-15, there was an increase in transfers both in and out of the NBADL in 2015-16. This number is expected to grow during forthcoming years, due to a new television contract that will allow NBADL clubs to attract American players that left the country.
International Transfers 19
246
241
0
100
200
300
99-00 01-02 03-04 05-06 07-08 09-10 11-12 13-14 15-16
0
100
200
300
99-00 01-02 03-04 05-06 07-08 09-10 11-12 13-14 15-16
167
154
wNBA
NBADL
EVOLUTION OF INTERNATIONAL TRANSFERS IN AND OUT OF WNBA
EVOLUTION OF INTERNATIONAL TRANSFERS IN AND OUT OF NBADL
zone of origin (2015-16)
zone of origin (2015-16)
zone of Destination (2015-16)
zone of Destination (2015-16)
in WNBA
out WNBA
in NBADL
out NBADL
0%
6%
14%
76%
4%
Africa
Americas
Asia
Europe
Oceania
1%
7%
10%
76%
6%
Africa
Americas
Asia
Europe
Oceania
2%
21%
15%
59%
4%
Africa
Americas
Asia
Europe
Oceania
1%
22%
18%
52%
7%
Africa
Americas
Asia
Europe
Oceania
20 International Basketball Migration Report 2016
Most represented nationalitiesTotal: 57 nationalities
Nationality of Fiba CERTIFIED Agents (2015-16)
Number of agents
138
2010
1
2010-11 2011-12 2012-13 2013-14 2014-15 2015-16
412
456481
506 497
459
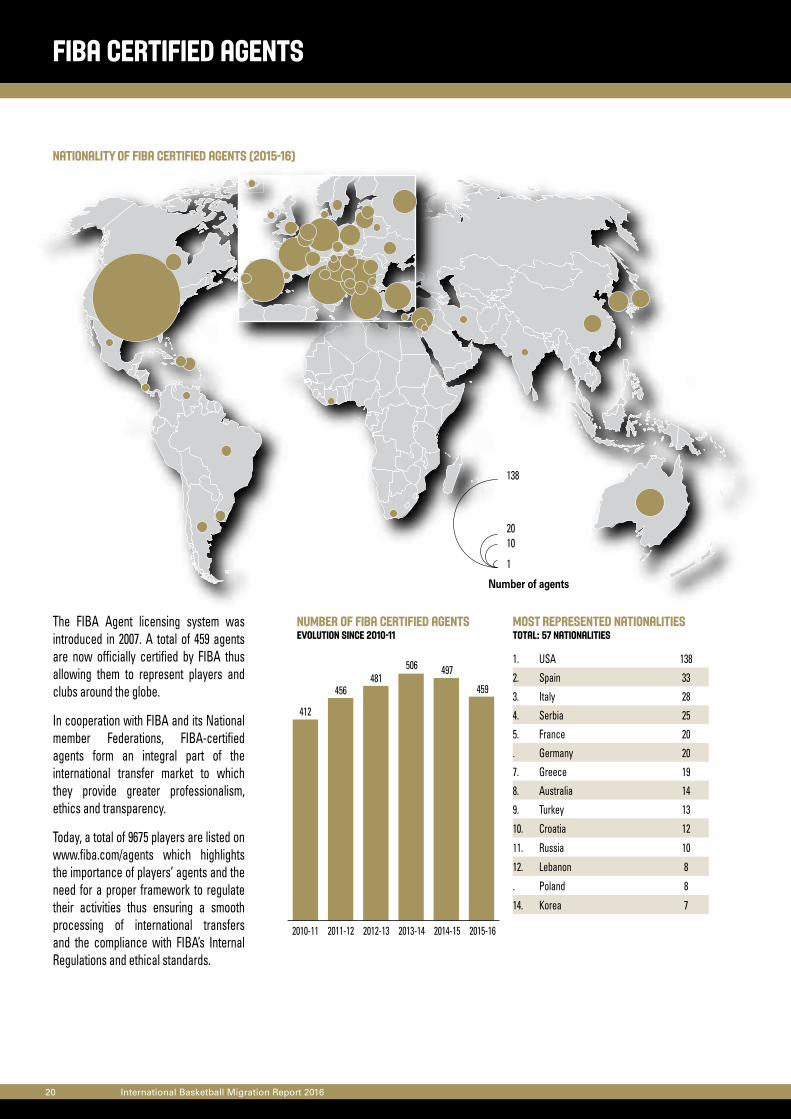
1. USA 138
2. Spain 33
3. Italy 28
4. Serbia 25
5. France 20
. Germany 20
7. Greece 19
8. Australia 14
9. Turkey 13
10. Croatia 12
11. Russia 10
12. Lebanon 8
. Poland 8
14. Korea 7
Number of FIBA CERTIFIED AGENTSEvolution since 2010-11
FIBA certified agents
The FIBA Agent licensing system was introduced in 2007. A total of 459 agents are now officially certified by FIBA thus allowing them to represent players and clubs around the globe.
In cooperation with FIBA and its National member Federations, FIBA-certified agents form an integral part of the international transfer market to which they provide greater professionalism, ethics and transparency.
Today, a total of 9675 players are listed on www.fiba.com/agents which highlights the importance of players’ agents and the need for a proper framework to regulate their activities thus ensuring a smooth processing of international transfers and the compliance with FIBA’s Internal Regulations and ethical standards.
International Transfers 21
2007200820092010201120122013
20152014 123 762
107 715
Aver
age v
alue (
€)
Arbit
ratio
n cos
ts (€)
78 823142 612137 140137 217
218 279249 941
556 157
8 9847 214
8 5429 047
7 3136 999
7 8688 201
7 975
1. Turkey 141
2. Italy 92
3. Russia 65
4. Greece 52
5. Spain 38
6. Poland 32
. Ukraine 32
8. Croatia 30
9. Romania 20
10. China 18
11. Lithuania 16
12. Slovenia 14
13. Puerto Rico 5
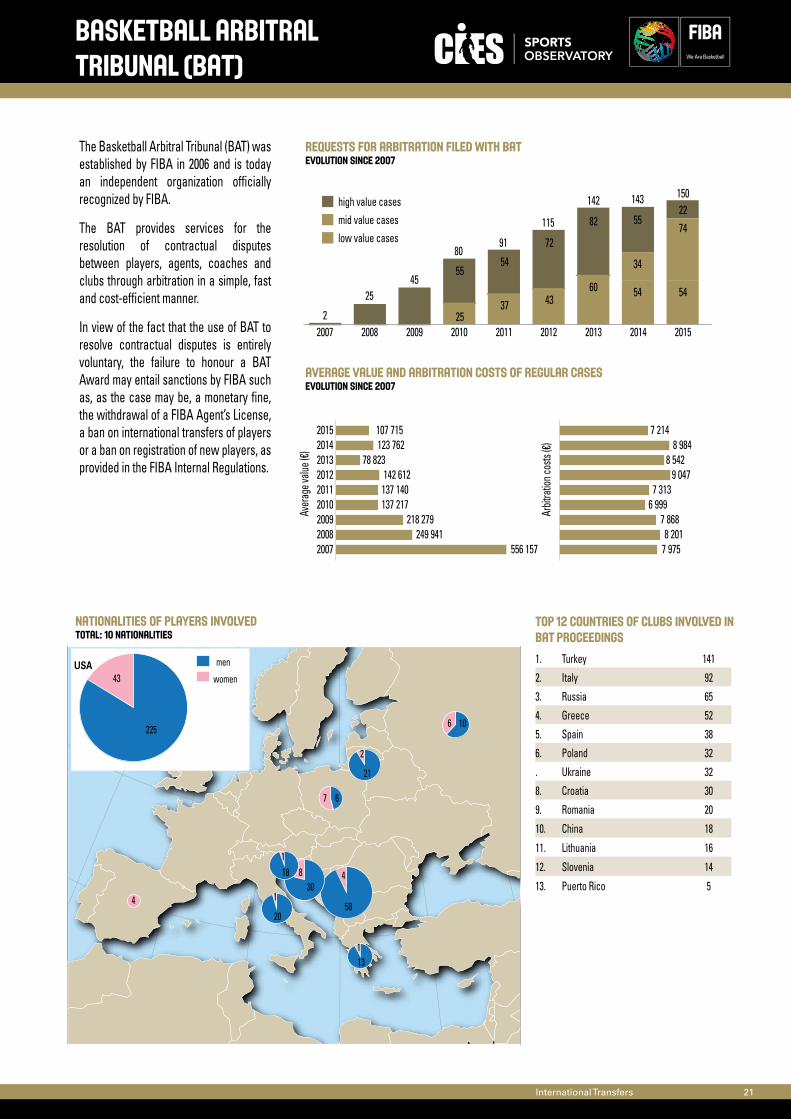
TOP 12 countries of clubs involved in bat proceedings
Basketball Arbitral Tribunal (BAT)
The Basketball Arbitral Tribunal (BAT) was established by FIBA in 2006 and is today an independent organization officially recognized by FIBA.
The BAT provides services for the resolution of contractual disputes between players, agents, coaches and clubs through arbitration in a simple, fast and cost-efficient manner.
In view of the fact that the use of BAT to resolve contractual disputes is entirely voluntary, the failure to honour a BAT Award may entail sanctions by FIBA such as, as the case may be, a monetary fine, the withdrawal of a FIBA Agent’s License, a ban on international transfers of players or a ban on registration of new players, as provided in the FIBA Internal Regulations.
2007 2008 2009 2010 2011 2012 2013 2014 20152
2545
55
2537 43
72
60
82
54
34
55
5480
91
115
142 143
54
7422150
low value casesmid value caseshigh value cases
women
men
225
58
30
204
USA43
48
1
21
2
67
106
131
181
nationalities of players involvedTotal: 10 nationalities
requests for arbitRation filed with BATEvolution since 2007
average value and arbitration costs of regular casesEvolution since 2007


comparison of leagues2015/2016
24 International Basketball Migration Report 2016
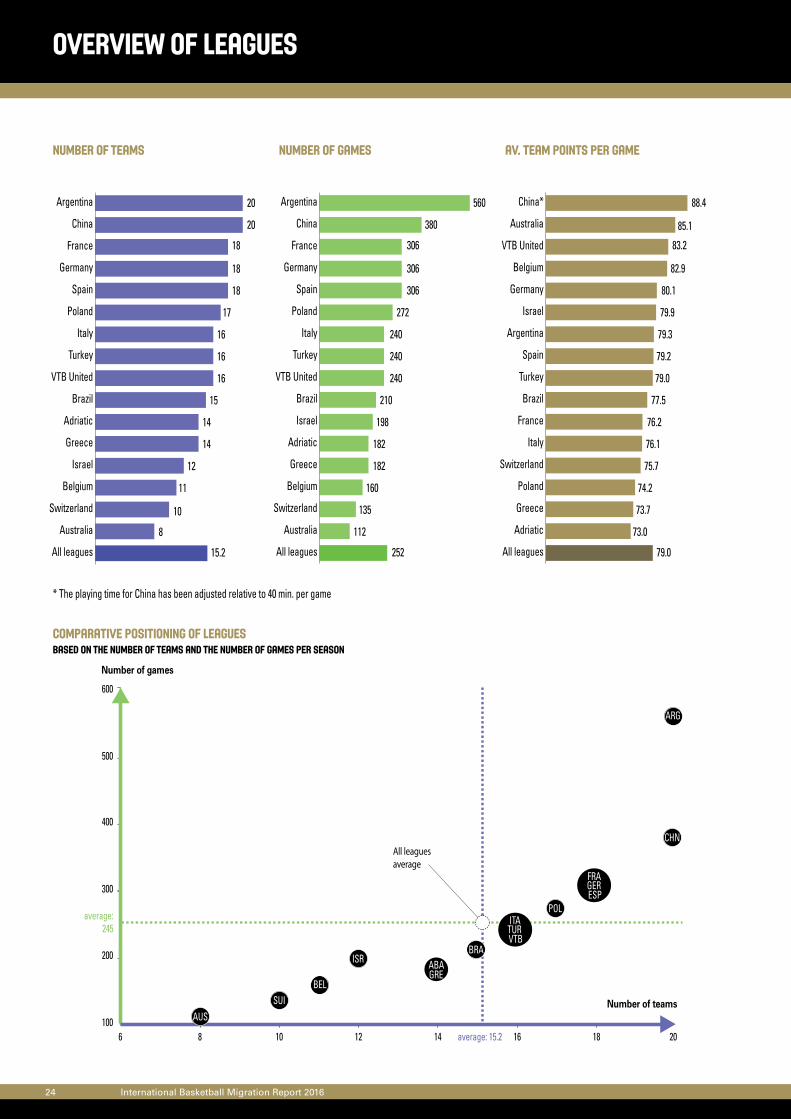
overview of leagues
Number of teams
Comparative positioning of leaguesBased on the number of teams and the number of games per season
number of games AV. team points per game
All leagues average
100
600
400
500
300
200
8 10 126 14 16 18 20
Number of games
Number of teams
average: 15.2
average:245
ARG
BEL
CHN
ABAGRE
FRA
ESPGER
ITA
VTBTUR
ISRBRA
POL
AUSSUI
All leagues
Australia
Switzerland
Belgium
Greece
Adriatic
Israel
Brazil
VTB United
Turkey
Italy
Poland
Spain
Germany
France
China
Argentina
252
112
135
160
182
182
198
210
240
240
240
272
306
306
306
380
560
All leagues
Adriatic
Greece
Poland
Switzerland
Italy
France
Brazil
Turkey
Spain
Argentina
Israel
Germany
Belgium
VTB United
Australia
China*
79.0
73.0
73.7
74.2
75.7
76.1
76.2
77.5
79.0
79.2
79.3
79.9
80.1
82.9
83.2
85.1
88.4
All leagues
Australia
Switzerland
Belgium
Israel
Greece
Adriatic
Brazil
VTB United
Turkey
Italy
Poland
Spain
Germany
France
China
Argentina
15.2
8
10
11
12
14
14
15
16
16
16
17
18
18
18
20
20
* The playing time for China has been adjusted relative to 40 min. per game
Comparison of Leagues 25
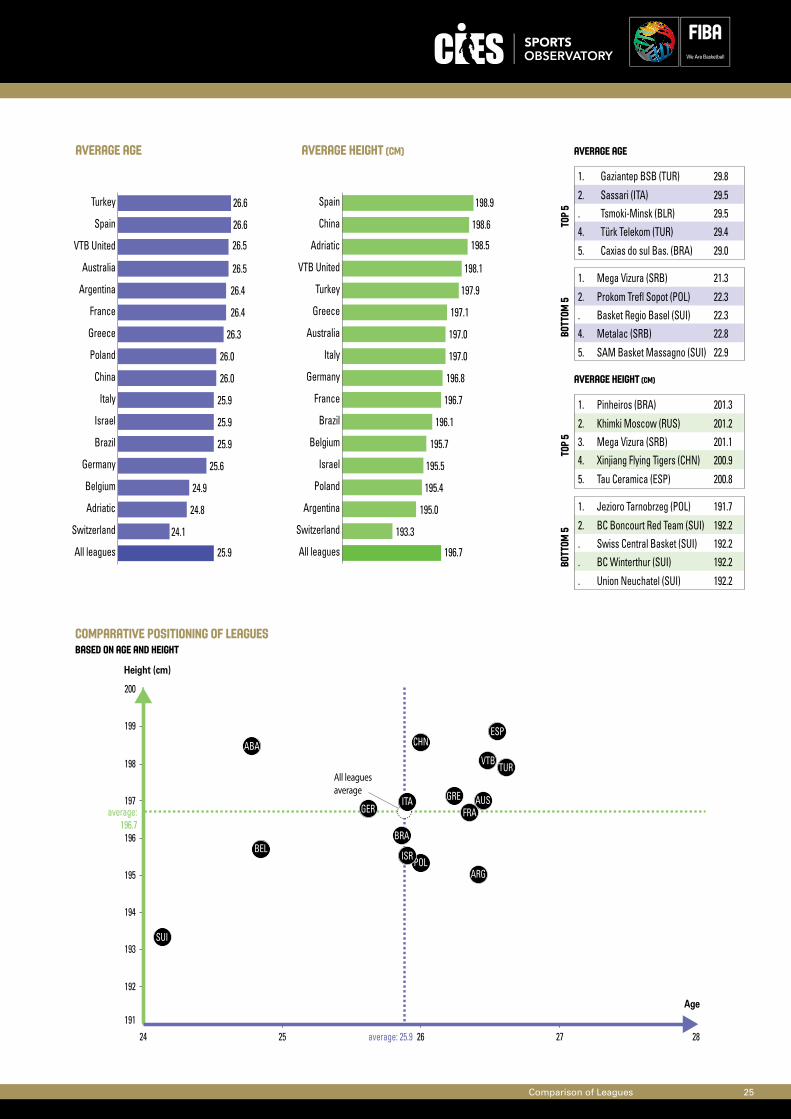
AVerage age
Comparative positioning of leaguesBased on age and height
average height (cm) average age
average height (cm)
192
191
193
194
195
196
197
198
199
200
2524 26 27 28
All leagues average
Height (cm)
Age
average: 25.9
average:196.7
SUI
ESPABA
ARGPOL
BEL
AUS
CHN
ITA
TURVTB
BRA
FRAGERGRE
ISR
Top
5To
p 5
BOTT
OM 5
BOTT
OM 5
1. Jezioro Tarnobrzeg (POL) 191.7
2. BC Boncourt Red Team (SUI) 192.2. Swiss Central Basket (SUI) 192.2. BC Winterthur (SUI) 192.2
. Union Neuchatel (SUI) 192.2
1. Pinheiros (BRA) 201.3
2. Khimki Moscow (RUS) 201.23. Mega Vizura (SRB) 201.14. Xinjiang Flying Tigers (CHN) 200.9
5. Tau Ceramica (ESP) 200.8
1. Gaziantep BSB (TUR) 29.8
2. Sassari (ITA) 29.5. Tsmoki-Minsk (BLR) 29.54. Türk Telekom (TUR) 29.4
5. Caxias do sul Bas. (BRA) 29.0
1. Mega Vizura (SRB) 21.3
2. Prokom Trefl Sopot (POL) 22.3. Basket Regio Basel (SUI) 22.34. Metalac (SRB) 22.8
5. SAM Basket Massagno (SUI) 22.9
All leagues
Switzerland
Argentina
Poland
Israel
Belgium
Brazil
France
Germany
Italy
Australia
Greece
Turkey
VTB United
Adriatic
China
Spain
196.7
193.3
195.0
195.4
195.5
195.7
196.1
196.7
196.8
197.0
197.0
197.1
197.9
198.1
198.5
198.6
198.9
All leagues
Switzerland
Adriatic
Belgium
Germany
Brazil
Israel
Italy
China
Poland
Greece
France
Argentina
Australia
VTB United
Spain
Turkey
25.9
24.1
24.8
24.9
25.6
25.9
25.9
25.9
26.0
26.0
26.3
26.4
26.4
26.5
26.5
26.6
26.6
26 International Basketball Migration Report 2016
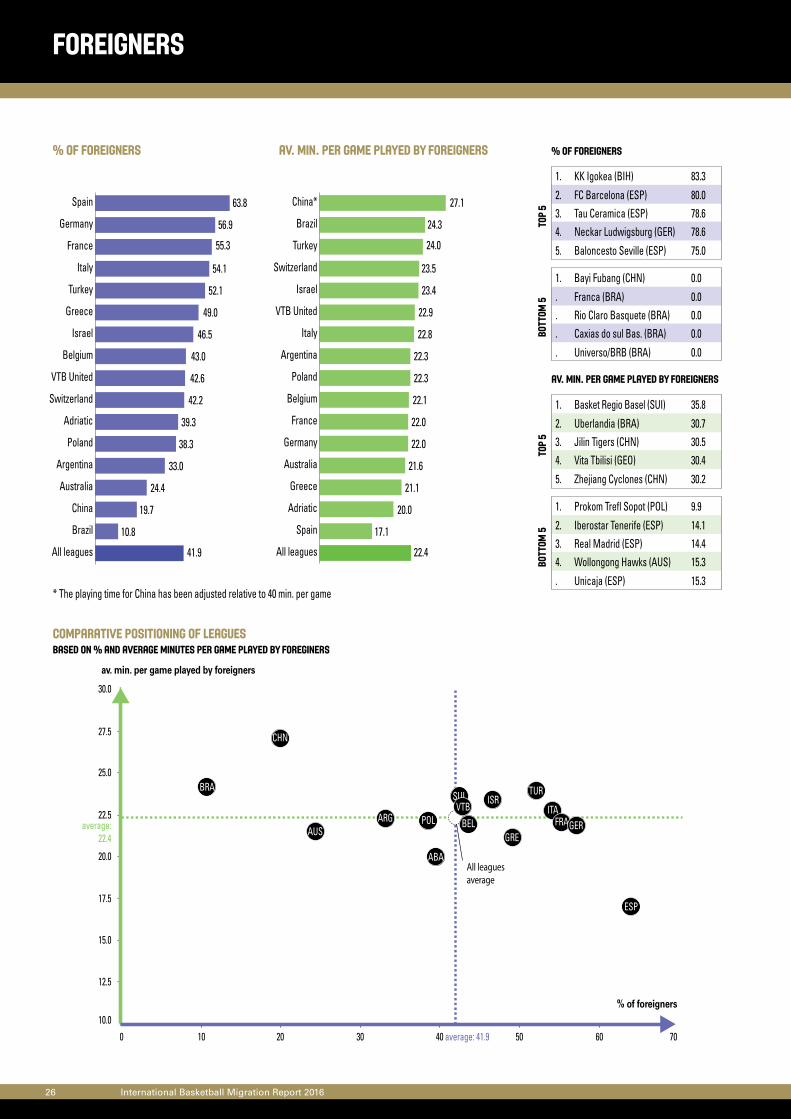
FOREIGNERS
% of Foreigners AV. MIN. per GAME PLAYED BY FOREIGNERs % of foreiGNERs
AV. MIN. per GAME PLAYED BY FOREIGNERs
12.5
10.0
15.0
17.5
20.0
22.5
25.0
27.5
30.0
20100 30 40 50 60 70
All leagues average
av. min. per game played by foreigners
% of foreigners
average: 41.9
average:22.4
SUI
ESP
ABA
ARG POL BELAUS
CHN
ITA
TURVTB
BRA
FRAGERGRE
ISR
Top
5To
p 5
BOTT
OM 5
BOTT
OM 5
1. Prokom Trefl Sopot (POL) 9.9
2. Iberostar Tenerife (ESP) 14.13. Real Madrid (ESP) 14.44. Wollongong Hawks (AUS) 15.3
. Unicaja (ESP) 15.3
1. Basket Regio Basel (SUI) 35.8
2. Uberlandia (BRA) 30.73. Jilin Tigers (CHN) 30.54. Vita Tbilisi (GEO) 30.4
5. Zhejiang Cyclones (CHN) 30.2
1. KK Igokea (BIH) 83.3
2. FC Barcelona (ESP) 80.03. Tau Ceramica (ESP) 78.64. Neckar Ludwigsburg (GER) 78.6
5. Baloncesto Seville (ESP) 75.0
1. Bayi Fubang (CHN) 0.0
. Franca (BRA) 0.0
. Rio Claro Basquete (BRA) 0.0
. Caxias do sul Bas. (BRA) 0.0
. Universo/BRB (BRA) 0.0
All leagues
Spain
Adriatic
Greece
Australia
Germany
France
Belgium
Poland
Argentina
Italy
VTB United
Israel
Switzerland
Turkey
Brazil
China*
22.4
17.1
20.0
21.1
21.6
22.0
22.0
22.1
22.3
22.3
22.8
22.9
23.4
23.5
24.0
24.3
27.1
All leagues
Brazil
China
Australia
Argentina
Poland
Adriatic
Switzerland
VTB United
Belgium
Israel
Greece
Turkey
Italy
France
Germany
Spain
41.9
10.8
19.7
24.4
33.0
38.3
39.3
42.2
42.6
43.0
46.5
49.0
52.1
54.1
55.3
56.9
63.8
* The playing time for China has been adjusted relative to 40 min. per game
Comparative positioning of leaguesBased on % and average MINutes per game played by foreginers
Comparison of Leagues 27
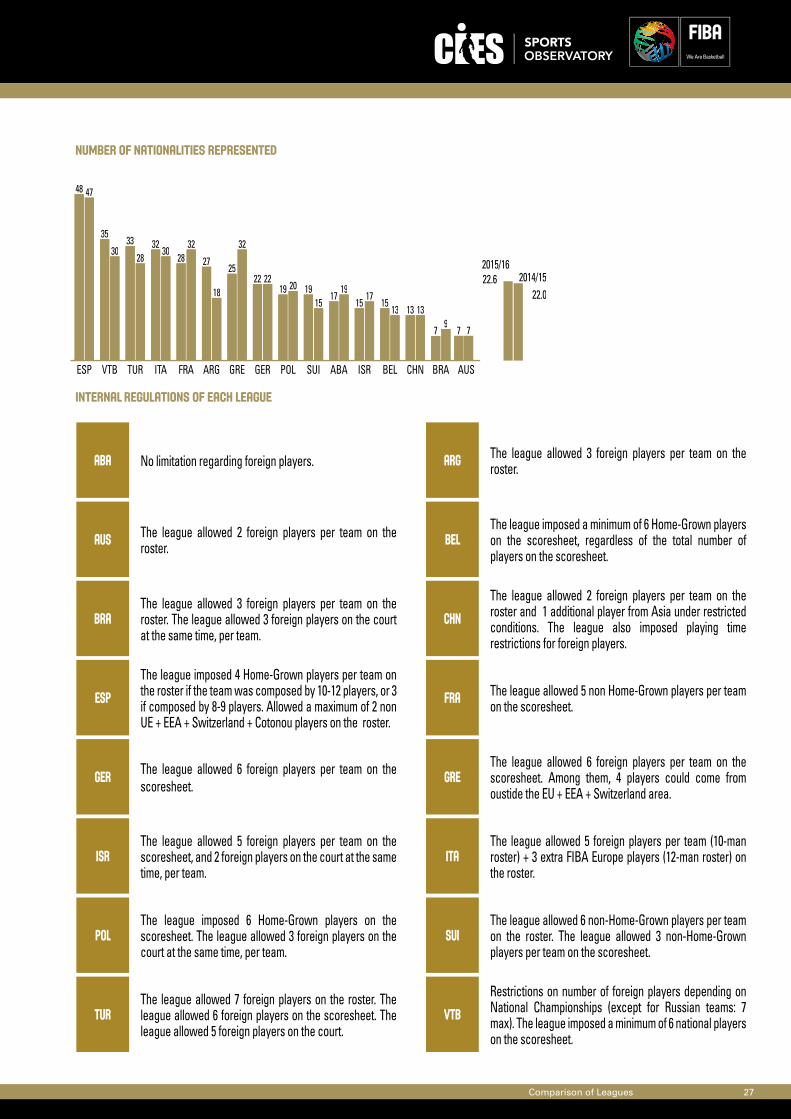
Number of nationalities represented
47
3028
3032
18
32
2220
1519
1713 13
97
48
3533 32
28 2725
2219 19
1715 15
13
7 7
AUSBRACHNBELISRABASUIPOLGERGREARGFRAITATURVTBESP
2014/152015/16
22.022.6
INTERNAL REGULATIONS OF EACH LEAGUE
ABA No limitation regarding foreign players. ARG The league allowed 3 foreign players per team on the roster.
BRAThe league allowed 3 foreign players per team on the roster. The league allowed 3 foreign players on the court at the same time, per team.
CHN
The league allowed 2 foreign players per team on the roster and 1 additional player from Asia under restricted conditions. The league also imposed playing time restrictions for foreign players.
AUS The league allowed 2 foreign players per team on the roster. BEL
The league imposed a minimum of 6 Home-Grown players on the scoresheet, regardless of the total number of players on the scoresheet.
ESP
The league imposed 4 Home-Grown players per team on the roster if the team was composed by 10-12 players, or 3 if composed by 8-9 players. Allowed a maximum of 2 non UE + EEA + Switzerland + Cotonou players on the roster.
FRA The league allowed 5 non Home-Grown players per team on the scoresheet.
GER The league allowed 6 foreign players per team on the scoresheet.
GREThe league allowed 6 foreign players per team on the scoresheet. Among them, 4 players could come from oustide the EU + EEA + Switzerland area.
ISRThe league allowed 5 foreign players per team on the scoresheet, and 2 foreign players on the court at the same time, per team.
ITAThe league allowed 5 foreign players per team (10-man roster) + 3 extra FIBA Europe players (12-man roster) on the roster.
POLThe league imposed 6 Home-Grown players on the scoresheet. The league allowed 3 foreign players on the court at the same time, per team.
SUIThe league allowed 6 non-Home-Grown players per team on the roster. The league allowed 3 non-Home-Grown players per team on the scoresheet.
TURThe league allowed 7 foreign players on the roster. The league allowed 6 foreign players on the scoresheet. The league allowed 5 foreign players on the court.
VTB
Restrictions on number of foreign players depending on National Championships (except for Russian teams: 7 max). The league imposed a minimum of 6 national players on the scoresheet.
28 International Basketball Migration Report 2016
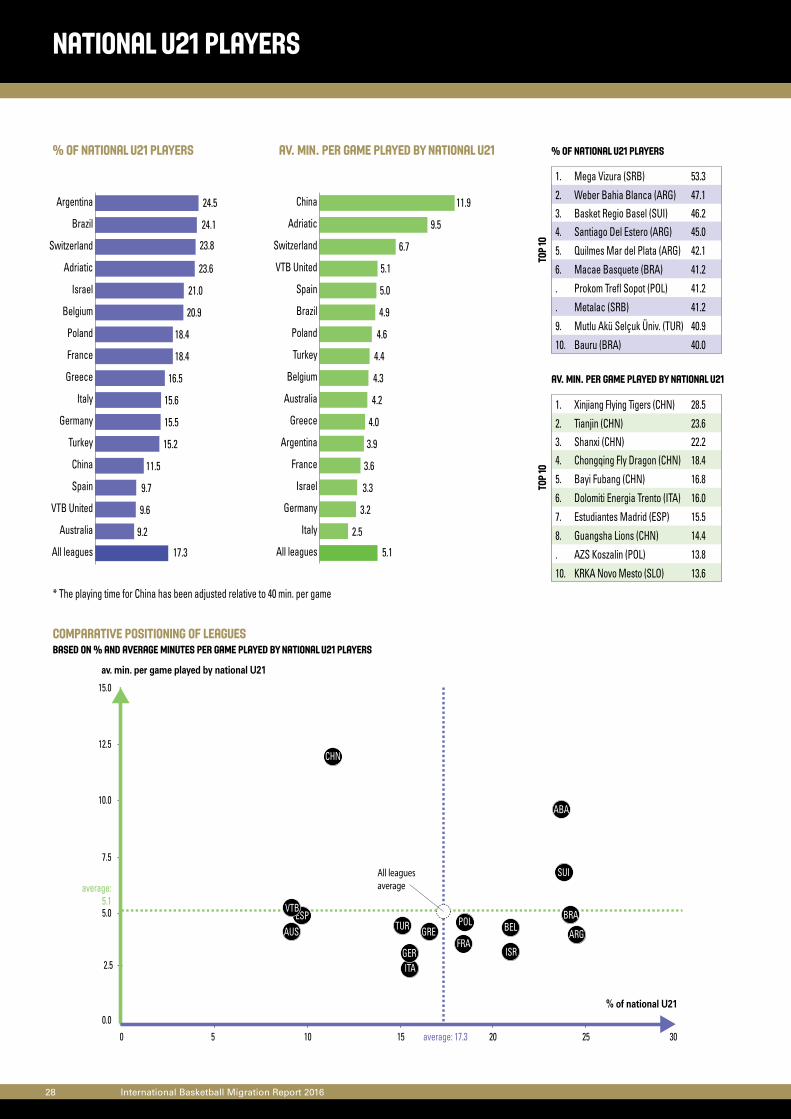
national U21 players
% of national U21 players AV. MIN. per GAME PLAYED BY national U21 % of national U21 players
AV. MIN. per GAME PLAYED BY national U21
2.5
0.0
7.5
12.5
5.0
10.0
15.0
5 10 15 20 250 30
All leagues average
average: 17.3
average:5.1
av. min. per game played by national U21
% of national U21
SUI
ESP
ABA
ARGPOL BELAUS
CHN
ITA
TUR
VTBBRA
FRAGER
GRE
ISR
Top
10To
p 10
1. Xinjiang Flying Tigers (CHN) 28.5
2. Tianjin (CHN) 23.63. Shanxi (CHN) 22.24. Chongqing Fly Dragon (CHN) 18.4
5. Bayi Fubang (CHN) 16.8
6. Dolomiti Energia Trento (ITA) 16.0
7. Estudiantes Madrid (ESP) 15.5
8. Guangsha Lions (CHN) 14.4
. AZS Koszalin (POL) 13.8
10. KRKA Novo Mesto (SLO) 13.6
1. Mega Vizura (SRB) 53.3
2. Weber Bahia Blanca (ARG) 47.13. Basket Regio Basel (SUI) 46.24. Santiago Del Estero (ARG) 45.0
5. Quilmes Mar del Plata (ARG) 42.1
6. Macae Basquete (BRA) 41.2
. Prokom Trefl Sopot (POL) 41.2
. Metalac (SRB) 41.2
9. Mutlu Akü Selçuk Üniv. (TUR) 40.9
10. Bauru (BRA) 40.0
All leagues
Italy
Germany
Israel
France
Argentina
Greece
Australia
Belgium
Turkey
Poland
Brazil
Spain
VTB United
Switzerland
Adriatic
China
5.1
2.5
3.2
3.3
3.6
3.9
4.0
4.2
4.3
4.4
4.6
4.9
5.0
5.1
6.7
9.5
11.9
All leagues
Australia
VTB United
Spain
China
Turkey
Germany
Italy
Greece
France
Poland
Belgium
Israel
Adriatic
Switzerland
Brazil
Argentina
17.3
9.2
9.6
9.7
11.5
15.2
15.5
15.6
16.5
18.4
18.4
20.9
21.0
23.6
23.8
24.1
24.5
* The playing time for China has been adjusted relative to 40 min. per game
Comparative positioning of leaguesBased on % and average MINutes per game played by national U21 players
Comparison of Leagues 29
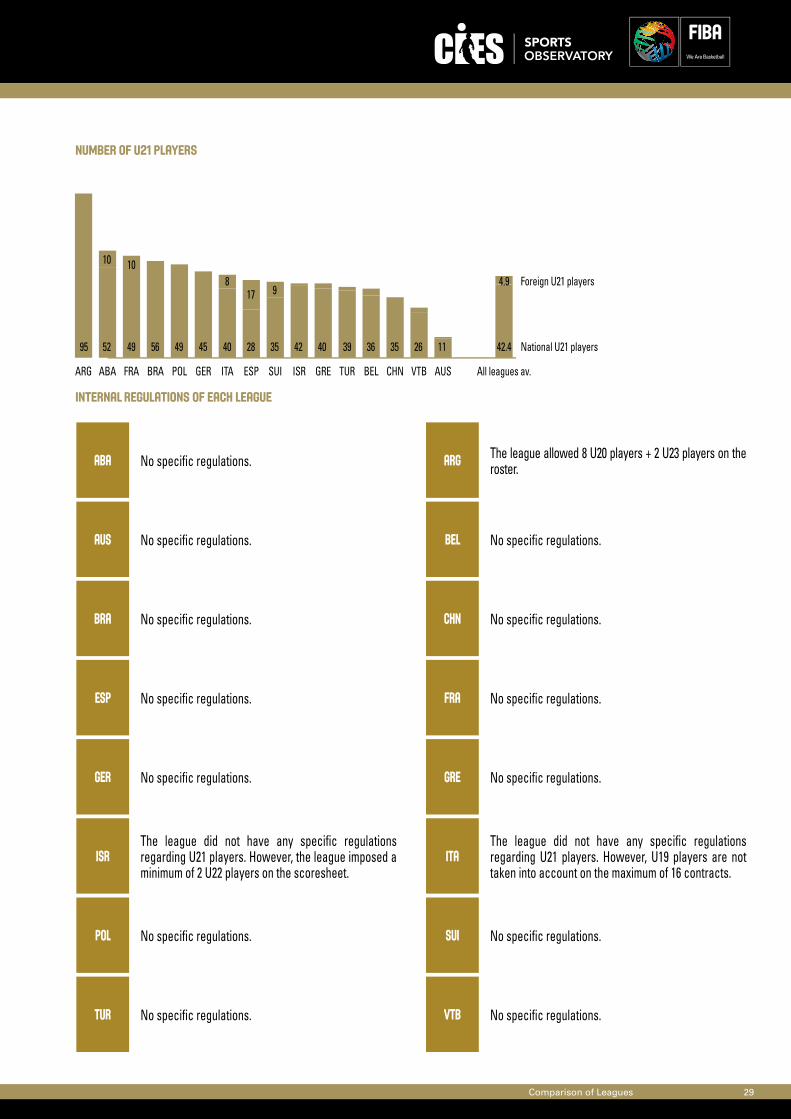
Number of U21 players
All leagues av.AUSVTBCHNBELTURGREISRSUIESPITAGERPOLBRAFRAABAARG
95 56 49 45
8
40
17
28
9
35 42 40 39 36 35 26 11
4.9 Foreign U21 players
National U21 players42.4
10
52
10
49
INTERNAL REGULATIONS OF EACH LEAGUE
ABA No specific regulations. ARG The league allowed 8 U20 players + 2 U23 players on the roster.
BRA No specific regulations. CHN No specific regulations.
AUS No specific regulations. BEL No specific regulations.
ESP No specific regulations. FRA No specific regulations.
GER No specific regulations. GRE No specific regulations.
ISRThe league did not have any specific regulations regarding U21 players. However, the league imposed a minimum of 2 U22 players on the scoresheet.
ITAThe league did not have any specific regulations regarding U21 players. However, U19 players are not taken into account on the maximum of 16 contracts.
POL No specific regulations. SUI No specific regulations.
TUR No specific regulations. VTB No specific regulations.
30 International Basketball Migration Report 2016
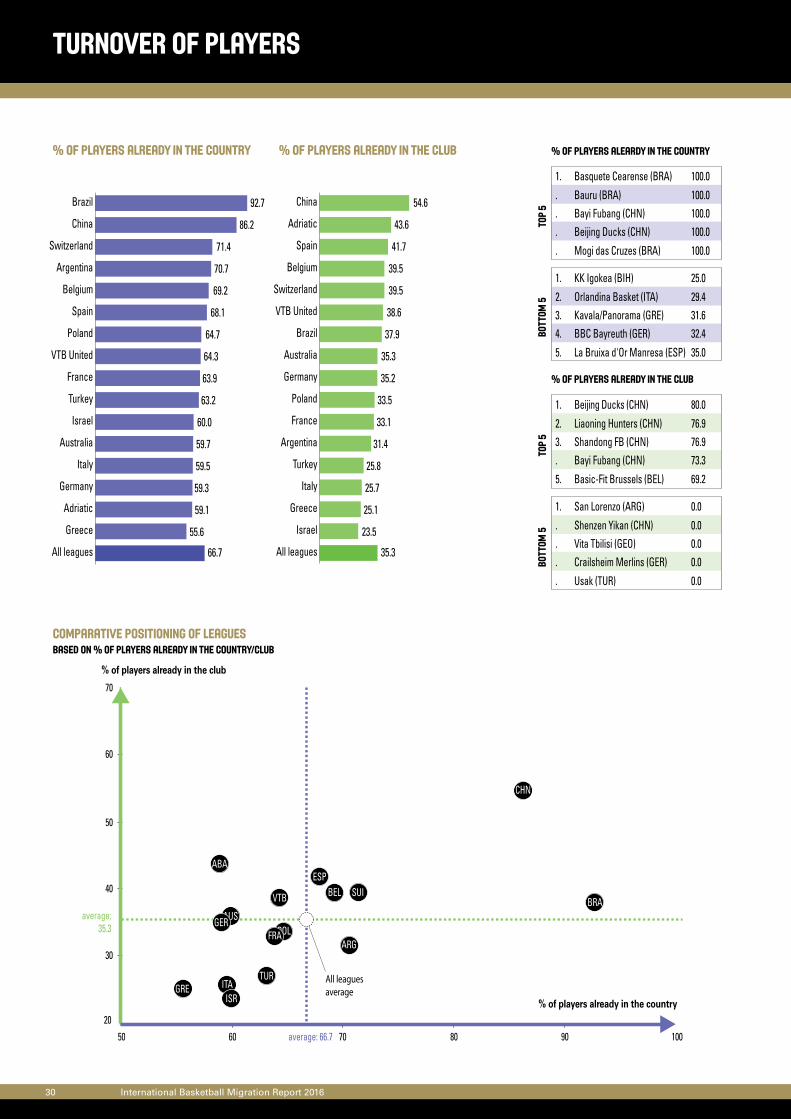
turnover of players
% of players already in the country % of players already in the club
30
20
40
50
60
70
60 70 80 90 10050
All leagues average
average: 66.7
average:35.3
% of players already in the club
% of players already in the country
SUIESP
ABA
ARGPOL
BEL
AUS
CHN
ITATUR
VTB BRA
FRAGER
GREISR
All leagues
Israel
Greece
Italy
Turkey
Argentina
France
Poland
Germany
Australia
Brazil
VTB United
Switzerland
Belgium
Spain
Adriatic
China
35.3
23.5
25.1
25.7
25.8
31.4
33.1
33.5
35.2
35.3
37.9
38.6
39.5
39.5
41.7
43.6
54.6
All leagues
Greece
Adriatic
Germany
Italy
Australia
Israel
Turkey
France
VTB United
Poland
Spain
Belgium
Argentina
Switzerland
China
Brazil
66.7
55.6
59.1
59.3
59.5
59.7
60.0
63.2
63.9
64.3
64.7
68.1
69.2
70.7
71.4
86.2
92.7
% of players aleardy in the country
% of players already in the club
Top
5To
p 5
BOTT
OM 5
BOTT
OM 5
1. San Lorenzo (ARG) 0.0
. Shenzen Yikan (CHN) 0.0
. Vita Tbilisi (GEO) 0.0
. Crailsheim Merlins (GER) 0.0
. Usak (TUR) 0.0
1. Beijing Ducks (CHN) 80.0
2. Liaoning Hunters (CHN) 76.93. Shandong FB (CHN) 76.9. Bayi Fubang (CHN) 73.3
5. Basic-Fit Brussels (BEL) 69.2
1. Basquete Cearense (BRA) 100.0
. Bauru (BRA) 100.0
. Bayi Fubang (CHN) 100.0
. Beijing Ducks (CHN) 100.0
. Mogi das Cruzes (BRA) 100.0
1. KK Igokea (BIH) 25.0
2. Orlandina Basket (ITA) 29.43. Kavala/Panorama (GRE) 31.64. BBC Bayreuth (GER) 32.4
5. La Bruixa d'Or Manresa (ESP) 35.0
Comparative positioning of leaguesBased on % of players already in the country/club
Comparison of Leagues 31
% of foreigners already in the country % of foreigners already in the club
10
0
20
30
40
20 30 40 50 60 7010
All leagues average
average: 32.5
average:17.0
% of foreigners already in the club
% of foreigners already in the country
SUI
ESP
ABA
ARGPOL
BEL
AUS
CHN ITA
TUR
VTB
BRA
FRA
GER
GRE
ISR
All leagues
Argentina
Greece
Poland
Australia
China
Italy
Switzerland
Israel
France
Turkey
Adriatic
Germany
VTB United
Belgium
Brazil
Spain
17.0
7.0
8.4
8.8
10.3
13.3
13.7
14.5
16.1
16.3
16.4
19.7
20.0
21.6
21.6
32.0
33.0
All leagues
Australia
Poland
Greece
Adriatic
Argentina
VTB United
Israel
China
Turkey
Italy
Germany
Belgium
Switzerland
France
Spain
Brazil
32.5
13.8
17.6
23.5
23.7
25.8
27.6
29.0
30.0
34.3
34.5
34.5
36.5
37.1
40.8
51.4
60.0
AV. Min. per game played by Foreigners already in the country
All leagues
Spain
Adriatic
Switzerland
Greece
France
Belgium
Poland
Germany
VTB United
Italy
Turkey
Israel
Argentina
Brazil
Australia
China
22.4
17.4
17.4
18.2
21.3
21.8
22.0
22.3
22.4
22.9
23.0
23.1
23.2
25.1
25.6
25.9
26.9
Comparative positioning of leaguesBased on % of foreigners already in the country/club
* The playing time for China has been adjusted relative to 40 min. per game
32 International Basketball Migration Report 2016
turnover of players
av. number of players signed during the seasoN per team
AV. number of players fielded per team
All leagues
Brazil
Switzerland
Belgium
China
France
Spain
Turkey
Argentina
Germany
Poland
Australia
Italy
VTB United
Israel
Adriatic
Greece
1.6
0.3
0.5
0.7
0.8
1.0
1.3
1.3
1.4
1.4
1.7
1.8
2.2
2.3
2.3
2.9
3.0
All leagues
France
Switzerland
Australia
China
Poland
Brazil
Italy
Adriatic
Belgium
Turkey
Germany
Israel
Spain
VTB United
Greece
Argentina
15.8
14.6
14.7
14.9
15.2
15.4
15.4
15.5
15.6
15.6
15.8
15.9
16.0
16.0
16.6
17.2
19.1
players fielded
1. Khimki Moscow (RUS) 8
2. AEK Athens (GRE) 6. KK Sutjeska (MNE) 64. KK Igokea (BIH) 5
. Konkarit Loimaa Bisons (FIN) 5
. Apollon Patras (GRE) 5
. Hapoel Holon (ISR) 5
. PMS Torino (ITA) 5
AZS Koszalin (POL) 5
1. Atenas Cordoba (ARG) 23
2. Estudiantes Concordia (ARG) 22. Libertad Sunchales (ARG) 22. Mutlu Akü Selçuk Üniv. (TUR) 22
4. Juventud Sionista (ARG) 21
. Penarol Mar de Plata (ARG) 21
. Regatas Corrientes (ARG) 21
. Apollon Patras (GRE) 21
. WKS Slask Wroclaw (POL) 21
. Avtodor Saratov (RUS) 21
Sao Jose (BRA) 21
players signed during the season
Top
Top
Comparative positioning of leaguesBased on AV. number of players fielded per team and aV. number of players signed during the season per team
average:1.6
average: 15.8
All leagues average
1
0
2
3
1210 14 16 18 20
av. number of players signed during the season per team
av. number of players fielded per team
SUI
ESPARG
ABA
POL
BEL
AUS
BRA
CHN
ITA
TUR
VTB
FRA
GER
GRE
ISR
Comparison of Leagues 33
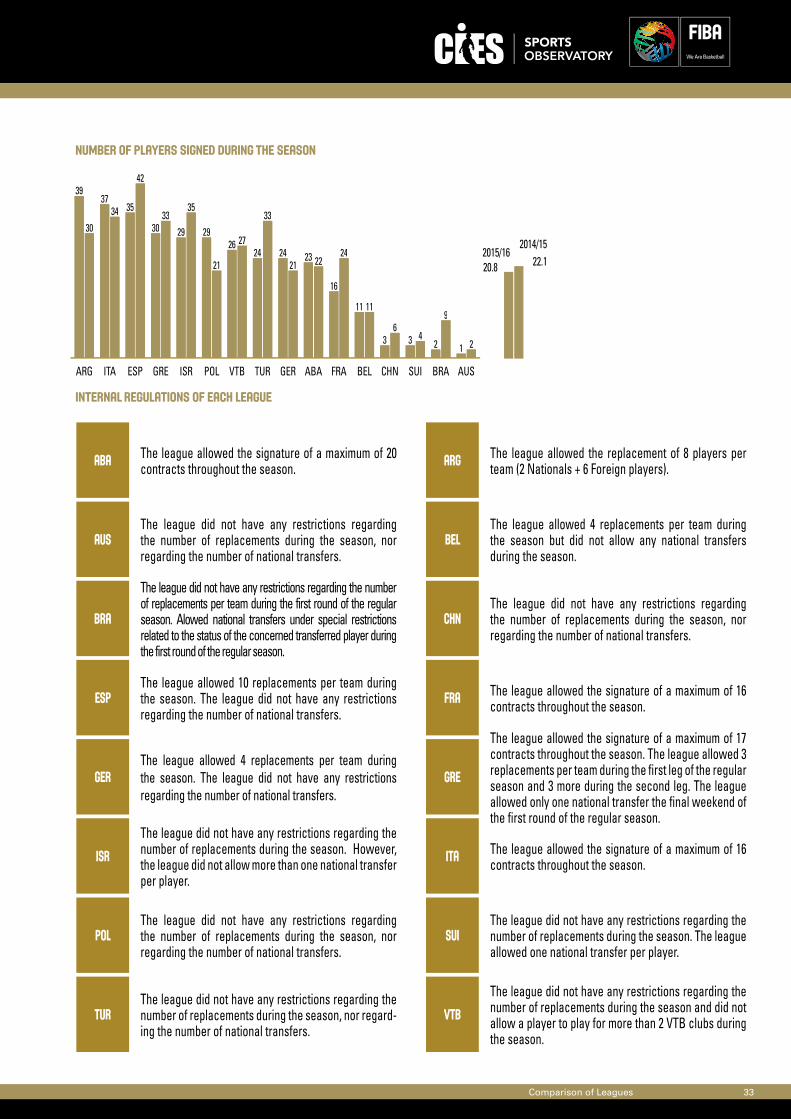
Number of players signed during the season
INTERNAL REGULATIONS OF EACH LEAGUE
30
34
42
3335
21
27
33
21 2224
11
64
9
2
3937
35
30 29 2926
24 24 23
16
11
3 3 2 1
AUSBRASUICHNBELFRAABAGERTURVTBPOLISRGREESPITAARG
2014/152015/16
22.120.8
ABA The league allowed the signature of a maximum of 20 contracts throughout the season. ARG The league allowed the replacement of 8 players per
team (2 Nationals + 6 Foreign players).
BRA
The league did not have any restrictions regarding the number of replacements per team during the first round of the regular season. Alowed national transfers under special restrictions related to the status of the concerned transferred player during the first round of the regular season.
CHNThe league did not have any restrictions regarding the number of replacements during the season, nor regarding the number of national transfers.
AUSThe league did not have any restrictions regarding the number of replacements during the season, nor regarding the number of national transfers.
BELThe league allowed 4 replacements per team during the season but did not allow any national transfers during the season.
ESPThe league allowed 10 replacements per team during the season. The league did not have any restrictions regarding the number of national transfers.
FRA The league allowed the signature of a maximum of 16 contracts throughout the season.
GERThe league allowed 4 replacements per team during the season. The league did not have any restrictions regarding the number of national transfers.
GRE
The league allowed the signature of a maximum of 17 contracts throughout the season. The league allowed 3 replacements per team during the first leg of the regular season and 3 more during the second leg. The league allowed only one national transfer the final weekend of the first round of the regular season.
ISR
The league did not have any restrictions regarding the number of replacements during the season. However, the league did not allow more than one national transfer per player.
ITA The league allowed the signature of a maximum of 16 contracts throughout the season.
POLThe league did not have any restrictions regarding the number of replacements during the season, nor regarding the number of national transfers.
SUIThe league did not have any restrictions regarding the number of replacements during the season. The league allowed one national transfer per player.
TURThe league did not have any restrictions regarding the number of replacements during the season, nor regard-ing the number of national transfers.
VTB
The league did not have any restrictions regarding the number of replacements during the season and did not allow a player to play for more than 2 VTB clubs during the season.


Domestic leagues2015/2016
League overview
NationalS vs Foreigners
36 International Basketball Migration Report 2016
Buducnost Pogdorica (MNE)
Cedevita Zagreb (CRO)
Cibona (CRO)
Crvena zvezda (SRB)
KK Igokea (BIH)
KK Sutjeska (MNE)
KK Zadar (CRO)
KRKA Novo Mesto (SLO)
Mega Vizura (SRB)
Metalac (SRB)
MZT Skopje (MKD)
Partizan NIS Belgrade (SRB)
Tajfun Sentjur (SLO)
Union Olimpija (SLO)
ADriatic league
Teams 2015-2016 League profile
League’s internal regulations
Nat.: national players ; F. (non US): foreign players (non US) ; F. (US): US players
Points per game
F. (US)
F. (non US)
Nat.
8.7
7.7
4.9
Average age
F. (US)
F. (non US)
Nat.
28.5
26.2
23.5
Minutes per game
F. (US)
F. (non US)
Nat.
21.3
19.6
14.5
Average height (cm)
F. (US)
F. (non US)
Nat.
195.4
199.8
198.2
Points per minute
F. (US)
F. (non US)
Nat.
0.40
0.37
0.29
foreign nationalities
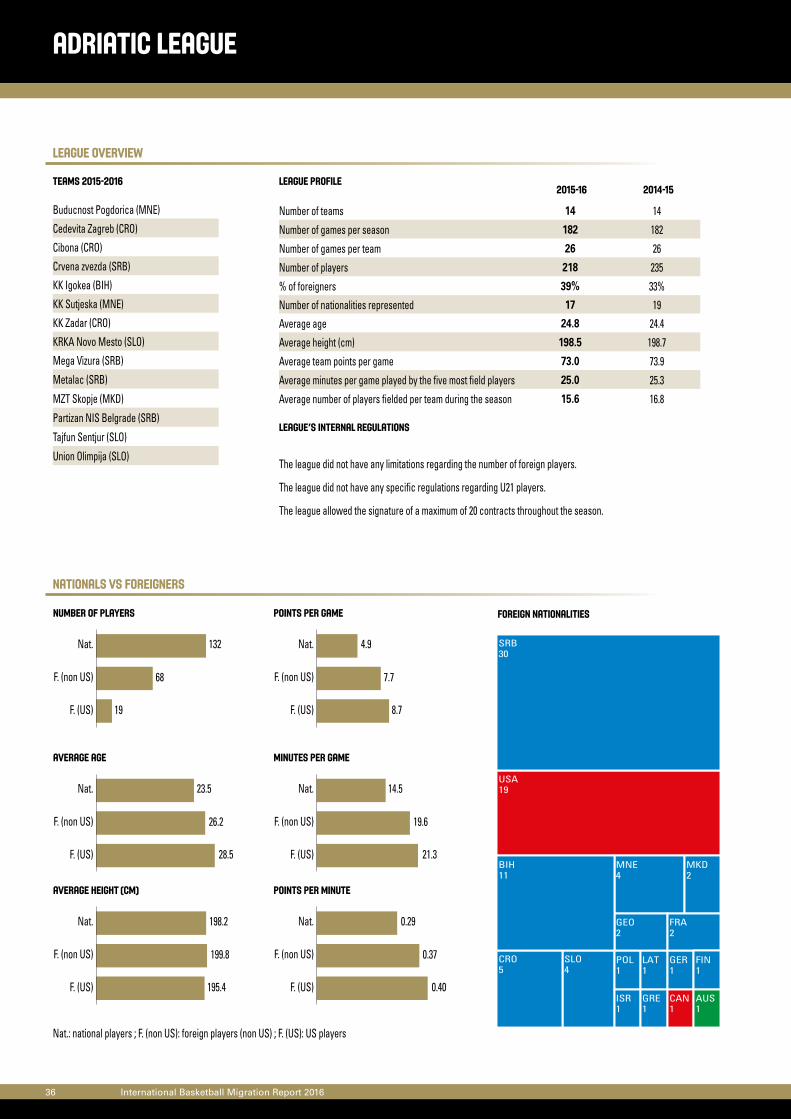
Number of teams 14 14
Number of games per season 182 182
Number of games per team 26 26
Number of players 218 235
% of foreigners 39% 33%
Number of nationalities represented 17 19
Average age 24.8 24.4
Average height (cm) 198.5 198.7
Average team points per game 73.0 73.9
Average minutes per game played by the five most field players 25.0 25.3
Average number of players fielded per team during the season 15.6 16.8
2015-16 2014-15
Number of players
F. (US)
F. (non US)
Nat.
19
68
132
The league did not have any limitations regarding the number of foreign players.
The league did not have any specific regulations regarding U21 players.
The league allowed the signature of a maximum of 20 contracts throughout the season.
USA19
SRB30
SLO4
POL1
MNE4
MKD2
LAT1
ISR1
GRE1
GER1
GEO2
FRA2
FIN1
CRO5
CAN1
BIH11
AUS1
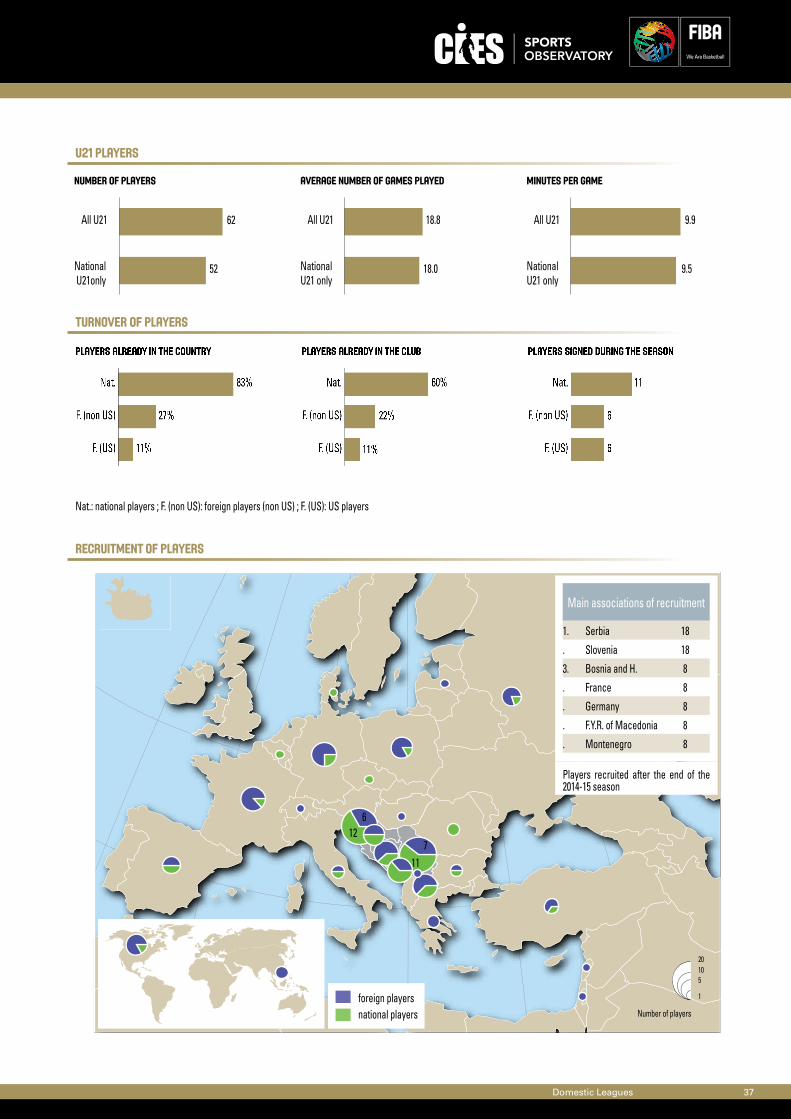
U21 players
Turnover of players
recruitment of players
Domestic Leagues 37
national playersforeign players
Number of players
20105
1
11
127
6
Nat.: national players ; F. (non US): foreign players (non US) ; F. (US): US players
Main associations of recruitment
1. Serbia 18
. Slovenia 18
3. Bosnia and H. 8
. France 8
. Germany 8
. F.Y.R. of Macedonia 8
. Montenegro 8
Number of players
NationalU21only
All U21 62
52
Average number of games played
NationalU21 only
All U21 18.8
18.0
Minutes per game
NationalU21 only
All U21 9.9
9.5
Players signed during the season
F. (US)
F. (non US)
Nat.
6
6
11
Players already in the country
F. (US)
F. (non US)
Nat.
11%
27%
83%
Players already in the club
F. (US)
F. (non US)
Nat.
11%
22%
60%
Players recruited after the end of the 2014-15 season
League overview
NationalS vs Foreigners
38 International Basketball Migration Report 2016
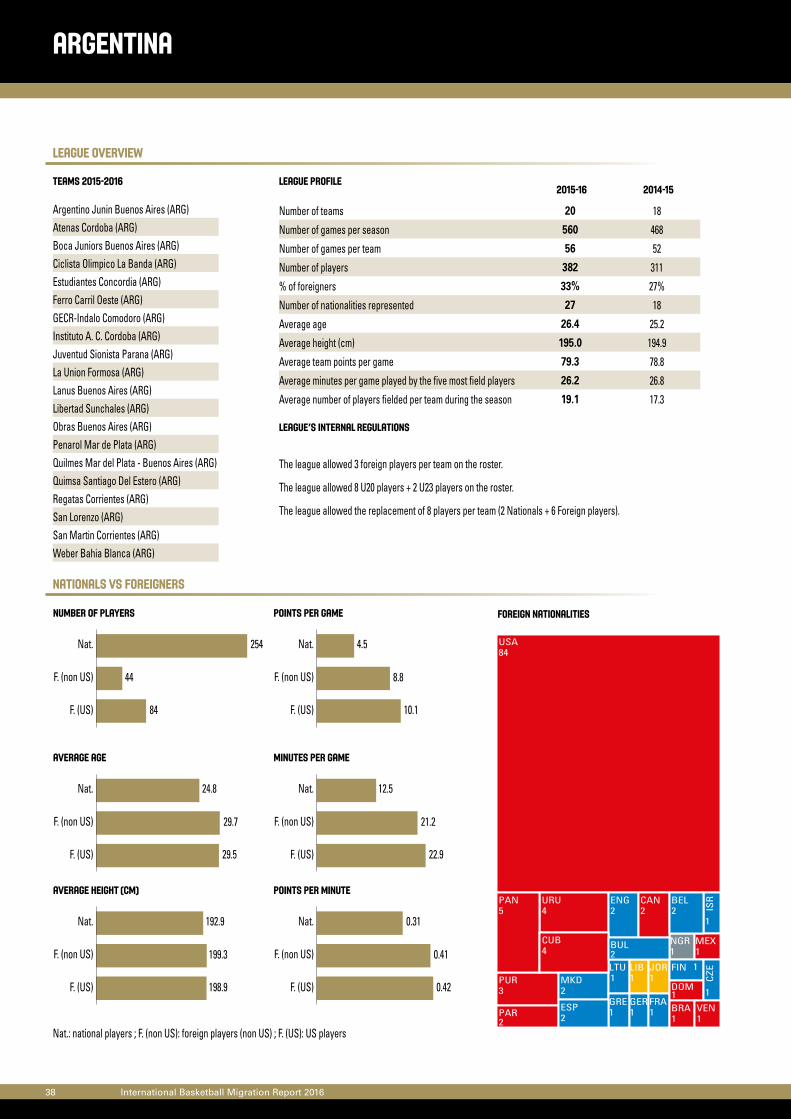
Argentino Junin Buenos Aires (ARG)Atenas Cordoba (ARG)Boca Juniors Buenos Aires (ARG)Ciclista Olimpico La Banda (ARG)Estudiantes Concordia (ARG)Ferro Carril Oeste (ARG)GECR-Indalo Comodoro (ARG)Instituto A. C. Cordoba (ARG)Juventud Sionista Parana (ARG)La Union Formosa (ARG)Lanus Buenos Aires (ARG)Libertad Sunchales (ARG)Obras Buenos Aires (ARG)Penarol Mar de Plata (ARG)Quilmes Mar del Plata - Buenos Aires (ARG)Quimsa Santiago Del Estero (ARG)Regatas Corrientes (ARG)San Lorenzo (ARG)San Martin Corrientes (ARG)Weber Bahia Blanca (ARG)
ARGENTINA
Teams 2015-2016 League profile
League’s internal regulations
Nat.: national players ; F. (non US): foreign players (non US) ; F. (US): US players
Points per game
F. (US)
F. (non US)
Nat.
10.1
8.8
4.5
Average age
F. (US)
F. (non US)
Nat.
29.5
29.7
24.8
Minutes per game
F. (US)
F. (non US)
Nat.
22.9
21.2
12.5
Average height (cm)
F. (US)
F. (non US)
Nat.
198.9
199.3
192.9
Points per minute
F. (US)
F. (non US)
Nat.
0.42
0.41
0.31
Number of teams 20 18
Number of games per season 560 468
Number of games per team 56 52
Number of players 382 311
% of foreigners 33% 27%
Number of nationalities represented 27 18
Average age 26.4 25.2
Average height (cm) 195.0 194.9
Average team points per game 79.3 78.8
Average minutes per game played by the five most field players 26.2 26.8
Average number of players fielded per team during the season 19.1 17.3
2015-16 2014-15
Number of players
F. (US)
F. (non US)
Nat.
84
44
254
The league allowed 3 foreign players per team on the roster.
The league allowed 8 U20 players + 2 U23 players on the roster.
The league allowed the replacement of 8 players per team (2 Nationals + 6 Foreign players).
foreign nationalities
USA84
URU4 IS
R
1
PUR3
PAR2
PAN5
NGR1
MKD2
MEX1
LTU1
LIB1
JOR1
GRE1
GER1
FRA1
FIN 1
ESP2
ENG2
DOM1
CZE
1
CUB4
CAN2
BUL2
BRA1
BEL2
VEN1
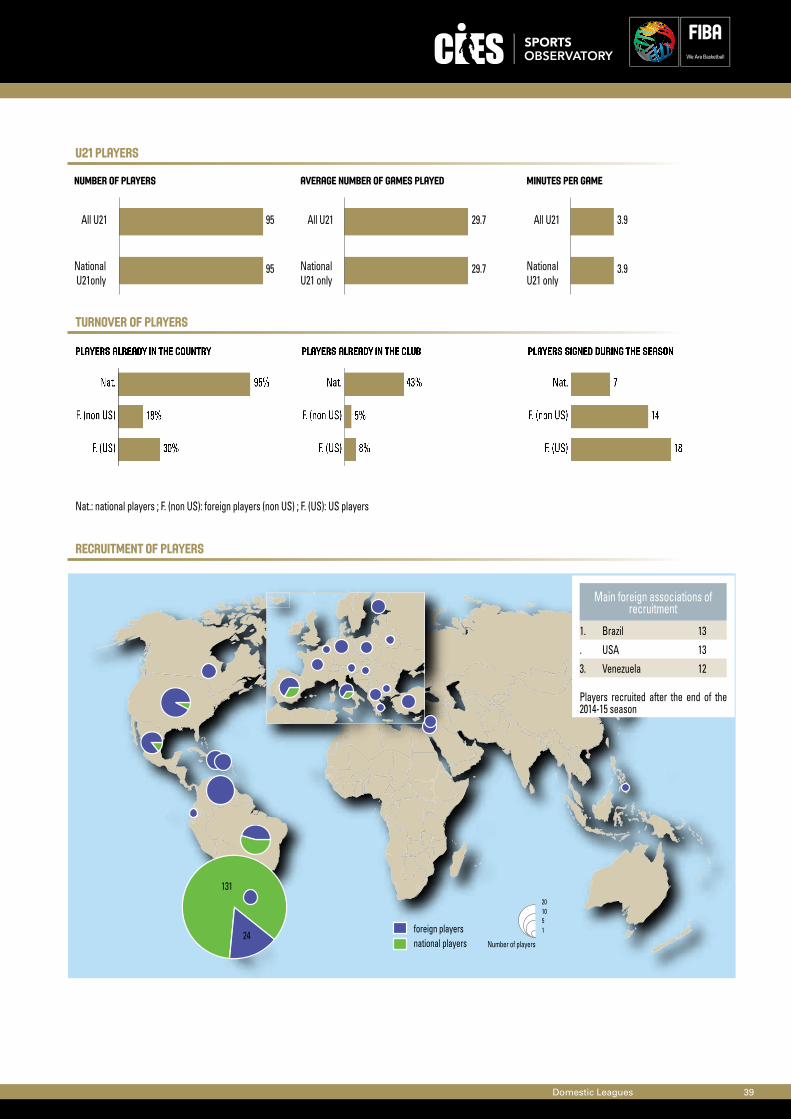
U21 players
Turnover of players
recruitment of players
Domestic Leagues 39
Number of players
201051
national playersforeign players
131
24
Nat.: national players ; F. (non US): foreign players (non US) ; F. (US): US players
Number of players
NationalU21only
All U21 95
95
Average number of games played
NationalU21 only
All U21 29.7
29.7
Minutes per game
NationalU21 only
All U21 3.9
3.9
Players signed during the season
F. (US)
F. (non US)
Nat.
18
14
7
Players already in the country
F. (US)
F. (non US)
Nat.
30%
18%
95%
Players already in the club
F. (US)
F. (non US)
Nat.
8%
5%
43%
Main foreign associations of recruitment
1. Brazil 13
. USA 13
3. Venezuela 12
Players recruited after the end of the 2014-15 season
League overview
NationalS vs Foreigners
40 International Basketball Migration Report 2016
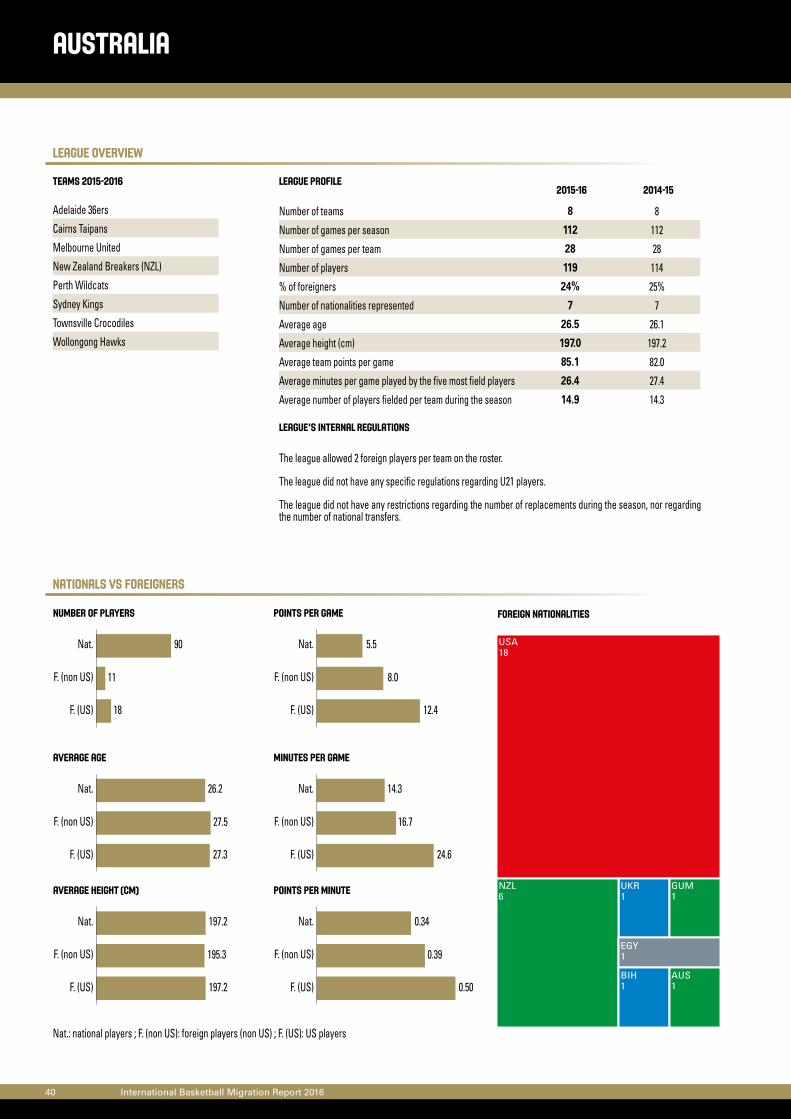
Adelaide 36ers
Cairns Taipans
Melbourne United
New Zealand Breakers (NZL)
Perth Wildcats
Sydney Kings
Townsville Crocodiles
Wollongong Hawks
AUSTRALIA
Teams 2015-2016 League profile
League’s internal regulations
Nat.: national players ; F. (non US): foreign players (non US) ; F. (US): US players
Points per game
F. (US)
F. (non US)
Nat.
12.4
8.0
5.5
Average age
F. (US)
F. (non US)
Nat.
27.3
27.5
26.2
Minutes per game
F. (US)
F. (non US)
Nat.
24.6
16.7
14.3
Average height (cm)
F. (US)
F. (non US)
Nat.
197.2
195.3
197.2
Points per minute
F. (US)
F. (non US)
Nat.
0.50
0.39
0.34
foreign nationalities
Number of teams 8 8
Number of games per season 112 112
Number of games per team 28 28
Number of players 119 114
% of foreigners 24% 25%
Number of nationalities represented 7 7
Average age 26.5 26.1
Average height (cm) 197.0 197.2
Average team points per game 85.1 82.0
Average minutes per game played by the five most field players 26.4 27.4
Average number of players fielded per team during the season 14.9 14.3
2015-16 2014-15
Number of players
F. (US)
F. (non US)
Nat.
18
11
90
The league allowed 2 foreign players per team on the roster.
The league did not have any specific regulations regarding U21 players.
The league did not have any restrictions regarding the number of replacements during the season, nor regarding the number of national transfers.
USA18
UKR1
NZL6
GUM1
EGY1
BIH1
AUS1
U21 players
Turnover of players
recruitment of players
Domestic Leagues 41
Number of players
201051
national playersforeign players
22 1
126
Nat.: national players ; F. (non US): foreign players (non US) ; F. (US): US players
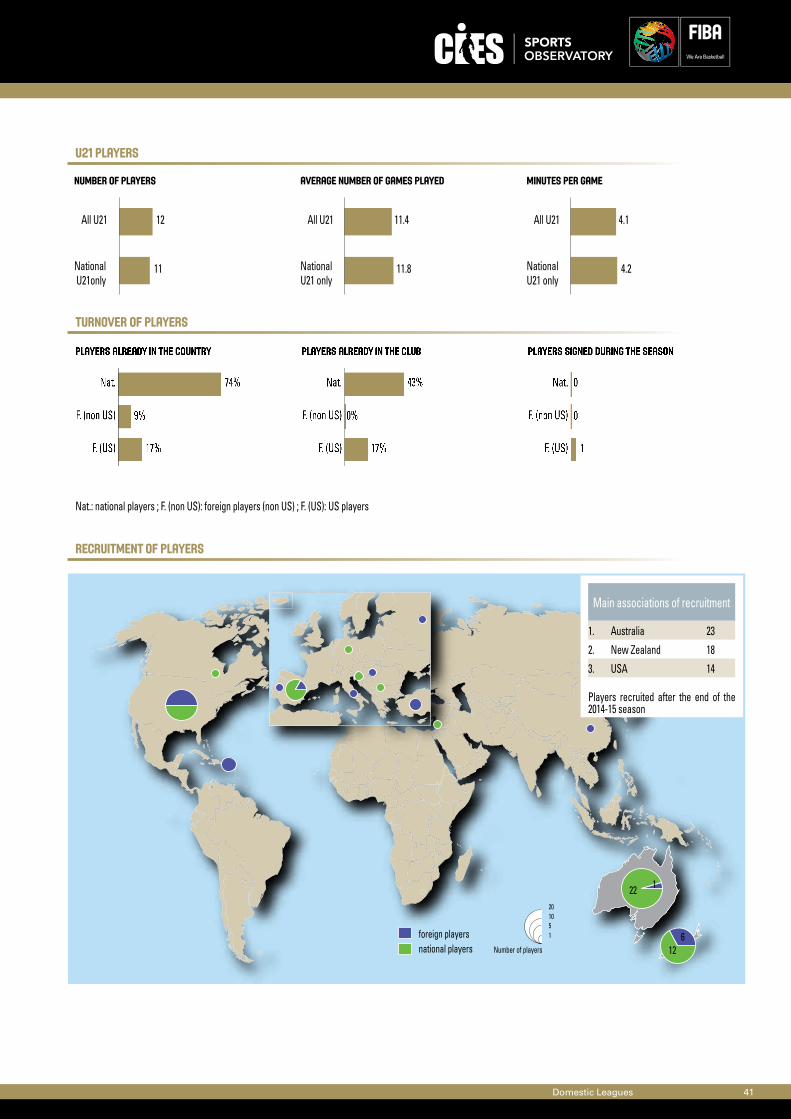
Number of players
NationalU21only
All U21 12
11
Average number of games played
NationalU21 only
All U21 11.4
11.8
Minutes per game
NationalU21 only
All U21 4.1
4.2
Players signed during the season
F. (US)
F. (non US)
Nat.
1
0
0
Players already in the country
F. (US)
F. (non US)
Nat.
17%
9%
74%
Players already in the club
F. (US)
F. (non US)
Nat.
17%
0%
43%
Main associations of recruitment
1. Australia 23
2. New Zealand 18
3. USA 14
Players recruited after the end of the 2014-15 season
League overview
NationalS vs Foreigners
42 International Basketball Migration Report 2016
Basic-Fit Brussels
Belgacom Liège Basket
Belgacom Spirou
Dexia Mons-Hainaut
Hubo Limburg United
Kangoeroes Basket Willebroek
Okapi Aalstar
Port Of Antwerp Giants
Stella Artois Leuven Bears
Telenet BC Oostende
VOO Wolves Verviers-Pepinster
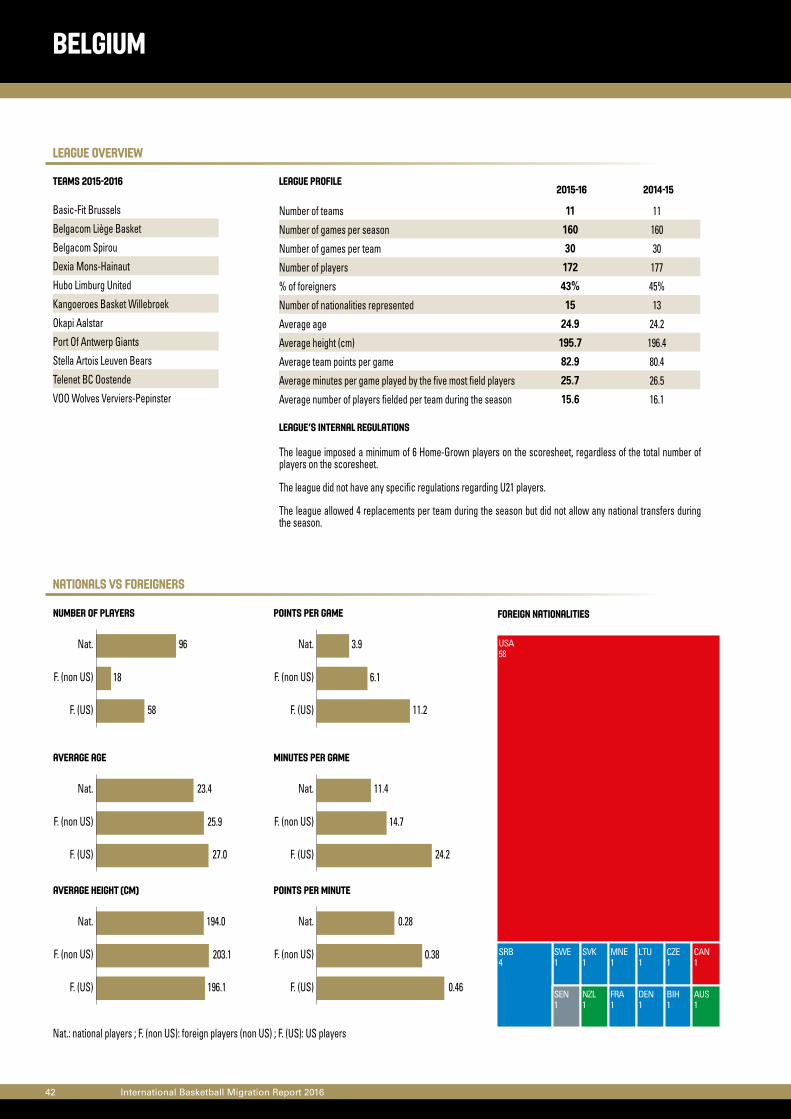
BELGIUM
Teams 2015-2016 League profile
League’s internal regulations
Nat.: national players ; F. (non US): foreign players (non US) ; F. (US): US players
Points per game
F. (US)
F. (non US)
Nat.
11.2
6.1
3.9
Average age
F. (US)
F. (non US)
Nat.
27.0
25.9
23.4
Minutes per game
F. (US)
F. (non US)
Nat.
24.2
14.7
11.4
Average height (cm)
F. (US)
F. (non US)
Nat.
196.1
203.1
194.0
Points per minute
F. (US)
F. (non US)
Nat.
0.46
0.38
0.28
Number of players
F. (US)
F. (non US)
Nat.
58
18
96
Number of teams 11 11
Number of games per season 160 160
Number of games per team 30 30
Number of players 172 177
% of foreigners 43% 45%
Number of nationalities represented 15 13
Average age 24.9 24.2
Average height (cm) 195.7 196.4
Average team points per game 82.9 80.4
Average minutes per game played by the five most field players 25.7 26.5
Average number of players fielded per team during the season 15.6 16.1
2015-16 2014-15
The league imposed a minimum of 6 Home-Grown players on the scoresheet, regardless of the total number of players on the scoresheet.
The league did not have any specific regulations regarding U21 players.
The league allowed 4 replacements per team during the season but did not allow any national transfers during the season.
foreign nationalities
USA58
SWE1
SVK1
SRB4
SEN1
NZL1
MNE1
LTU1
FRA1
DEN1
CZE1
CAN1
BIH1
AUS1
U21 players
Turnover of players
recruitment of players
Domestic Leagues 43
national playersforeign players
Number of players
201051
3911
Nat.: national players ; F. (non US): foreign players (non US) ; F. (US): US players
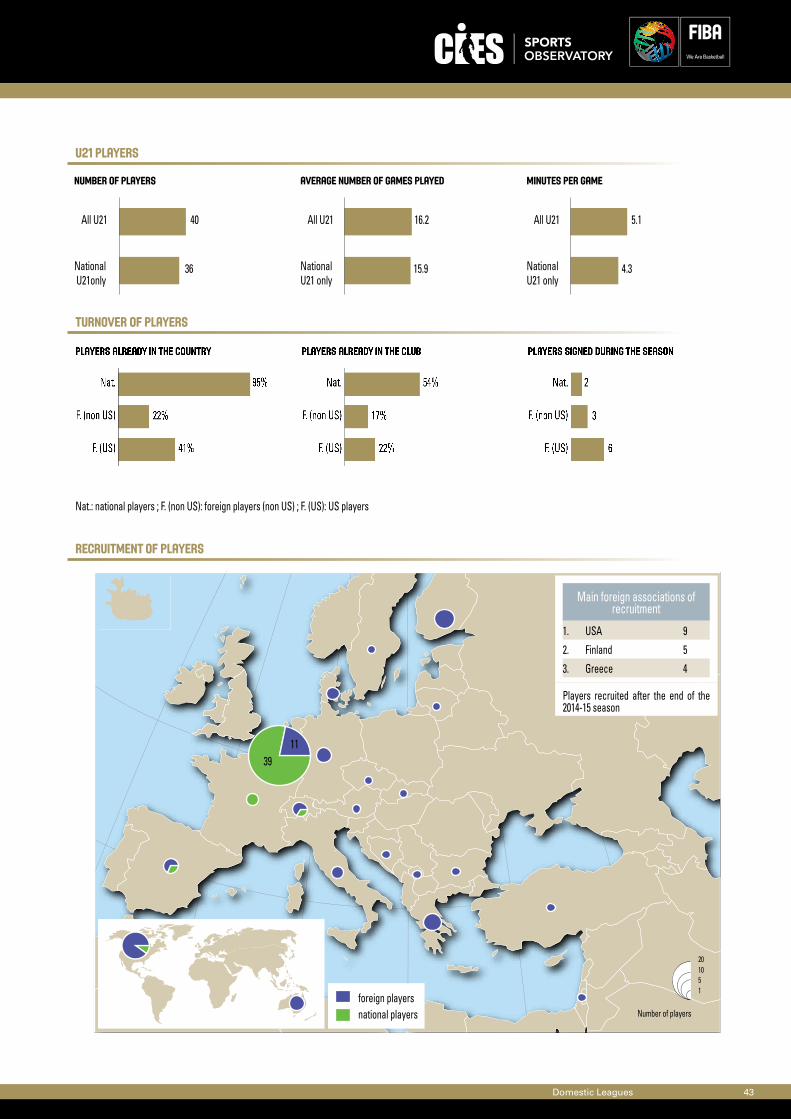
Main foreign associations of recruitment
1. USA 9
2. Finland 5
3. Greece 4
Number of players
NationalU21only
All U21 40
36
Average number of games played
NationalU21 only
All U21 16.2
15.9
Minutes per game
NationalU21 only
All U21 5.1
4.3
Players signed during the season
F. (US)
F. (non US)
Nat.
6
3
2
Players already in the country
F. (US)
F. (non US)
Nat.
41%
22%
95%
Players already in the club
F. (US)
F. (non US)
Nat.
22%
17%
54%
Players recruited after the end of the 2014-15 season
League overview
NationalS vs Foreigners
44 International Basketball Migration Report 2016
Basquete Cearense
Bauru
Caxias do sul Basquetetriches
Flamengo
Franca
Liga Sorocabana
Macae Basquete
Minas
Mogi das Cruzes
Paulistano
Pinheiros
Rio Claro Basquete
Sao Jose
Uberlandia
Universo/BRB
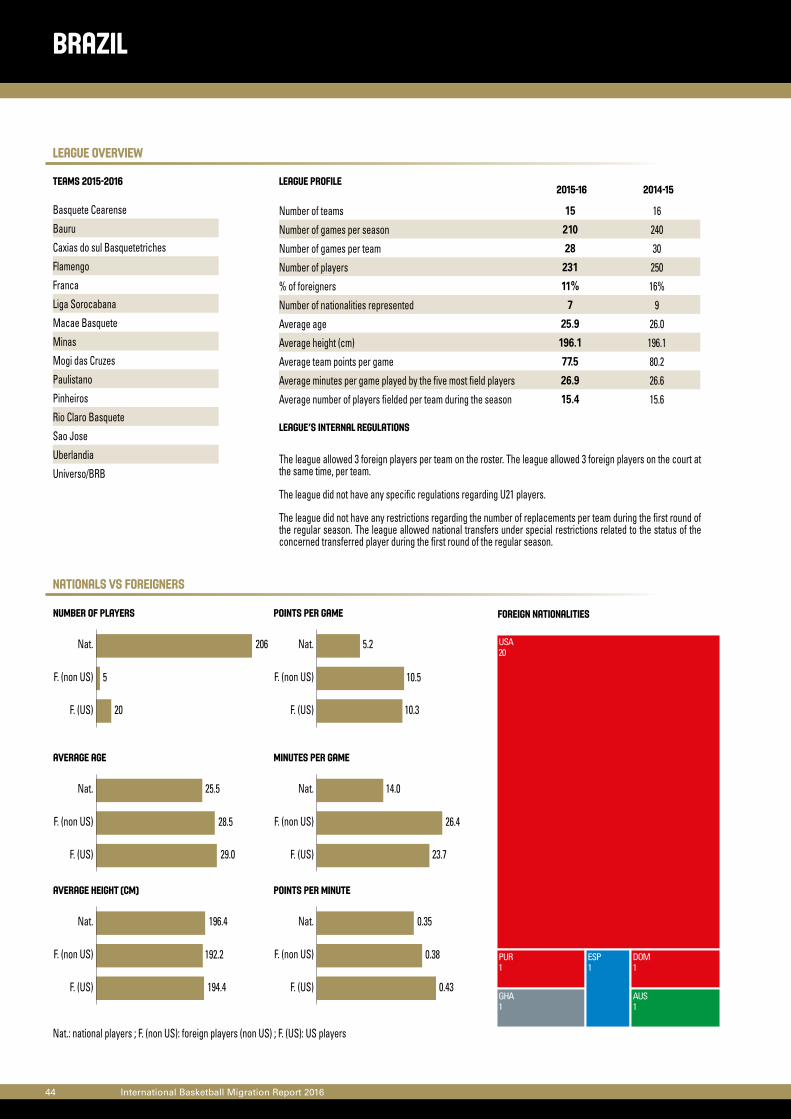
Brazil
Teams 2015-2016 League profile
League’s internal regulations
Nat.: national players ; F. (non US): foreign players (non US) ; F. (US): US players
Points per game
F. (US)
F. (non US)
Nat.
10.3
10.5
5.2
Average age
F. (US)
F. (non US)
Nat.
29.0
28.5
25.5
Minutes per game
F. (US)
F. (non US)
Nat.
23.7
26.4
14.0
Average height (cm)
F. (US)
F. (non US)
Nat.
194.4
192.2
196.4
Points per minute
F. (US)
F. (non US)
Nat.
0.43
0.38
0.35
Number of players
F. (US)
F. (non US)
Nat.
20
5
206
The league allowed 3 foreign players per team on the roster. The league allowed 3 foreign players on the court at the same time, per team.
The league did not have any specific regulations regarding U21 players.
The league did not have any restrictions regarding the number of replacements per team during the first round of the regular season. The league allowed national transfers under special restrictions related to the status of the concerned transferred player during the first round of the regular season.
Number of teams 15 16
Number of games per season 210 240
Number of games per team 28 30
Number of players 231 250
% of foreigners 11% 16%
Number of nationalities represented 7 9
Average age 25.9 26.0
Average height (cm) 196.1 196.1
Average team points per game 77.5 80.2
Average minutes per game played by the five most field players 26.9 26.6
Average number of players fielded per team during the season 15.4 15.6
2015-16 2014-15
foreign nationalities
USA20
PUR1
GHA1
ESP1
DOM1
AUS1
U21 players
Turnover of players
recruitment of players
Domestic Leagues 45
Number of players
201051
national playersforeign players
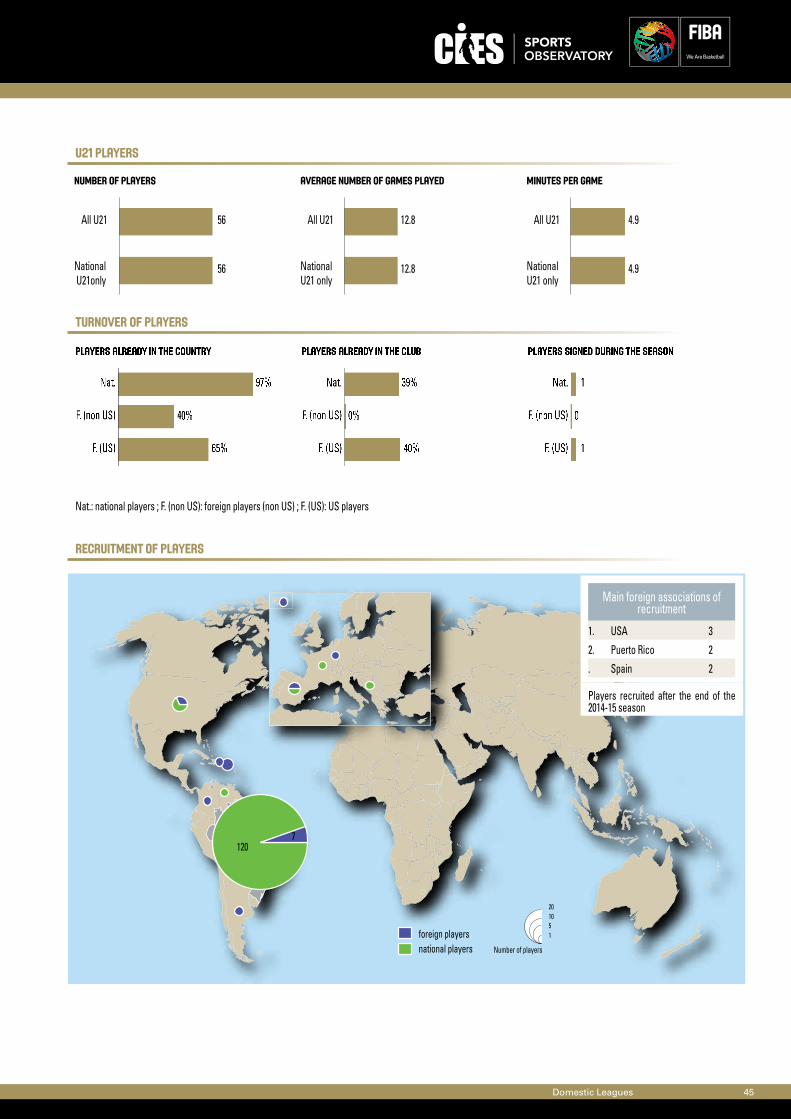
1207
Nat.: national players ; F. (non US): foreign players (non US) ; F. (US): US players
Main foreign associations of recruitment
1. USA 3
2. Puerto Rico 2
. Spain 2
Number of players
NationalU21only
All U21 56
56
Average number of games played
NationalU21 only
All U21 12.8
12.8
Minutes per game
NationalU21 only
All U21 4.9
4.9
Players signed during the season
F. (US)
F. (non US)
Nat.
1
0
1
Players already in the country
F. (US)
F. (non US)
Nat.
65%
40%
97%
Players already in the club
F. (US)
F. (non US)
Nat.
40%
0%
39%
Players recruited after the end of the 2014-15 season
League overview
NationalS vs Foreigners
46 International Basketball Migration Report 2016
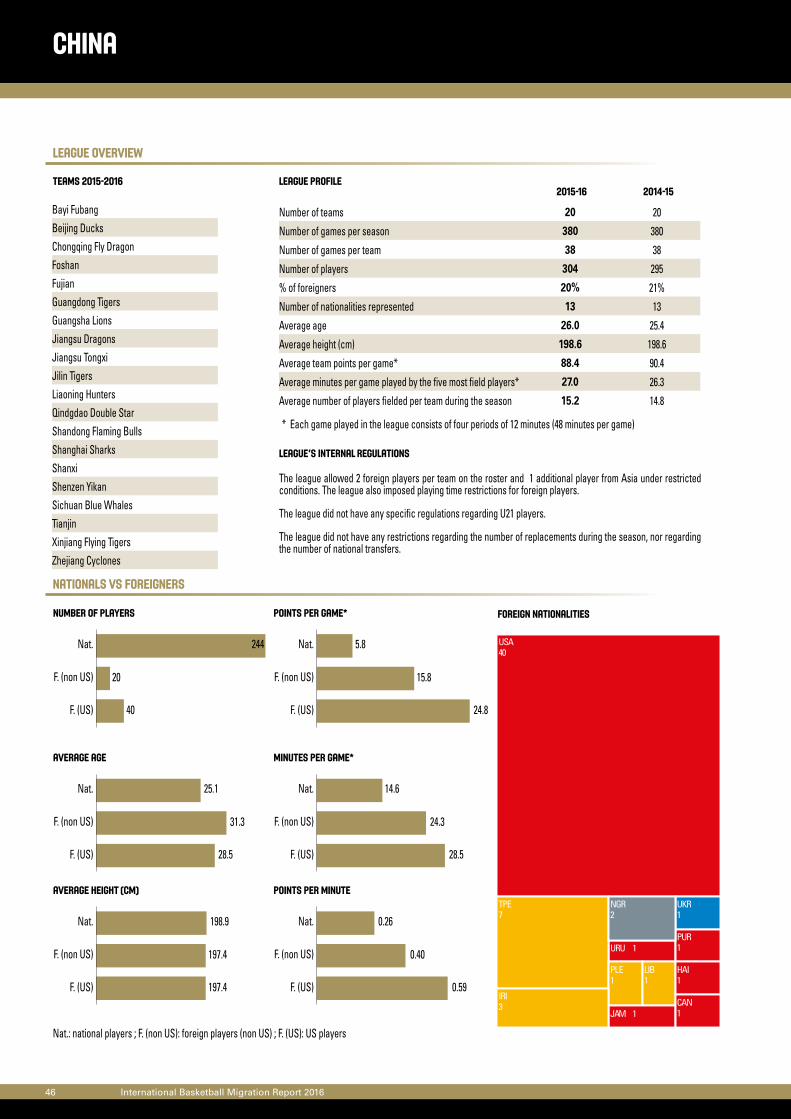
Bayi FubangBeijing DucksChongqing Fly DragonFoshanFujianGuangdong TigersGuangsha LionsJiangsu DragonsJiangsu TongxiJilin TigersLiaoning HuntersQindgdao Double StarShandong Flaming BullsShanghai SharksShanxiShenzen YikanSichuan Blue WhalesTianjinXinjiang Flying TigersZhejiang Cyclones
CHINA
Teams 2015-2016 League profile
League’s internal regulations
Nat.: national players ; F. (non US): foreign players (non US) ; F. (US): US players
Points per game*
F. (US)
F. (non US)
Nat.
24.8
15.8
5.8
Average age
F. (US)
F. (non US)
Nat.
28.5
31.3
25.1
Minutes per game*
F. (US)
F. (non US)
Nat.
28.5
24.3
14.6
Average height (cm)
F. (US)
F. (non US)
Nat.
197.4
197.4
198.9
Points per minute
F. (US)
F. (non US)
Nat.
0.59
0.40
0.26
Number of players
F. (US)
F. (non US)
Nat.
40
20
244
* Each game played in the league consists of four periods of 12 minutes (48 minutes per game)
Number of teams 20 20
Number of games per season 380 380
Number of games per team 38 38
Number of players 304 295
% of foreigners 20% 21%
Number of nationalities represented 13 13
Average age 26.0 25.4
Average height (cm) 198.6 198.6
Average team points per game* 88.4 90.4
Average minutes per game played by the five most field players* 27.0 26.3
Average number of players fielded per team during the season 15.2 14.8
2015-16 2014-15
The league allowed 2 foreign players per team on the roster and 1 additional player from Asia under restricted conditions. The league also imposed playing time restrictions for foreign players.
The league did not have any specific regulations regarding U21 players.
The league did not have any restrictions regarding the number of replacements during the season, nor regarding the number of national transfers.
foreign nationalities
USA40
URU 1
UKR1
TPE7
PUR1
PLE1
NGR2
LIB1
JAM 1
IRI3
HAI1
CAN1
U21 players
Turnover of players
recruitment of players
Domestic Leagues 47
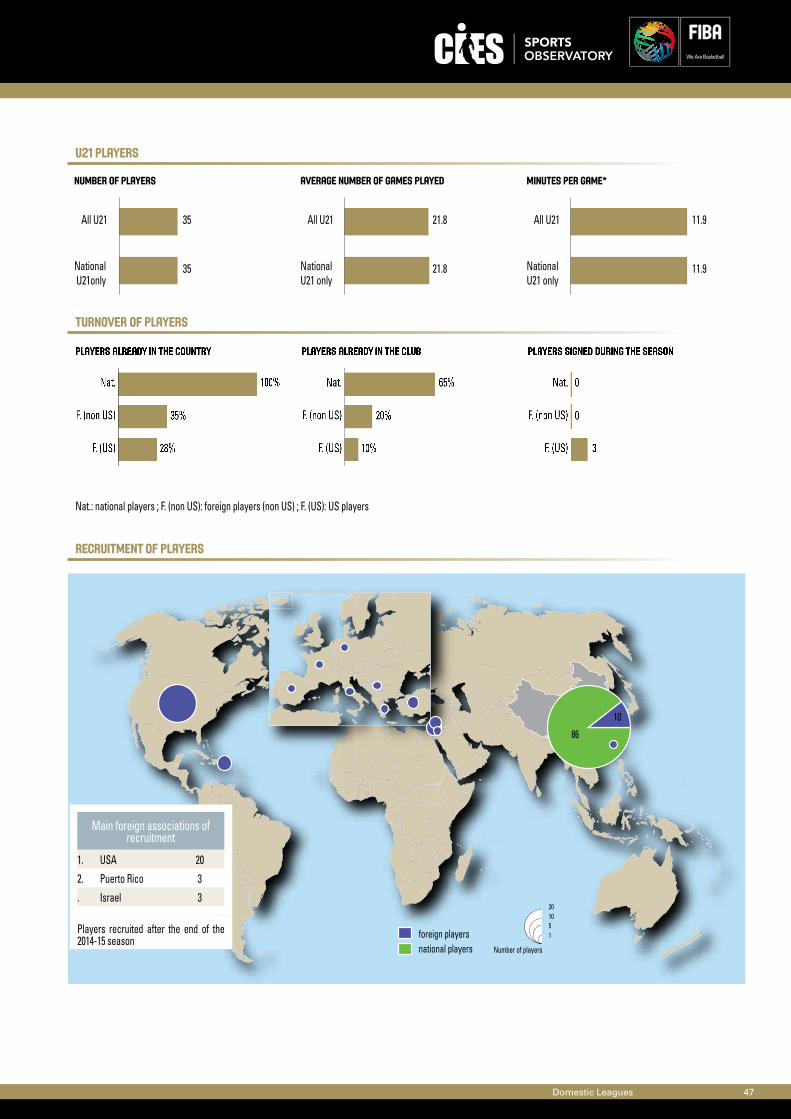
Number of players
201051
national playersforeign players
86
10
Nat.: national players ; F. (non US): foreign players (non US) ; F. (US): US players
Main foreign associations of recruitment
1. USA 20
2. Puerto Rico 3
. Israel 3
Number of players
NationalU21only
All U21 35
35
Average number of games played
NationalU21 only
All U21 21.8
21.8
Minutes per game*
NationalU21 only
All U21 11.9
11.9
Players signed during the season
F. (US)
F. (non US)
Nat.
3
0
0
Players already in the country
F. (US)
F. (non US)
Nat.
28%
35%
100%
Players already in the club
F. (US)
F. (non US)
Nat.
10%
20%
65%
Players recruited after the end of the 2014-15 season
League overview
NationalS vs Foreigners
48 International Basketball Migration Report 2016
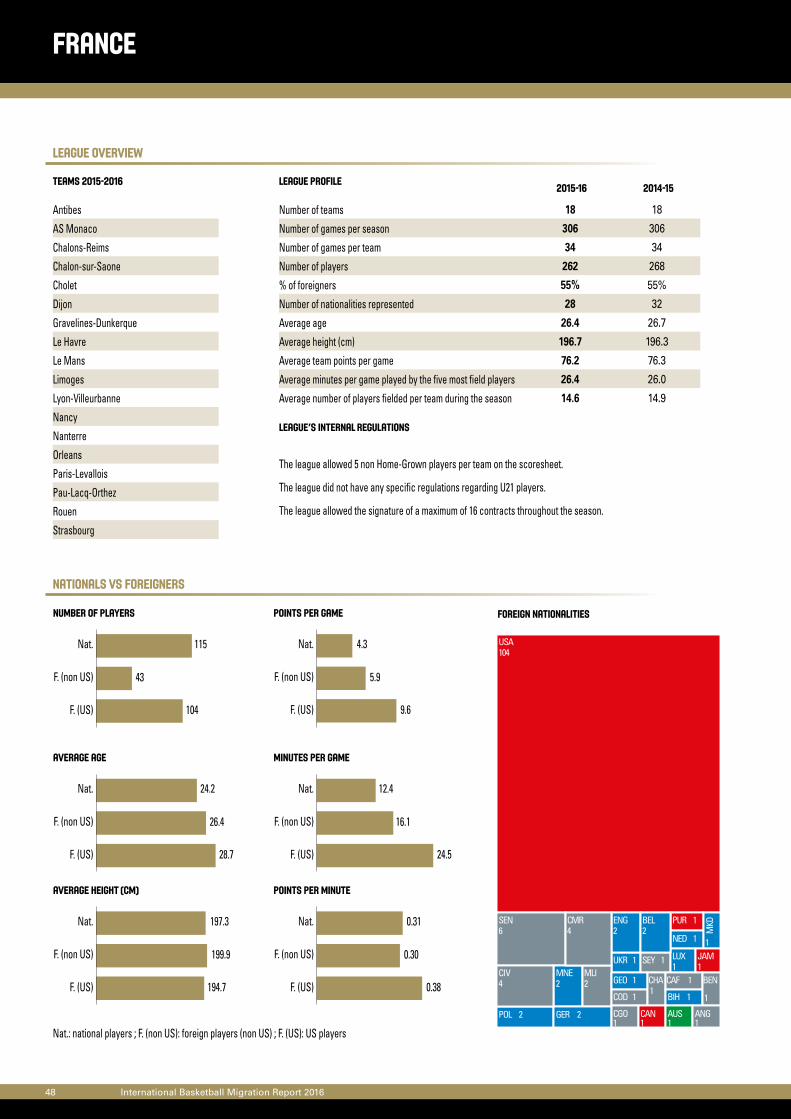
Antibes
AS Monaco
Chalons-Reims
Chalon-sur-Saone
Cholet
Dijon
Gravelines-Dunkerque
Le Havre
Le Mans
Limoges
Lyon-Villeurbanne
Nancy
Nanterre
Orleans
Paris-Levallois
Pau-Lacq-Orthez
Rouen
Strasbourg
Number of teams 18 18
Number of games per season 306 306
Number of games per team 34 34
Number of players 262 268
% of foreigners 55% 55%
Number of nationalities represented 28 32
Average age 26.4 26.7
Average height (cm) 196.7 196.3
Average team points per game 76.2 76.3
Average minutes per game played by the five most field players 26.4 26.0
Average number of players fielded per team during the season 14.6 14.9
france
Teams 2015-2016 League profile2015-16 2014-15
League’s internal regulations
Nat.: national players ; F. (non US): foreign players (non US) ; F. (US): US players
Points per game
F. (US)
F. (non US)
Nat.
9.6
5.9
4.3
Average age
F. (US)
F. (non US)
Nat.
28.7
26.4
24.2
Minutes per game
F. (US)
F. (non US)
Nat.
24.5
16.1
12.4
Average height (cm)
F. (US)
F. (non US)
Nat.
194.7
199.9
197.3
Points per minute
F. (US)
F. (non US)
Nat.
0.38
0.30
0.31
Number of players
F. (US)
F. (non US)
Nat.
104
43
115
The league allowed 5 non Home-Grown players per team on the scoresheet.
The league did not have any specific regulations regarding U21 players.
The league allowed the signature of a maximum of 16 contracts throughout the season.
foreign nationalities
USA104
UKR 1 SEY 1
SEN6
PUR 1
POL 2
NED 1
MNE2
MLI2
MKD
1LUX1
JAM1
GER 2
GEO 1
ENG2
COD 1
CMR4
CIV4 CHA
1
CGO1
CAN1
CAF 1
BIH 1
BEN
1
BEL2
AUS1
ANG1
U21 players
Turnover of players
recruitment of players
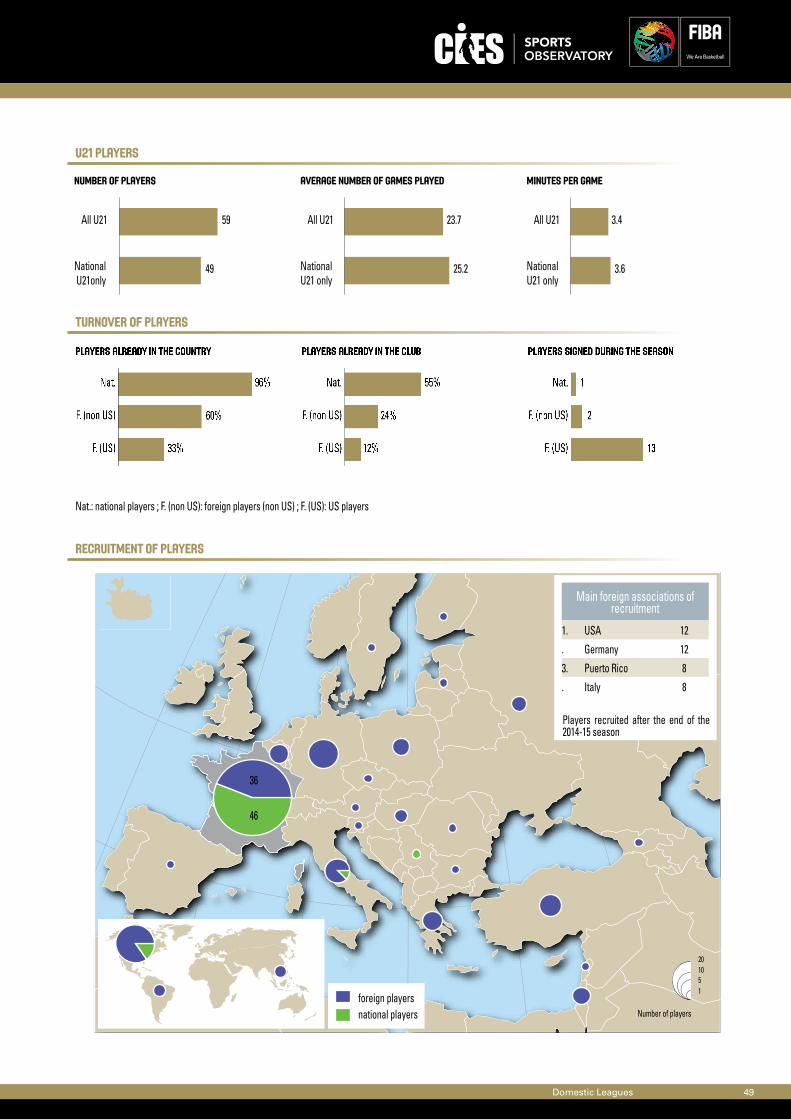
Domestic Leagues 49
national playersforeign players
Number of players
201051
36
46
Nat.: national players ; F. (non US): foreign players (non US) ; F. (US): US players
Main foreign associations of recruitment
1. USA 12
. Germany 12
3. Puerto Rico 8
. Italy 8
Number of players
NationalU21only
All U21 59
49
Average number of games played
NationalU21 only
All U21 23.7
25.2
Minutes per game
NationalU21 only
All U21 3.4
3.6
Players signed during the season
F. (US)
F. (non US)
Nat.
13
2
1
Players already in the country
F. (US)
F. (non US)
Nat.
33%
60%
96%
Players already in the club
F. (US)
F. (non US)
Nat.
12%
24%
55%
Players recruited after the end of the 2014-15 season
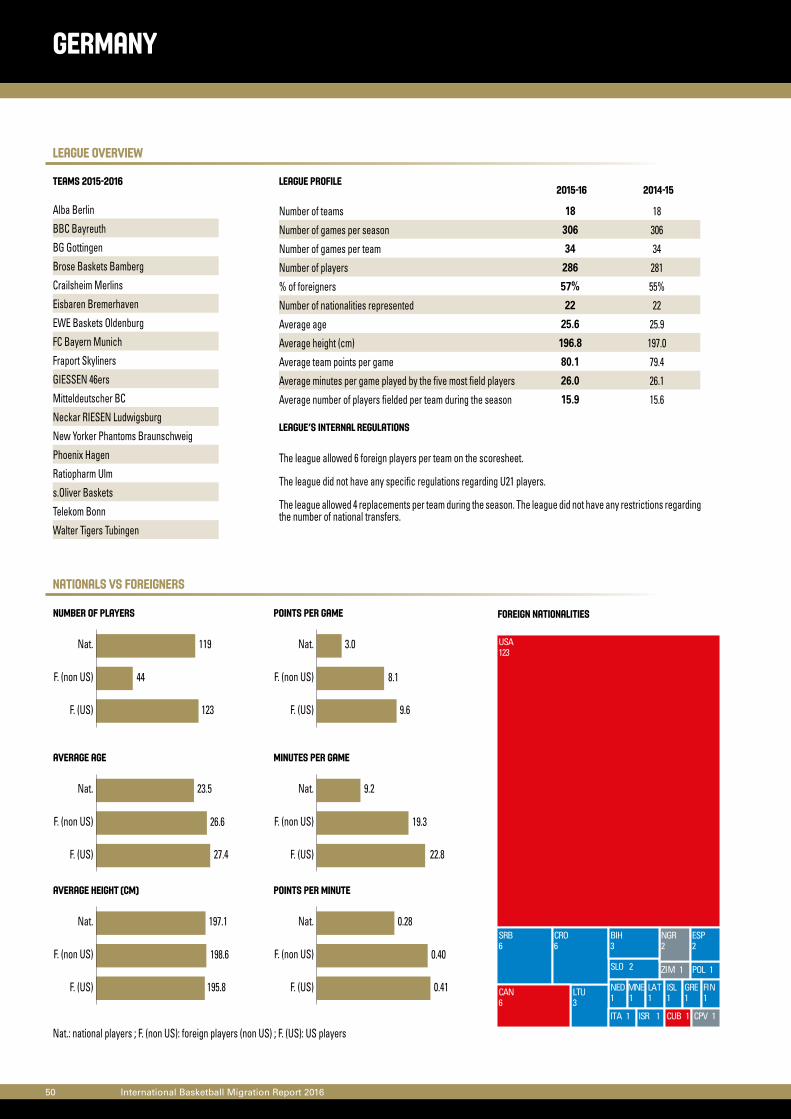
League overview
NationalS vs Foreigners
50 International Basketball Migration Report 2016
Alba Berlin
BBC Bayreuth
BG Gottingen
Brose Baskets Bamberg
Crailsheim Merlins
Eisbaren Bremerhaven
EWE Baskets Oldenburg
FC Bayern Munich
Fraport Skyliners
GIESSEN 46ers
Mitteldeutscher BC
Neckar RIESEN Ludwigsburg
New Yorker Phantoms Braunschweig
Phoenix Hagen
Ratiopharm Ulm
s.Oliver Baskets
Telekom Bonn
Walter Tigers Tubingen
GERMANY
Teams 2015-2016 League profile
League’s internal regulations
Nat.: national players ; F. (non US): foreign players (non US) ; F. (US): US players
Points per game
F. (US)
F. (non US)
Nat.
9.6
8.1
3.0
Average age
F. (US)
F. (non US)
Nat.
27.4
26.6
23.5
Minutes per game
F. (US)
F. (non US)
Nat.
22.8
19.3
9.2
Average height (cm)
F. (US)
F. (non US)
Nat.
195.8
198.6
197.1
Points per minute
F. (US)
F. (non US)
Nat.
0.41
0.40
0.28
Number of players
F. (US)
F. (non US)
Nat.
123
44
119
Number of teams 18 18
Number of games per season 306 306
Number of games per team 34 34
Number of players 286 281
% of foreigners 57% 55%
Number of nationalities represented 22 22
Average age 25.6 25.9
Average height (cm) 196.8 197.0
Average team points per game 80.1 79.4
Average minutes per game played by the five most field players 26.0 26.1
Average number of players fielded per team during the season 15.9 15.6
2015-16 2014-15
The league allowed 6 foreign players per team on the scoresheet.
The league did not have any specific regulations regarding U21 players.
The league allowed 4 replacements per team during the season. The league did not have any restrictions regarding the number of national transfers.
foreign nationalities
ZIM 1
USA123
SRB6
SLO 2 POL 1
NGR2
NED1
MNE1
LTU3
LAT1
ITA 1 ISR 1
ISL1
GRE1
FIN1
ESP2
CUB 1
CRO6
CPV 1
CAN6
BIH3
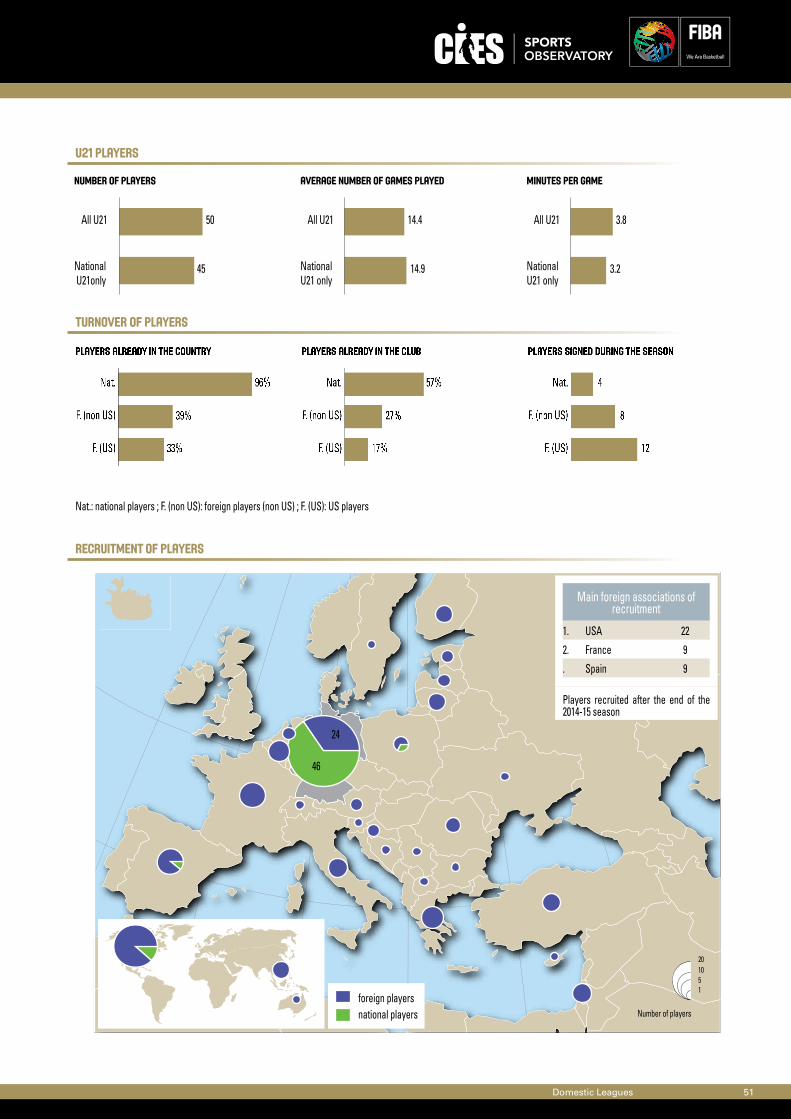
U21 players
Turnover of players
recruitment of players
Domestic Leagues 51
national playersforeign players
Number of players
201051
46
24
Nat.: national players ; F. (non US): foreign players (non US) ; F. (US): US players
Main foreign associations of recruitment
1. USA 22
2. France 9
. Spain 9
Number of players
NationalU21only
All U21 50
45
Average number of games played
NationalU21 only
All U21 14.4
14.9
Minutes per game
NationalU21 only
All U21 3.8
3.2
Players signed during the season
F. (US)
F. (non US)
Nat.
12
8
4
Players already in the country
F. (US)
F. (non US)
Nat.
33%
39%
96%
Players already in the club
F. (US)
F. (non US)
Nat.
17%
27%
57%
Players recruited after the end of the 2014-15 season
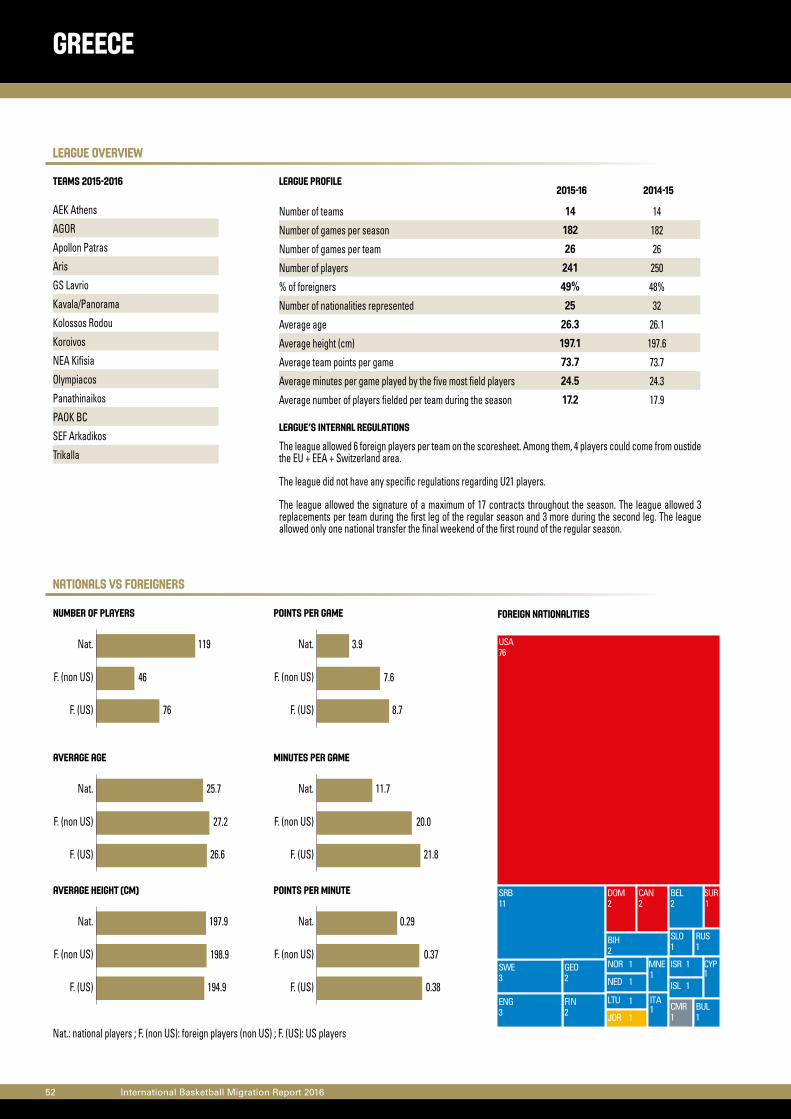
League overview
NationalS vs Foreigners
52 International Basketball Migration Report 2016
AEK Athens
AGOR
Apollon Patras
Aris
GS Lavrio
Kavala/Panorama
Kolossos Rodou
Koroivos
NEA Kifisia
Olympiacos
Panathinaikos
PAOK BC
SEF Arkadikos
Trikalla
GREECE
Teams 2015-2016 League profile
League’s internal regulations
Nat.: national players ; F. (non US): foreign players (non US) ; F. (US): US players
Points per game
F. (US)
F. (non US)
Nat.
8.7
7.6
3.9
Average age
F. (US)
F. (non US)
Nat.
26.6
27.2
25.7
Minutes per game
F. (US)
F. (non US)
Nat.
21.8
20.0
11.7
Average height (cm)
F. (US)
F. (non US)
Nat.
194.9
198.9
197.9
Points per minute
F. (US)
F. (non US)
Nat.
0.38
0.37
0.29
Number of players
F. (US)
F. (non US)
Nat.
76
46
119
Number of teams 14 14
Number of games per season 182 182
Number of games per team 26 26
Number of players 241 250
% of foreigners 49% 48%
Number of nationalities represented 25 32
Average age 26.3 26.1
Average height (cm) 197.1 197.6
Average team points per game 73.7 73.7
Average minutes per game played by the five most field players 24.5 24.3
Average number of players fielded per team during the season 17.2 17.9
2015-16 2014-15
The league allowed 6 foreign players per team on the scoresheet. Among them, 4 players could come from oustide the EU + EEA + Switzerland area.
The league did not have any specific regulations regarding U21 players.
The league allowed the signature of a maximum of 17 contracts throughout the season. The league allowed 3 replacements per team during the first leg of the regular season and 3 more during the second leg. The league allowed only one national transfer the final weekend of the first round of the regular season.
foreign nationalities
USA76
SWE3
SUR1
SRB11
SLO1
RUS1
NOR 1
NED 1
MNE1
LTU 1
JOR 1
ITA1
ISR 1
ISL 1
GEO2
FIN2
ENG3
DOM2
CYP1
CMR1
CAN2
BUL1
BIH2
BEL2
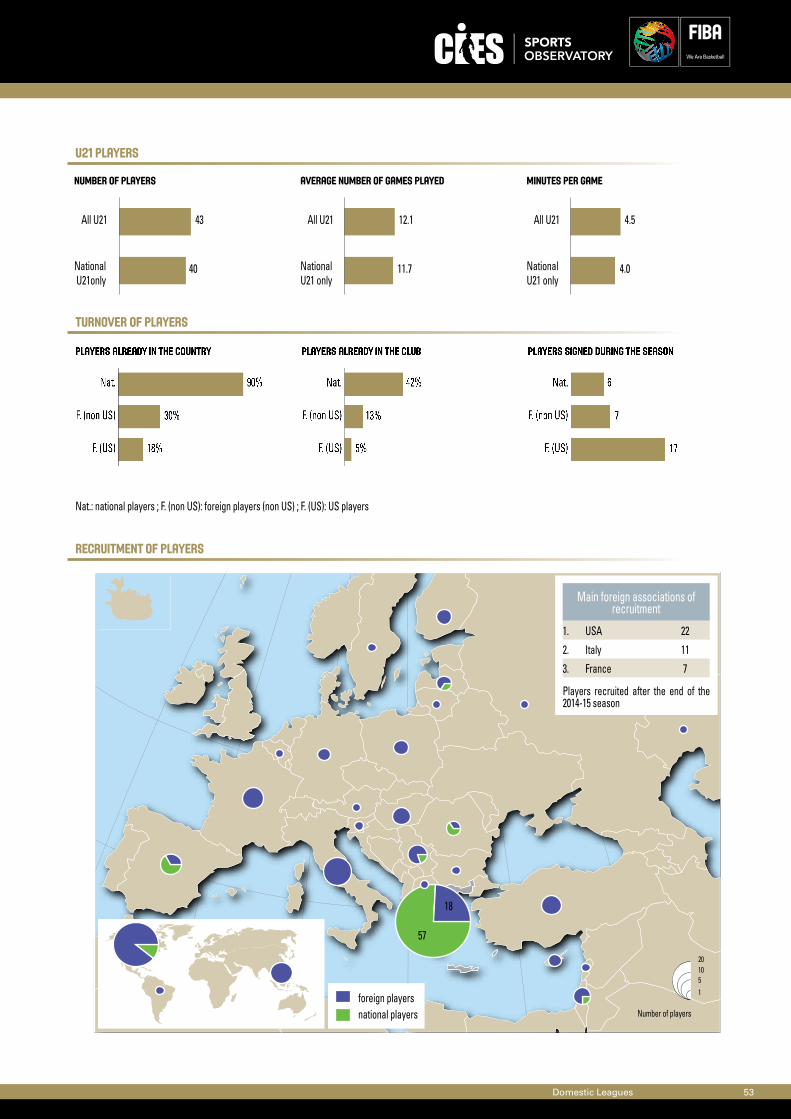
U21 players
Turnover of players
recruitment of players
Domestic Leagues 53
national playersforeign players
Number of players
201051
18
57
Nat.: national players ; F. (non US): foreign players (non US) ; F. (US): US players
Main foreign associations of recruitment
1. USA 22
2. Italy 11
3. France 7
Number of players
NationalU21only
All U21 43
40
Average number of games played
NationalU21 only
All U21 12.1
11.7
Minutes per game
NationalU21 only
All U21 4.5
4.0
Players signed during the season
F. (US)
F. (non US)
Nat.
17
7
6
Players already in the country
F. (US)
F. (non US)
Nat.
18%
30%
90%
Players already in the club
F. (US)
F. (non US)
Nat.
5%
13%
42%
Players recruited after the end of the 2014-15 season
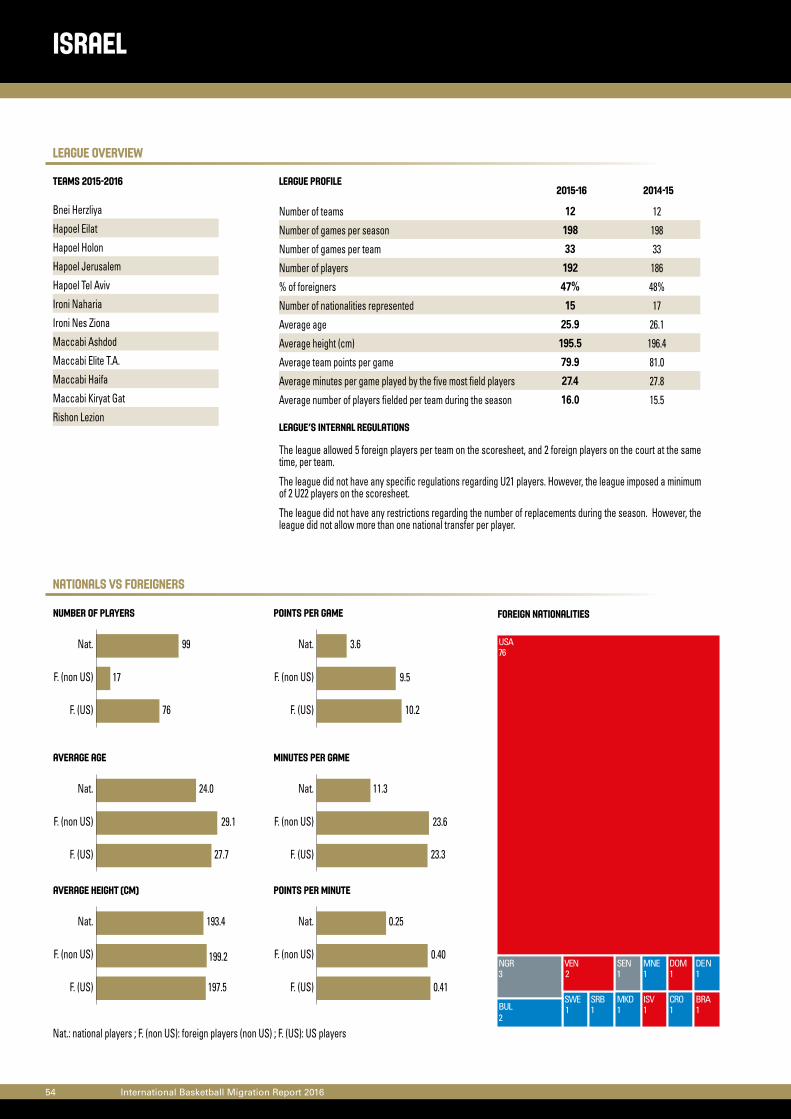
League overview
NationalS vs Foreigners
54 International Basketball Migration Report 2016
Bnei Herzliya
Hapoel Eilat
Hapoel Holon
Hapoel Jerusalem
Hapoel Tel Aviv
Ironi Naharia
Ironi Nes Ziona
Maccabi Ashdod
Maccabi Elite T.A.
Maccabi Haifa
Maccabi Kiryat Gat
Rishon Lezion
israel
Teams 2015-2016 League profile
League’s internal regulations
Nat.: national players ; F. (non US): foreign players (non US) ; F. (US): US players
Points per game
F. (US)
F. (non US)
Nat.
10.2
9.5
3.6
Average age
F. (US)
F. (non US)
Nat.
27.7
29.1
24.0
Minutes per game
F. (US)
F. (non US)
Nat.
23.3
23.6
11.3
Average height (cm)
F. (US)
F. (non US)
Nat.
197.5
199.2
193.4
Points per minute
F. (US)
F. (non US)
Nat.
0.41
0.40
0.25
Number of players
F. (US)
F. (non US)
Nat.
76
17
99
Number of teams 12 12
Number of games per season 198 198
Number of games per team 33 33
Number of players 192 186
% of foreigners 47% 48%
Number of nationalities represented 15 17
Average age 25.9 26.1
Average height (cm) 195.5 196.4
Average team points per game 79.9 81.0
Average minutes per game played by the five most field players 27.4 27.8
Average number of players fielded per team during the season 16.0 15.5
2015-16 2014-15
The league allowed 5 foreign players per team on the scoresheet, and 2 foreign players on the court at the same time, per team.
The league did not have any specific regulations regarding U21 players. However, the league imposed a minimum of 2 U22 players on the scoresheet.
The league did not have any restrictions regarding the number of replacements during the season. However, the league did not allow more than one national transfer per player.
foreign nationalities
USA76
SWE SRB
SEN
NGR
MNE11
MKD
ISV
DOM DEN
CRO BUL
3
2
BRA
VEN 2
1 1 1 1 1 1
1 1
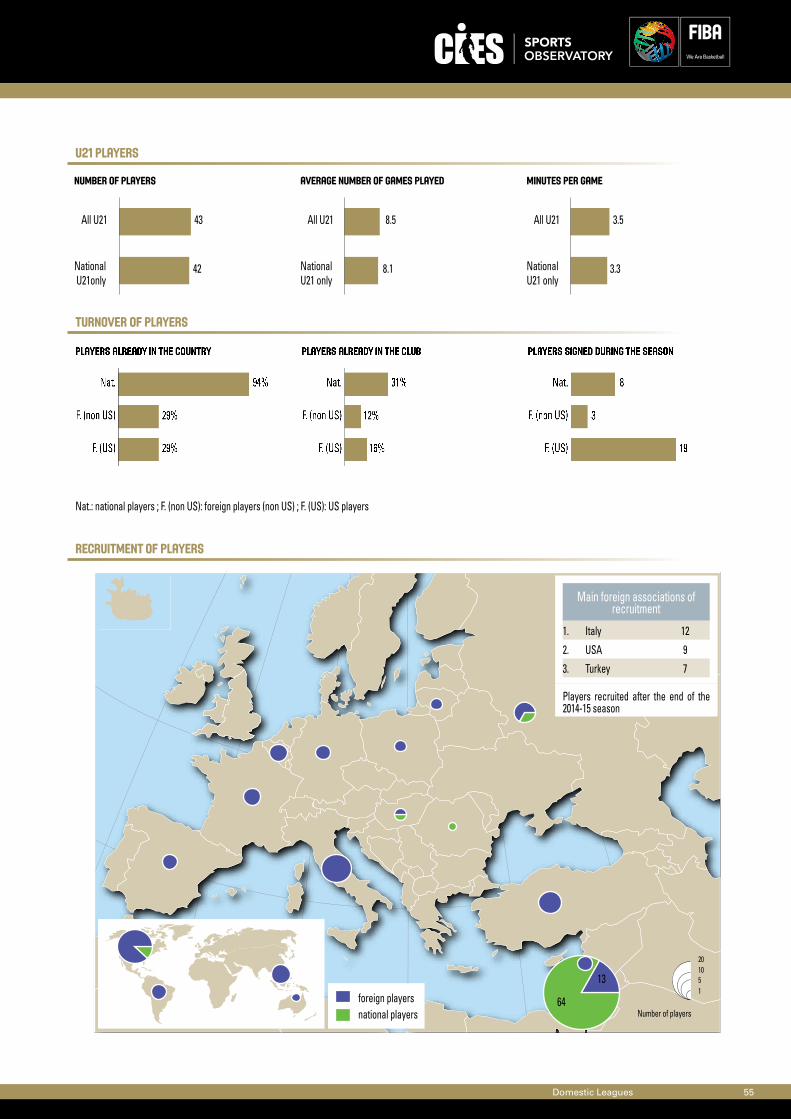
U21 players
Turnover of players
recruitment of players
Domestic Leagues 55
national playersforeign players
Number of players
201051
13
64
Nat.: national players ; F. (non US): foreign players (non US) ; F. (US): US players
Main foreign associations of recruitment
1. Italy 12
2. USA 9
3. Turkey 7
Number of players
NationalU21only
All U21 43
42
Average number of games played
NationalU21 only
All U21 8.5
8.1
Minutes per game
NationalU21 only
All U21 3.5
3.3
Players signed during the season
F. (US)
F. (non US)
Nat.
19
3
8
Players already in the country
F. (US)
F. (non US)
Nat.
29%
29%
94%
Players already in the club
F. (US)
F. (non US)
Nat.
16%
12%
31%
Players recruited after the end of the 2014-15 season
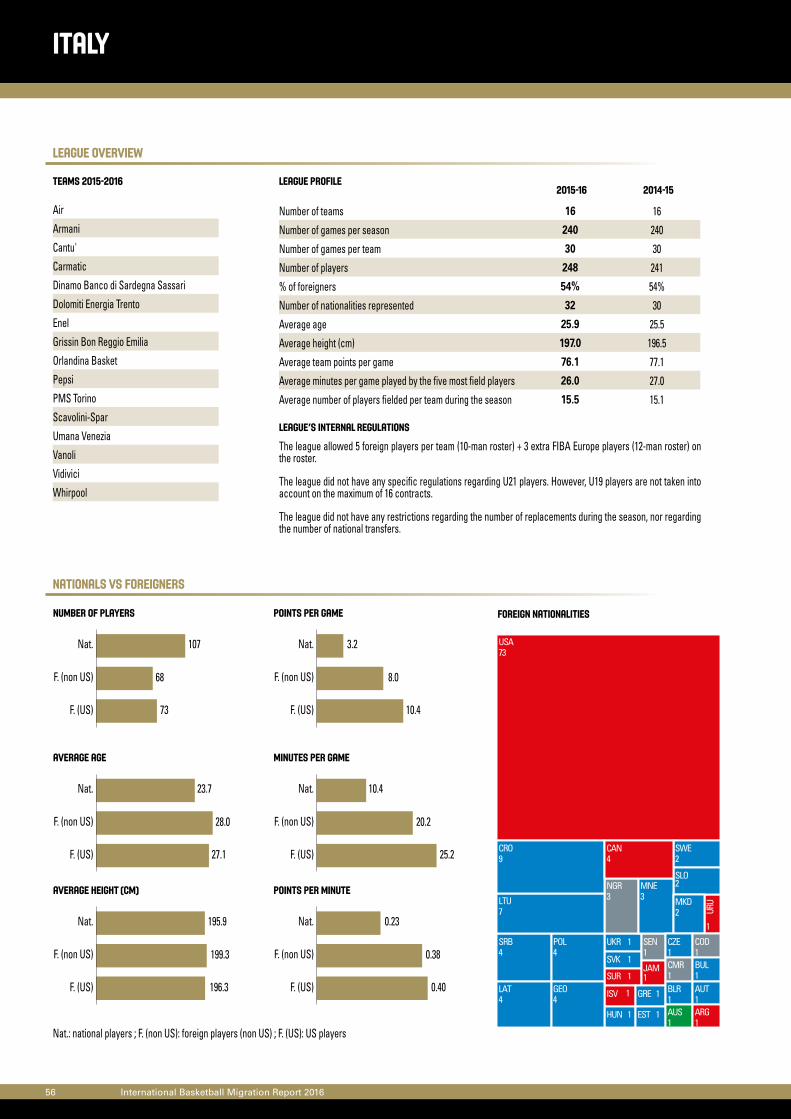
League overview
NationalS vs Foreigners
56 International Basketball Migration Report 2016
Air
Armani
Cantu'
Carmatic
Dinamo Banco di Sardegna Sassari
Dolomiti Energia Trento
Enel
Grissin Bon Reggio Emilia
Orlandina Basket
Pepsi
PMS Torino
Scavolini-Spar
Umana Venezia
Vanoli
Vidivici
Whirpool
ITALY
Teams 2015-2016 League profile
League’s internal regulations
Nat.: national players ; F. (non US): foreign players (non US) ; F. (US): US players
Points per game
F. (US)
F. (non US)
Nat.
10.4
8.0
3.2
Average age
F. (US)
F. (non US)
Nat.
27.1
28.0
23.7
Minutes per game
F. (US)
F. (non US)
Nat.
25.2
20.2
10.4
Average height (cm)
F. (US)
F. (non US)
Nat.
196.3
199.3
195.9
Points per minute
F. (US)
F. (non US)
Nat.
0.40
0.38
0.23
Number of players
F. (US)
F. (non US)
Nat.
73
68
107
Number of teams 16 16
Number of games per season 240 240
Number of games per team 30 30
Number of players 248 241
% of foreigners 54% 54%
Number of nationalities represented 32 30
Average age 25.9 25.5
Average height (cm) 197.0 196.5
Average team points per game 76.1 77.1
Average minutes per game played by the five most field players 26.0 27.0
Average number of players fielded per team during the season 15.5 15.1
2015-16 2014-15
The league allowed 5 foreign players per team (10-man roster) + 3 extra FIBA Europe players (12-man roster) on the roster.
The league did not have any specific regulations regarding U21 players. However, U19 players are not taken into account on the maximum of 16 contracts.
The league did not have any restrictions regarding the number of replacements during the season, nor regarding the number of national transfers.
foreign nationalities
USA73
URU
1
UKR 1
SWE2
SVK 1
SUR 1
SRB4
SLO2
SEN1
POL4
NGR3
MNE3 MKD
2LTU7
LAT4
JAM1
ISV 1
HUN 1
GRE 1GEO4
EST 1
CZE1
CRO9
COD1
CMR1
CAN4
BUL1
BLR1
AUT1
AUS1
ARG1
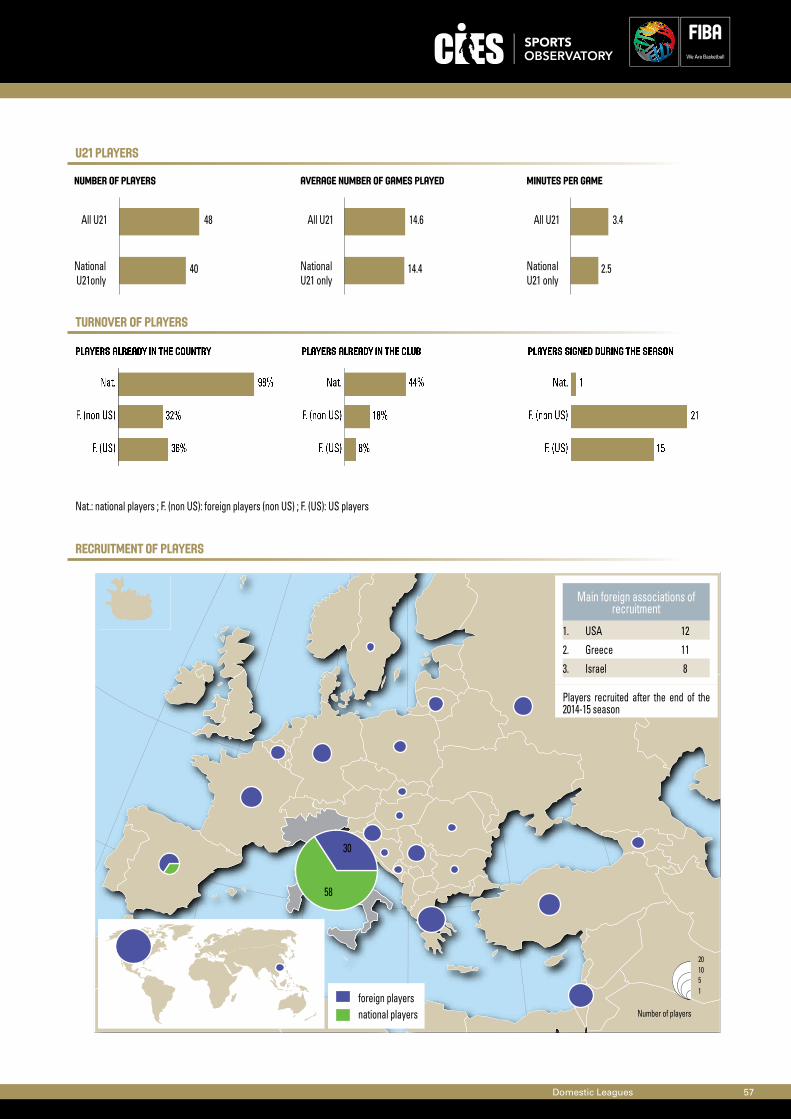
U21 players
Turnover of players
recruitment of players
Domestic Leagues 57
national playersforeign players
Number of players
201051
30
58
Nat.: national players ; F. (non US): foreign players (non US) ; F. (US): US players
Main foreign associations of recruitment
1. USA 12
2. Greece 11
3. Israel 8
Number of players
NationalU21only
All U21 48
40
Average number of games played
NationalU21 only
All U21 14.6
14.4
Minutes per game
NationalU21 only
All U21 3.4
2.5
Players signed during the season
F. (US)
F. (non US)
Nat.
15
21
1
Players already in the country
F. (US)
F. (non US)
Nat.
36%
32%
98%
Players already in the club
F. (US)
F. (non US)
Nat.
8%
18%
44%
Players recruited after the end of the 2014-15 season
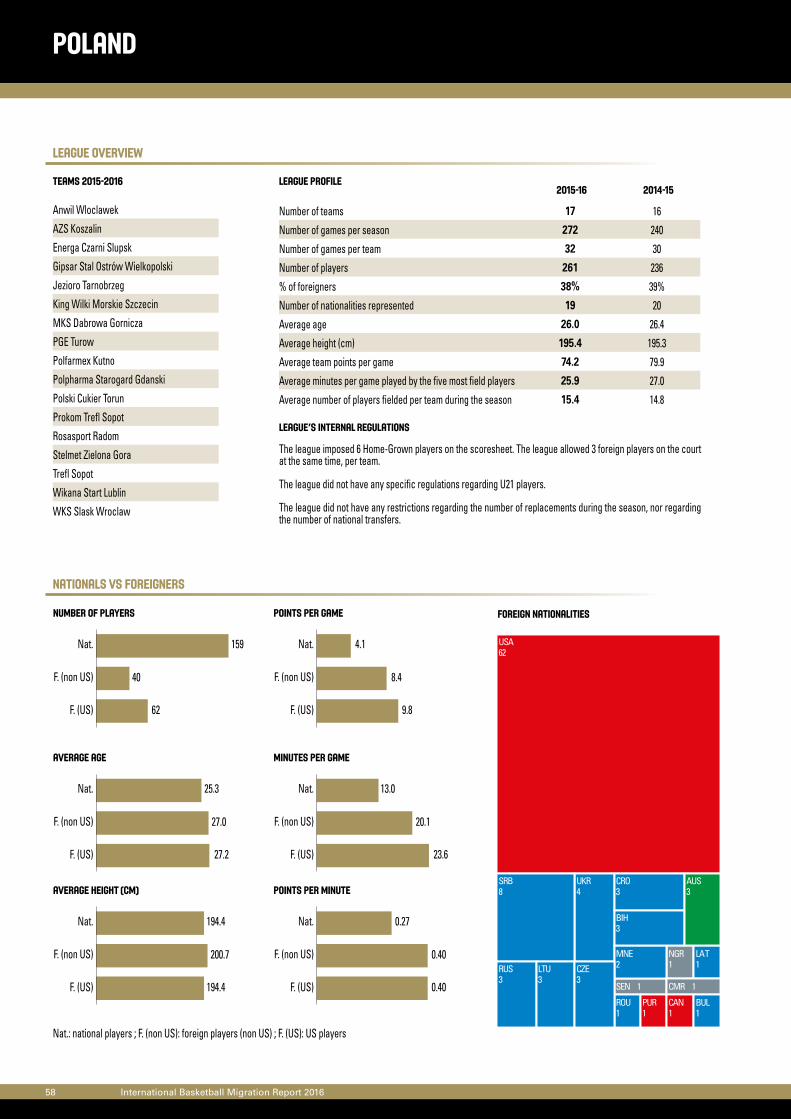
League overview
NationalS vs Foreigners
58 International Basketball Migration Report 2016
Anwil Wloclawek
AZS Koszalin
Energa Czarni Slupsk
Gipsar Stal Ostrów Wielkopolski
Jezioro Tarnobrzeg
King Wilki Morskie Szczecin
MKS Dabrowa Gornicza
PGE Turow
Polfarmex Kutno
Polpharma Starogard Gdanski
Polski Cukier Torun
Prokom Trefl Sopot
Rosasport Radom
Stelmet Zielona Gora
Trefl Sopot
Wikana Start Lublin
WKS Slask Wroclaw
poland
Teams 2015-2016 League profile
League’s internal regulations
Nat.: national players ; F. (non US): foreign players (non US) ; F. (US): US players
Points per game
F. (US)
F. (non US)
Nat.
9.8
8.4
4.1
Average age
F. (US)
F. (non US)
Nat.
27.2
27.0
25.3
Minutes per game
F. (US)
F. (non US)
Nat.
23.6
20.1
13.0
Average height (cm)
F. (US)
F. (non US)
Nat.
194.4
200.7
194.4
Points per minute
F. (US)
F. (non US)
Nat.
0.40
0.40
0.27
Number of players
F. (US)
F. (non US)
Nat.
62
40
159
Number of teams 17 16
Number of games per season 272 240
Number of games per team 32 30
Number of players 261 236
% of foreigners 38% 39%
Number of nationalities represented 19 20
Average age 26.0 26.4
Average height (cm) 195.4 195.3
Average team points per game 74.2 79.9
Average minutes per game played by the five most field players 25.9 27.0
Average number of players fielded per team during the season 15.4 14.8
2015-16 2014-15
The league imposed 6 Home-Grown players on the scoresheet. The league allowed 3 foreign players on the court at the same time, per team.
The league did not have any specific regulations regarding U21 players.
The league did not have any restrictions regarding the number of replacements during the season, nor regarding the number of national transfers.
foreign nationalities
USA62
UKR4
SRB8
SEN 1
RUS3
ROU1
PUR1
NGR1
MNE2LTU
3
LAT1CZE
3
CRO3
CMR 1
CAN1
BUL1
BIH3
AUS3
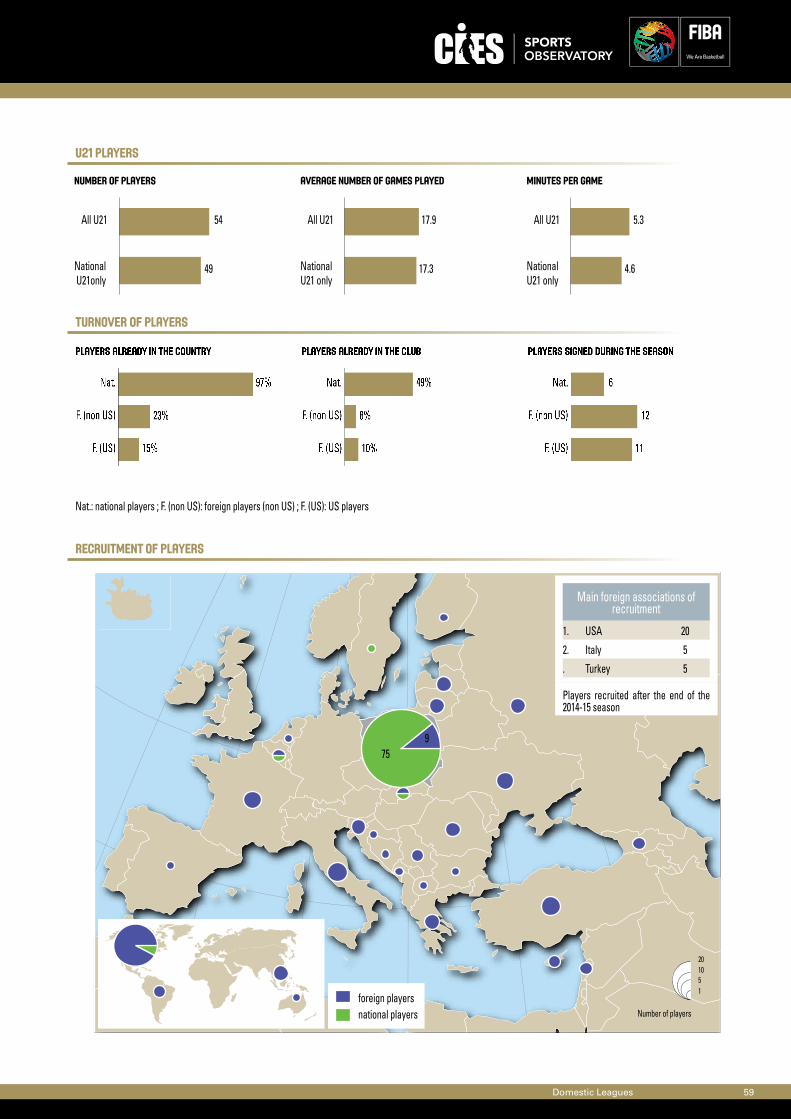
U21 players
Turnover of players
recruitment of players
Domestic Leagues 59
national playersforeign players
Number of players
201051
975
Nat.: national players ; F. (non US): foreign players (non US) ; F. (US): US players
Main foreign associations of recruitment
1. USA 20
2. Italy 5
. Turkey 5
Number of players
NationalU21only
All U21 54
49
Average number of games played
NationalU21 only
All U21 17.9
17.3
Minutes per game
NationalU21 only
All U21 5.3
4.6
Players signed during the season
F. (US)
F. (non US)
Nat.
11
12
6
Players already in the country
F. (US)
F. (non US)
Nat.
15%
23%
97%
Players already in the club
F. (US)
F. (non US)
Nat.
10%
8%
49%
Players recruited after the end of the 2014-15 season
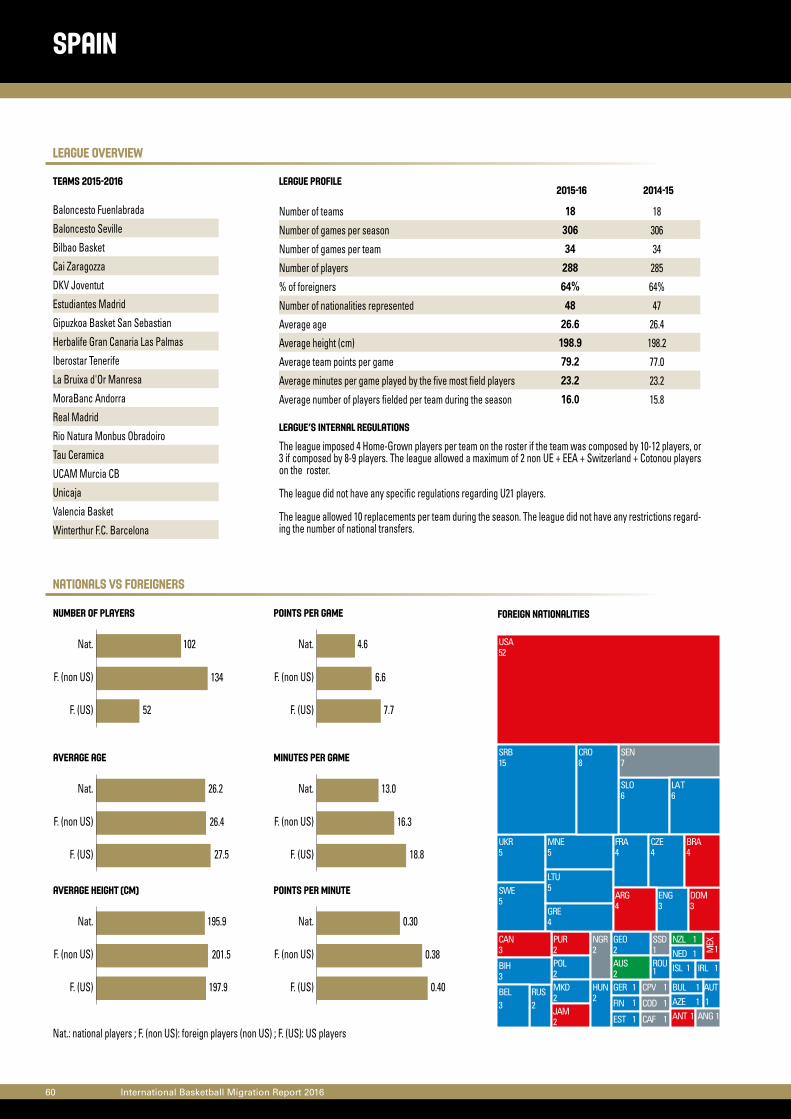
League overview
NationalS vs Foreigners
60 International Basketball Migration Report 2016
Baloncesto Fuenlabrada
Baloncesto Seville
Bilbao Basket
Cai Zaragozza
DKV Joventut
Estudiantes Madrid
Gipuzkoa Basket San Sebastian
Herbalife Gran Canaria Las Palmas
Iberostar Tenerife
La Bruixa d'Or Manresa
MoraBanc Andorra
Real Madrid
Rio Natura Monbus Obradoiro
Tau Ceramica
UCAM Murcia CB
Unicaja
Valencia Basket
Winterthur F.C. Barcelona
SPAIN
Teams 2015-2016 League profile
League’s internal regulations
Nat.: national players ; F. (non US): foreign players (non US) ; F. (US): US players
Points per game
F. (US)
F. (non US)
Nat.
7.7
6.6
4.6
Average age
F. (US)
F. (non US)
Nat.
27.5
26.4
26.2
Minutes per game
F. (US)
F. (non US)
Nat.
18.8
16.3
13.0
Average height (cm)
F. (US)
F. (non US)
Nat.
197.9
201.5
195.9
Points per minute
F. (US)
F. (non US)
Nat.
0.40
0.38
0.30
Number of players
F. (US)
F. (non US)
Nat.
52
134
102
Number of teams 18 18
Number of games per season 306 306
Number of games per team 34 34
Number of players 288 285
% of foreigners 64% 64%
Number of nationalities represented 48 47
Average age 26.6 26.4
Average height (cm) 198.9 198.2
Average team points per game 79.2 77.0
Average minutes per game played by the five most field players 23.2 23.2
Average number of players fielded per team during the season 16.0 15.8
2015-16 2014-15
The league imposed 4 Home-Grown players per team on the roster if the team was composed by 10-12 players, or 3 if composed by 8-9 players. The league allowed a maximum of 2 non UE + EEA + Switzerland + Cotonou players on the roster.
The league did not have any specific regulations regarding U21 players.
The league allowed 10 replacements per team during the season. The league did not have any restrictions regard-ing the number of national transfers.
foreign nationalities
USA52
UKR5
SWE5
SSD1
SRB15
SLO6
SEN7
RUS2
ROU1
PUR2POL2
NZLNGR2 NED
MNE5
MKD2
MEX
1
LTU5
LAT6
JAM2
ISL 1 IRL 1
HUN2
GRE4
GER 1
GEO2
FRA4
FIN 1
EST 1
ENG3
DOM3
CZE4
CRO8
CPV 1
COD 1
CAN3
CAF 1
BUL
BRA4
BIH3
BEL3 AZE
AUT1
AUS2
ARG4
ANT 1 ANG 1
11
11
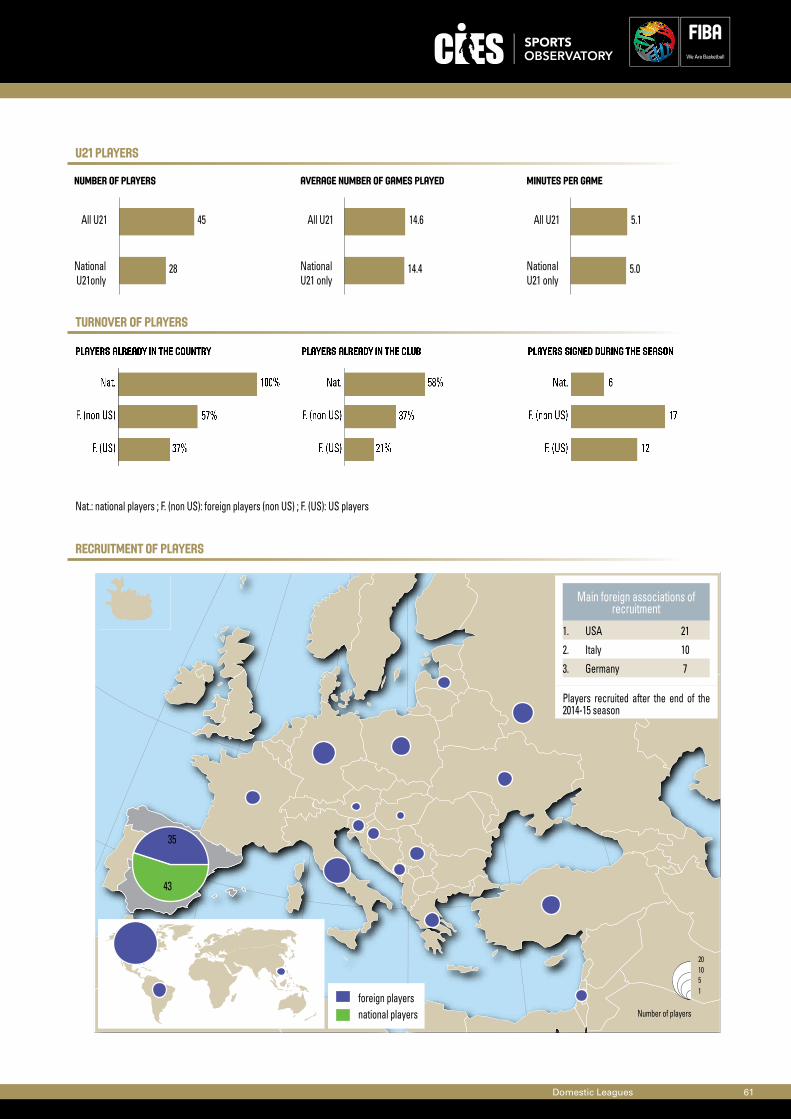
U21 players
Turnover of players
recruitment of players
Domestic Leagues 61
national playersforeign players
Number of players
201051
35
43
Nat.: national players ; F. (non US): foreign players (non US) ; F. (US): US players
Main foreign associations of recruitment
1. USA 21
2. Italy 10
3. Germany 7
Number of players
NationalU21only
All U21 45
28
Average number of games played
NationalU21 only
All U21 14.6
14.4
Minutes per game
NationalU21 only
All U21 5.1
5.0
Players signed during the season
F. (US)
F. (non US)
Nat.
12
17
6
Players already in the country
F. (US)
F. (non US)
Nat.
37%
57%
100%
Players already in the club
F. (US)
F. (non US)
Nat.
21%
37%
58%
Players recruited after the end of the 2014-15 season
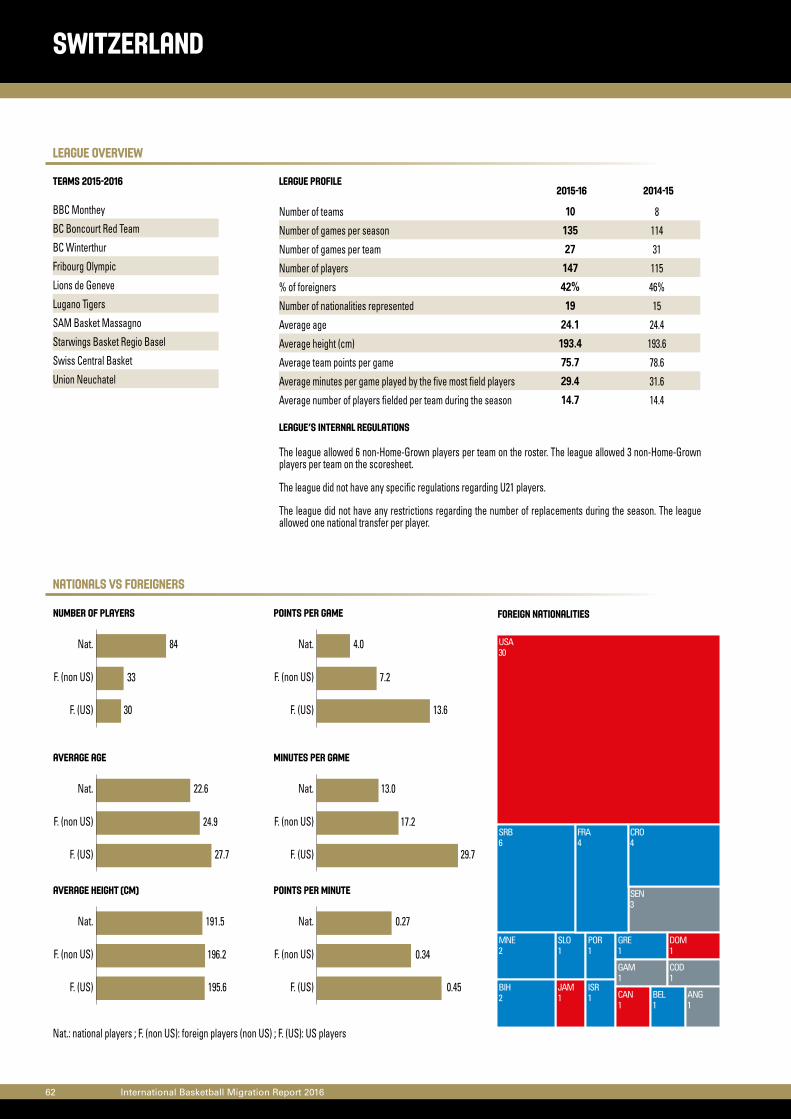
League overview
NationalS vs Foreigners
62 International Basketball Migration Report 2016
BBC Monthey
BC Boncourt Red Team
BC Winterthur
Fribourg Olympic
Lions de Geneve
Lugano Tigers
SAM Basket Massagno
Starwings Basket Regio Basel
Swiss Central Basket
Union Neuchatel
switzerland
Teams 2015-2016 League profile
League’s internal regulations
Nat.: national players ; F. (non US): foreign players (non US) ; F. (US): US players
Points per game
F. (US)
F. (non US)
Nat.
13.6
7.2
4.0
Average age
F. (US)
F. (non US)
Nat.
27.7
24.9
22.6
Minutes per game
F. (US)
F. (non US)
Nat.
29.7
17.2
13.0
Average height (cm)
F. (US)
F. (non US)
Nat.
195.6
196.2
191.5
Points per minute
F. (US)
F. (non US)
Nat.
0.45
0.34
0.27
Number of players
F. (US)
F. (non US)
Nat.
30
33
84
Number of teams 10 8
Number of games per season 135 114
Number of games per team 27 31
Number of players 147 115
% of foreigners 42% 46%
Number of nationalities represented 19 15
Average age 24.1 24.4
Average height (cm) 193.4 193.6
Average team points per game 75.7 78.6
Average minutes per game played by the five most field players 29.4 31.6
Average number of players fielded per team during the season 14.7 14.4
2015-16 2014-15
The league allowed 6 non-Home-Grown players per team on the roster. The league allowed 3 non-Home-Grown players per team on the scoresheet.
The league did not have any specific regulations regarding U21 players.
The league did not have any restrictions regarding the number of replacements during the season. The league allowed one national transfer per player.
foreign nationalities
USA30
SRB6
SLO1
SEN3
POR1
MNE2
JAM1
ISR1
GRE1
GAM1
FRA4
DOM1
CRO4
COD1
CAN1
BIH2 BEL
1ANG1
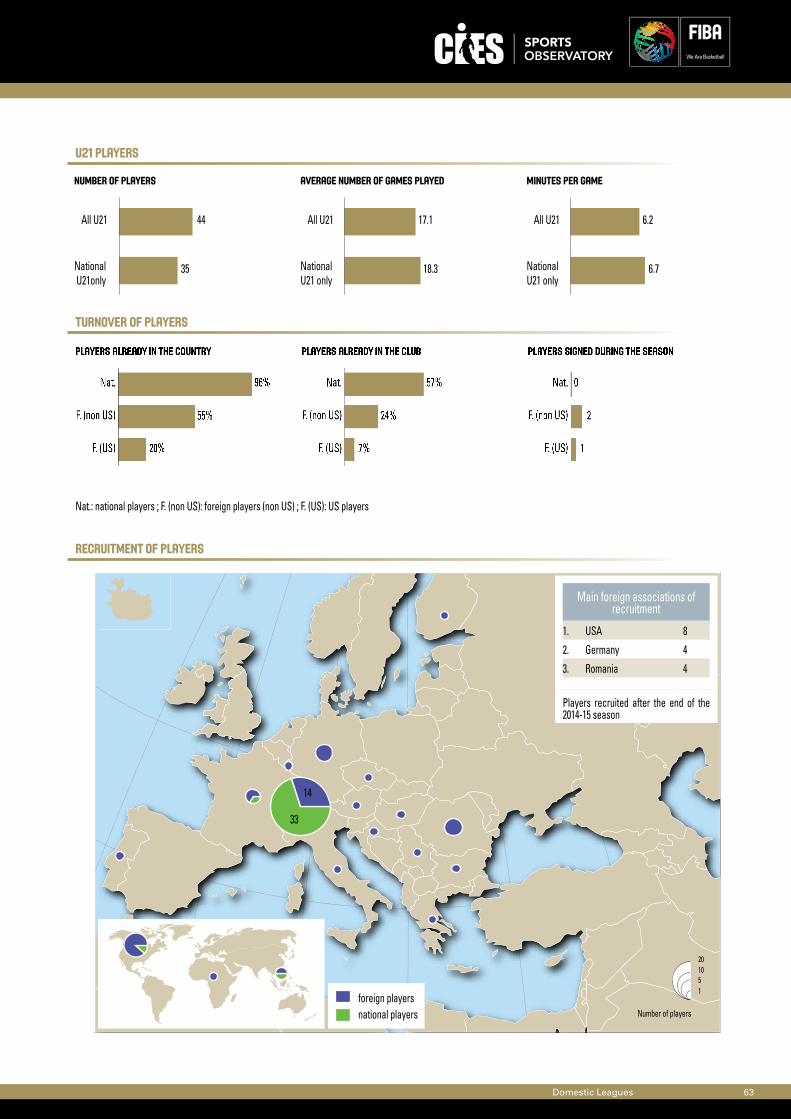
U21 players
Turnover of players
recruitment of players
Domestic Leagues 63
national playersforeign players
Number of players
201051
14
33
Nat.: national players ; F. (non US): foreign players (non US) ; F. (US): US players
Main foreign associations of recruitment
1. USA 8
2. Germany 4
3. Romania 4
Number of players
NationalU21only
All U21 44
35
Average number of games played
NationalU21 only
All U21 17.1
18.3
Minutes per game
NationalU21 only
All U21 6.2
6.7
Players signed during the season
F. (US)
F. (non US)
Nat.
1
2
0
Players already in the country
F. (US)
F. (non US)
Nat.
20%
55%
96%
Players already in the club
F. (US)
F. (non US)
Nat.
7%
24%
57%
Players recruited after the end of the 2014-15 season
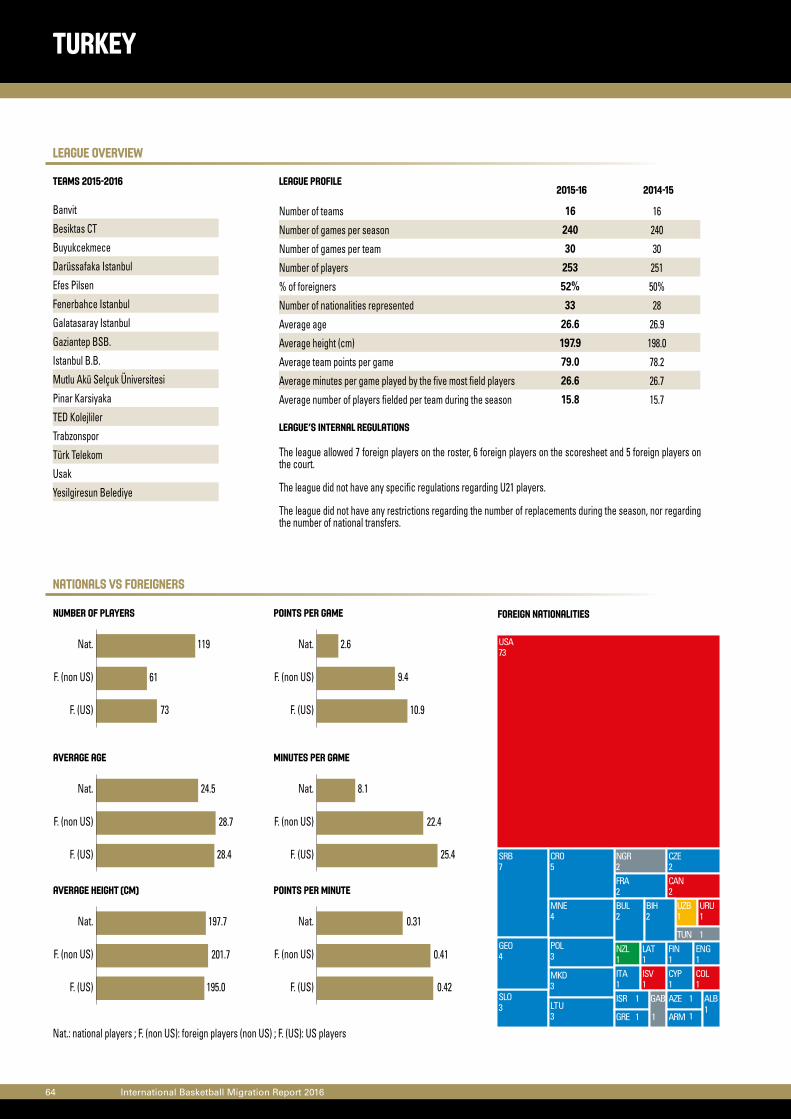
League overview
NationalS vs Foreigners
64 International Basketball Migration Report 2016
Banvit
Besiktas CT
Buyukcekmece
Darüssafaka Istanbul
Efes Pilsen
Fenerbahce Istanbul
Galatasaray Istanbul
Gaziantep BSB.
Istanbul B.B.
Mutlu Akü Selçuk Üniversitesi
Pinar Karsiyaka
TED Kolejliler
Trabzonspor
Türk Telekom
Usak
Yesilgiresun Belediye
TURKEY
Teams 2015-2016 League profile
League’s internal regulations
Nat.: national players ; F. (non US): foreign players (non US) ; F. (US): US players
Points per game
F. (US)
F. (non US)
Nat.
10.9
9.4
2.6
Average age
F. (US)
F. (non US)
Nat.
28.4
28.7
24.5
Minutes per game
F. (US)
F. (non US)
Nat.
25.4
22.4
8.1
Average height (cm)
F. (US)
F. (non US)
Nat.
195.0
201.7
197.7
Points per minute
F. (US)
F. (non US)
Nat.
0.42
0.41
0.31
Number of players
F. (US)
F. (non US)
Nat.
73
61
119
Number of teams 16 16
Number of games per season 240 240
Number of games per team 30 30
Number of players 253 251
% of foreigners 52% 50%
Number of nationalities represented 33 28
Average age 26.6 26.9
Average height (cm) 197.9 198.0
Average team points per game 79.0 78.2
Average minutes per game played by the five most field players 26.6 26.7
Average number of players fielded per team during the season 15.8 15.7
2015-16 2014-15
The league allowed 7 foreign players on the roster, 6 foreign players on the scoresheet and 5 foreign players on the court.
The league did not have any specific regulations regarding U21 players.
The league did not have any restrictions regarding the number of replacements during the season, nor regarding the number of national transfers.
foreign nationalities
UZB1
USA73
URU1
TUN
SRB7
SLO3
POL3
NZL1
NGR2
MNE4
MKD3
LTU3
LAT1
ITA1
ISV1
ISR 1
GRE 1
GEO4
GAB
1
FRA2
FIN1
ENG1
CZE2
CYP1
CRO5
COL1
CAN2
BUL2
BIH2
AZE 1
ARM 1
ALB1
1
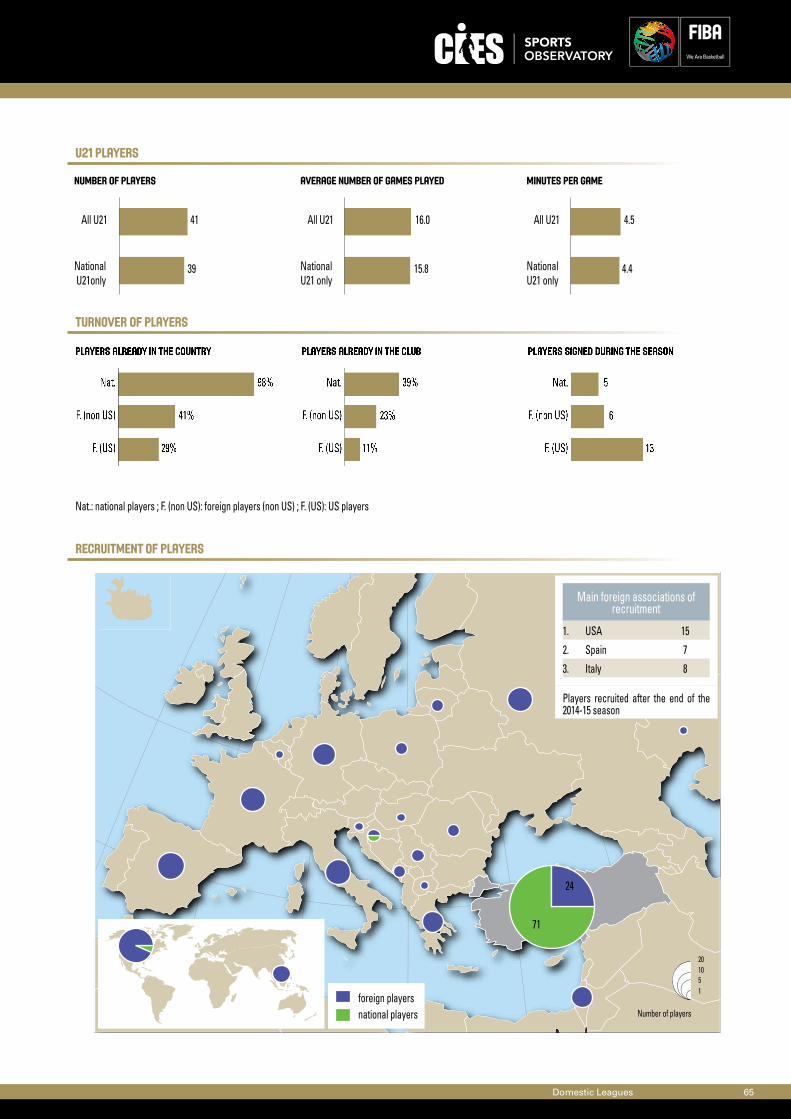
U21 players
Turnover of players
recruitment of players
Domestic Leagues 65
national playersforeign players
Number of players
201051
24
71
Nat.: national players ; F. (non US): foreign players (non US) ; F. (US): US players
Number of players
NationalU21only
All U21 41
39
Average number of games played
NationalU21 only
All U21 16.0
15.8
Minutes per game
NationalU21 only
All U21 4.5
4.4
Players signed during the season
F. (US)
F. (non US)
Nat.
13
6
5
Players already in the country
F. (US)
F. (non US)
Nat.
29%
41%
98%
Players already in the club
F. (US)
F. (non US)
Nat.
11%
23%
39%
Main foreign associations of recruitment
1. USA 15
2. Spain 7
3. Italy 8
Players recruited after the end of the 2014-15 season
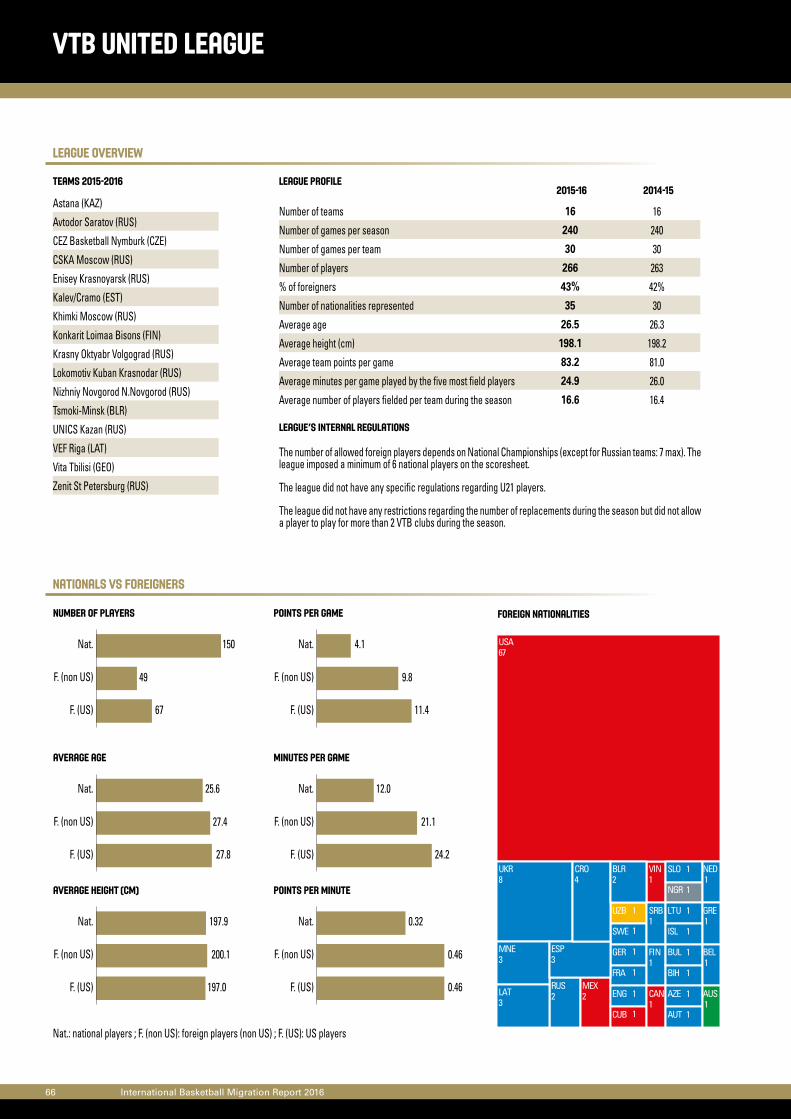
League overview
NationalS vs Foreigners
66 International Basketball Migration Report 2016
Astana (KAZ)
Avtodor Saratov (RUS)
CEZ Basketball Nymburk (CZE)
CSKA Moscow (RUS)
Enisey Krasnoyarsk (RUS)
Kalev/Cramo (EST)
Khimki Moscow (RUS)
Konkarit Loimaa Bisons (FIN)
Krasny Oktyabr Volgograd (RUS)
Lokomotiv Kuban Krasnodar (RUS)
Nizhniy Novgorod N.Novgorod (RUS)
Tsmoki-Minsk (BLR)
UNICS Kazan (RUS)
VEF Riga (LAT)
Vita Tbilisi (GEO)
Zenit St Petersburg (RUS)
vtb uNITED LEAGUE
Teams 2015-2016 League profile
League’s internal regulations
Nat.: national players ; F. (non US): foreign players (non US) ; F. (US): US players
Points per game
F. (US)
F. (non US)
Nat.
11.4
9.8
4.1
Average age
F. (US)
F. (non US)
Nat.
27.8
27.4
25.6
Minutes per game
F. (US)
F. (non US)
Nat.
24.2
21.1
12.0
Average height (cm)
F. (US)
F. (non US)
Nat.
197.0
200.1
197.9
Points per minute
F. (US)
F. (non US)
Nat.
0.46
0.46
0.32
Number of players
F. (US)
F. (non US)
Nat.
67
49
150
Number of teams 16 16
Number of games per season 240 240
Number of games per team 30 30
Number of players 266 263
% of foreigners 43% 42%
Number of nationalities represented 35 30
Average age 26.5 26.3
Average height (cm) 198.1 198.2
Average team points per game 83.2 81.0
Average minutes per game played by the five most field players 24.9 26.0
Average number of players fielded per team during the season 16.6 16.4
2015-16 2014-15
The number of allowed foreign players depends on National Championships (except for Russian teams: 7 max). The league imposed a minimum of 6 national players on the scoresheet.
The league did not have any specific regulations regarding U21 players.
The league did not have any restrictions regarding the number of replacements during the season but did not allow a player to play for more than 2 VTB clubs during the season.
foreign nationalities
VIN1
UZB 1
USA67
UKR8
SWE 1
SRB1
SLO 1
RUS2
NGR 1
NED1
MNE3
MEX2
LTU 1
LAT3
ISL 1
GRE1
GER 1
FRA 1
FIN1
ESP3
ENG 1
CUB 1
CRO4
CAN1
BUL 1
BLR2
BIH 1
BEL1
AZE 1
AUT 1
AUS1
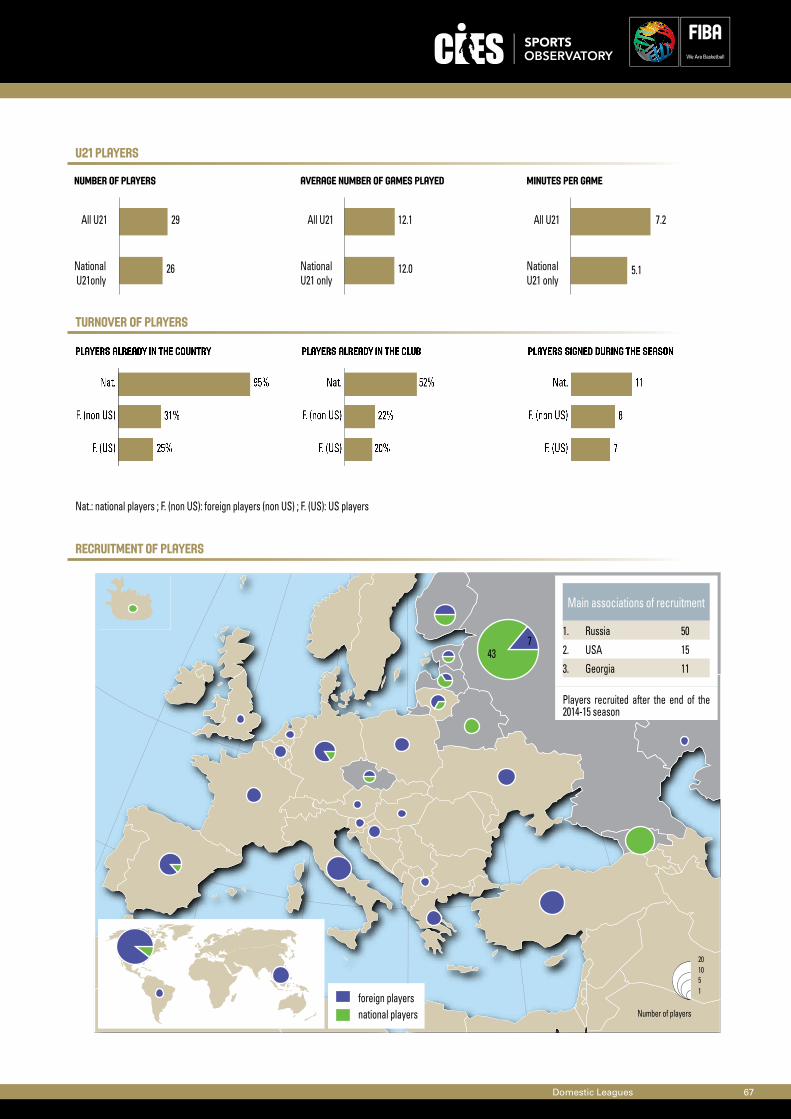
U21 players
Turnover of players
recruitment of players
Domestic Leagues 67
national playersforeign players
Number of players
201051
743
Nat.: national players ; F. (non US): foreign players (non US) ; F. (US): US players
Main associations of recruitment
1. Russia 50
2. USA 15
3. Georgia 11
Number of players
NationalU21only
All U21 29
26
Average number of games played
NationalU21 only
All U21 12.1
12.0
Minutes per game
NationalU21 only
All U21 7.2
5.1
Players signed during the season
F. (US)
F. (non US)
Nat.
7
8
11
Players already in the country
F. (US)
F. (non US)
Nat.
25%
31%
95%
Players already in the club
F. (US)
F. (non US)
Nat.
20%
22%
52%
Players recruited after the end of the 2014-15 season
© NBAE/Getty Images
© WNBAE/Getty Images

International leagues2015/2016
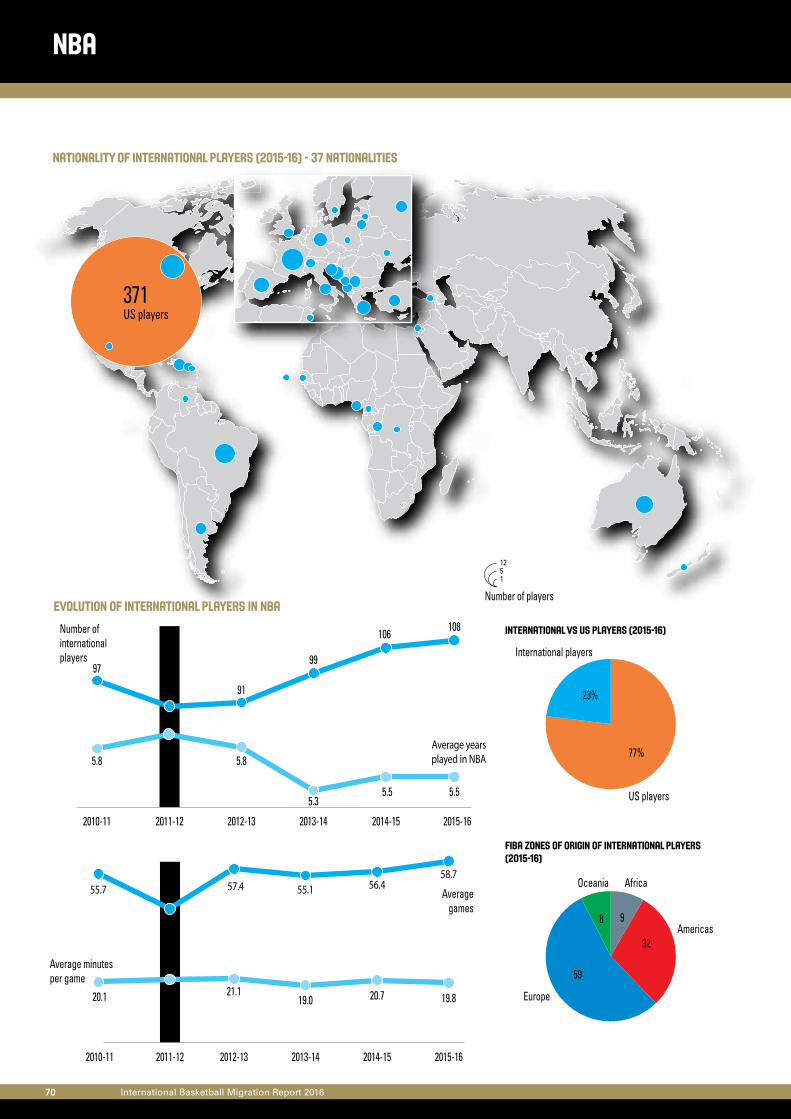
70 International Basketball Migration Report 201670
1251
Number of players
371US players
nationality of international players (2015-16) - 37 nationalities
NBA
EVOLUTION of international players in NBA
lockou
t
2010-11 2011-12 2012-13 2013-14 2014-15 2015-16
97
5.8
90
5.9
91
5.8
5.3
99
106108
5.5 5.5
Average yearsplayed in NBA
Number of international players
lockou
t
2010-11 2011-12 2012-13 2013-14 2014-15 2015-16
20.1 20.9 21.119.0 20.7 19.8
Averagegames
Average minutesper game
55.7
44.2
57.4 55.1 56.458.7
23%
International players
US players
77%
8 9
32
59
Americas
AfricaOceania
Europe
International vs US players (2015-16)
FIBA zones of origin of international players (2015-16)
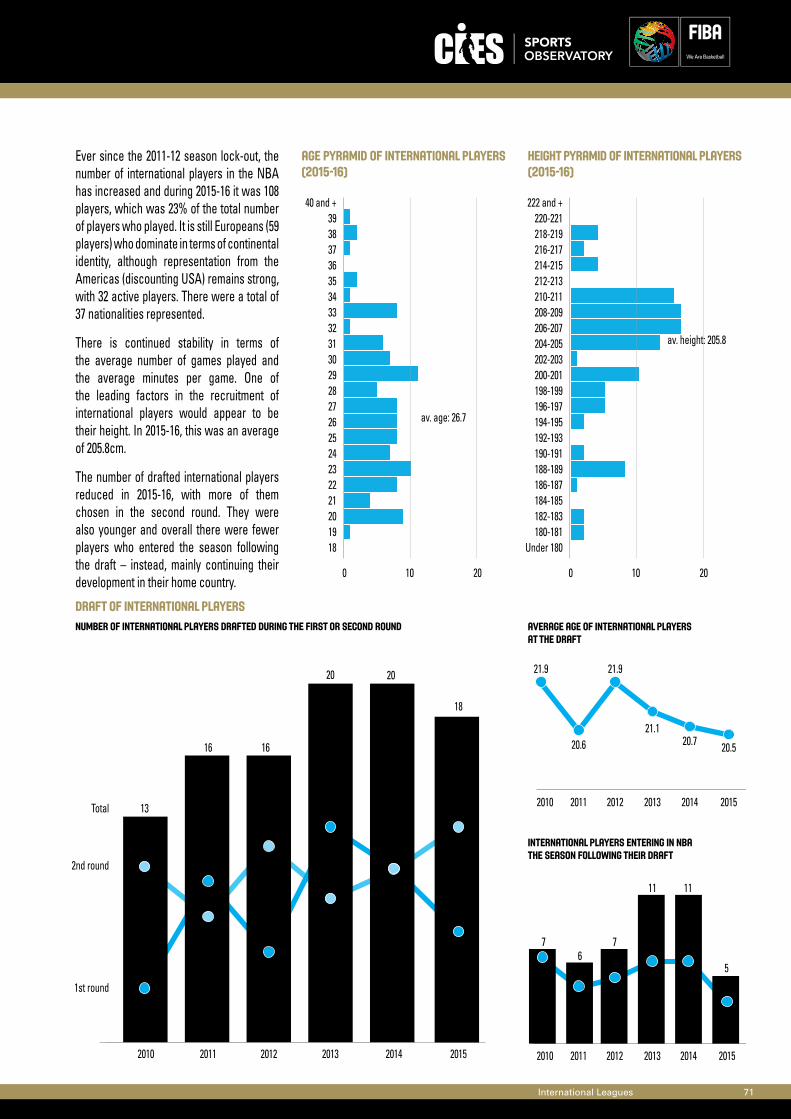
International Leagues 71
DRAFT of international players
age pyramiD of international players (2015-16)
height pyramiD of international players (2015-16)
18
0 10 20
192021222324252627282930313233343536373839
40 and +
av. age: 26.7
Under 180
0 10 20
180-181182-183184-185186-187188-189190-191192-193194-195196-197198-199200-201202-203204-205206-207208-209210-211212-213214-215216-217218-219220-221
222 and +
av. height: 205.8
2010 2011 2012 2013 2014 2015
31st round
2nd round
Total
10
13
9
7
16
5
11
16
12
10
8
12
6
20
18
20
2010 2011 2012 2013 2014 201519
21
23
21.9
20.6
21.9
21.120.7 20.5
2010 2011 2012 2013 2014 20150
50
100
58%
76
7
11 11
5
38%44%
55% 55%
28%
0.0
5.5
11.0
Average age of international players at the draft
international players entering in NBA the season following their draft
number of international players drafted during the first or second round
Ever since the 2011-12 season lock-out, the number of international players in the NBA has increased and during 2015-16 it was 108 players, which was 23% of the total number of players who played. It is still Europeans (59 players) who dominate in terms of continental identity, although representation from the Americas (discounting USA) remains strong, with 32 active players. There were a total of 37 nationalities represented.
There is continued stability in terms of the average number of games played and the average minutes per game. One of the leading factors in the recruitment of international players would appear to be their height. In 2015-16, this was an average of 205.8cm.
The number of drafted international players reduced in 2015-16, with more of them chosen in the second round. They were also younger and overall there were fewer players who entered the season following the draft – instead, mainly continuing their development in their home country.
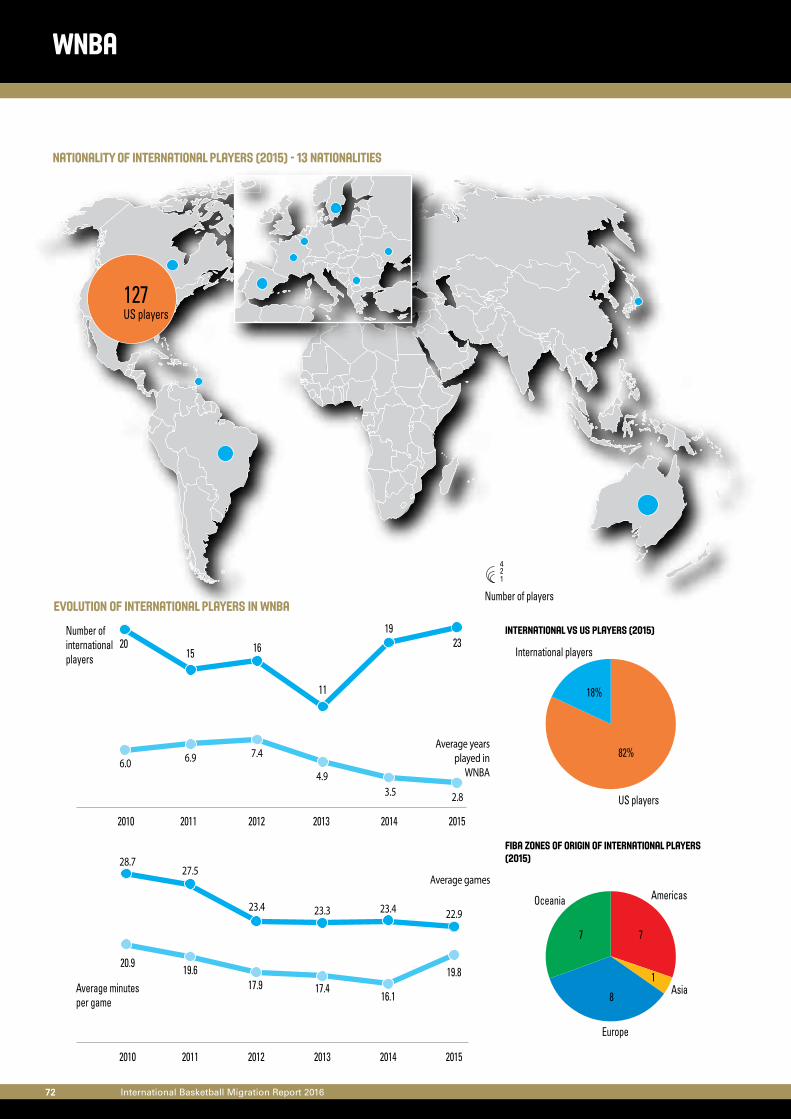
72 International Basketball Migration Report 201672
127US players
24
1
Number of players
nationality of international players (2015) - 13 nationalities
wNBA
EVOLUTION of international players in wNBA
2010 2011 2012 2013 2014 2015
2015 16
11
19
Average yearsplayed in
WNBA
Number of international players
6.0 6.9 7.4
4.93.5
23
2.8
2010 2011 2012 2013 2014 2015
20.9 19.617.9 17.4
16.1
19.8
Average games
Average minutesper game
28.727.5
23.4 23.3 23.4 22.9
18%
International players
US players
82%
7 7
1
8
AmericasOceania
Europe
Asia
International vs US players (2015)
FIBA zones of origin of international players (2015)
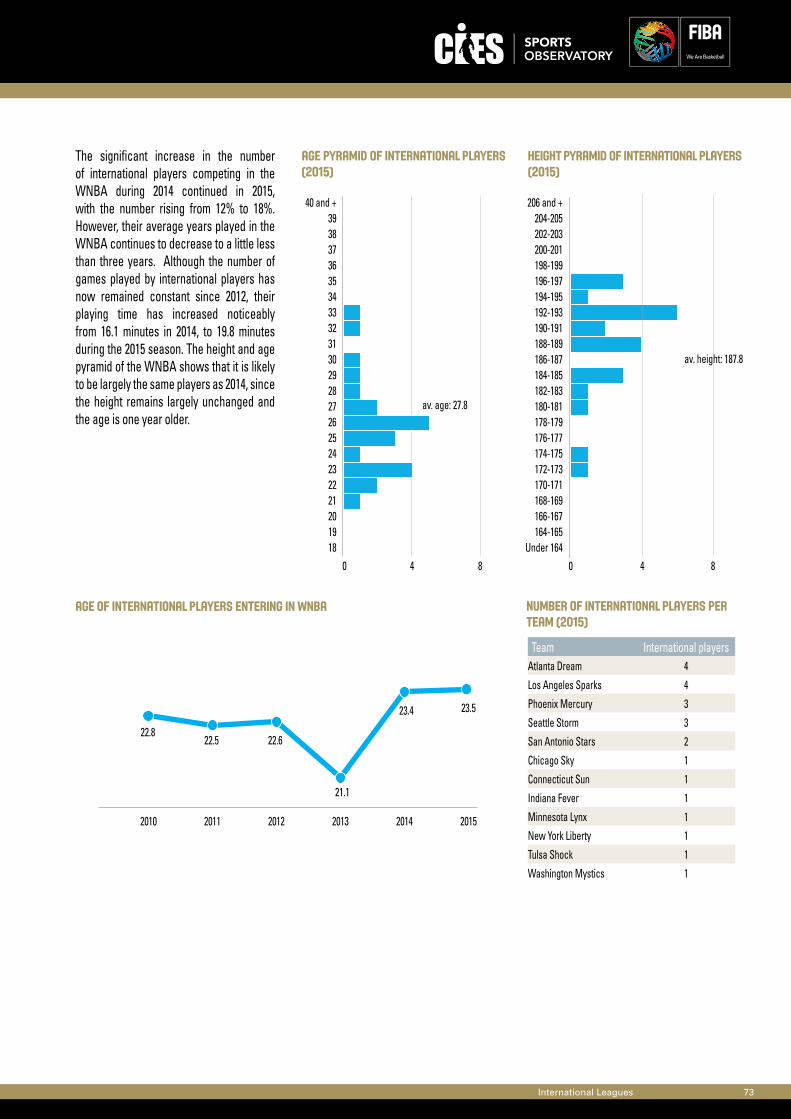
International Leagues 73
Age of international players entering in WNBA number of International players per Team (2015)
180 4 8
192021222324252627282930313233343536373839
40 and +
av. age: 27.8
Under 164164-165166-167168-169170-171172-173174-175176-177178-179180-181182-183184-185186-187188-189190-191192-193194-195196-197198-199200-201202-203204-205
206 and +
av. height: 187.8
0 4 8
Team International playersAtlanta Dream 4
Los Angeles Sparks 4
Phoenix Mercury 3
Seattle Storm 3
San Antonio Stars 2
Chicago Sky 1
Connecticut Sun 1
Indiana Fever 1
Minnesota Lynx 1
New York Liberty 1
Tulsa Shock 1
Washington Mystics 1
2010 2011 2012 2013 2014 2015
22.822.5 22.6
23.4 23.5
21.1
age pyramiD of international players (2015)
height pyramiD of international players (2015)
The significant increase in the number of international players competing in the WNBA during 2014 continued in 2015, with the number rising from 12% to 18%. However, their average years played in the WNBA continues to decrease to a little less than three years. Although the number of games played by international players has now remained constant since 2012, their playing time has increased noticeably from 16.1 minutes in 2014, to 19.8 minutes during the 2015 season. The height and age pyramid of the WNBA shows that it is likely to be largely the same players as 2014, since the height remains largely unchanged and the age is one year older.
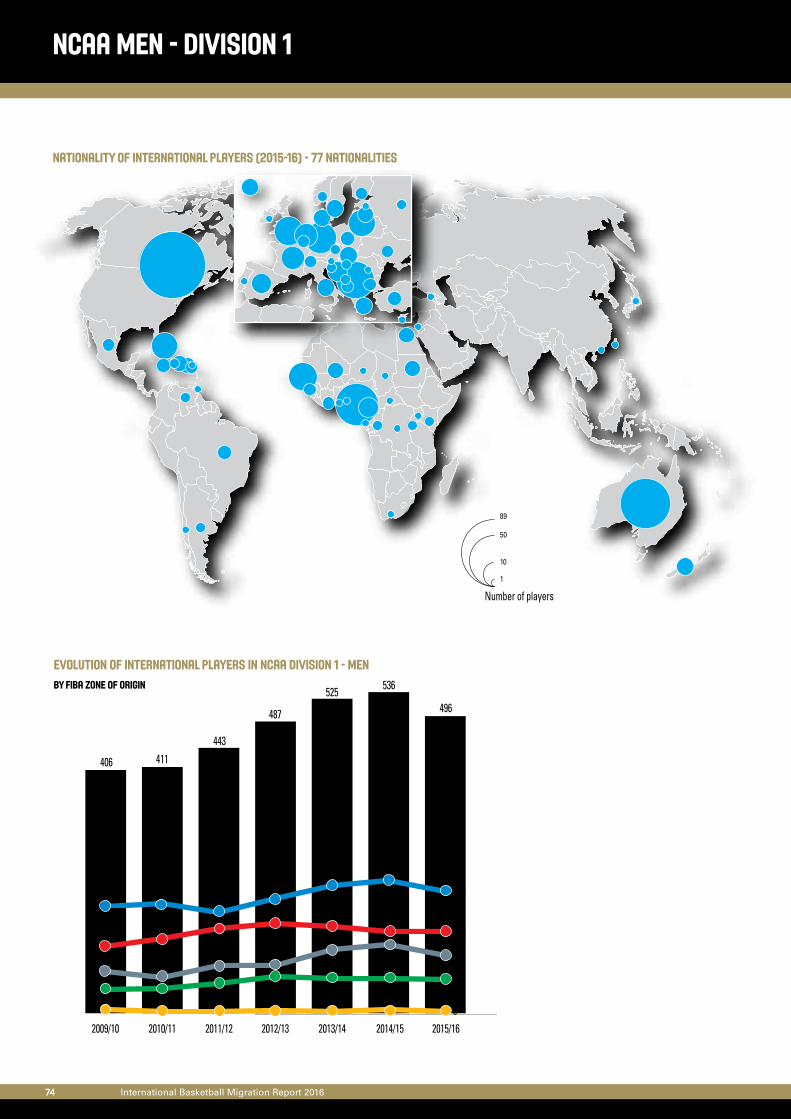
74 International Basketball Migration Report 201674
2009/10 2010/11 2011/12 2012/13 2013/14 2014/15 2015/16
204
487
525 536
496
443411406
136
96
57
3
EVOLUTION of international players in NCAA division 1 - men
nationality of INTERNATIONAL players (2015-16) - 77 nationalities
10
50
89
1
Number of players
NCAA Men - division 1
by FIBA ZONE OF ORIGIN
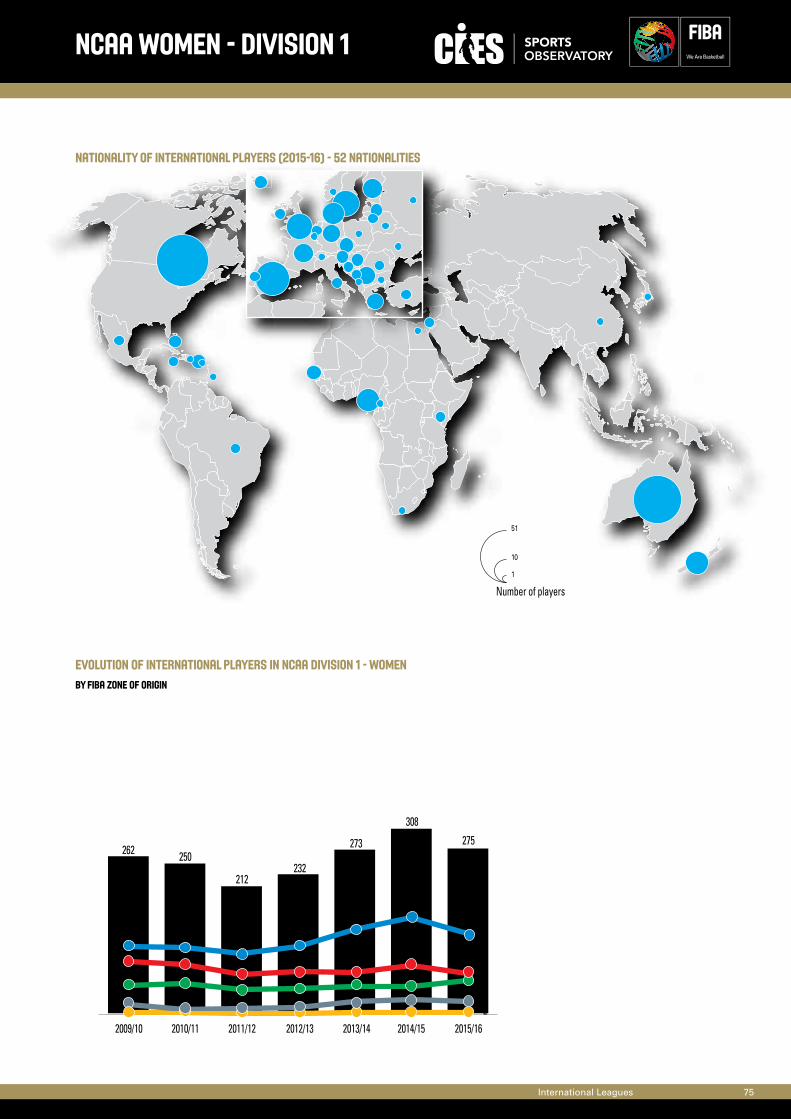
International Leagues 75
2010/112009/10 2011/12 2012/13 2013/14 2014/15 2015/16
67
232
273
308
275
212
250262
133
54192
10
51
1
Number of players
EVOLUTION of international players in NCAA division 1 - women
nationality of INTERNATIONAL players (2015-16) - 52 nationalities
NCAA WoMen - Division 1
by FIBA ZONE OF ORIGIN
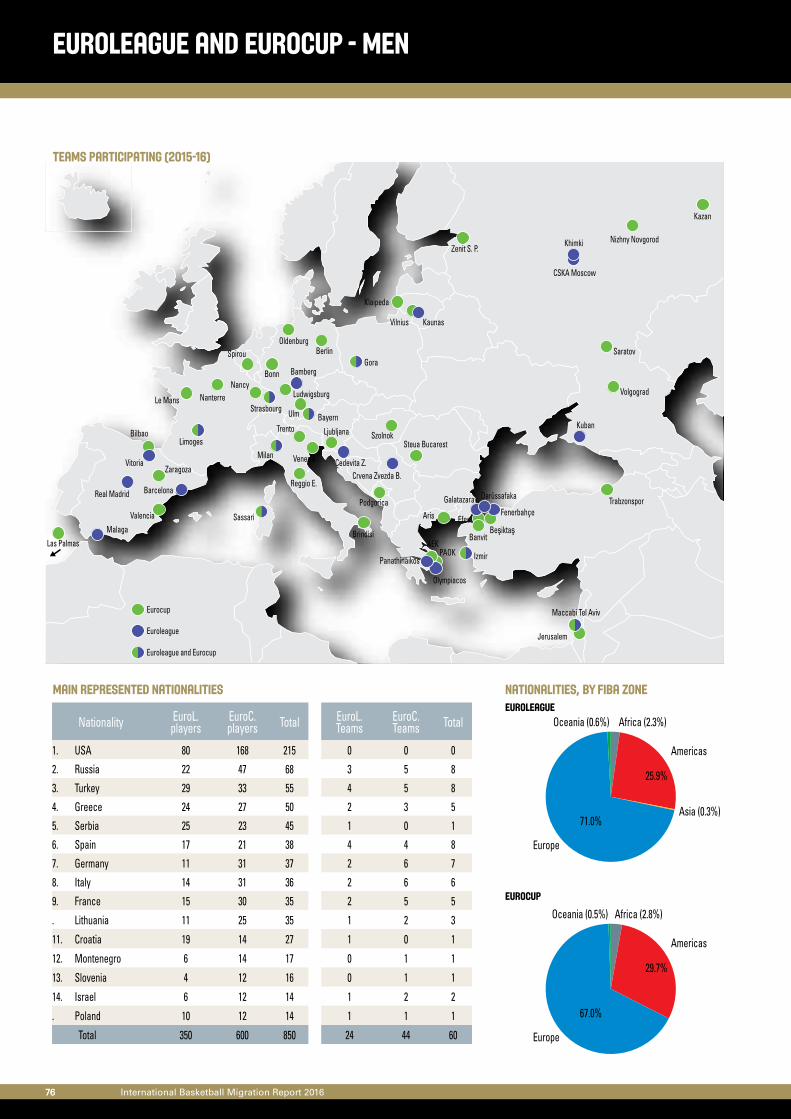
76 International Basketball Migration Report 201676
Euroleague and Eurocup - Men
Teams participating (2015-16)
Main represented nationalities Nationalities, by fiba zone
Nationality EuroL.players
EuroC. players Total EuroL.
TeamsEuroC.Teams Total
1. USA 80 168 215 0 0 0
2. Russia 22 47 68 3 5 8
3. Turkey 29 33 55 4 5 8
4. Greece 24 27 50 2 3 5
5. Serbia 25 23 45 1 0 1
6. Spain 17 21 38 4 4 8
7. Germany 11 31 37 2 6 7
8. Italy 14 31 36 2 6 6
9. France 15 30 35 2 5 5
. Lithuania 11 25 35 1 2 3
11. Croatia 19 14 27 1 0 1
12. Montenegro 6 14 17 0 1 1
13. Slovenia 4 12 16 0 1 1
14. Israel 6 12 14 1 2 2
. Poland 10 12 14 1 1 1
Total 350 600 850 24 44 60
Euroleague
Eurocup
25.9%
71.0%
Oceania (0.6%)
Europe
Asia (0.3%)
Americas
Africa (2.3%)
29.7%
67.0%
Oceania (0.5%)
Europe
Americas
Africa (2.8%)
Eurocup
Euroleague
Euroleague and Eurocup
Galatazaray
BanvitBeşiktaş
Trabzonspor
Reggio E.
Venezia
Brindisi
Trento
Bonn
Ludwigsburg
Ulm
BerlinOldenburg
Le Mans NanterreNancy
Saratov
Nizhny Novgorod
Kazan
Las Palmas
Zaragoza
Valencia
Bilbao
Klaipeda
Jerusalem
Spirou
Szolnok
Podgorica
Steua Bucarest
Vilnius
PAOKAEK
Aris
Zenit S. P.
Volgograd
Ljubljana
FenerbahçeEfes
Darüssafaka
Izmir
Olympiacos
Panathinaikos
Milan
Sassari
Bamberg
Bayern
Limoges
Strasbourg
Gora
Khimki
CSKA Moscow
Kuban
Vitoria
Malaga
BarcelonaReal Madrid
Kaunas
Maccabi Tel Aviv
Cedevita Z.Crvena Zvezda B.
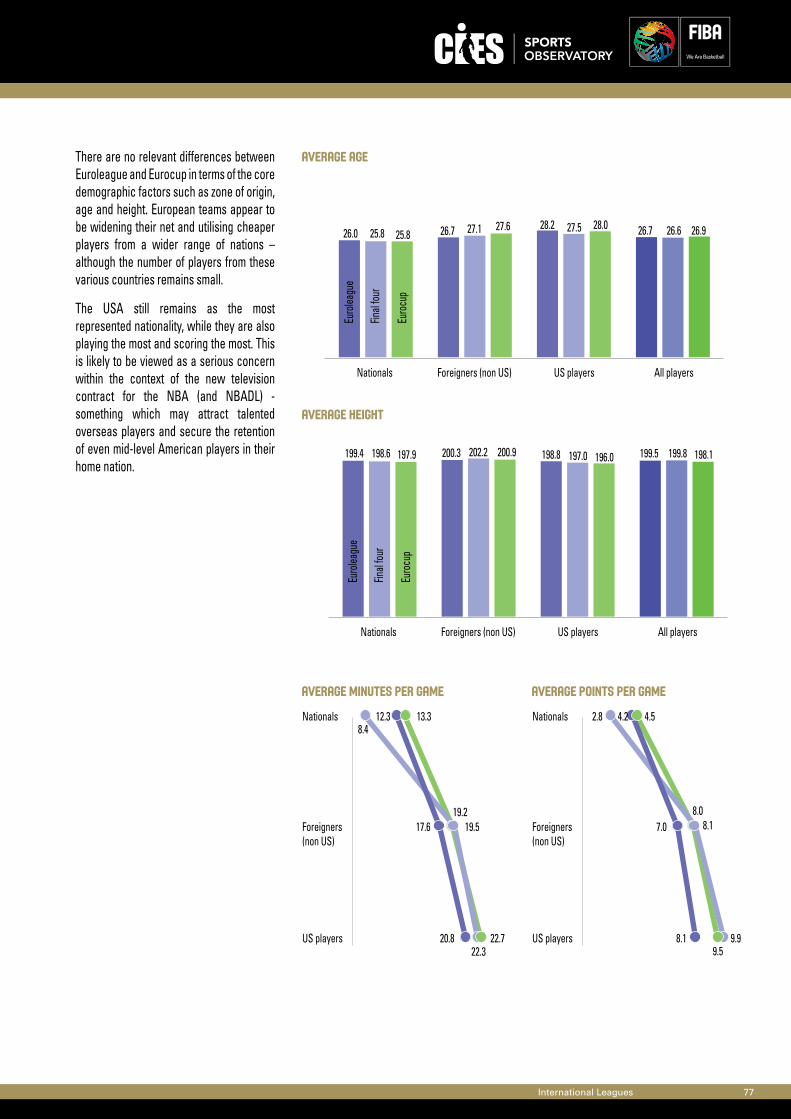
International Leagues 77
Average age
average Height
Average Minutes per game Average points per game
Nationals Foreigners (non US) US players All players
25.825.826.0 27.627.126.7 28.027.528.2 26.926.626.7
Euro
leagu
e
Euro
cup
Final
four
Nationals Foreigners (non US) US players All players
197.9198.6199.4 200.9202.2200.3 196.0197.0198.8 198.1199.8199.5
Euro
leagu
e
Euro
cup
Final
four
Nationals
Foreigners(non US)
US players
12.38.4
17.619.2
20.8
13.3
19.5
22.722.3
Nationals
Foreigners(non US)
US players
4.22.8
7.0 8.1
8.1
4.5
8.0
9.99.5
There are no relevant differences between Euroleague and Eurocup in terms of the core demographic factors such as zone of origin, age and height. European teams appear to be widening their net and utilising cheaper players from a wider range of nations – although the number of players from these various countries remains small.
The USA still remains as the most represented nationality, while they are also playing the most and scoring the most. This is likely to be viewed as a serious concern within the context of the new television contract for the NBA (and NBADL) - something which may attract talented overseas players and secure the retention of even mid-level American players in their home nation.
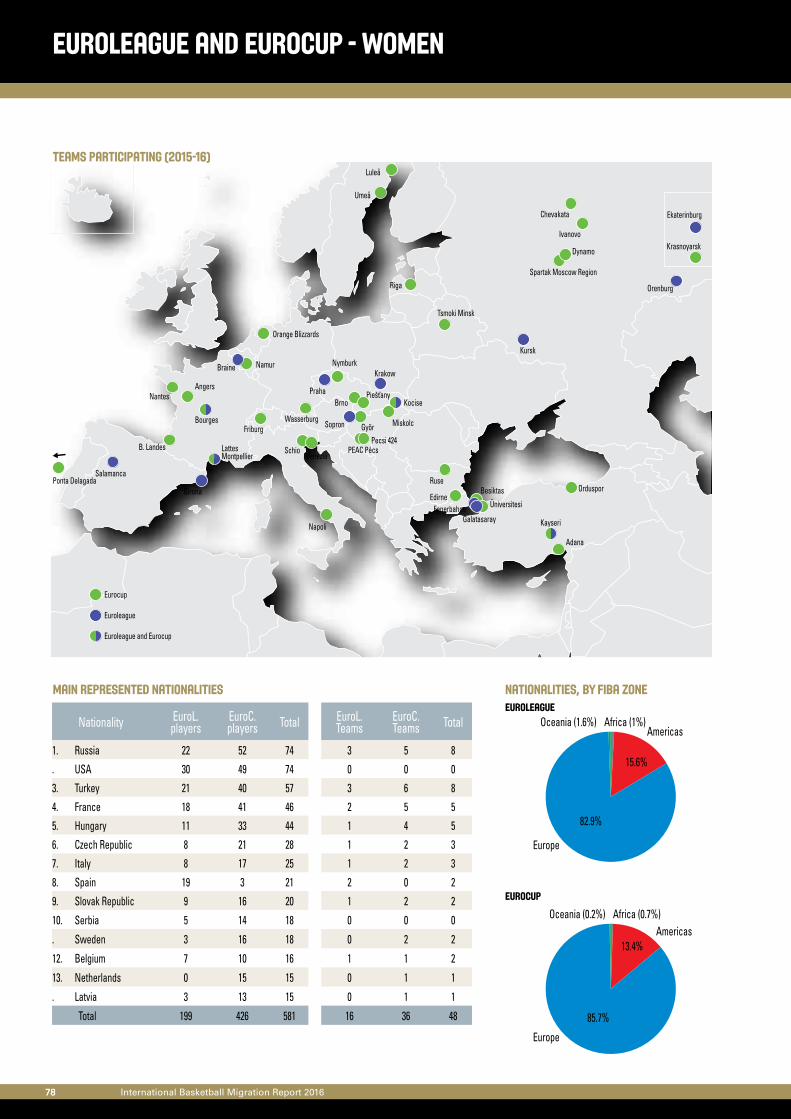
78 International Basketball Migration Report 201678
Euroleague and Eurocup - WOMen
Teams participating (2015-16)
Main represented nationalities Nationalities, by fiba zone
Nationality EuroL.players
EuroC. players Total EuroL.
TeamsEuroC.Teams Total
1. Russia 22 52 74 3 5 8
. USA 30 49 74 0 0 0
3. Turkey 21 40 57 3 6 8
4. France 18 41 46 2 5 5
5. Hungary 11 33 44 1 4 5
6. Czech Republic 8 21 28 1 2 3
7. Italy 8 17 25 1 2 3
8. Spain 19 3 21 2 0 2
9. Slovak Republic 9 16 20 1 2 2
10. Serbia 5 14 18 0 0 0
. Sweden 3 16 18 0 2 2
12. Belgium 7 10 16 1 1 2
13. Netherlands 0 15 15 0 1 1
. Latvia 3 13 15 0 1 1
Total 199 426 581 16 36 48
Euroleague
Eurocup
15.6%
82.9%
Oceania (1.6%) Africa (1%)
Europe
Americas
13.4%
85.7%
Oceania (0.2%)
Europe
AmericasAfrica (0.7%)
Eurocup
Euroleague
Euroleague and Eurocup
PEAC Pécs
Üniversitesi
Besiktas
Kocise
Kayseri
Tsmoki Minsk
Namur
Orange Blizzards
Ruse
Edirne
BrnoPraha Piešťany
Nymburk
Wasserburg
LattesMontpellier
Bourges
B. Landes
NantesAngers
Friburg Györ Miskolc
Pecsi 424Schio
Napoli
Venezia
Riga
Ponta Delagada
Spartak Moscow Region
Dynamo KrasnoyarskIvanovo
Chevakata
Umeå
Luleå
Orduspor
Adana
Braine
Salamanca
Girona
Sopron
Krakow
Orenburg
Ekaterinburg
Kursk
FenerbahçeGalatasaray
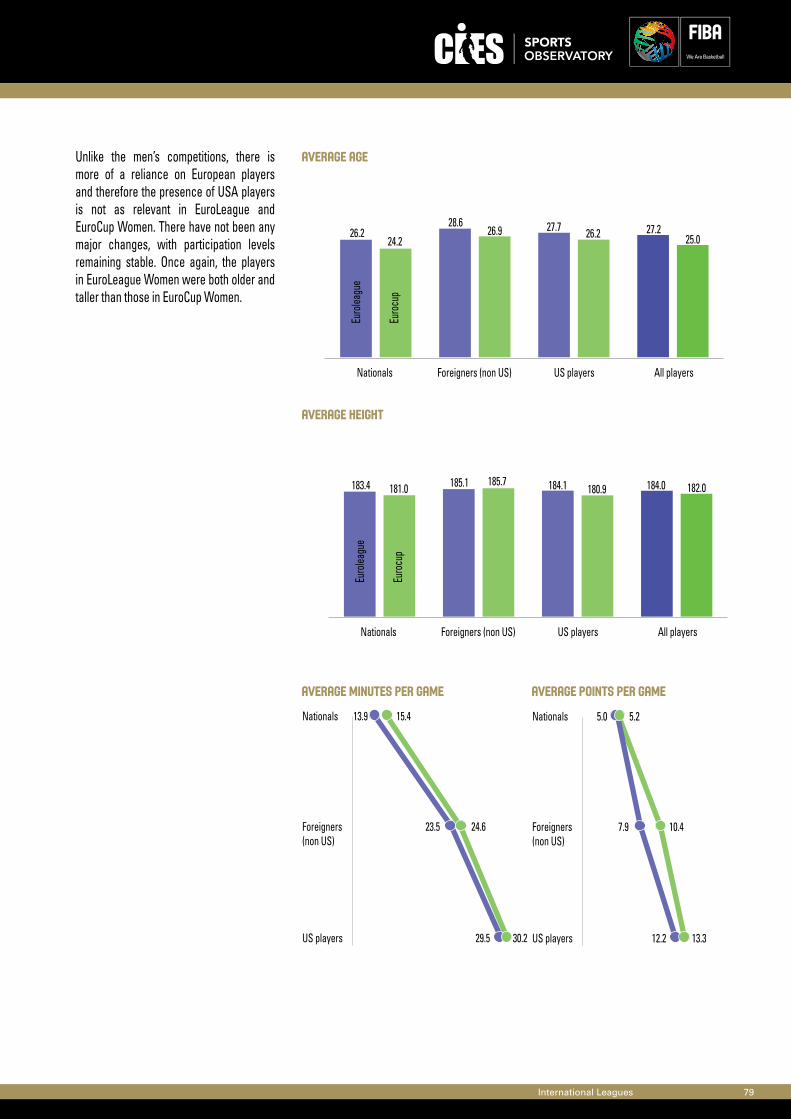
International Leagues 79
Average age
average Height
Average Minutes per game Average points per game
Nationals Foreigners (non US) US players All players
24.226.2 26.9
28.626.227.7
25.027.2
Euro
leagu
e
Euro
cup
Nationals Foreigners (non US) US players All players
181.0183.4 185.7185.1 180.9184.1 182.0184.0
Euro
leagu
e
Euro
cup
Nationals
Foreigners(non US)
US players
5.0 5.2
7.9
12.2
10.4
13.3
Nationals
Foreigners(non US)
US players
13.9
23.5
29.5
15.4
24.6
30.2
Unlike the men’s competitions, there is more of a reliance on European players and therefore the presence of USA players is not as relevant in EuroLeague and EuroCup Women. There have not been any major changes, with participation levels remaining stable. Once again, the players in EuroLeague Women were both older and taller than those in EuroCup Women.
Abstract
A collaboration between the CIES Sports Observatory academic team and FIBA, the International Basketball Migration Report provides a detailed analysis of official data on international transfers
for the period between July 2015 and June 2016.
The 80-page illustrated report outlines market trends and highlights new challenges within the field of basketball transfers and migration.
International Basketball Migration Report 2016
CIES OBSERVATORYAvenue DuPeyrou 12000 NeuchâtelSwitzerlandcies.ch
Tel: +41 22 545 00 00Fax: +41 22 545 00 99
FIBA - International Basketball Federation5, Route Suisse, PO Box 291295 MiesSwitzerlandfiba.com