INTERNATIONAL ATOMIC ENERGY AGENCY … Reports SeriEs No.479 INTERNATIONAL ATOMIC ENERGY AGENCY...
228
Technical Reports SeriEs No. 479 Handbook of Parameter Values for the Prediction of Radionuclide Transfer to Wildlife
Transcript of INTERNATIONAL ATOMIC ENERGY AGENCY … Reports SeriEs No.479 INTERNATIONAL ATOMIC ENERGY AGENCY...

Technical Reports SeriEs No. 479
INTERNATIONAL ATOMIC ENERGY AGENCYVIENNA
ISBN 978–92–0–100714–8ISSN 0074–1914
There is a well developed system of radiological protection of humans which has been implicitly providing protection to the environment for most exposure scenarios. A complementary systematic framework for radiological protection of the environment, specifically considering exposure of wildlife, only began to evolve over the past decade and is now incorporated in the recommendations of the International Commission on Radiological Protection and is taken into account in IAEA safety standards. For many years, the IAEA has supported efforts to develop models for radiological assessments for members of the public, and for flora and fauna. The most common approach to estimate radionuclide transfer to wildlife is to use a ‘concentration ratio’ to predict the activity concentration of a radionuclide in the whole organism from the activity concentration in the soil, sediment, water or air. This handbook provides generic transfer parameters in the form of concentration ratio values for use in assessment of ionizing radiation exposure to wildlife as a consequence of the presence of radionuclides in the environment.
H a n d b o o k o f P a r a m e t e r V a l u e s
f o r t h e P r e d i c t i o n o f R a d i o n u c l i d e T r a n s f e r
t o W i l d l i f e
Handbook of Param
eter Values for the Prediction of Radionuclide Transfer to Wildlife
technical repor
tS series no. 479
14-02111_PUBDOC479_cover.indd 1-3 2014-08-26 09:08:57

IAEA SAFETY STANDARDS AND RELATED PUBLICATIONS
IAEA SAFETY STANDARDS
Under the terms of Article III of its Statute, the IAEA is authorized to establish or adopt standards of safety for protection of health and minimization of danger to life and property, and to provide for the application of these standards.
The publications by means of which the IAEA establishes standards are issued in the IAEA Safety Standards Series. This series covers nuclear safety, radiation safety, transport safety and waste safety. The publication categories in the series are Safety Fundamentals, Safety Requirements and Safety Guides.
Information on the IAEA’s safety standards programme is available on the IAEA Internet site
http://www-ns.iaea.org/standards/
The site provides the texts in English of published and draft safety standards. The texts of safety standards issued in Arabic, Chinese, French, Russian and Spanish, the IAEA Safety Glossary and a status report for safety standards under development are also available. For further information, please contact the IAEA at: Vienna International Centre, PO Box 100, 1400 Vienna, Austria.
All users of IAEA safety standards are invited to inform the IAEA of experience in their use (e.g. as a basis for national regulations, for safety reviews and for training courses) for the purpose of ensuring that they continue to meet users’ needs. Information may be provided via the IAEA Internet site or by post, as above, or by email to Offi [email protected].
RELATED PUBLICATIONS
The IAEA provides for the application of the standards and, under the terms of Articles III and VIII.C of its Statute, makes available and fosters the exchange of information relating to peaceful nuclear activities and serves as an intermediary among its Member States for this purpose.
Reports on safety in nuclear activities are issued as Safety Reports, which provide practical examples and detailed methods that can be used in support of the safety standards.
Other safety related IAEA publications are issued as Emergency Preparedness and Response publications, Radiological Assessment Reports, the International Nuclear Safety Group’s INSAG Reports, Technical Reports and TECDOCs. The IAEA also issues reports on radiological accidents, training manuals and practical manuals, and other special safety related publications.
Security related publications are issued in the IAEA Nuclear Security Series.The IAEA Nuclear Energy Series comprises informational publications to encourage
and assist research on, and the development and practical application of, nuclear energy for peaceful purposes. It includes reports and guides on the status of and advances in technology, and on experience, good practices and practical examples in the areas of nuclear power, the nuclear fuel cycle, radioactive waste management and decommissioning.
RELATED PUBLICATIONS
www.iaea.org/books
GENERIC MODELS FOR USE IN ASSESSING THE IMPACT OF DISCHARGES OF RADIOACTIVE SUBSTANCES TO THE ENVIRONMENTSafety Reports Series No. 19 STI/PUB/1103 (216 pp.; 2001)ISBN 92–0–100501–6 Price: €51.00
SEDIMENT DISTRIBUTION COEFFICIENTS AND CONCENTRATION FACTORS FOR BIOTA IN THE MARINE ENVIRONMENTTechnical Reports Series No. 422STI/DOC/010/422 (95 pp.; 2004)ISBN 92–0–114403–2 Price: €19.00
HANDBOOK OF PARAMETER VALUES FOR THE PREDICTION OF RADIONUCLIDE TRANSFER IN TERRESTRIAL AND FRESHWATER ENVIRONMENTSTechnical Reports Series No. 472STI/DOC/010/472 (194 pp.; 2010)ISBN 978–92–0–113009–9 Price: €45.00
14-02111_PUBDOC479_cover.indd 4-6 2014-08-26 09:08:57

HANDBOOK OF PARAMETER VALUES FOR
THE PREDICTION OF RADIONUCLIDE TRANSFER
TO WILDLIFE

AFGHANISTANALBANIAALGERIAANGOLAARGENTINAARMENIAAUSTRALIAAUSTRIAAZERBAIJANBAHAMASBAHRAINBANGLADESHBELARUSBELGIUMBELIZEBENINBOLIVIABOSNIA AND HERZEGOVINABOTSWANABRAZILBRUNEI DARUSSALAMBULGARIABURKINA FASOBURUNDICAMBODIACAMEROONCANADACENTRAL AFRICAN
REPUBLICCHADCHILECHINACOLOMBIACONGOCOSTA RICACÔTE D’IVOIRECROATIACUBACYPRUSCZECH REPUBLICDEMOCRATIC REPUBLIC
OF THE CONGODENMARKDOMINICADOMINICAN REPUBLICECUADOREGYPTEL SALVADORERITREAESTONIAETHIOPIAFIJIFINLANDFRANCEGABONGEORGIAGERMANY
GHANAGREECEGUATEMALAHAITIHOLY SEEHONDURASHUNGARYICELANDINDIAINDONESIAIRAN, ISLAMIC REPUBLIC OF IRAQIRELANDISRAELITALYJAMAICAJAPANJORDANKAZAKHSTANKENYAKOREA, REPUBLIC OFKUWAITKYRGYZSTANLAO PEOPLE’S DEMOCRATIC
REPUBLICLATVIALEBANONLESOTHOLIBERIALIBYALIECHTENSTEINLITHUANIALUXEMBOURGMADAGASCARMALAWIMALAYSIAMALIMALTAMARSHALL ISLANDSMAURITANIA, ISLAMIC
REPUBLIC OFMAURITIUSMEXICOMONACOMONGOLIAMONTENEGROMOROCCOMOZAMBIQUEMYANMARNAMIBIANEPALNETHERLANDSNEW ZEALANDNICARAGUANIGERNIGERIANORWAY
OMANPAKISTANPALAUPANAMAPAPUA NEW GUINEAPARAGUAYPERUPHILIPPINESPOLANDPORTUGALQATARREPUBLIC OF MOLDOVAROMANIARUSSIAN FEDERATIONRWANDASAN MARINOSAUDI ARABIASENEGALSERBIASEYCHELLESSIERRA LEONESINGAPORESLOVAKIASLOVENIASOUTH AFRICASPAINSRI LANKASUDANSWAZILANDSWEDENSWITZERLANDSYRIAN ARAB REPUBLICTAJIKISTANTHAILANDTHE FORMER YUGOSLAV
REPUBLIC OF MACEDONIATOGOTRINIDAD AND TOBAGOTUNISIATURKEYUGANDAUKRAINEUNITED ARAB EMIRATESUNITED KINGDOM OF
GREAT BRITAIN AND NORTHERN IRELAND
UNITED REPUBLIC OF TANZANIA
UNITED STATES OF AMERICAURUGUAYUZBEKISTANVENEZUELA, BOLIVARIAN
REPUBLIC OFVIET NAMYEMENZAMBIAZIMBABWE
The following States are Members of the International Atomic Energy Agency:
The Agency’s Statute was approved on 23 October 1956 by the Conference on the Statute of the IAEA held at United Nations Headquarters, New York; it entered into force on 29 July 1957. The Headquarters of the Agency are situated in Vienna. Its principal objective is “to accelerate and enlarge the contribution of atomic energy to peace, health and prosperity throughout the world’’.

TECHNICAL REPORTS SERIES No. 479
HANDBOOK OF PARAMETER VALUES FOR
THE PREDICTION OF RADIONUCLIDE TRANSFER
TO WILDLIFE
INTERNATIONAL ATOMIC ENERGY AGENCYVIENNA, 2014

IAEA Library Cataloguing in Publication Data
Handbook of parameter values for the prediction of radionuclide transfer to wildlife. — Vienna : International Atomic Energy Agency, 2014.
p. ; 24 cm. — (Technical reports series, ISSN 0074–1914 ; no. 479)STI/DOC/010/479ISBN 978–92–0–100714–8Includes bibliographical references.
1. Radioisotopes — Migration — Mathematical models. 2. Radioisotopes — Environmenal aspects. 3. Radioactive pollution. I. International Atomic Energy Agency. II. Series: Technical reports series (International Atomic Energy Agency) ; 479.
IAEAL 14–00902
COPYRIGHT NOTICE
All IAEA scientific and technical publications are protected by the terms of the Universal Copyright Convention as adopted in 1952 (Berne) and as revised in 1972 (Paris). The copyright has since been extended by the World Intellectual Property Organization (Geneva) to include electronic and virtual intellectual property. Permission to use whole or parts of texts contained in IAEA publications in printed or electronic form must be obtained and is usually subject to royalty agreements. Proposals for non-commercial reproductions and translations are welcomed and considered on a case-by-case basis. Enquiries should be addressed to the IAEA Publishing Section at:
Marketing and Sales Unit, Publishing SectionInternational Atomic Energy AgencyVienna International CentrePO Box 1001400 Vienna, Austriafax: +43 1 2600 29302tel.: +43 1 2600 22417email: [email protected] http://www.iaea.org/books
© IAEA, 2014
Printed by the IAEA in AustriaJune 2014
STI/DOC/010/479

FOREWORD
For many years, the IAEA has published materials aimed at supporting the assessment of the impact of radioactive releases to the environment, including guidance on both the assessment of doses to members of the public and associated parameter values, and on potential impacts on other species.
In the context of dose assessments for members of the public, the IAEA published generic models and parameters for assessing the environmental transfer of radionuclides from routine releases in 1982 (IAEA Safety Series No. 57), followed by two major publications providing compilations of relevant parameter values: Sediment Kds and Concentration Factors for Radionuclides in the Marine Environment (Technical Reports Series No. 247, 1985) and Handbook of Parameter Values for the Prediction of Radionuclide Transfer in Temperate Environments (Technical Reports Series No. 364, 1994). In recent years, these books have been updated and superseded by: Generic Models for Use in Assessing the Impact of Discharges of Radioactive Substances to the Environment (Safety Reports Series No. 19, 2001), Sediment Distribution Coefficients and Concentration Factors for Biota in the Marine Environment (Technical Reports Series No. 422, 2004) and Handbook of Parameter Values for the Prediction of Radionuclide Transfer in Terrestrial and Freshwater Environments (Technical Reports Series No. 472, 2010).
The IAEA has played an instrumental role in the development of policies and assessment methods for evaluating potential impacts of radioactive releases on species other than humans, dating back to the 1970s. In 1979, the IAEA published Methodology for Assessing Impacts of Radioactivity on Aquatic Ecosystems (Technical Reports Series No. 190), followed in 1988 by Assessing the Impact of Deep Sea Disposal of Low Level Radioactive Waste on Living Marine Resources (Technical Reports Series No. 288). The impacts of radionuclide releases to terrestrial and freshwater environments were subsequently assessed as part of a consideration of the potential effects of ionizing radiation on plants and animals at levels implied by radiation protection standards in 1992 (Effects of Ionizing Radiation on Plants and Animals at Levels Implied by Current Radiation Protection Standards, Technical Reports Series No. 332). The IAEA has continued to work in this area, within the framework of the Environmental Modelling for Radiation Safety (EMRAS) programme, in the context of its coordination of international organizations with interests in environmental radiation protection, and through its ongoing development of related safety standards and supporting guidance.
This publication focuses on ‘concentration ratios’, which are one of the key parameter values for evaluating the transfer of radionuclides from environmental media (soil, air, water and sediments) to wildlife groups, for the
COPYRIGHT NOTICE
All IAEA scientific and technical publications are protected by the terms of the Universal Copyright Convention as adopted in 1952 (Berne) and as revised in 1972 (Paris). The copyright has since been extended by the World Intellectual Property Organization (Geneva) to include electronic and virtual intellectual property. Permission to use whole or parts of texts contained in IAEA publications in printed or electronic form must be obtained and is usually subject to royalty agreements. Proposals for non-commercial reproductions and translations are welcomed and considered on a case-by-case basis. Enquiries should be addressed to the IAEA Publishing Section at:
Marketing and Sales Unit, Publishing SectionInternational Atomic Energy AgencyVienna International CentrePO Box 1001400 Vienna, Austriafax: +43 1 2600 29302tel.: +43 1 2600 22417email: [email protected] http://www.iaea.org/books

purpose of assessing potential radiation dose rates and effects on wildlife. It is, therefore, analogous to Technical Reports Series No. 472, which presents transfer parameter values for use in assessments of doses to members of the public. The present publication contains mean transfer parameters and associated statistical distribution information. It also describes the approaches used to derive and collate these data and the main components of the models in which these data are used. Guidance on the application of these data and approaches for dealing with data gaps are also discussed. The transfer data presented in this publication are based on a comprehensive review of the available literature, including many publications in Russian not available in English. This review may, therefore, be considered to supersede previous reviews published by other organizations.
The current publication was prepared by the members of Working Group 5 of the EMRAS programme, chaired by B. Howard (United Kingdom), and with contributions from many other individuals and organizations convened to this work by the IAEA. The IAEA wishes to express its gratitude to all of the experts and institutions that contributed to this handbook, in particular, the International Union of Radioecology for its support, and the Environment Agency (of England and Wales), the Natural Environment Research Council of the United Kingdom and the Norwegian Radiation Protection Authority for the development of the on-line database used to collate the data presented in this publication. The IAEA officers responsible for this publication were D. Telleria and G. Pröhl of the Division of Radiation, Transport and Waste Safety.
EDITORIAL NOTE
Although great care has been taken to maintain the accuracy of information contained in this publication, neither the IAEA nor its Member States assume any responsibility for consequences which may arise from its use.
The use of particular designations of countries or territories does not imply any judgement by the publisher, the IAEA, as to the legal status of such countries or territories, of their authorities and institutions or of the delimitation of their boundaries.
The mention of names of specific companies or products (whether or not indicated as registered) does not imply any intention to infringe proprietary rights, nor should it be construed as an endorsement or recommendation on the part of the IAEA.
The IAEA has no responsibility for the persistence or accuracy of URLs for external or third party Internet web sites referred to in this book and does not guarantee that any content on such web sites is, or will remain, accurate or appropriate.

CONTENTS
1. INTRODUCTION . . . . . . . . . . . . . . . . . . . . . . . . . . . . . . . . . . . . . . . . 1
1.1. Background . . . . . . . . . . . . . . . . . . . . . . . . . . . . . . . . . . . . . . . . . 21.2. Objectives . . . . . . . . . . . . . . . . . . . . . . . . . . . . . . . . . . . . . . . . . . 51.3. Scope . . . . . . . . . . . . . . . . . . . . . . . . . . . . . . . . . . . . . . . . . . . . . 51.4. Structure . . . . . . . . . . . . . . . . . . . . . . . . . . . . . . . . . . . . . . . . . . . 6
2. CONCEPTS AND QUANTIFICATION . . . . . . . . . . . . . . . . . . . . . . . 6
2.1. Transfer processes and exposure pathways . . . . . . . . . . . . . . . . 62.1.1. Physical and chemical processes . . . . . . . . . . . . . . . . . . 62.1.2. Biological uptake . . . . . . . . . . . . . . . . . . . . . . . . . . . . . . 82.1.3. Exposure routes . . . . . . . . . . . . . . . . . . . . . . . . . . . . . . . 10
2.2. Current approaches to estimate transfers and exposures used in assessment models . . . . . . . . . . . . . . . . . . . . 102.2.1. Equilibrium concentration ratios . . . . . . . . . . . . . . . . . . 112.2.2. Specific activity approaches for 14C and 3H . . . . . . . . . . 13
3. COLLATION, TREATMENT AND EVALUATION OF DATA . . . . . 18
3.1. The wildlife transfer database. . . . . . . . . . . . . . . . . . . . . . . . . . . 183.2. Structure of the wildlife transfer database . . . . . . . . . . . . . . . . . 193.3. Calculation of the standard deviation of
the concentration ratio . . . . . . . . . . . . . . . . . . . . . . . . . . . . . . . . 203.4. Data entry issues . . . . . . . . . . . . . . . . . . . . . . . . . . . . . . . . . . . . . 263.5. Data transformations. . . . . . . . . . . . . . . . . . . . . . . . . . . . . . . . . . 283.6. Calculation of the summary concentration ratios . . . . . . . . . . . . 29
4. CONCENTRATION RATIO VALUES FOR WILDLIFE . . . . . . . . . 30
4.1. Concentration ratio tables for different environments . . . . . . . . 304.2. Application of the CRwo-media values . . . . . . . . . . . . . . . . . . . . . . 1174.3. Limitations of the existing database . . . . . . . . . . . . . . . . . . . . . . 118
5. APPROACHES FOR FILLING DATA GAPS . . . . . . . . . . . . . . . . . . 121
5.1. Surrogate organisms . . . . . . . . . . . . . . . . . . . . . . . . . . . . . . . . . . 1225.2. Phylogenetic relationships . . . . . . . . . . . . . . . . . . . . . . . . . . . . . 1225.3. Biogeochemical analogues and ionic potential . . . . . . . . . . . . . 123

5.4. Allometry . . . . . . . . . . . . . . . . . . . . . . . . . . . . . . . . . . . . . . . . . . 1235.5. Data from a different ecosystem . . . . . . . . . . . . . . . . . . . . . . . . . 1245.6. Use of published reviews . . . . . . . . . . . . . . . . . . . . . . . . . . . . . . 124
APPENDIX I: CONVERSION FACTORS FOR ASH OR DRY WEIGHT TO FRESH WEIGHT . . . . . . . . . . . . . . . . 127
APPENDIX II: CONVERSION FACTORS FOR TISSUE TO WHOLE ORGANISM . . . . . . . . . . . . . . . . . . . . . . . . . . . . 129
REFERENCES . . . . . . . . . . . . . . . . . . . . . . . . . . . . . . . . . . . . . . . . . . . . . . . 147
ANNEX: PUBLICATIONS USED TO BUILD THE CONCENTRATION RATIO TABLES . . . . . . . . . . . . . . 155
DEFINITIONS . . . . . . . . . . . . . . . . . . . . . . . . . . . . . . . . . . . . . . . . . . . . . . . 203CONTRIBUTORS TO DRAFTING AND REVIEW . . . . . . . . . . . . . . . . . . 209

1
1. INTRODUCTION
The potential impacts of releases of radionuclides to the environment are generally assessed by means of mathematical models that take account of the transfer of radionuclides through different compartments of the environment [1]. The reliability of the predictions of the models depends, among other things, on the quality of the data used to represent radionuclide transfer through the environment. Ideally, such data should be obtained by measurements made in the environment being assessed. However, this is often impracticable or overly costly and, thus, there is heavy reliance on data obtained from the literature.
The IAEA has, for many years, supported efforts to develop models for radiological assessments for members of the public [1, 2] and to assemble appropriate sets of transfer parameter data [3, 4]. In 2004, the IAEA published an updated collection of data relevant to transfer in the marine environment [5] and, in 2010, data for estimating radionuclide transfer in the terrestrial and freshwater environments [6]. These compilations draw upon data from many countries and have come to be regarded as providing international reference values.
The IAEA has also played an instrumental role in the development of policies and assessment methods for evaluating potential impacts of radioactive releases on species other than humans, dating back to the 1970s. In 1979, the IAEA published a methodology for assessing impacts of radioactivity in aquatic systems [7], followed by an assessment of the impact of deep sea disposal in 1988 [8]. The impacts of radionuclide releases to terrestrial and freshwater environments were subsequently assessed as part of a consideration of the potential effects of ionizing radiation on plants and animals at levels implied by radiation protection standards in 1992 [9]. More recently, the IAEA work in this area has involved cooperation with other international organizations with ongoing relevant programmes, notably the United Nations Scientific Committee on the Effects of Atomic Radiation, the International Commission on Radiological Protection (ICRP), the International Union of Radioecology and the European Commission. The IAEA has also established of a number of relevant working groups within the framework of the Environmental Modelling for Radiation Safety (EMRAS) programme.
The biota working group (BWG) was established during the first IAEA EMRAS Programme (2003–2007) to compare and improve the growing number of models and approaches used to estimate the exposure of wildlife (both plants and animals) to ionizing radiation. Through model testing and comparison using scenarios, the BWG demonstrated that the dosimetric components of the various models available gave broadly comparable results, but that differences in the transfer components used within the models resulted in large variations

2
in predicted whole organism activity concentrations and resultant internal doses [10–15]. These conclusions were supported by the outcome of the EURATOM PROTECT project [16], which compared the approaches available at the time [12, 17], and by the IAEA Coordination Group on Radiation Protection of the Environment [18]. The IAEA EMRAS BWG recommended that an international handbook on estimating transfer of radionuclides to wildlife, similar to Ref. [6], should be developed. In response, working group 5 was created within the EMRAS II Programme (2009–2011) to prepare this handbook of readily available quantitative information on the transfer of radionuclides to wildlife.
The use of concentration ratio values as a parameter to assess the transfer of radionuclides from environmental media to wildlife is a common approach in existing environmental exposure assessment models. To ensure adequate transparency, this handbook discusses the limitations of the concentration ratio values and the applicability of the data.
1.1. BACKGROUND
There is a well developed system of radiological protection of humans which has been implicitly providing protection to the environment for most exposure scenarios [19]. A systematic framework for radiological protection of the environment specifically considering exposure of wildlife1 has only begun to evolve in the past decade. Policies, principles and methodologies for environmental radiological protection have been and continue to be developed [21] to consider the radiological protection of the environment in more detail and, in some cases, to estimate the exposure of wildlife to ionizing radiation.
In 2007, the ICRP revised its recommendations and acknowledged the importance of protecting the environment and, in doing this, noted that the standards of environmental control in place for the general public in planned exposure situations would ensure that other species are not placed at risk [19]. However, the ICRP also acknowledged that some national authorities required direct, explicit demonstration that the environment is protected and proposed a framework based on the assessment of dose rates and effects to a number of
1 The term used to refer to species other than humans has varied over the years in ionizing radiation protection and radioecology literature. The following have been used: ‘plants and animals’ [9], ‘non-human species’ [20], ‘flora and fauna’ and ‘non-human biota’. These terms are rarely used in other areas of environmental protection. The term ‘wildlife’ is in general use and here refers to living species that are not domesticated and which exist in natural habitats.

3
reference organisms (reference animals and plants (RAPs)) [19, 22]. The ICRP’s stated aim is now that of:
“preventing or reducing the frequency of deleterious ionizing radiation effects in the environment to a level where they would have a negligible impact on the maintenance of biological diversity, the conservation of species, or the health and status of natural habitats, communities, and ecosystems” [19, 20].
The ICRP believes that its approach to environmental protection is commensurate with the overall level of risk, is compatible with other approaches being taken to protect the environment, and closely relates to the current system for human radiological protection [19, 20, 22].
The IAEA, in cooperation with a number of other international governmental organizations, has taken account of the revised recommendations of the ICRP in developing a revised version of the International Basic Safety Standards (BSS) [23]. The BSS also identify protection of the environment2 as an issue necessitating assessment, while allowing for flexibility in incorporating the results of environmental assessments into decision making processes and ensuring that the approaches adopted are commensurate with the radiation risks. Further guidance on the practical interpretation of the BSS requirements is under development by the IAEA.
Some Member States and regional organizations have also developed a range of approaches to address requirements in national legislation to demonstrate that the environment is protected from anthropogenic releases of radioactive substances [24–30].
In general terms, the assessment of the exposure of wildlife to ionizing radiation requires an approach that contains the following model components: (i) transfer of radionuclides to wildlife (including the physical transfer from the source of radioactivity through the relevant environmental medium) and; (ii) dose conversion coefficients relating internal and media activity concentrations to estimate absorbed dose rates to wildlife. The radiological risk to wildlife is then considered using knowledge of the biological effects of ionizing radiation [20, 31, 32].
2 Protection of the environment includes the protection and conservation of: non-human species, both animals and plants, and their biodiversity; environmental goods and services such as the production of food and feed; resources used in agriculture, forestry, fisheries and tourism; amenities used in spiritual, cultural and recreational activities; media such as soil, water and air; and natural processes such as carbon, nitrogen and water cycles.

4
The most common approach to estimate radionuclide transfer to wildlife is to use a ‘concentration ratio’ to predict the activity concentration of a radionuclide in the whole organism from the activity concentration in the soil, sediment, water or air. The assumption is that equilibrium exists between the activity concentrations in the organism as a whole and the environmental medium in which it resides. The validity of this assumption depends on factors such as the variation in the rate of release of radioactive substances from a given site, the biological half-life of the radionuclide in the organism and the exposure time.
In aquatic systems, sediment–water distribution coefficients (Kd) are used to predict concentrations in water or sediment from known concentrations in sediment or water, respectively. Previous IAEA publications have provided reviews of Kd values for marine [5] and freshwater ecosystems [6, 33]; thus, these values are not included in this handbook.
Commonly, the approach taken to address the wide range of different organisms is to use ‘reference organisms’, which have been defined as:
“a series of entities that provide a basis for the estimation of radiation dose rate to a range of organisms which are typical, or representative, of a contaminated environment. These estimates, in turn, would provide a basis for assessing the likelihood and degree of radiation effects” [34].
Slightly different terms and definitions are used by various groups [17], but the approaches adopted are generally similar. The selection of reference organisms may consider the need to encompass protected species, and different trophic levels and exposure pathways [20, 31, 35]. Reference organisms have tended to be defined at a broad wildlife group level (e.g. soil invertebrate, predatory fish, terrestrial mammal). In some cases, consideration of specific species has been included [27, 36].
The ICRP has established a group of 12 standardized reference organisms known as RAPs3 to relate exposure to dose and dose to effects within its framework [20]. Information on the ecological characteristics, dosimetry and radiation induced effects relevant to these RAPs is presented in ICRP Publication 108 [20].
In this handbook, the transfer of radionuclides to wildlife is quantified using a concentration ratio between the organism and its associated environmental
3 RAPs are defined by the ICRP as “A hypothetical entity, with the assumed basic biological characteristics of a particular type of animal or plant, as described to the generality of the taxonomic level of Family, with defined anatomical, physiological, and life-history properties, that can be used for the purposes of relating exposure to dose, and dose to effects, for that type of living organism”.

5
media. The term is defined more precisely in Section 2. Concentration ratios for the RAPs have been published recently [37] based on the same on-line database (Section 3) as that used for the CRwo-media tables presented here.
1.2. OBJECTIVES
This handbook is primarily intended to provide generic transfer parameters in the form of concentration ratio values for use in assessment of ionizing radiation exposure to wildlife as a consequence of the presence of radionuclides in the environment. These data are intended for use in situations in which site specific values are not available or are deemed not to be necessary. The generic concentration ratio values are based on the assumption that equilibrium exists between the activity concentrations in wildlife and the appropriate medium. This assumption does not apply directly to rapidly changing situations where an equilibrium has not been established and the limitations of their application would then need to be taken into account.
1.3. SCOPE
This handbook provides equilibrium concentration ratio values for wildlife groups in terrestrial, freshwater, marine and brackish4 water environments.
To provide comprehensive information suitable for different assessment approaches and purposes, both geometric and arithmetic means of concentration ratios are provided, where appropriate, for different wildlife groups together with associated estimates of standard deviation and ranges in observed values. These values may not be appropriate for certain cases needing detailed site specific assessments for which the collection of locally relevant data may be required. For transparency, the approaches used to derive and collate these data are presented. Guidance on the application of these data and approaches for coping with data gaps are discussed.
Available activity concentrations and/or concentration ratios for many radionuclides are often reported for specific tissues and not the whole organism. To enable such data to be converted to appropriate values for the whole organism, for the purposes of wildlife assessment, tables of conversion values are provided
4 Brackish water environments include situations with relatively low water salinity, such as estuaries and others.
6
to allow tissue specific activity concentrations (or concentration ratios) to be converted to whole organism values.
The data tables presented here relate to the whole organism and are, therefore, not appropriate for assessing the transfer of radionuclides to foods consumed by humans. For the human food chain, transfer parameter values are required that relate to the edible fraction only; these data are presented in other IAEA publications [5, 6, 33].
1.4. STRUCTURE
Section 2 provides an overview of transfer processes, exposure pathways, modelling approaches and the definition of concentration ratios. Section 3 describes how the data were collated and summarized. The data tables of generic wildlife radionuclide concentration ratio values are provided in Section 4 together with guidance on their application. Section 5 describes approaches used to provide concentration ratios when data for a given radionuclide and organism are not available. The appendices provide reference information applicable to different sections. They contain data tables which can be used to convert ash or dry weight to fresh weight, or tissue specific radionuclide activity concentrations to whole organism activity concentrations, respectively, and are relevant to Section 3. The Annex provides the source publications used to estimate the concentration ratios included in the tables in Section 4, which are derived directly from the on-line database (discussed later). These data source publications are independent of the references relevant to the text. Relevant concepts and terminology are given in the Definitions.
2. CONCEPTS AND QUANTIFICATION
2.1. TRANSFER PROCESSES AND EXPOSURE PATHWAYS
2.1.1. Physical and chemical processes
Most releases of radioactive substances entering the environment are either in suspended or dissolved forms in liquid effluents, or as gases or particulates in airborne effluents. Following their release into air or water, the behaviour of radionuclides will be influenced by their physical and chemical form in the same manner as other elements. For example, water chemistry and the

7
oxidation states of some elements, including radionuclides, will determine the degree to which they interact with suspended particulate material in the water column. The interaction of radionuclides with solid material, such as soil and sediment particles, plankton, vegetation and other materials occurs by numerous mechanisms including weathering, electrostatic attraction and formation of chemical bonds. In most cases, solid materials accumulate higher concentrations of radionuclides than air or water with some notable exceptions, such as noble gases.
In the terrestrial environment, vegetation can intercept elements, including airborne radionuclides from wet, dry or occult (e.g. fog, low cloud) deposition [38]; if not intercepted, they may be deposited onto the ground surface directly. Biomass per unit area affects the interception fraction for all types of deposition, but other factors, including ionic form, precipitation intensity, vegetation maturity and leaf area index5 are important. Radionuclide activity concentrations on vegetation surfaces are reduced by a number of physical processes, including wash-off by rain or irrigation, surface abrasion and losses from wind action, tissue senescence, leaf fall, herbivore grazing, growth, volatilization and evaporation [39].
Resuspension of contaminated particulate material, generally associated with soil or sediment, is a process that occurs in both aquatic and terrestrial systems. In aquatic systems, the turbulent action of water can suspend surface sediments and transport them considerable distances before they are once more lost from the water column by sedimentation. Resuspended particulates will be available for direct entry into aquatic food chains via ingestion by particle feeders. In terrestrial ecosystems, wind action and rain splash on the soil can suspend radionuclides in the air. Resuspended particulates can then be inhaled or, if deposited on vegetation, ingested by animals [40].
In soils and sediments, radionuclides deposited on the soil surface migrate to deeper soil depths to varying extents. Soil/sediment properties, such as water percolation rates, amount of water present, pH, presence of ionic species, redox potential, bacterial activity, and clay mineral and organic matter content are important factors in determining radionuclide mobility [41, 42]. Physical disturbance, including bioturbation, leads to the mixing of radionuclides. In aquatic ecosystems, the sedimentation of particulate material will lead to the burial of deposited radionuclides.
Fixation of radionuclides to different components of soils and sediments over time can reduce their availability for uptake into food chains [43–46].
5 Leaf area index is defined as the one sided green leaf area per unit ground area in broad-leaf canopies, or as the projected needle-leaf area per unit ground area in needle canopies.

8
In addition, vertical relocation to deeper soil and sediment layers removes radionuclides to compartments with little biological activity which may then act as permanent sinks.
In addition to the above mentioned processes, radionuclides naturally decay with a determined half-life characteristic of each element [47]. In some cases, radionuclides are naturally transformed into other radioactive or non-radioactive elements.
2.1.2. Biological uptake
The transfer of elements (including radionuclides) into an organism often depends on the food web, a series of related food chains through which energy, nutrients and chemicals move through an ecosystem. In all aquatic and terrestrial food webs, radionuclides are transferred from primary producers in the first trophic level to primary consumers (herbivores) at the second trophic level and then to carnivores or omnivores at higher trophic levels.
Elements enter food webs by numerous processes, which can vary over the different life cycle stages of some species. The key pathways by which radionuclides can enter an organism include:
(a) Inhalation of (re)suspended particles or gaseous radionuclides by terrestrial animals and aquatic birds, mammals and herpetofauna: Gaseous exchange of radionuclides by plants occurs via stomata respiration and cuticular absorption of radionuclides in the atmosphere or of radionuclides deposited onto plant surfaces followed by foliar uptake.
(b) Root uptake of radionuclides from the soil solution by plants: Soil/sediment characteristics, such as pH, cation exchange capacity, stable element status, organic matter content, soil moisture regime and characteristics of litter (especially for forest plants), strongly influence the transfer of many radionuclides to plants [48, 49]. Another factor governing radionuclide transfer to plants is the distribution of root systems and associated mycelia in the soil relative to that of the elements [49].
(c) Ingestion of radionuclides via organisms and water in lower trophic levels: In aquatic systems, there are many different primary producers including microscopic free-floating phototrophs (algae, bacteria, protists, phytoplankton) as well as macrophytes (aquatic plants) and macroalgae. In lakes and rivers, terrestrial plant material is also an important food source for some bottom feeding organisms. The transfer of radionuclides from these basal trophic levels occurs largely through the ingestion of such organisms by protozoa and zooplankton, and subsequent transfer to higher

9
trophic levels. In terrestrial systems, the ingestion of the primary producers, plants, is a major contributor to the contamination of herbivorous animals. Predation of herbivores transfers radionuclides to successively higher trophic levels.
(d) Intake of radionuclides via ingested soil and sediments takes place in many organisms. For instance, radionuclides in the soil are directly ingested by both herbivores (often adhered to plant surfaces) and carnivores, sometimes through intentional ingestion to acquire essential nutrients. Ingestion of sediment is also a potential source of exposure in aquatic systems, especially for benthic feeders. For radionuclides that are not readily taken up by plants, such as plutonium, soil or sediment ingestion often represents an important route of intake [50–52].
(e) Absorption of ingested radionuclides in the digestive tract and their subsequent distribution within the organism leads to internal exposure of tissues. Absorption from the gastrointestinal tract of higher animals is highly variable and depends on factors such as age, homeostatic control and the physicochemical form of the radionuclide [53, 54]. For example, caesium in ionic form within plants is absorbed in the gut of herbivores to a greater extent than that adsorbed to soil matrices. Radionuclides accumulate in particular organs or tissues (e.g. iodine in thyroid, strontium in bone or shell, plutonium in liver and bone) [55]. Ingestion is the dominant transfer process of some important environmentally mobile radionuclides, such as those of caesium, in both aquatic and terrestrial ecosystems.
(f) Major factors influencing element transfer to aquatic biota (e.g. fish, molluscs, crustaceans) include the degree of physicochemical equilibrium between organisms and their surrounding environment, age of organisms, physicochemical form of elements in the water, (taxonomic) species and variations in the properties of the aquatic environment (such as suspended load, stable analogue concentrations and salinity of water) [56]. Aquatic organisms at a higher trophic level may accumulate relatively more environmentally mobile radioisotopes, such as iodine, calcium, technetium and strontium, than those at a lower trophic level (i.e. a bioconcentration effect) [57, 58]. Uptake leads to direct irradiation of respiratory systems, such as gills and digestive systems, and internal exposure of other organs if radionuclides are absorbed. The importance of different uptake routes varies. For example, plutonium in some high trophic level organisms, such as predatory fish, is taken up mainly via direct adsorption from the water column [59], indicating a low trophic-level effect for plutonium.
The tissues of deceased organisms, as well as secretions and excretions from living organisms input radionuclides into the detritus pool in both terrestrial

10
and aquatic ecosystems. Detritus food webs are important in the cycling of all elements, including radionuclides. During decomposition, insoluble organic material is broken down to simpler forms by microbes and detritivores releasing radionuclides for potential uptake by primary producers and other organisms.
2.1.3. Exposure routes
The extent of exposure of wildlife to ionizing radiation is dependent on the amount of the different radionuclides present in the various environmental media (soil, sediment, water and air) and the rates of transfer of radionuclides in the environment. The pathways leading to exposure of organisms in both aquatic and terrestrial ecosystems are subdivided into internal and external components. Ingestion of contaminated food and water leads to direct irradiation of the digestive tract.
External irradiation can occur from any source external to the organism, and the dose that is delivered varies with ionizing radiation type, energy, size of organism and location of the source relative to the organism, depending on the organism’s ecological characteristics and habitat. For example, a benthic dwelling fish will be exposed to ionizing radiation from radionuclides present in the water column and deposited sediments, whereas a pelagic fish may only be exposed to the former.
For β and γ irradiation, the range of the β particles or γ rays increases as the ionizing radiation energy increases. The relative importance and absolute magnitude of internal and external absorbed doses depend on the size and shape of the organism and on the density of the medium in which it is located. Most of the species in the wildlife groups are sufficiently large that the β and α radiation present within the organism will be fully absorbed by the tissues. However, as the organism size increases, the penetration of β radiation from external sources will decrease, resulting in exposure to the surface layers (e.g. skin, fur, feathers or plant cuticle) only. As the γ radiation energy increases, the fraction of the energy that is absorbed in a given sized organism will decrease. For microscopic organisms, external irradiation from α particles is also possible. External exposure pathways are not considered further as they are beyond the scope of the handbook.
2.2. CURRENT APPROACHES TO ESTIMATE TRANSFERS AND EXPOSURES USED IN ASSESSMENT MODELS
There are a variety of tools used to estimate exposure of wildlife to ionizing radiation [11, 14], some of which are freely available as software packages to

11
any user [27, 35, 60]. In these models, concentration ratios are often used to predict radionuclide activity concentrations in wildlife by assuming that there is an equilibrium between the whole organism and the medium in which it is located [61]. All approaches currently used to assess the exposure of wildlife to ionizing radiation estimate dose rates to the whole organism. This approach allows model outputs to be put into context with the available data on the effects of ionizing radiation, which are typically presented as dose rates to the whole organism [20, 31, 32, 62].
Concentration ratio values are used in this handbook to describe the transfer from media to organisms. The approach is justified because of: (i) its simplicity, transparency and user-friendliness; (ii) the relatively large amount of relevant information available for organisms, elements and ecosystems compared with other methods of quantifying transfer; (iii) the common use of (and, therefore, the need for) this parameter in the existing environmental exposure assessment models; and (iv) its compatability with the approach being used by the ICRP in its developing framework for non-human biota [20] and tools used for human exposure assessments [6, 63].
2.2.1. Equilibrium concentration ratios
Concentration ratios are defined in the handbook in a manner which makes them clearly distinguishable from human food chain modelling and which specifies the medium being considered to avoid confusion. The CRwo-media value is defined for terrestrial ecosystems as:
CRactivity concentration in whole organism (Bq/kg,
wo-soil = fresh weight)
activity concentration in soil (Bq/kg, dry wweight)
(1)
with exceptions, in some models, for chronic atmospheric releases of some gaseous radionuclides (such as 3H and 14C) (see Section 2.2.2), where:
CRactivity concentration in whole organism (Bq/kg,
wo-air =ffresh weight)
activity concentration in air (Bq/m ) 3
(2)

12
For aquatic ecosystems, the majority of approaches calculate CRwo-media using water as follows:
CRactivity concentration in whole organism (Bq/kg
wo-water =,, fresh weight)
activity concentration in (filtered) water (Bq/L)
(3)
although a few organizations estimate CRwo-media relative to sediment:
CRactivity concentration in whole organism (Bq/kg,
wo-sed =ffresh weight)
activity concentration in sediment (Bq/kg, drry weight)
(4)
The CRwo-media approach has some limitations; in particular, it assumes equilibrium in the environment between the media and the exposed wildlife. Therefore, careful consideration needs to be given when applying CRwo-media values in circumstances where there is substantial temporal variation in radiological conditions (e.g. pulsed inputs of radionuclides or accidents). There are alternative methods of quantifying transfer, including dynamic models [64] but the data necessary to populate these models are not yet available for many situations. Equilibrium CRwo-media values are particularly appropriate for assessments of chronic exposure scenarios, including quasi-steady annual discharges from nuclear installations.
CRwo-media values are also used as part of wildlife food chain transfer models. For instance, the United States Department of Energy uses CRwo-media values for quantifying radionuclide transfer to dietary components (such as plants or insects) as part of their kinetic–allometric food chain model [60] (see Section 5.4).
CRwo-media values are empirically derived parameters which offer a pragmatic approach to predicting radionuclide concentrations in wildlife and similar approaches are used for human food chain assessment [6]. However, these values provide no insight into underlying transfer processes or rates (although these are integrated within the value). There are many environmental factors controlling the behaviour of some radionuclides (Section 2.1). However, as they amalgamate many biological–chemical–physical processes, they may have a high degree of associated uncertainty. Depending on the purposes of the assessment, or the radionuclide and exposure pathway considered, this uncertainty may be acceptable and such environmental factors are rarely considered in human food chain assessment models used for screening purposes. The need to include

13
such factors depends on whether the radionuclide exposure scenario considered is likely to give rise to doses rates requiring more than an initial screening assessment. If the release rate of a radionuclide, under highly conservative assumptions, only requires a generic assessment [24, 34], then more complex models will not be justified.
If sediment concentrations are known, but data for water are lacking, then distribution coefficient Kd values can be used to estimate concentrations of radionuclides in filtered water. The Kd can also be used to estimate radionuclide activity concentrations in sediment (which are needed to calculate external dose from sediment) from filtered water concentrations. The Kd, which is defined at equilibrium, is determined as:
Kd activity concentration in sediment (Bq/kg, dry w
(L/ kg)=eeight)
activity concentration in (filtered) water (Bq/L) (5)
The assumption of equilibrium between water and sediment activity concentrations is not always valid and the value of Kd is influenced by many water and sediment parameters [65].
To undertake wildlife dose assessment, the radionuclide activity concentration in bed sediments needs to be estimated to determine external dose rates to benthic organisms. Many Kd values presented in the general literature are for suspended sediments and are not directly applicable to bed sediments. It has been proposed that the apparent Kd for bed sediments is roughly 10% of that for suspended sediments [1]. These issues also apply to the estimation and application of CRwo-sed values.
2.2.2. Specific activity approaches for 14C and 3H
Values of CRwo-media are not presented for transfer of 3H and 14C in the CRwo-media tables because a specific activity approach is generally preferred (and is outlined below) and, furthermore, there are few observed CRwo-media values for either isotope. 3H and 14C are radionuclides of macroelements which are structural components of plant and animal tissues and, in the case of 3H, water. In terrestrial environments, these radionuclides are primarily present as reversible gases (14CO2 and 3HHO). It is common practice in human food chain modelling [6] and many wildlife assessment models [28, 35] to assume a constant air concentration and derive concentrations in foodstuff and wildlife relevant to this value. The equations presented below for estimating activity concentrations of 14C and 3H in wildlife are similar to those recommended in Ref. [6].

14
2.2.2.1. Terrestrial environments
For 14C, a simple specific activity approach as that described in Ref. [66] can be used. Assuming a constant concentration of 14C in air of 1 Bq/m3, the specific activity in air SAair (Bq/g · C) is:
SAair =1
0 20. (6)
where 0.20 g/m3 is the current carbon content of air [6].
The specific activity in herbage SAherb will equal that in air:
10 20
14
.=
CC
herb
herb (7)
where 14Cherb (Bq/kg, fresh weight) and Cherb (g/kg, fresh weight) are the 14C activity and stable carbon concentrations in herbage, fresh weight, respectively. Thus, the 14C activity concentration in herbage, fresh weight, is:
14 5C Cherb herb= ( ) (8)
Similarly, the 14C activity concentration in animals 14Canim (Bq/kg, fresh weight) is:
14 5C Canim anim= ( ) (9)
where Canim is the stable carbon concentration in animals (g/kg, fresh weight).
For 3H in terrestrial ecosystems, a specific activity approach adapted for transfer to animals to take into account tritiated water (HTO) and organically bound tritium (OBT) can be applied [66, 67].
The tritium activity concentration in plant water is estimated according to Refs [68, 69] by:
CP
PC
P
PplantHTOa
va
a
v
=
⋅ + −
⋅1 1 1 17 1. . CC s (10)
15
where
CplantHTO is the HTO concentration in leaf water (Bq/L);Ca is the HTO concentration in air moisture (Bq/L);Pa is the water vapour mass per unit air volume (average value for
summer) (kg/m3);Pv is the saturated water vapour mass per unit volume at leaf temperature
(average value for summer) (kg/m3);
and Cs is the HTO concentration in the routing depth of soil (Bq/L).
The HTO concentration in air moisture is estimated as:
CC
Paav
a
= (11)
where Cav is the HTO concentration in air volume (Bq/m3).
In practice, the average leaf temperature is often considered equal to the average air temperature and the ratio in Eq. (10) is equal to the relative humidity (during the growing season). If FD is the plant dry matter fraction, then the HTO concentration in edible plant parts is simply:
C CfreshHTO plantHTOFD= −( )⋅1 (12)
The fresh weight OBT concentration fraction in plants is given by:
C COBT plantHTOFD= ⋅0 6. (13)
The 3H concentration in soil water Cs (rooting depth average) is estimated as the sum of wet and dry deposition:
CD
ICs
w
ra= +0 3. (14)
The wet deposition contribution (Dw/Ir) is derived from the average HTO concentration in rainwater during the vegetation growing period, where Dw is the total wet deposition (Bq/m2) during the growing period and Ir the average precipitation during the growing period (mm). Dw is given by:

16
w av MHD C t= ⋅ ⋅ ⋅∆ (15)
where
λ is the washout rate (h–1);MH is the mixing height in neutral weather conditions (m);
and ∆t is the total duration of rainfall (h) during the growing season.
The dry deposition component in Eq. (14) is defined by 0.3Ca, where 0.3 is a conservative value suited to dry meteorological conditions [6].
The resultant 3H activity concentrations in plant material are assumed to represent the diet of herbivorous animals. Subsequently, the activity concentrations estimated for herbivores are used to estimate the diet of carnivores. The transfer of 3H to animals has been estimated using the approach presented in Refs [67, 70]. The 3H activity concentration is estimated as the sum of the transfer of HTO and OBT calculated from the following equations:
CR SARHTO bwo= +v
m
0 111. (16)
CR FDSAR
OBT bwdm
w
o o
oh
= + +− ⋅
vI
I
m m
C (17)
where
CRHTO is the ratio of the activity concentration of 3H in the whole body to that ingested as HTO;
CROBT is the ratio of whole body 3H activity concentration to that ingested as OBT;
vbw is the body water fraction;SAR is the ratio of the specific activity of OBT in the animal product to the
specific activity of HTO in the body water (Ref. [67] assumes a value of 0.25 for SAR based on the results from small, monogastric animals);
mo is the mass of organically bound hydrogen content (kg/kg, fresh weight);
0.111 is the mass of hydrogen in water (kg/kg);FD is dry matter diet digestibility;

17
Idm is the total dry matter (dm) intake (kg/d);Iw is total water intake (including drinking water and water from food)
(kg/d);
and Coh is the concentration of organic hydrogen in the animal’s diet (kg/kg dm)
2.2.2.2. Aquatic environments
Specific activity models for determining the 3H and 14C activity concentrations in the tissues of freshwater fish for human food chain assessments have been reported previously [6]. These models estimate whole organism activity concentrations in a range of freshwater wildlife with the provision of suitable input parameters. The 14C model assumes that the fish is in equilibrium with the specific activity of dissolved inorganic carbon (DIC):
14C = DIC CC S⋅ (18)
where
14C is the 14C activity concentration in the whole organism (Bq/kg, fresh weight);
CDIC is the 14C concentration in DIC in the water column (Bq · kg · C–1);
and SC is the stable carbon concentration in the whole organism (kg C/kg, fresh weight).
One caveat is that modelling 14C in aquatic ecosystems is complicated by the presence of several carbon pools in different forms, including organic, inorganic, dissolved and particulate [6].
For HTO in freshwater ecosystems, there is an assumption that full equilibrium in specific activity concentrations will provide a good approximation for HTO in most compartments [6]. The HTO activity concentration in the whole organism (CHTO) can, therefore, be estimated as:
C W CHTO C W= ⋅ (19)
where
WC is the fractional water content of the organism (L/kg, fresh weight);
and CW is the HTO concentration in the water column (Bq/L).

18
Where the organism is assumed to be exposed to a uniform concentration of HTO, then it is considered reasonable to assume that the concentration of OBT in the combustion water of the organism is the same as the concentration of HTO, apart from the need to account for isotopic fractionation [6]. This is achieved using a partition factor that takes account of the presence of exchangeable H in the combustion water and of isotopic effects arising both in the fish and in the different components of its food and water intakes. The OBT concentration in the organism, exposed to HTO, is given by:
C W R COBT C f wWEQ= − ⋅ ⋅ ⋅( )1 (20)
where
WEQ is the water equivalent factor of the organism (kilogram of water produced per kilogram of dry weight combusted);
and Rf is the partition coefficient which accounts for isotopic fractionation.
However, this approach cannot be used when 3H does not originate from an HTO source term (i.e. when 3H enters the aquatic ecosystem as OBT). A more recent model includes an approach for considering OBT source terms [71].
3. COLLATION, TREATMENT AND EVALUATION OF DATA
3.1. THE WILDLIFE TRANSFER DATABASE
An on-line database6 has been established to facilitate the collection of data for this handbook. This provides a structured way to collate data on the transfer of radionuclides to wildlife from the scientific community. This was a joint development with the ICRP, so that the same database is used to provide CRwo-media values for their developing framework [19]; the ICRP has adopted ‘hypothetical entities’, called RAPs, which refer to a specific set of conceptual and numerical models which can be used to estimate ionizing radiation exposures to living organisms from radionuclides.
6 www.wildlifetransferdatabase.org.

19
The database compiles data on organism-media concentration ratios (CRwo-media values) as this is the parameter most often used in the currently available assessment models. The data are reported as whole organism CRwo-media values for a range of wildlife groups which live in different ecosystems (see Section 3.2). The database does not include recommended values based on reviews from previous publications as these are not original data.
The data compilations used within the ERICA project7 to parameterize the ERICA tool8 were used (following additional quality control) to initially populate the database [72, 73].
The on-line database is intended to be maintained in the future with periodic releases of revised CRwo-media tables which will provide a continuously improving source of CRwo-media information for conducting assessments and developing and/or maintaining assessment models. The frequency of the release of update tables has not been specified as it will depend on factors such as the extent of new data entries. A documented, referable publication procedure will be followed when updates are released.
3.2. STRUCTURE OF THE WILDLIFE TRANSFER DATABASE
The database collates data into three categories of information:
(a) Reference source information (e.g. authors, year, title, journal name).(b) Study information such as the habitat or habitat subcategory (Table 1)
and species name (common and Latin): Four generic ecosystem habitats are defined. In the database, these four generic ecosystem categories are terrestrial, freshwater, marine and estuarine. However, because the estuarine data used to compile the tables in Section 4 were comprised of two main sources, estuarine data from Japan and data for the Baltic Sea (which is a low salinity ecosystem), the term ‘brackish’ has been used in this handbook instead as it is more appropriate. The species is allocated to a broad wildlife group and to a subcategory of this group (Tables 2–4), and/or an ICRP RAP [20] category, if appropriate. The ICRP RAP category information is included to allow users to obtain up to date values for these organisms. Other information collected includes the life stage of the
7 Environmental Risk from Ionizing Contaminants: Assessment and Management, EURATOM 6th Framework Programme project (https://wiki.ceh.ac.uk/display/rpemain/ERICA).
8 A tool implementing the ERICA tiered approach for radiological assessment of wildlife in freshwater, terrestrial and marine ecosystems developed by a EURATOM 6th Framework Programme consortium.

20
organism, radionuclide or element, and general notes on the study design (e.g. soil type, sampling depth and sediment grain size). The database includes the elements relevant for all radioisotopes listed in Ref. [74]. For some wildlife groups listed in Tables 2–4, there are currently no data, so CRwo-media values are not reported in the tables in Section 4. Additionally, for some wildlife groups, only a few data values have been input into the database (e.g. fungi and ferns) and, thus, CRwo-media values have not been included in the CRwo-media tables. Summaries of these data are available in the on-line database.
(c) Media and wildlife radionuclide activity concentrations where the user also defines the media type (air, soil, sediment or water): If the wildlife or media radionuclide activity concentration is entered as a mean value, then the database entry template requests the number of data points N contributing to that mean and associated standard deviation. The media and wildlife radionuclide activity concentration values are used to calculate the concentration ratio. The mean value and the standard deviation of the wildlife and media activity concentration values are used to calculate the standard deviation of the calculated radionuclide concentration ratio (CRSD; see Eq. (21)). The CRSD and the wildlife N value are then used to weight the overall CRwo-media value when the data are summarized (see Section 3.3).
3.3. CALCULATION OF THE STANDARD DEVIATION OF THE CONCENTRATION RATIO
CRSD
CRWildlifeSD
WildlifeActivityConcentrationwo-media
=
×
+
2 2MediaSD
MediaActivityConcentration
(21)
where
WildlifeSD is the standard deviation of the mean wildlife radionuclide activity concentration;
and MediaSD is the standard deviation of the mean media radionuclide activity concentration.

21
TABLE 1. HABITATS AVAILABLE IN THE ON-LINE TRANSFER DATABASE
Habitat Definition
Terrestrial Generic ecosystem including data from all terrestrial ecosystem types (with the exception of estuarine systems)
Terrestrial: semi-natural grassland Includes: mountain and upland grasslands, heath and shrub lands, and some Arctic ecosystems
Terrestrial: forest Land with tree crown cover of more than 10% over an area of more than 0.5 ha and with trees, which are able to reach a minimum in situ height of 5 m at maturity
Terrestrial: agricultural grassland Managed grasslands
Terrestrial: coastal sand dunes Coastal sand dunes (not to include marine organisms)
Terrestrial: wetland Marsh, fen, peatland (not estuarine systems (e.g. saltmarshes))
Freshwater Generic ecosystem including data from all freshwater ecosystem types
Freshwater: flowing Rivers and streams
Freshwater: lake Lakes and other static water bodies
Marine Generic ecosystem including data from all marine ecosystem types
Marine: coastal Water within 3 km of the coast (not estuaries)
Marine: open water Water more than 3 km from the coast
Estuarine: water Generic ecosystem including aquatic systems such as estuaries and low salinity water bodies
Estuarine: terrestriala ‘Terrestrial’ components of estuarine ecosystems (including saltmarshes and mud flats, but not coastal sand dunes)
a Insufficient data were input into the database to present CRwo-media values for the terrestrial components of estuarine ecosystems, so no further details for this category are presented here. The wildlife groups included in the database for ‘estuarine (terrestrial)’ can be found under ‘estuarine ecosystems’ at http://www.wildlifetransferdatabase.org.

22
TABLE 2. WILDLIFE GROUPS LISTED IN THE ON-LINE TRANSFER DATABASE: TERRESTRIAL WILDLIFE GROUP LIST AND RELATIONSHIP TO INTERNATIONAL COMMISSION ON RADIOLOGICAL PROTECTION (ICRP) REFERENCE ANIMALS AND PLANTS (cont.)
Broad group Available subcategories Potential appropriate ICRP reference animal and plant
Amphibians — FrogArachnids — —Arthropods
Arthropods: carnivorous —Arthropods: detritivorous —Arthropods: herbivorous Bee
Birds DuckBirds: carnivorous DuckBirds: herbivorous DuckBirds: omnivorous Duck
Annelids — EarthwormFerns — —Fungi
Fungi: mycorrhizal —Fungi: parasitic —
Fungi: saprophytic —Grasses and herbs —
Grasses Wild grassHerbsa —
Lichens and bryophytes — —Mammals Rat or deer
Mammals: carnivorous RatMammals: herbivorousb Rat or deerMammals: omnivorous RatMammals: marsupialc —
Mammals: Rangifer spp. —Molluscs — —
Molluscs: gastropod —Reptiles —
Reptiles: carnivorous —Reptiles: herbivorous —
Shrubs — —

23
TABLE 2. WILDLIFE GROUPS LISTED IN THE ON-LINE TRANSFER DATABASE: TERRESTRIAL WILDLIFE GROUP LIST AND RELATIONSHIP TO INTERNATIONAL COMMISSION ON RADIOLOGICAL PROTECTION (ICRP) REFERENCE ANIMALS AND PLANTS (cont.)
Broad group Available subcategories Potential appropriate ICRP reference animal and plant
Trees —Trees: coniferous Pine treeTrees: broad-leaf —
a Herb refers to any non-woody plant which does not fall into one of the other categories.b Does not include Rangifer spp. (reindeer and caribou); see text for justification. c All marsupials regardless of feeding strategy.
TABLE 3. WILDLIFE GROUPS LISTED IN THE ON-LINE TRANSFER DATABASE: FRESHWATER WILDLIFE GROUP LIST AND RELATIONSHIP TO INTERNATIONAL COMMISSION ON RADIOLOGICAL PROTECTION (ICRP) REFERENCE ANIMALS AND PLANTS (cont.)
Broad group Available subcategories Potential appropriate ICRP reference animal and plant
Algae — —Amphibians — FrogBirds Duck
Birds: carnivorous DuckBirds: herbivorous DuckBirds: omnivorous Duck
Crustaceans — —Fish —
Fish: benthic feedinga —Fish: piscivorousb Salmonid
Fish: foragec —Insects — —Insect larvaed — —Mammals —
Mammals: carnivorous —Mammals: herbivorous —Mammals: omnivorous —

24
TABLE 3. WILDLIFE GROUPS LISTED IN THE ON-LINE TRANSFER DATABASE: FRESHWATER WILDLIFE GROUP LIST AND RELATIONSHIP TO INTERNATIONAL COMMISSION ON RADIOLOGICAL PROTECTION (ICRP) REFERENCE ANIMALS AND PLANTS (cont.)
Broad group Available subcategories Potential appropriate ICRP reference animal and plant
Molluscs —Molluscs: bivalve —
Molluscs: gastropod —Phytoplankton — —Reptiles — —Vascular plants — Wild grassZooplankton — —
a Fish feeding on benthic dwelling organisms. b Fish consuming smaller fish, amphibians and/or birds. c Fish feeding on primary producers and pelagic invertebrates and zooplankton.d Insect larvae are included as the aquatic life phase is important for many species
which are terrestrial as an adult.
TABLE 4. WILDLIFE GROUPS LISTED IN THE ON-LINE TRANSFER DATABASE: MARINE AND BRACKISH (WATER) WILDLIFE GROUP LIST AND RELATIONSHIP TO INTERNATIONAL COMMISSION ON RADIOLOGICAL PROTECTION (ICRP) REFERENCE ANIMALS AND PLANTS (cont.)
Broad group Available subcategories Potential appropriate ICRP reference animal and plant
Annelidsa — —Birds Duck
Birds: carnivorous DuckBirds: herbivorous DuckBirds: omnivorous Duck
Crustaceans —Crustaceans: large CrabCrustaceans: small —
FishFish: benthic feedingb Flat fish
Fish: piscivorousc SalmonidFish: foraged —

25
TABLE 4. WILDLIFE GROUPS LISTED IN THE ON-LINE TRANSFER DATABASE: MARINE AND BRACKISH (WATER) WILDLIFE GROUP LIST AND RELATIONSHIP TO INTERNATIONAL COMMISSION ON RADIOLOGICAL PROTECTION (ICRP) REFERENCE ANIMALS AND PLANTS (cont.)
Broad group Available subcategories Potential appropriate ICRP reference animal and plant
Insects — —Macroalgae — Brown seaweedMammals —
Mammals: carnivorous —Mammals: herbivorous —
Mammals: planktivorous —Molluscs —
Molluscs: bivalve —Molluscs: cephalopode —Molluscs: gastropod —
Phytoplankton — —Reptiles — —Sea anemones/true corals — —Vascular plants — —Zooplankton — —
a Referred to as ‘polychaete worm’ in the on-line database.b Fish feeding on benthic dwelling organisms. c Fish consuming smaller fish, amphibians and/or birds. d Fish feeding on primary producers and pelagic invertebrates and zooplankton. e Squid, octopus, cuttlefish, etc.
If a measure of error is only available for either media or wildlife activity concentrations, this is carried through (proportionally) to give a standard deviation estimate for the calculated CRwo-media values.
The CRwo-media value generally refers to the whole organism. For some wildlife groups, further clarification is needed since some parts of the organism are not included. For aquatic ecosystems, the whole organism CRwo-media values for bivalve molluscs, large crustaceans and marine gastropods do not include shell to be consistent with commonly used dosimetry approaches. For vertebrate wildlife groups, whole organism CRwo-media values typically do not include the gastrointestinal tract contents, although there may be some exceptions such as when animals have been live monitored and in the case of small fish. Gastrointestinal tract contents tend to be removed as they will often contain

26
comparatively high activity concentrations of unabsorbed elements. Similarly, pelt and feathers will typically not be included in the whole organism CRwo-media for mammals and birds, respectively, to remove external contamination. Vegetation CRwo-media values are typically based on only the above-ground parts of plants; to some extent, this is driven by the requirements of some of the existing dosimetric models which only consider above-ground plant parts [20, 35]. For some elements, roots contain a higher concentration of elements than above-ground plant parts [75, 76]. For instance, concentrations of uranium in the root have been reported to be much higher than in above-ground plant parts (with adherent external soil not explaining the difference) [77–79].
3.4. DATA ENTRY ISSUES
Where possible, weighted (with respect to sample numbers and reported standard deviations) mean CRwo-media values and standard deviations were estimated (and are presented in tables in Section 4). Ideally, media radionuclide activity concentrations for CRwo-water should be for filtered water and CRwo-soil should be for the 0–10 cm layer of soil. However, many of the source references of the data included in the CRwo-media tables do not conform to this specification, or do not present the relevant information.
In the derivation of the ERICA tool database, which was initially used to populate the on-line wildlife database [72, 73], some assumptions and compromises were used to address the lack of information in some source publications. These were:
(a) If information on replication was not given and no error term was reported in the source literature, a sample number of one was assumed;
(b) If a measure of error (e.g. standard deviation or standard error) was reported without a sample number, the sample number was assumed to be three;
(c) If a minimum and maximum were reported with no details of sample replication, a sample number of two was assumed.
However, any references which did not give all of the required information were rejected for wildlife group–radionuclide combinations for which there were many reported values [72, 73]. Only assumption (a) was applied for additional data entered into the database thereafter.
In the ERICA tool database, data for Rangifer spp. (e.g. reindeer, caribou) were treated separately from other mammals (and were defined as a separate wildlife category). This is because the air–lichen–reindeer pathway has a particularly high transfer of some radionuclides (e.g. caesium, polonium, lead),

27
so the pathway is not representative of the uptake routes for most other terrestrial mammals [10].
Data collected during either the period of above-ground nuclear weapons testing fallout (assumed to be before 1970) or the year of the Chernobyl accident (1986) were not used to derive transfer parameter values for radionuclides of caesium, plutonium, strontium and americium to avoid effects such as the direct surface contamination of terrestrial vegetation.
Some CRwo-media values were derived using stable element data; in terrestrial ecosystems, these data were often associated with studies of heavy metal pollution, in which case only data from uncontaminated (control) sites were used.
Where a given dataset contains some measurements below detection limits, a value of 50% of the detection limit has been assumed if the number of values below the detection limit is less than 20% of the total number of measurements. The data have not been used where the number of undetectable measurements comprises a higher proportion of the overall dataset.
In some cases, data were available for specific tissues rather than for the whole organism, or the radionuclide activity concentrations were given for ashed or dried weights instead of fresh weight. In these cases, correction factors were applied as described in Section 3.3.
A significant amount of laboratory data have been entered into the on-line database. However, to estimate the CRwo-media values, only field data were used because of concerns that equilibrium would not have been reached in laboratory studies and the values would not accurately reflect food chain transfer. An exception is the use of some algae (freshwater), zooplankton, phytoplankton and sea anemone/coral data. The latter data were incorporated on the basis that water is likely to be the source of contamination, rather than food chain transfer. For algae and phyto/zooplankton, equilibration between water and organism radionuclide activity concentrations is likely to be rapid. As a consequence, many laboratory derived CRwo-media data for such organisms are in good agreement with estimates made from in situ investigations [5].
Where possible, data used to derive CRwo-media values are for radionuclide activity concentrations in wildlife and media measured at the same sites. However, some CRwo-media values for marine organisms have been calculated using observed concentrations of stable elements in organisms and generic data on global concentrations in seawater from publications such as Ref. [80]. This is thought to be acceptable as the major element, and some of the minor element, concentrations in open seawaters are relatively constant [81] compared with soil or freshwater concentrations. Marine values derived by this approach are identified in the CRwo-water table for marine organisms.

28
3.5. DATA TRANSFORMATIONS
It was often necessary to transform data into the appropriate format for entry into the database. The most common transformations were applied to take account of the fact that:
(a) Wildlife radionuclide activity concentrations were given on a dry weight or ash weight basis (when fresh weight CRwo-media values were required);
(b) Data were available for specific tissues (i.e. not whole organism); (c) Soil radionuclide activity concentrations were given in becquerels
per square metre. Where information was not given within the source publications, to enable manipulation of the data into the format required, a set of standard assumptions was followed. The conversion data used for the on-line database were based on those used for the ERICA tool and are given in Appendix I. Other sources of conversion factors which can be used for data presented on an ash or dry weight basis for terrestrial and aquatic ecosystems have been provided previously [6].
Many of the available radioecological data for wildlife groups originate from measurements made for human food chain assessments. These data are, therefore, for tissues consumed by humans (e.g. for animal muscle and milk). To utilize these data for the purposes of environmental assessment, tissue-specific data need to be converted into whole organism radionuclide activity concentrations. In some instances, this information is available from the source publications. Where this information is not available, Ref. [82] presents a series of look-up tables for a wide range of elements with conversion factors for tissue specific to whole organism concentrations for marine, freshwater and terrestrial animals (given in Appendix II). By multiplying the tissue specific radionuclide activity concentration by the conversion factor, an estimate of whole organism concentration is obtained. The compilation of conversion factors presented in Ref. [82] is considerably more comprehensive than those used in the derivation of the original ERICA tool database [72, 73]. The modified concentration ratio values in the ERICA tool which have been used here have not been recalculated to comply with the recent recommendations discussed in Ref. [82]. Following the recommendations in Ref. [82], where the conversion factors fall between 0.75 and 1.5, the values are given as 1.0 in Appendix II. For vascular plants, bryophytes and lichens, all parts of the organism were assumed to have the same concentrations.

29
Where the source publications for terrestrial wildlife groups lacked the required information to convert soil radionuclide activity concentrations from becquerel per square metre to becquerel per kilogram for a sampling depth of 10 cm, a dry weight soil bulk density of 1400 kg/m3 was assumed [3]. Since bulk density varies with soil type, there will be an uncertainty associated with this assumption.
3.6. CALCULATION OF THE SUMMARY CONCENTRATION RATIOS
The individual CRwo-media values entered into the database have been used to calculate the weighted arithmetic mean (AM) (i.e. the mean for an individual study is given weight according to the number of observations in that study) and arithmetic mean standard deviation (AMSD) by ecosystem and wildlife groupings (see below), where:
AM
CR
=∑n
N
ii
i
(22)
and ni is the number of observations in study i, CRi is the mean CRwo-media for that study and N is the total number of observations in all studies.
The associated combined standard deviation (AMSDcombined) accounting for within and between study variation is estimated as:
AMSD
AMSD CR
CR
combined =
− +( )−
∑
∑( )n n
n
i i i ii
i ii1 2 2
22
1
N
N−
(23)
where AMSDi is the AMSD for study i. Hence, the resultant AMSDcombined value is representative of variation over the whole dataset.

30
From the calculated weighted arithmetic mean and AMSD, approximate estimates of the geometric mean (GM) and geometric mean standard deviation (GMSD) were calculated:
GMAMSD +AM
AM= −
exp . ln0 52 2
4
(24)
GMSDAMSD +AM
AM=
exp ln
2 2
2
The resultant arithmetic mean, standard deviation, geometric mean and GMSD values along with the number of data N and the range are given in the tables presented in Section 4; it should be noted that the range here reflects the variation in individual mean values rather than the overall minimum and maximum of observed values. Geometric mean values are not given where N < 3. The estimated geometric mean and GMSD are approximations as their derivation using the above equations is dependent on the distribution of the underlying data.
Prior to the production of the tables presented in Section 4, the data were quality controlled to identify outlying values attributable to species within wildlife groups with especially high or low CRwo-media values. This resulted in the removal of some data for the transfer of selenium and uranium to terrestrial vegetation wildlife groups (summary CRwo-media values including these data are presented in the footnotes to Table 5 for comparison).
4. CONCENTRATION RATIO VALUES FOR WILDLIFE
4.1. CONCENTRATION RATIO TABLES FOR DIFFERENT ENVIRONMENTS
Concentration ratio values are provided for terrestrial ecosystems (CRwo-soil) in Table 5, for freshwater ecosystems (CRwo-water) in Table 6, for marine ecosystems (CRwo-water) in Table 7 and for brackish ecosystems (CRwo-water) in Table 8.
31
Source publications for the data within the concentration ratio tables are identified by their on-line identification (ID) number; the full reference for each ID number is provided in the Annex. Where possible, CRwo-media values are presented by wildlife subcategory. Subcategories were not considered for inclusion if the number of data were <10. If the number of data were in the range of 10–20, but originated from only one or two source references, the data were evaluated and some subcategory values were excluded from the summary tables if they represented a small proportion (typically <10%) of the overall dataset. Subcategories were not considered in brackish ecosystems because the data for brackish species originate from only two areas (Japanese estuaries or the Baltic Sea) and few references give subcategories.
The summary information for major wildlife groups presented in the tables contains data for all subcategories, with the exception of data for mammals; Rangifer spp. are not included in the values for mammals or mammals: herbivorous. Consideration was given to separating the reptile data into a subcategory of turtles, tortoises and terrapins (i.e. species with shells) and other species (predominantly lizards and snakes) because bone seeking elements will probably have higher CRwo-media values in shelled species. However, for terrestrial species, there were only two data entries for tortoises (one each for caesium and strontium); tortoises are herbivores. Thus, the data for carnivorous species in Table 5 are for snakes and lizards only. Although there were more data for freshwater turtles, they were insufficient to justify presenting separate values for the reptile groups. Reference [83] reports the same data as those included in the database used here, but subdivided for different orders of reptiles.
For some summary CRwo-media values where N > 1, no summary statistics are provided other than the arithmetic mean. This is where data are derived from a single source which only presents arithmetic mean and N values. The ‘minimum’ values presented in Tables 5–8 are, in a number of instances, higher than the estimated geometric mean. This is because the geometric mean derivation utilizes the overall AMSD value (see Eq. (24)) and, as noted above, the dataset contains a mixture of individual values and mean values with associated standard deviations. Hence, the minimum is not necessarily the true minimum of the constituent datasets. For instance, the dataset for iodine CRwo-water values for freshwater molluscs (see Table 6) is comprised of two data entries: (i) a mean and standard deviation of 80 ± 27 derived from six measurements and (ii) an individual entry of 102. Consequently, while the minimum value in Table 6 is 80, application of Eq. (24) results in a geometric mean estimate of 79.

32
Wild
life
grou
p(te
rres
trial
)
CR
wo-
soil
(Bq/
kg, f
resh
wei
ght w
hole
org
anis
m:B
q/kg
, dry
wei
ght s
oil)
ID n
umbe
ra
AM
AM
SDG
MG
MSD
Min
imum
Max
imum
N
Ag
(silv
er)
Gra
sses
and
her
bs2.
9E+0
3.7E
+01.
8E+0
2.7E
+02.
8E–3
9.8E
+013
162,
212
Li
chen
s and
bry
ophy
tes
3.0E
–23.
4E–2
2.0E
–22.
5E+0
1.2E
–21.
3E–1
1234
8Sh
rubs
2.1E
–29.
1E–3
1.9E
–21.
5E+0
1.2E
–23.
3E–2
534
8A
l (al
umin
ium
)Li
chen
s and
bry
ophy
tes
1.1E
–11.
1E–1
7.1E
–22.
4E+0
1.0E
–24.
2E–1
3234
8, 3
55
Shru
bs1.
9E–2
1.8E
–21.
4E–2
2.2E
+02.
9E–3
1.2E
–111
934
7, 3
48
Am
(am
eric
ium
)A
mph
ibia
ns1.
3E–1
3.4E
–21.
3E–1
1.3E
+01.
0E–1
1.5E
–122
486
Ann
elid
s1.
8E–1
3.0E
–19.
0E–2
3.2E
+05.
2E–2
1.1E
+013
171,
486
, 488
A
rach
nids
5.7E
–26.
2E–2
3.8E
–22.
4E+0
2.2E
–21.
3E–1
2017
0, 4
88
Arth
ropo
ds1.
1E–1
2.9E
–14.
0E–2
4.2E
+01.
3E–3
2.0E
+082
170,
172
, 223
, 382
, 407
, 488
A
rthro
pods
: det
ritiv
orou
s9.
6E–2
7.5E
–27.
6E–2
2.0E
+02.
0E–2
2.2E
–129
170,
172
, 223
, 488
B
irds
3.2E
–21.
6E–2
2.8E
–21.
6E+0
1.9E
–23.
8E–2
348
6G
rass
es a
nd h
erbs
1.0E
–12.
9E–1
3.4E
–24.
4E+0
3.6E
–33.
0E–1
6517
7, 2
50, 4
86
Gra
sses
1.0E
–12.
9E–1
3.5E
–24.
4E+0
3.6E
–33.
0E–1
6317
7, 2
50, 4
86
Lich
ens a
nd b
ryop
hyte
s1.
2E+0
1.7E
+06.
9E–1
2.9E
+02.
0E–1
3.2E
+03
382,
486
M
amm
als
3.2E
–21.
0E–1
9.8E
–34.
7E+0
2.6E
–41.
7E–1
139
172,
184
, 197
, 221
, 245
, 407
, 488
M
amm
als:
her
bivo
rous
5.4E
–22.
0E–1
1.4E
–25.
2E+0
2.6E
–41.
7E–1
2718
4, 4
07, 4
88
TAB
LE 5
. C
ON
CEN
TRAT
ION
R
ATIO
(C
Rw
o-so
il)
VALU
ES
FOR
W
ILD
LIFE
G
RO
UPS
IN
TE
RR
ESTR
IAL
ECO
SYST
EMS

33
TAB
LE 5
. C
ON
CEN
TRAT
ION
R
ATIO
(C
Rw
o-so
il)
VALU
ES
FOR
W
ILD
LIFE
G
RO
UPS
IN
TE
RR
ESTR
IAL
ECO
SYST
EMS
(con
t.)
Wild
life
grou
p(te
rres
trial
)
CR
wo-
soil
(Bq/
kg, f
resh
wei
ght w
hole
org
anis
m:B
q/kg
, dry
wei
ght s
oil)
ID n
umbe
ra
AM
AM
SDG
MG
MSD
Min
imum
Max
imum
N
Mam
mal
s: o
mni
voro
us3.
0E–2
5.4E
–21.
5E–2
3.3E
+03.
7E–4
4.5E
–284
221,
245
, 488
M
amm
als:
Ran
gife
r spp
.b2.
0E–1
2.4E
–11.
3E–1
2.6E
+01.
6E–1
2.2E
–19
197
Mol
lusc
s: g
astro
pod
1.4E
–11.
4E–1
1.0E
–12.
2E+0
5.1E
–22.
0E–1
1348
6, 4
88
Rep
tiles
: car
nivo
rous
c6.
4E–2
3.9E
–25.
5E–2
1.8E
+01.
0E–3
8.6E
–216
407,
486
Sh
rubs
2.7E
–23.
3E–2
1.7E
–22.
6E+0
5.1E
–59.
5E–2
1219
6, 4
86
As (
arse
nic)
Ann
elid
s3.
5E–1
2.3E
–12.
9E–1
1.8E
+06.
1E–2
7.9E
–138
334
4A
rthro
pods
2.2E
–23.
7E–2
1.1E
–23.
2E+0
4.8E
–35.
6E–1
257
344
Arth
ropo
ds: d
etrit
ivor
ous
2.9E
–21.
8E–2
2.5E
–21.
8E+0
9.3E
–38.
9E–2
3834
4G
rass
esc
1.3E
–22
334
Lich
ens a
nd b
ryop
hyte
s1.
1E+0
1.8E
+06.
1E–1
3.1E
+07.
1E–2
1.2E
+193
342,
345
, 348
, 349
, 355
, 373
, 467
Sh
rubs
4.6E
–18.
5E–1
2.2E
–13.
4E+0
5.5E
–26.
2E+0
127
342,
345
, 347
, 348
B
(bor
on)
Lich
ens a
nd b
ryop
hyte
s3.
5E–1
6.0E
–11.
7E–1
3.3E
+02.
3E–2
2.4E
+019
348
Shru
bs1.
4E+0
1.7E
+08.
6E–1
2.7E
+09.
3E–2
6.8E
+012
034
7, 3
48
Ba
(bar
ium
)A
rthro
pods
3.8E
–21
518
Gra
sses
and
her
bs6.
5E–2
4.4E
–25.
4E–2
1.8E
+03.
4E–2
7.2E
–219
467,
518

34
TAB
LE 5
. C
ON
CEN
TRAT
ION
R
ATIO
(C
Rw
o-so
il)
VALU
ES
FOR
W
ILD
LIFE
G
RO
UPS
IN
TE
RR
ESTR
IAL
ECO
SYST
EMS
(con
t.)
Wild
life
grou
p(te
rres
trial
)
CR
wo-
soil
(Bq/
kg, f
resh
wei
ght w
hole
org
anis
m:B
q/kg
, dry
wei
ght s
oil)
ID n
umbe
ra
AM
AM
SDG
MG
MSD
Min
imum
Max
imum
N
Lich
ens a
nd b
ryop
hyte
s1.
8E–1
1.2E
–11.
5E–1
1.8E
+02.
1E–2
6.0E
–137
348,
355
, 467
M
amm
als:
om
nivo
rous
c4.
9E–3
1.1E
–34.
8E–3
1.2E
+04.
3E–3
5.8E
–318
518
Shru
bs2.
7E+0
1.8E
+02.
2E+0
1.8E
+01.
3E–2
9.8E
+013
134
7, 3
48, 4
67
Tree
s: c
onife
rous
c1.
9E–1
1.3E
–11.
6E–1
1.8E
+06.
2E–2
2.6E
–13
467
Be
(ber
yliu
m)
Lich
ens a
nd b
ryop
hyte
s1.
6E–1
1.3E
–11.
2E–1
2.0E
+03.
8E–2
4.7E
–119
348,
355
Sh
rubs
9.4E
–23.
9E–2
8.6E
–21.
5E+0
4.7E
–21.
6E–1
834
7, 3
48
Br
(bro
min
e)G
rass
es a
nd h
erbs
7.3E
–12.
9E–1
6.8E
–11.
5E+0
6.3E
–11.
2E+0
646
7Li
chen
s and
bry
ophy
tes
1.0E
+05.
3E–1
9.0E
–11.
6E+0
3.2E
–11.
7E+0
546
7Sh
rubs
1.6E
–14.
4E–2
1.5E
–11.
3E+0
1.3E
–12.
2E–1
1146
7Tr
ees
8.5E
–24.
9E–2
7.4E
–21.
7E+0
3.2E
–21.
2E–1
446
7C
d (c
adm
ium
)
Am
phib
ians
1.5E
–27.
9E–3
1.3E
–21.
7E+0
5.0E
–32.
4E–2
521
3A
nnel
ids
4.6E
+03.
6E+0
3.6E
+02.
0E+0
3.9E
–12.
1E+1
398
199,
229
, 264
, 344
A
rach
nids
1.9E
+15.
6E+0
1.8E
+11.
3E+0
3015
8A
rthro
pods
2.7E
+04.
5E+0
1.4E
+03.
2E+0
2.1E
–14.
0E+1
679
158,
202
, 204
, 254
, 344
A
rthro
pods
: car
nivo
rous
3.1E
+05.
6E–1
3.0E
+01.
2E+0
3.0E
+03.
9E+0
167
158,
202

35
TAB
LE 5
. C
ON
CEN
TRAT
ION
R
ATIO
(C
Rw
o-so
il)
VALU
ES
FOR
W
ILD
LIFE
G
RO
UPS
IN
TE
RR
ESTR
IAL
ECO
SYST
EMS
(con
t.)
Wild
life
grou
p(te
rres
trial
)
CR
wo-
soil
(Bq/
kg, f
resh
wei
ght w
hole
org
anis
m:B
q/kg
, dry
wei
ght s
oil)
ID n
umbe
ra
AM
AM
SDG
MG
MSD
Min
imum
Max
imum
N
Arth
ropo
ds: d
etrit
ivor
ous
2.8E
+04.
9E+0
1.4E
+03.
3E+0
8.8E
–14.
0E+1
279
204,
254
, 344
Gra
sses
and
her
bs2.
1E+0
2.0E
+01.
5E+0
2.3E
+03.
5E–1
9.3E
+053
015
8, 1
80, 2
02
Gra
sses
3.4E
+02.
2E+0
2.9E
+01.
8E+0
2.5E
+09.
3E+0
223
158,
202
Li
chen
s and
bry
ophy
tes
4.1E
–11.
2E–1
3.9E
–11.
3E+0
2.3E
–17.
3E–1
3034
8M
amm
als
1.6E
+03.
1E+0
7.2E
–13.
5E+0
8.5E
–22.
1E+1
415
158,
243
M
amm
als:
car
nivo
rous
1.3E
+02.
9E+0
5.4E
–13.
8E+0
8.5E
–22.
1E+1
395
158,
243
M
amm
als:
her
bivo
rous
6.8E
+08.
9E–1
6.7E
+01.
1E+0
2015
8M
ollu
scs:
gas
tropo
d6.
3E–1
3.7E
–15.
4E–1
1.7E
+02.
5E–1
1.3E
+034
232
Shru
bs1.
6E–1
1.0E
–11.
4E–1
1.8E
+05.
0E–2
4.0E
–136
240,
347
, 348
, 354
Tr
ees
7.1E
–11.
3E+0
3.5E
–13.
3E+0
5.4E
–37.
2E+0
228
180,
233
C
e (c
eriu
m)
A
nnel
ids
3.7E
–41
264
Gra
sses
and
her
bs4.
7E–3
3.8E
–33.
6E–3
2.0E
+03.
9E–3
5.2E
–36
467
Lich
ens a
nd b
ryop
hyte
s1.
3E–2
8.8E
–31.
1E–2
1.8E
+05.
0E–3
2.8E
–25
467
Shru
bs4.
8E–2
2.3E
–19.
9E–3
5.9E
+01.
8E–3
3.2E
–177
252,
467
, 468
Tr
ees:
con
ifero
usc
3.3E
–32
467
Cl (
chlo
rine
)A
nnel
ids
1.8E
–16.
0E–2
1.7E
–11.
4E+0
1.7E
–12.
0E–1
1723
8A
rthro
pods
3.0E
–11.
2E–1
2.8E
–11.
5E+0
2.5E
–13.
9E–1
3123
8

36
TAB
LE 5
. C
ON
CEN
TRAT
ION
R
ATIO
(C
Rw
o-so
il)
VALU
ES
FOR
W
ILD
LIFE
G
RO
UPS
IN
TE
RR
ESTR
IAL
ECO
SYST
EMS
(con
t.)
Wild
life
grou
p(te
rres
trial
)
CR
wo-
soil
(Bq/
kg, f
resh
wei
ght w
hole
org
anis
m:B
q/kg
, dry
wei
ght s
oil)
ID n
umbe
ra
AM
AM
SDG
MG
MSD
Min
imum
Max
imum
N
Arth
ropo
ds: d
etrit
ivor
ous
3.2E
–11.
2E–1
2.9E
–11.
5E+0
2.7E
–13.
9E–1
2623
8G
rass
es a
nd h
erbs
2.1E
+11.
9E+1
1.5E
+12.
2E+0
1.9E
–29.
2E+1
5625
1, 4
94, 4
98
Lich
ens a
nd b
ryop
hyte
s9.
6E–1
125
1M
ollu
scs:
gas
tropo
d1.
7E–1
1.0E
–11.
4E–1
1.8E
+01.
5E–1
2.0E
–120
238
Shru
bs1.
0E+0
2.1E
+04.
7E–1
3.5E
+03.
2E–1
1.0E
+179
251
Tree
s1.
4E+0
1.2E
+01.
1E+0
2.1E
+02.
6E–1
3.9E
+011
251
Cm
(cur
ium
)
Arth
ropo
ds: d
etrit
ivor
ous
1.4E
–19.
5E–2
1.8E
–12
223
Gra
sses
c5.
0E–4
149
1Tr
ees:
bro
ad-le
afc
9.4E
–31.
7E–3
1.7E
–22
173
Co
(cob
alt)
Arth
ropo
ds6.
1E–3
5.1E
–34.
7E–3
2.1E
+03.
5E–3
6.2E
–317
175,
234
G
rass
es a
nd h
erbs
4.2E
–31.
5E–3
3.9E
–31.
4E+0
3.0E
–35.
3E–3
646
7Li
chen
s and
bry
ophy
tes
2.4E
–13.
8E–1
1.3E
–13.
1E+0
1.6E
–31.
8E+0
3734
8, 3
55, 4
67
Mam
mal
s: o
mni
voro
usc
3.0E
–13.
7E–1
1.8E
–12.
7E+0
5.9E
–21.
2E+0
2916
1Sh
rubs
7.2E
–28.
5E–2
4.7E
–22.
5E+0
1.4E
–36.
6E–1
128
347,
348
, 467
Tr
ees
8.7E
–31.
3E–2
4.9E
–32.
9E+0
3.8E
–43.
0E–2
717
4, 4
67

37
TAB
LE 5
. C
ON
CEN
TRAT
ION
R
ATIO
(C
Rw
o-so
il)
VALU
ES
FOR
W
ILD
LIFE
G
RO
UPS
IN
TE
RR
ESTR
IAL
ECO
SYST
EMS
(con
t.)
Wild
life
grou
p(te
rres
trial
)
CR
wo-
soil
(Bq/
kg, f
resh
wei
ght w
hole
org
anis
m:B
q/kg
, dry
wei
ght s
oil)
ID n
umbe
ra
AM
AM
SDG
MG
MSD
Min
imum
Max
imum
N
Cr
(chr
omiu
m)
G
rass
es a
nd h
erbs
6.6E
–33.
6E–3
5.8E
–31.
7E+0
4.4E
–38.
6E–3
646
7Li
chen
s and
bry
ophy
tes
1.3E
–11.
1E–1
1.0E
–12.
1E+0
3.8E
–33.
1E–1
1734
8, 4
67
Shru
bs1.
0E–1
1.4E
–15.
8E–2
2.9E
+01.
3E–3
4.9E
–123
347,
348
, 467
T r
ees:
con
ifero
usc
4.1E
–31.
8E–3
3.8E
–31.
5E+0
2.5E
–34.
9E–3
346
7C
s (ca
esiu
m)
Am
phib
ians
4.4E
–18.
1E–1
2.1E
–13.
4E+0
3.2E
–22.
1E+0
137
188,
205
, 256
, 486
A
nnel
ids
9.0E
–21.
6E–1
4.3E
–23.
4E+0
1.5E
–26.
9E–1
1917
1, 2
07, 2
64, 4
88
Ara
chni
ds3.
0E–2
3.5E
–21.
9E–2
2.5E
+02.
0E–2
1.6E
–120
170,
488
A
rthro
pods
1.1E
–14.
7E–1
2.4E
–25.
7E+0
2.0E
–31.
7E+0
192
169,
170
, 172
, 175
, 176
, 195
, 223
, 25
7, 3
82, 3
88, 4
88
Arth
ropo
ds: c
arni
voro
us2.
5E–1
4.7E
–11.
1E–1
3.5E
+01.
1E–2
1.7E
+015
170,
195
, 488
A
rthro
pods
: det
ritiv
orou
s9.
0E–2
2.9E
–12.
7E–2
4.7E
+03.
0E–3
1.4E
+076
169,
170
, 172
, 176
, 223
, 257
, 488
A
rthro
pods
: her
bivo
rous
9.8E
–31.
8E–2
4.7E
–33.
4E+0
3.0E
–37.
1E–2
2517
0, 1
76
Bird
s6.
7E–1
1.6E
+02.
7E–1
3.9E
+01.
4E–3
1.6E
+118
016
3, 1
89, 1
90, 2
28, 2
58, 2
63, 4
05,
486
Bird
s: h
erbi
voro
us1.
0E+0
1.5E
+05.
4E–1
3.0E
+02.
3E–2
5.8E
+057
163,
190
, 228
, 258
, 263
, 405
, 486
B
irds:
om
nivo
rous
5.7E
–11.
8E+0
1.7E
–14.
8E+0
9.4E
–31.
6E+1
7918
9, 1
90, 4
05, 4
86

38
TAB
LE 5
. C
ON
CEN
TRAT
ION
R
ATIO
(C
Rw
o-so
il)
VALU
ES
FOR
W
ILD
LIFE
G
RO
UPS
IN
TE
RR
ESTR
IAL
ECO
SYST
EMS
(con
t.)
Wild
life
grou
p(te
rres
trial
)
CR
wo-
soil
(Bq/
kg, f
resh
wei
ght w
hole
org
anis
m:B
q/kg
, dry
wei
ght s
oil)
ID n
umbe
ra
AM
AM
SDG
MG
MSD
Min
imum
Max
imum
N
Gra
sses
and
her
bs1.
2E+0
2.6E
+05.
1E–1
3.7E
+01.
9E–3
3.7E
+120
2816
6, 1
93, 2
10, 2
36, 2
53, 2
57, 2
59,
272,
395
, 400
, 403
, 404
, 409
, 413
, 41
4, 4
32, 4
33, 4
34, 4
35, 4
37, 4
42,
443,
444
, 448
, 452
, 453
, 467
, 486
, 49
8, 5
00, 5
01, 5
10, 5
16, 5
19
Gra
sses
1.8E
+03.
2E+0
8.5E
–13.
4E+0
3.6E
–33.
7E+1
1081
210,
236
, 253
, 272
, 395
, 409
, 413
, 41
4, 4
48, 4
53, 4
86, 5
01, 5
10, 5
19
Her
bs1.
1E+0
2.2E
+05.
0E–1
3.5E
+03.
0E–3
2.2E
+115
525
3, 2
72, 4
00, 4
03, 4
09, 4
32, 4
52,
467,
500
, 519
Li
chen
s and
bry
ophy
tes
4.1E
+03.
9E+0
3.0E
+02.
2E+0
3.0E
–21.
4E+1
142
163,
253
, 272
, 382
, 435
, 440
, 467
, 48
6, 5
19
Mam
mal
s3.
5E+0
8.3E
+01.
3E+0
4.0E
+02.
8E–3
1.4E
+224
6316
3, 1
68, 1
72, 1
84, 1
90, 2
08, 2
09,
228,
230
, 242
, 268
, 275
, 289
, 294
, 40
5, 4
06, 4
86, 4
88
Mam
mal
s: c
arni
voro
us5.
4E–1
1.9E
+01.
4E–1
5.1E
+02.
8E–3
2.3E
+123
119
0, 2
75, 4
05, 4
06, 4
86, 4
88
Mam
mal
s: h
erbi
voro
us3.
9E+0
9.1E
+01.
5E+0
3.9E
+01.
0E–2
1.4E
+218
7916
3, 1
84, 1
90, 2
08, 2
09, 2
28, 2
30,
242,
268
, 294
, 405
, 486
, 488
M
amm
als:
om
nivo
rous
3.2E
+05.
2E+0
1.7E
+03.
1E+0
1.7E
–23.
6E+1
335
168,
190
, 268
, 289
, 405
, 486
, 488
M
amm
als:
Ran
gife
r spp
.b1.
7E+1
1.6E
+11.
3E+1
2.2E
+01.
2E–1
8.1E
+191
616
0, 1
63, 1
64, 2
18, 2
28, 2
41
Mol
lusc
s: g
astro
pod
4.0E
–23.
1E–2
3.2E
–22.
0E+0
2.1E
–26.
5E–2
2319
1, 4
86, 4
88
Rep
tiles
5.8E
–11.
0E+0
2.8E
–13.
3E+0
6.0E
–43.
0E+0
137
169,
267
, 407
, 486
, 487

39
TAB
LE 5
. C
ON
CEN
TRAT
ION
R
ATIO
(C
Rw
o-so
il)
VALU
ES
FOR
W
ILD
LIFE
G
RO
UPS
IN
TE
RR
ESTR
IAL
ECO
SYST
EMS
(con
t.)
Wild
life
grou
p(te
rres
trial
)
CR
wo-
soil
(Bq/
kg, f
resh
wei
ght w
hole
org
anis
m:B
q/kg
, dry
wei
ght s
oil)
ID n
umbe
ra
AM
AM
SDG
MG
MSD
Min
imum
Max
imum
N
Rep
tiles
: car
nivo
rous
5.2E
–19.
4E–1
2.5E
–13.
3E+0
6.0E
–43.
0E+0
125
169,
267
, 407
, 486
, 487
Sh
rubs
2.3E
+04.
0E+0
1.1E
+03.
3E+0
9.8E
–31.
6E+1
354
164,
167
, 210
, 272
, 468
, 472
, 486
, 51
9 Tr
ees
1.4E
–12.
4E–1
7.5E
–23.
1E+0
1.2E
–31.
8E+0
487
183,
190
, 210
, 265
, 470
, 471
, 472
, 47
3, 4
74, 4
75, 4
76, 4
77, 4
78, 4
84,
485,
519
Tr
ees:
bro
ad-le
af1.
4E–1
2.2E
–17.
5E–2
3.1E
+01.
2E–3
1.3E
+025
219
0, 2
10, 2
65, 4
70, 4
71, 4
72, 4
73,
474,
475
, 477
, 478
, 484
, 485
, 519
Tr
ees:
con
ifero
us1.
5E–1
2.5E
–17.
5E–2
3.2E
+01.
2E–3
1.8E
+023
518
3, 4
72, 4
74, 4
75, 4
76, 4
84
Cu
(cop
per)
Ann
elid
s2.
2E–1
4.8E
–22.
1E–1
1.2E
+01.
3E–1
3.8E
–138
334
4A
rthro
pods
7.5E
–19.
0E–1
4.8E
–12.
6E+0
1.7E
–14.
8E+0
254
344
Arth
ropo
ds: d
etrit
ivor
ous
2.5E
+01.
2E+0
2.3E
+01.
6E+0
8.0E
–14.
8E+0
3534
4Li
chen
s and
bry
ophy
tes
6.0E
–15.
4E–1
4.5E
–12.
1E+0
7.1E
–22.
5E+0
9133
4, 3
42, 3
45, 3
48, 3
55
Rep
tiles
: car
nivo
rous
c3.
2E–2
6.8E
–11.
5E–3
1.2E
+11.
3E–2
7.8E
–244
487
Shru
bs3.
8E+0
3.4E
+02.
8E+0
2.2E
+02.
7E–1
1.4E
+123
934
2, 3
45, 3
47, 3
48
Eu
(eur
opiu
m)
Ann
elid
s7.
9E–4
126
4G
rass
es a
nd h
erbs
4.5E
–33.
3E–3
3.6E
–31.
9E+0
2.9E
–35.
9E–3
646
7
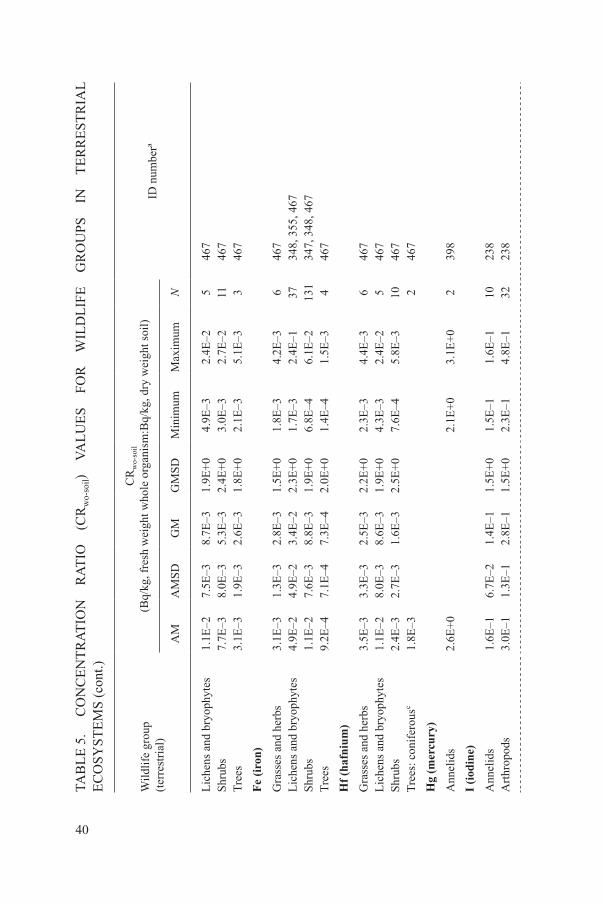
40
TAB
LE 5
. C
ON
CEN
TRAT
ION
R
ATIO
(C
Rw
o-so
il)
VALU
ES
FOR
W
ILD
LIFE
G
RO
UPS
IN
TE
RR
ESTR
IAL
ECO
SYST
EMS
(con
t.)
Wild
life
grou
p(te
rres
trial
)
CR
wo-
soil
(Bq/
kg, f
resh
wei
ght w
hole
org
anis
m:B
q/kg
, dry
wei
ght s
oil)
ID n
umbe
ra
AM
AM
SDG
MG
MSD
Min
imum
Max
imum
N
Lich
ens a
nd b
ryop
hyte
s1.
1E–2
7.5E
–38.
7E–3
1.9E
+04.
9E–3
2.4E
–25
467
Shru
bs7.
7E–3
8.0E
–35.
3E–3
2.4E
+03.
0E–3
2.7E
–211
467
Tree
s3.
1E–3
1.9E
–32.
6E–3
1.8E
+02.
1E–3
5.1E
–33
467
Fe (i
ron)
G
rass
es a
nd h
erbs
3.1E
–31.
3E–3
2.8E
–31.
5E+0
1.8E
–34.
2E–3
646
7Li
chen
s and
bry
ophy
tes
4.9E
–24.
9E–2
3.4E
–22.
3E+0
1.7E
–32.
4E–1
3734
8, 3
55, 4
67
Shru
bs1.
1E–2
7.6E
–38.
8E–3
1.9E
+06.
8E–4
6.1E
–213
134
7, 3
48, 4
67
Tree
s9.
2E–4
7.1E
–47.
3E–4
2.0E
+01.
4E–4
1.5E
–34
467
Hf (
hafn
ium
)
Gra
sses
and
her
bs3.
5E–3
3.3E
–32.
5E–3
2.2E
+02.
3E–3
4.4E
–36
467
Lich
ens a
nd b
ryop
hyte
s1.
1E–2
8.0E
–38.
6E–3
1.9E
+04.
3E–3
2.4E
–25
467
Shru
bs2.
4E–3
2.7E
–31.
6E–3
2.5E
+07.
6E–4
5.8E
–310
467
Tree
s: c
onife
rous
c1.
8E–3
246
7H
g (m
ercu
ry)
Ann
elid
s2.
6E+0
2.1E
+03.
1E+0
239
8I (
iodi
ne)
Ann
elid
s1.
6E–1
6.7E
–21.
4E–1
1.5E
+01.
5E–1
1.6E
–110
238
Arth
ropo
ds3.
0E–1
1.3E
–12.
8E–1
1.5E
+02.
3E–1
4.8E
–132
238

41
TAB
LE 5
. C
ON
CEN
TRAT
ION
R
ATIO
(C
Rw
o-so
il)
VALU
ES
FOR
W
ILD
LIFE
G
RO
UPS
IN
TE
RR
ESTR
IAL
ECO
SYST
EMS
(con
t.)
Wild
life
grou
p(te
rres
trial
)
CR
wo-
soil
(Bq/
kg, f
resh
wei
ght w
hole
org
anis
m:B
q/kg
, dry
wei
ght s
oil)
ID n
umbe
ra
AM
AM
SDG
MG
MSD
Min
imum
Max
imum
N
Arth
ropo
ds: d
etrit
ivor
ous
3.2E
–11.
4E–1
2.9E
–11.
5E+0
2.3E
–14.
8E–1
2723
8G
rass
esc
1.4E
–13.
4E–1
5.3E
–24.
0E+0
3917
9M
ollu
scs:
gas
tropo
d1.
8E–1
5.6E
–21.
7E–1
1.4E
+01.
5E–1
2.2E
–112
238
La
(lant
hanu
m)
G
rass
es a
nd h
erbs
6.3E
–32.
3E–3
6.0E
–31.
4E+0
4.1E
–38.
0E–3
646
7Li
chen
s and
bry
ophy
tes
2.0E
–21.
2E–2
1.7E
–21.
8E+0
8.1E
–34.
0E–2
546
7Sh
rubs
1.3E
–21.
0E–2
9.9E
–32.
0E+0
6.6E
–33.
7E–2
1146
7Tr
ees
4.0E
–31.
8E–3
3.6E
–31.
5E+0
1.6E
–35.
5E–3
446
7L
u (lu
tetiu
m)
G
rass
es a
nd h
erbs
6.1E
–38.
6E–3
3.5E
–32.
8E+0
3.9E
–37.
6E–3
546
7Li
chen
s and
bry
ophy
tes
1.4E
–28.
8E–3
1.1E
–21.
8E+0
6.4E
–32.
4E–2
346
7Sh
rubs
1.1E
–24.
2E–3
1.0E
–21.
5E+0
8.7E
–31.
5E–2
546
7Tr
ees:
con
ifero
usc
4.0E
–32
467
Mn
(man
gane
se)
Ann
elid
s1.
6E–2
9.1E
–31.
3E–2
1.7E
+01.
1E–3
2.4E
–25
199,
264
Li
chen
s and
bry
ophy
tes
1.5E
+01.
0E+0
1.3E
+01.
8E+0
6.7E
–15.
3E+0
3234
8, 3
55
Mam
mal
s: c
arni
voro
usc
2.5E
–38.
2E–4
2.4E
–31.
4E+0
1.9E
–33.
6E–3
419
9M
ollu
scs:
gas
tropo
d4.
6E–2
1.6E
–24.
4E–2
1.4E
+03.
9E–2
6.4E
–27
191

42
TAB
LE 5
. C
ON
CEN
TRAT
ION
R
ATIO
(C
Rw
o-so
il)
VALU
ES
FOR
W
ILD
LIFE
G
RO
UPS
IN
TE
RR
ESTR
IAL
ECO
SYST
EMS
(con
t.)
Wild
life
grou
p(te
rres
trial
)
CR
wo-
soil
(Bq/
kg, f
resh
wei
ght w
hole
org
anis
m:B
q/kg
, dry
wei
ght s
oil)
ID n
umbe
ra
AM
AM
SDG
MG
MSD
Min
imum
Max
imum
N
Rep
tiles
: car
nivo
rous
c1.
0E–2
148
7Sh
rubs
2.1E
+12.
5E+1
1.4E
+12.
5E+0
1.0E
+01.
1E+2
184
252,
347
, 348
Tr
ees:
bro
ad-le
afc
4.0E
–25.
2E–2
2.4E
–22.
7E+0
1.8E
–31.
0E–1
325
5M
o (m
olyb
denu
m)
Lich
ens a
nd b
ryop
hyte
s1.
9E+0
2.1E
+01.
3E+0
2.5E
+04.
3E–1
6.7E
+018
348
Shru
bs1.
1E+0
9.7E
–18.
7E–1
2.1E
+02.
9E–1
4.0E
+023
347,
348
N
a (s
odiu
m)
Gra
sses
and
her
bs1.
2E–2
2.8E
–31.
2E–2
1.3E
+01.
0E–2
1.4E
–26
467
Lich
ens a
nd b
ryop
hyte
s3.
4E–2
2.5E
–22.
8E–2
1.9E
+01.
7E–2
7.5E
–25
467
Shru
bs1.
3E–2
3.7E
–31.
2E–2
1.3E
+01.
0E–2
2.0E
–211
467
Tree
s6.
2E–3
1.6E
–36.
0E–3
1.3E
+05.
4E–3
7.8E
–33
467
Nb
(nio
bium
)
Ann
elid
s5.
1E–4
126
4N
d (n
eody
miu
m)
Lich
ens a
nd b
ryop
hyte
s3.
4E–2
1.7E
–25.
1E–2
246
7Sh
rubs
1.7E
–21
467

43
TAB
LE 5
. C
ON
CEN
TRAT
ION
R
ATIO
(C
Rw
o-so
il)
VALU
ES
FOR
W
ILD
LIFE
G
RO
UPS
IN
TE
RR
ESTR
IAL
ECO
SYST
EMS
(con
t.)
Wild
life
grou
p(te
rres
trial
)
CR
wo-
soil
(Bq/
kg, f
resh
wei
ght w
hole
org
anis
m:B
q/kg
, dry
wei
ght s
oil)
ID n
umbe
ra
AM
AM
SDG
MG
MSD
Min
imum
Max
imum
N
Ni (
nick
el)
Ann
elid
s7.
4E–2
7.5E
–25.
2E–2
2.3E
+05.
7E–3
3.2E
–177
165,
199
, 219
, 237
, 264
A
rthro
pods
8.6E
–31
234
Gra
sses
and
her
bs2.
0E–1
5.5E
–16.
7E–2
4.4E
+01.
3E–2
7.1E
–116
918
0, 2
85, 2
86, 3
34
Gra
sses
2.2E
–11.
6E–1
1.8E
–11.
9E+0
1.3E
–27.
1E–1
5828
5, 2
86, 3
34
Lich
ens a
nd b
ryop
hyte
s6.
7E–1
1.6E
+02.
6E–1
4.0E
+02.
7E–2
1.1E
+110
833
4, 3
42, 3
45, 3
48, 3
49, 3
55, 3
73,
467
Mam
mal
s: c
arni
voro
usc
7.2E
–21.
4E–3
1.4E
–12
199
Mol
lusc
s: g
astro
pod
1.8E
–21.
0E–2
1.5E
–21.
7E+0
1.7E
–22.
0E–2
719
1R
eptil
es: c
arni
voro
usc
3.0E
–11
487
Shru
bs4.
3E–1
5.3E
–12.
7E–1
2.6E
+01.
1E–2
4.2E
+030
125
2, 3
42, 3
45, 3
47, 3
48, 4
67
Tree
s: b
road
-leaf
c1.
8E–2
4.2E
–31.
8E–2
1.3E
+01.
3E–2
2.1E
–23
255
Pb (l
ead)
Am
phib
ians
1.2E
–15.
2E–1
2.7E
–25.
6E+0
8.8E
–42.
8E–1
2420
6, 2
13
Ann
elid
s5.
2E–1
7.5E
–12.
9E–1
2.9E
+02.
3E–3
2.8E
+064
715
9, 1
99, 2
29, 2
47, 2
64, 3
44
Ara
chni
ds5.
3E–2
4.3E
–26.
2E–2
226
2A
rthro
pods
4.0E
–14.
7E–1
2.6E
–12.
5E+0
4.6E
–31.
0E+0
561
159,
204
, 244
, 344
A
rthro
pods
: det
ritiv
orou
s7.
1E–1
4.2E
–16.
1E–1
1.7E
+01.
8E–2
1.0E
+031
415
9, 2
04, 2
44, 3
44
Bird
s: c
arni
voro
usc
6.2E
–21.
7E–1
2.1E
–24.
4E+0
424
247

44
TAB
LE 5
. C
ON
CEN
TRAT
ION
R
ATIO
(C
Rw
o-so
il)
VALU
ES
FOR
W
ILD
LIFE
G
RO
UPS
IN
TE
RR
ESTR
IAL
ECO
SYST
EMS
(con
t.)
Wild
life
grou
p(te
rres
trial
)
CR
wo-
soil
(Bq/
kg, f
resh
wei
ght w
hole
org
anis
m:B
q/kg
, dry
wei
ght s
oil)
ID n
umbe
ra
AM
AM
SDG
MG
MSD
Min
imum
Max
imum
N
Gra
sses
and
her
bs9.
6E–2
2.3E
–13.
8E–2
3.9E
+04.
7E–3
1.0E
+030
118
0, 2
15, 2
20, 2
35, 2
71, 2
93, 3
34
Gra
sses
1.3E
–11.
9E–1
7.5E
–22.
9E+0
4.7E
–35.
5E–1
7422
0, 2
35, 2
93, 3
34
Lich
ens a
nd b
ryop
hyte
s4.
6E+0
4.2E
+03.
4E+0
2.2E
+02.
0E–2
4.5E
+135
116
3, 2
01, 2
58, 3
34, 3
42, 3
45, 3
48,
349,
355
M
amm
als
3.8E
–23.
6E–2
2.8E
–22.
2E+0
2.7E
–42.
0E–1
515
159,
181
, 182
, 185
, 186
, 187
, 198
, 21
1, 2
24, 2
25, 2
26, 2
27, 2
43, 4
29,
458
Mam
mal
s: c
arni
voro
us4.
7E–2
2.8E
–24.
0E–2
1.7E
+08.
8E–3
7.7E
–236
815
9, 2
43
Mam
mal
s: h
erbi
voro
us2.
0E–2
2.7E
–21.
2E–2
2.8E
+01.
9E–3
2.0E
–192
159,
181
, 182
, 185
, 186
, 187
, 198
, 21
1, 2
24, 2
25, 2
26, 2
27, 4
29
Mam
mal
s: o
mni
voro
us1.
2E–2
6.3E
–22.
2E–3
6.3E
+02.
7E–4
3.9E
–251
198,
211
, 429
M
amm
als:
Ran
gife
r spp
.b3.
6E+0
3.3E
+02.
7E+0
2.2E
+04.
0E–1
1.8E
+127
016
3, 2
14, 2
18, 2
58
Mol
lusc
s: g
astro
pod
7.3E
–31.
3E–2
3.6E
–33.
3E+0
6.1E
–43.
8E–2
4719
1, 2
32
Rep
tiles
3.7E
–11.
0E+0
1.3E
–14.
3E+0
1.4E
–31.
2E+0
4545
0, 4
87
Rep
tiles
: car
nivo
rous
3.8E
–21.
6E–1
8.7E
–35.
6E+0
1.4E
–37.
0E–2
3245
0, 4
87
Shru
bs1.
2E+0
1.9E
+06.
4E–1
3.1E
+01.
4E–3
1.5E
+174
016
7, 2
20, 2
49, 2
52, 3
42, 3
45, 3
47,
348
Tree
s7.
6E–2
1.1E
–14.
3E–2
2.9E
+06.
5E–3
5.8E
–142
220,
233
, 255
Tr
ees:
bro
ad-le
af8.
1E–2
1.2E
–14.
4E–2
3.0E
+06.
5E–3
5.8E
–132
220,
233
, 255

45
TAB
LE 5
. C
ON
CEN
TRAT
ION
R
ATIO
(C
Rw
o-so
il)
VALU
ES
FOR
W
ILD
LIFE
G
RO
UPS
IN
TE
RR
ESTR
IAL
ECO
SYST
EMS
(con
t.)
Wild
life
grou
p(te
rres
trial
)
CR
wo-
soil
(Bq/
kg, f
resh
wei
ght w
hole
org
anis
m:B
q/kg
, dry
wei
ght s
oil)
ID n
umbe
ra
AM
AM
SDG
MG
MSD
Min
imum
Max
imum
N
Po (p
olon
ium
)
Ann
elid
s1.
0E–1
3.9E
–29.
6E–2
1.4E
+01.
0E–1
1.0E
–17
384
Bird
s: h
erbi
voro
us1.
0E–2
2.9E
–39.
6E–3
1.3E
+05
384
Gra
sses
and
her
bs3.
1E–1
4.9E
–11.
7E–1
3.0E
+01.
7E–2
1.9E
+071
215,
220
, 235
, 277
, 334
G
rass
es3.
8E–1
5.2E
–12.
3E–1
2.8E
+01.
7E–2
1.9E
+049
220,
235
, 277
, 334
Li
chen
s and
bry
ophy
tes
6.7E
+06.
8E+0
4.7E
+02.
3E+0
5.4E
–13.
0E+1
166
163,
201
, 334
, 342
, 348
, 349
, 355
, 37
3 M
amm
als
8.6E
–22.
1E–1
3.3E
–24.
0E+0
2.4E
–41.
1E+0
6761
, 181
, 182
, 185
, 186
, 187
, 196
, 22
4, 2
25, 2
26, 2
27, 3
84, 4
23, 4
29,
450,
509
M
amm
als:
car
nivo
rous
1.2E
–18.
7E–2
9.7E
–21.
9E+0
1.9E
–21.
4E–1
1161
, 384
M
amm
als:
her
bivo
rous
2.9E
–31.
9E–3
2.4E
–31.
8E+0
2.4E
–49.
5E–3
3818
1, 1
82, 1
85, 1
86, 1
87, 1
96, 2
24,
225,
226
, 227
, 429
M
amm
als:
om
nivo
rous
2.1E
–11.
2E–1
1.8E
–11.
7E+0
7.5E
–42.
6E–1
1038
4, 4
29, 4
50
Mam
mal
s: R
angi
fer s
pp.b
2.5E
+03.
7E+0
1.4E
+03.
0E+0
5.9E
–12.
1E+1
199
163,
214
, 258
R
eptil
es9.
5E+0
2.3E
+13.
6E+0
4.0E
+01.
9E–2
1.1E
+115
450,
487
Sh
rubs
1.3E
+01.
2E+0
9.3E
–12.
2E+0
1.9E
–38.
0E+0
448
164,
220
, 342
, 345
, 347
, 348
Tr
ees
3.8E
–22.
2E–2
3.3E
–21.
7E+0
1.3E
–25.
5E–2
2022
0

46
TAB
LE 5
. C
ON
CEN
TRAT
ION
R
ATIO
(C
Rw
o-so
il)
VALU
ES
FOR
W
ILD
LIFE
G
RO
UPS
IN
TE
RR
ESTR
IAL
ECO
SYST
EMS
(con
t.)
Wild
life
grou
p(te
rres
trial
)
CR
wo-
soil
(Bq/
kg, f
resh
wei
ght w
hole
org
anis
m:B
q/kg
, dry
wei
ght s
oil)
ID n
umbe
ra
AM
AM
SDG
MG
MSD
Min
imum
Max
imum
N
Pu (p
luto
nium
)
Ann
elid
s3.
1E–2
3.2E
–22.
1E–2
2.4E
+016
488
Ara
chni
ds3.
2E–2
3.5E
–22.
2E–2
2.4E
+01.
9E–2
3.6E
–235
170,
488
A
rthro
pods
3.1E
–24.
9E–2
1.6E
–23.
1E+0
4.2E
–42.
5E–1
150
170,
216
, 223
, 261
, 382
, 407
, 488
A
rthro
pods
: det
ritiv
orou
s3.
6E–2
5.4E
–22.
0E–2
3.0E
+01.
6E–3
1.6E
–168
170,
216
, 223
, 488
B
irds
2.3E
–34.
8E–3
9.8E
–43.
7E+0
3.3E
–51.
5E–2
2640
5, 4
86
Bird
s: o
mni
voro
us2.
9E–3
5.8E
–31.
3E–3
3.6E
+03.
3E–5
1.5E
–216
405,
486
G
rass
esc
1.6E
–22.
3E–2
9.4E
–32.
8E+0
1.2E
–24.
3E–2
7817
7, 2
50, 4
86
Lich
ens a
nd b
ryop
hyte
s1.
3E–1
1.0E
–11.
6E–1
238
2M
amm
als
5.0E
–22.
6E–1
9.3E
–36.
3E+0
1.6E
–42.
6E+0
219
172,
184
, 197
, 221
, 222
, 245
, 261
, 26
8, 4
05, 4
07, 4
88
Mam
mal
s: c
arni
voro
us5.
0E–3
6.1E
–33.
1E–3
2.6E
+07.
1E–4
2.2E
–229
197,
405
, 488
M
amm
als:
her
bivo
rous
5.3E
–23.
0E–1
9.2E
–36.
5E+0
1.6E
–42.
8E–1
5618
4, 2
22, 2
68, 4
05, 4
07, 4
88
Mam
mal
s: o
mni
voro
us5.
9E–2
3.0E
–11.
1E–2
6.1E
+02.
2E–4
2.6E
+011
322
1, 2
45, 2
68, 4
05, 4
88
Mam
mal
s: R
angi
fer s
pp.b
6.1E
–38.
8E–3
3.5E
–32.
9E+0
3.3E
–37.
6E–3
919
7M
ollu
scs:
gas
tropo
d1.
2E–1
8.6E
–29.
7E–2
1.9E
+016
488
Rep
tiles
: car
nivo
rous
c3.
3E–3
6.5E
–31.
5E–3
3.6E
+01.
0E–5
2.0E
–241
267,
407
, 486
, 487
Sh
rubs
8.9E
–21.
6E–1
4.3E
–23.
3E+0
4.4E
–53.
3E–1
419
6, 4
68

47
TAB
LE 5
. C
ON
CEN
TRAT
ION
R
ATIO
(C
Rw
o-so
il)
VALU
ES
FOR
W
ILD
LIFE
G
RO
UPS
IN
TE
RR
ESTR
IAL
ECO
SYST
EMS
(con
t.)
Wild
life
grou
p(te
rres
trial
)
CR
wo-
soil
(Bq/
kg, f
resh
wei
ght w
hole
org
anis
m:B
q/kg
, dry
wei
ght s
oil)
ID n
umbe
ra
AM
AM
SDG
MG
MSD
Min
imum
Max
imum
N
Ra
(rad
ium
)A
rthro
pods
3.2E
+03.
6E+0
2.1E
+02.
5E+0
1.0E
–28.
9E+0
2719
2, 2
39, 3
88
Bird
s3.
6E–2
5.1E
–22.
1E–2
2.8E
+02.
1E–3
2.0E
–148
239,
260
B
irds:
car
nivo
rous
5.2E
–26.
9E–2
3.1E
–22.
7E+0
2.7E
–32.
0E–1
1623
9B
irds:
her
bivo
rous
3.3E
–24.
1E–2
2.1E
–22.
6E+0
2.1E
–31.
9E–1
2523
9, 2
60
Gra
sses
and
her
bs1.
9E–1
6.6E
–15.
4E–2
4.9E
+05.
1E–5
1.2E
+146
421
5, 2
20, 2
39, 2
66, 2
70, 2
72, 2
73,
276,
278
, 280
, 287
, 288
, 290
, 292
, 29
3, 2
95, 2
96, 2
98, 3
34, 4
55, 4
59
Gra
sses
2.0E
–17.
2E–1
5.1E
–25.
1E+0
5.1E
–51.
2E+1
382
220,
239
, 266
, 270
, 272
, 273
, 276
, 27
8, 2
80, 2
87, 2
88, 2
90, 2
92, 2
93,
295,
298
, 334
, 459
H
erbs
2.3E
–13.
1E–1
1.4E
–12.
8E+0
1.6E
–21.
3E+0
2923
9, 2
66, 2
72, 4
59
Lich
ens a
nd b
ryop
hyte
s1.
7E+0
3.4E
+07.
6E–1
3.6E
+06.
5E–2
2.3E
+124
321
7, 2
72, 3
34, 3
42, 3
45, 3
48, 3
49,
355,
373
, 459
M
amm
als
4.7E
–21.
2E–1
1.7E
–24.
1E+0
5.7E
–57.
6E–1
8418
2, 1
85, 1
86, 1
87, 2
24, 2
25, 2
26,
227,
260
, 423
, 429
, 458
, 509
M
amm
als:
car
nivo
rous
4.6E
–22.
4E–2
4.1E
–21.
6E+0
1.5E
–21.
2E–1
2526
0M
amm
als:
her
bivo
rous
1.5E
–23.
4E–2
6.1E
–33.
8E+0
5.7E
–52.
0E–1
4518
2, 1
85, 1
86, 1
87, 2
24, 2
25, 2
26,
227,
260
, 429
M
amm
als:
mar
supi
al2.
2E–1
3.2E
–11.
3E–1
2.9E
+05.
5E–3
7.6E
–19
423,
458
, 509
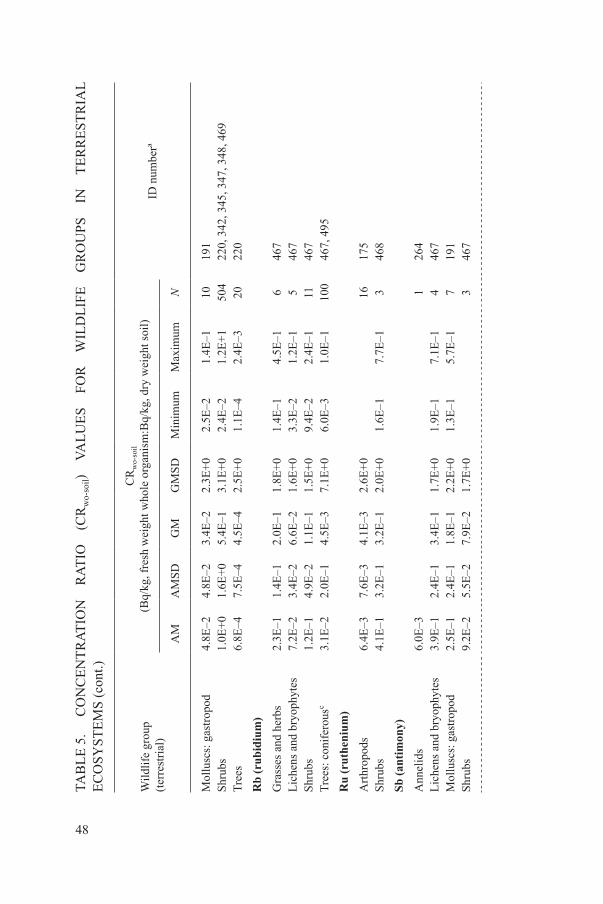
48
TAB
LE 5
. C
ON
CEN
TRAT
ION
R
ATIO
(C
Rw
o-so
il)
VALU
ES
FOR
W
ILD
LIFE
G
RO
UPS
IN
TE
RR
ESTR
IAL
ECO
SYST
EMS
(con
t.)
Wild
life
grou
p(te
rres
trial
)
CR
wo-
soil
(Bq/
kg, f
resh
wei
ght w
hole
org
anis
m:B
q/kg
, dry
wei
ght s
oil)
ID n
umbe
ra
AM
AM
SDG
MG
MSD
Min
imum
Max
imum
N
Mol
lusc
s: g
astro
pod
4.8E
–24.
8E–2
3.4E
–22.
3E+0
2.5E
–21.
4E–1
1019
1Sh
rubs
1.0E
+01.
6E+0
5.4E
–13.
1E+0
2.4E
–21.
2E+1
504
220,
342
, 345
, 347
, 348
, 469
Tr
ees
6.8E
–47.
5E–4
4.5E
–42.
5E+0
1.1E
–42.
4E–3
2022
0R
b (r
ubid
ium
)
Gra
sses
and
her
bs2.
3E–1
1.4E
–12.
0E–1
1.8E
+01.
4E–1
4.5E
–16
467
Lich
ens a
nd b
ryop
hyte
s7.
2E–2
3.4E
–26.
6E–2
1.6E
+03.
3E–2
1.2E
–15
467
Shru
bs1.
2E–1
4.9E
–21.
1E–1
1.5E
+09.
4E–2
2.4E
–111
467
Tree
s: c
onife
rous
c3.
1E–2
2.0E
–14.
5E–3
7.1E
+06.
0E–3
1.0E
–110
046
7, 4
95
Ru
(rut
heni
um)
Arth
ropo
ds6.
4E–3
7.6E
–34.
1E–3
2.6E
+016
175
Shru
bs4.
1E–1
3.2E
–13.
2E–1
2.0E
+01.
6E–1
7.7E
–13
468
Sb (a
ntim
ony)
Ann
elid
s6.
0E–3
126
4Li
chen
s and
bry
ophy
tes
3.9E
–12.
4E–1
3.4E
–11.
7E+0
1.9E
–17.
1E–1
446
7M
ollu
scs:
gas
tropo
d2.
5E–1
2.4E
–11.
8E–1
2.2E
+01.
3E–1
5.7E
–17
191
Shru
bs9.
2E–2
5.5E
–27.
9E–2
1.7E
+03
467

49
TAB
LE 5
. C
ON
CEN
TRAT
ION
R
ATIO
(C
Rw
o-so
il)
VALU
ES
FOR
W
ILD
LIFE
G
RO
UPS
IN
TE
RR
ESTR
IAL
ECO
SYST
EMS
(con
t.)
Wild
life
grou
p(te
rres
trial
)
CR
wo-
soil
(Bq/
kg, f
resh
wei
ght w
hole
org
anis
m:B
q/kg
, dry
wei
ght s
oil)
ID n
umbe
ra
AM
AM
SDG
MG
MSD
Min
imum
Max
imum
N
Sc (s
cand
ium
)G
rass
es a
nd h
erbs
3.0E
–31.
4E–3
2.7E
–31.
6E+0
1.7E
–34.
3E–3
646
7Li
chen
s and
bry
ophy
tes
4.3E
–33.
2E–3
3.4E
–31.
9E+0
1.3E
–39.
4E–3
546
7Sh
rubs
1.8E
–31.
8E–3
1.3E
–32.
3E+0
5.8E
–44.
5E–3
1146
7Tr
ees
7.4E
–47.
1E–4
5.4E
–42.
2E+0
1.3E
–41.
4E–3
446
7Se
(sel
eniu
m)
A
nnel
ids
1.5E
+01
231
Gra
sses
and
her
bsd
1.0E
+02.
1E+0
4.4E
–13.
6E+0
9.0E
–31.
2E+1
364
180,
492
, 497
, 498
G
rass
es1.
8E+0
1.6E
+01.
3E+0
2.1E
+05.
7E–1
5.4E
+048
497
Her
bse
1.4E
+02.
2E+0
8.1E
–12.
9E+0
1.0E
–11.
2E+1
132
492,
497
Li
chen
s and
bry
ophy
tes
3.6E
–12.
0E–1
3.1E
–11.
7E+0
9.0E
–21.
1E+0
1834
8, 4
67
Mam
mal
s6.
3E–2
3.8E
–11.
0E–2
6.7E
+012
246
Mol
lusc
s: g
astro
pod
3.5E
–23.
1E–2
2.6E
–22.
2E+0
2.0E
–27.
1E–2
719
1Sh
rubs
1.5E
+01.
4E+0
1.1E
+02.
2E+0
1.7E
–12.
6E+0
9424
8, 3
47, 3
48
Sm (s
amar
ium
)G
rass
es a
nd h
erbs
9.8E
–42.
4E–3
3.8E
–44.
0E+0
2.1E
–77.
6E–3
3928
1, 4
67, 4
99
Her
bs3.
3E–4
1.1E
–39.
2E–5
4.9E
+02.
1E–7
4.3E
–335
467,
499
Li
chen
s and
bry
ophy
tes
1.4E
–21.
0E–2
1.2E
–21.
9E+0
6.1E
–33.
1E–2
546
7

50
TAB
LE 5
. C
ON
CEN
TRAT
ION
R
ATIO
(C
Rw
o-so
il)
VALU
ES
FOR
W
ILD
LIFE
G
RO
UPS
IN
TE
RR
ESTR
IAL
ECO
SYST
EMS
(con
t.)
Wild
life
grou
p(te
rres
trial
)
CR
wo-
soil
(Bq/
kg, f
resh
wei
ght w
hole
org
anis
m:B
q/kg
, dry
wei
ght s
oil)
ID n
umbe
ra
AM
AM
SDG
MG
MSD
Min
imum
Max
imum
N
Shru
bs8.
5E–3
9.5E
–35.
7E–3
2.5E
+02.
6E–3
3.0E
–211
467
Tree
s2.
6E–3
1.7E
–32.
1E–3
1.8E
+04.
0E–4
4.1E
–34
467
Sn (t
in)
Li
chen
s and
bry
ophy
tes
2.0E
+01.
0E+0
2.9E
+02
355
Shru
bs2.
0E–1
4.8E
–21.
9E–1
1.3E
+01.
3E–1
2.5E
–18
347
Sr (s
tron
tium
)A
mph
ibia
ns1.
2E+0
1.2E
+07.
9E–1
2.4E
+01.
4E–1
2.5E
+022
188,
486
A
nnel
ids
9.0E
–31
264
Arth
ropo
ds4.
1E–1
1.9E
+08.
4E–2
5.9E
+06.
3E–2
1.9E
+031
169,
176
, 223
B
irds
4.8E
–18.
9E–1
2.3E
–13.
4E+0
4.8E
–37.
2E+0
9118
9, 1
90, 2
63, 4
05, 4
86
Bird
s: o
mni
voro
us5.
4E–1
9.7E
–12.
6E–1
3.3E
+04.
0E–2
7.2E
+074
189,
190
, 405
G
rass
es a
nd h
erbs
9.8E
–11.
8E+0
4.7E
–13.
4E+0
6.7E
–38.
8E+0
519
163,
193
, 404
, 414
, 432
, 433
, 434
, 43
5, 4
37, 4
42, 4
44, 4
51, 4
67, 4
86,
498,
501
G
rass
es1.
8E+0
3.1E
+09.
5E–1
3.2E
+05.
0E–2
6.3E
+048
163,
414
, 451
, 467
, 486
, 501
H
erbs
2.6E
+01.
6E+0
2.2E
+01.
8E+0
3.2E
–15.
0E+0
8941
4, 4
32, 4
33, 4
67
Lich
ens a
nd b
ryop
hyte
s4.
8E+0
7.1E
+02.
7E+0
2.9E
+04.
4E–2
2.8E
+110
416
3, 3
48, 3
55, 3
82, 4
40, 4
67
Mam
mal
s1.
6E+0
2.3E
+09.
5E–1
2.8E
+09.
9E–3
1.7E
+147
416
3, 1
90, 2
28, 2
45, 2
68, 4
05, 4
06
Mam
mal
s: c
arni
voro
us8.
6E–1
1.5E
+04.
3E–1
3.2E
+01.
3E–2
9.8E
+016
419
0, 4
05, 4
06

51
TAB
LE 5
. C
ON
CEN
TRAT
ION
R
ATIO
(C
Rw
o-so
il)
VALU
ES
FOR
W
ILD
LIFE
G
RO
UPS
IN
TE
RR
ESTR
IAL
ECO
SYST
EMS
(con
t.)
Wild
life
grou
p(te
rres
trial
)
CR
wo-
soil
(Bq/
kg, f
resh
wei
ght w
hole
org
anis
m:B
q/kg
, dry
wei
ght s
oil)
ID n
umbe
ra
AM
AM
SDG
MG
MSD
Min
imum
Max
imum
N
Mam
mal
s: h
erbi
voro
us2.
5E+0
3.0E
+01.
6E+0
2.5E
+09.
9E–3
1.7E
+110
816
3, 1
90, 2
28, 2
68, 4
05
Mam
mal
s: o
mni
voro
us1.
8E+0
2.2E
+01.
1E+0
2.6E
+03.
0E–2
1.0E
+120
219
0, 2
45, 2
68, 4
05
Mam
mal
s: R
angi
fer s
pp.b
6.5E
+04.
1E+0
5.5E
+01.
8E+0
4.8E
–31.
5E+1
435
160,
163
, 218
, 228
M
ollu
scs:
gas
tropo
d 9.
2E–2
3.1E
–28.
7E–2
1.4E
+07.
1E–2
1.0E
–17
191
Rep
tiles
3.8E
–16.
1E–1
2.0E
–13.
1E+0
2.1E
–22.
2E+0
7416
9, 2
67, 4
86, 4
87
Rep
tiles
: car
nivo
rous
3.6E
–15.
8E–1
1.9E
–13.
1E+0
2.1E
–21.
2E+0
7016
9, 2
67, 4
86, 4
87
Shru
bs4.
8E–1
7.8E
–12.
5E–1
3.1E
+04.
7E–3
6.7E
+030
716
4, 2
52, 3
47, 3
48, 4
67, 4
68
Tree
s4.
9E–1
1.1E
+02.
0E–1
3.7E
+01.
2E–3
5.3E
+019
119
0, 4
67, 4
73, 4
78, 4
79, 4
80, 4
82,
484,
485
Tr
ees:
bro
ad-le
af4.
4E–1
7.1E
–12.
3E–1
3.1E
+01.
2E–3
3.1E
+011
419
0, 4
67, 4
73, 4
78, 4
80, 4
82, 4
84,
485
Tree
s: c
onife
rous
5.6E
–11.
4E+0
2.0E
–14.
1E+0
1.5E
–35.
3E+0
7746
7, 4
79, 4
80, 4
82, 4
84
Ta (t
anta
lum
)G
rass
esc
5.3E
–39.
5E–3
2.6E
–33.
3E+0
346
7Li
chen
s and
bry
ophy
tes
1.2E
–27.
2E–3
1.1E
–21.
7E+0
5.0E
–32.
0E–2
346
7Sh
rubs
2.2E
–31
467
Tb
(ter
bium
)H
erbs
1.5E
–31
467
Shru
bs2.
6E–2
1.9E
–23.
4E–2
246
7

52
TAB
LE 5
. C
ON
CEN
TRAT
ION
R
ATIO
(C
Rw
o-so
il)
VALU
ES
FOR
W
ILD
LIFE
G
RO
UPS
IN
TE
RR
ESTR
IAL
ECO
SYST
EMS
(con
t.)
Wild
life
grou
p(te
rres
trial
)
CR
wo-
soil
(Bq/
kg, f
resh
wei
ght w
hole
org
anis
m:B
q/kg
, dry
wei
ght s
oil)
ID n
umbe
ra
AM
AM
SDG
MG
MSD
Min
imum
Max
imum
N
Tc (t
echn
etiu
m)
Am
phib
ians
3.9E
–12.
0E–1
3.5E
–11.
6E+0
3.2E
–15.
1E–1
548
6B
irds:
om
nivo
rous
1.7E
–12
486
Gra
sses
and
her
bs1.
4E+1
1.3E
+11.
0E+1
2.3E
+06.
2E–3
2.0E
+128
250,
486
, 493
, 512
G
rass
es1.
6E+1
1.3E
+11.
3E+1
2.0E
+08.
3E–2
2.0E
+124
250,
486
, 493
Sh
rubs
1.2E
–21.
1E–2
8.4E
–32.
2E+0
6.3E
–43.
3E–2
851
2T
h (t
hori
um)
Bird
s: h
erbi
voro
us3.
9E–4
9.4E
–53.
8E–4
1.3E
+03.
1E–4
5.4E
–420
260
Gra
sses
and
her
bs2.
4E–1
5.1E
–19.
9E–2
3.7E
+02.
2E–4
2.7E
+034
121
5, 2
72, 2
74, 2
78, 2
81, 2
95, 2
96,
334,
390
, 430
, 455
, 459
, 467
, 498
G
rass
es3.
6E–1
6.4E
–11.
7E–1
3.3E
+01.
6E–3
2.7E
+019
327
2, 2
74, 2
78, 2
81, 2
95, 3
34, 4
30,
459,
467
, 498
H
erbs
5.1E
–29.
6E–2
2.4E
–23.
4E+0
2.2E
–45.
1E–1
4927
2, 4
30, 4
59, 4
67
Lich
ens a
nd b
ryop
hyte
s9.
7E–1
2.1E
+04.
1E–1
3.7E
+01.
2E–2
1.5E
+122
821
7, 2
72, 3
34, 3
42, 3
45, 3
48, 3
49,
355,
459
, 467
M
amm
als
1.4E
–41.
3E–4
1.0E
–42.
2E+0
1.3E
–56.
4E–4
3618
1, 1
82, 1
85, 1
86, 1
87, 2
24, 2
25,
226,
227
, 450
M
amm
als:
her
bivo
rous
1.4E
–41.
3E–4
1.0E
–42.
2E+0
1.3E
–56.
4E–4
3518
1, 1
82, 1
85, 1
86, 1
87, 2
24, 2
25,
226,
227
R
eptil
es2.
0E–1
4.8E
–17.
6E–2
4.0E
+09.
4E–5
2.7E
–118
450,
487

53
TAB
LE 5
. C
ON
CEN
TRAT
ION
R
ATIO
(C
Rw
o-so
il)
VALU
ES
FOR
W
ILD
LIFE
G
RO
UPS
IN
TE
RR
ESTR
IAL
ECO
SYST
EMS
(con
t.)
Wild
life
grou
p(te
rres
trial
)
CR
wo-
soil
(Bq/
kg, f
resh
wei
ght w
hole
org
anis
m:B
q/kg
, dry
wei
ght s
oil)
ID n
umbe
ra
AM
AM
SDG
MG
MSD
Min
imum
Max
imum
N
Shru
bs2.
5E–1
5.6E
–19.
9E–2
3.9E
+01.
2E–3
3.9E
+040
327
2, 3
42, 3
45, 3
47, 3
48, 4
67, 4
69
Tree
s1.
1E–3
1.1E
–37.
6E–4
2.3E
+01.
0E–5
3.1E
–385
200,
249
, 467
Ti
(tita
nium
)
Lich
ens a
nd b
ryop
hyte
s3.
3E–2
3.0E
–22.
4E–2
2.2E
+05.
9E–3
1.7E
–132
348,
355
Sh
rubs
6.4E
–35.
0E–3
5.0E
–32.
0E+0
6.7E
–43.
6E–2
120
347,
348
U
(ura
nium
)A
nnel
ids
8.8E
–31
264
Arth
ropo
ds1.
8E–2
5.0E
–31.
7E–2
1.3E
+01.
0E–2
2.0E
–24
382
Bird
s: h
erbi
voro
us5.
0E–4
1.1E
–44.
9E–4
1.3E
+04.
1E–4
6.8E
–420
260
Gra
sses
and
her
bs1.
4E–1
4.4E
–14.
5E–2
4.6E
+07.
7E–5
5.5E
+043
921
5, 2
20, 2
66, 2
69, 2
72, 2
74, 2
78,
279,
292
, 295
, 296
, 298
, 334
, 390
, 42
6, 4
30, 4
55, 4
57, 4
59, 4
89, 4
98
Gra
sses
1.3E
–14.
0E–1
3.7E
–24.
8E+0
7.7E
–55.
5E+0
280
220,
266
, 269
, 272
, 274
, 278
, 279
, 29
2, 2
95, 2
98, 3
34, 4
30, 4
57, 4
59,
489,
498
H
erbs
2.1E
–15.
5E–1
7.6E
–24.
2E+0
2.2E
–32.
8E+0
6426
6, 2
72, 4
30, 4
59
Lich
ens a
nd b
ryop
hyte
s2.
5E+0
4.4E
+01.
3E+0
3.2E
+02.
0E–2
2.9E
+123
727
2, 3
34, 3
42, 3
45, 3
48, 3
49, 3
55,
373,
382
, 459
M
amm
als
5.8E
–36.
8E–3
3.7E
–32.
5E+0
1.5E
–52.
1E–2
2261
, 196
, 423
, 429
, 450
, 458
, 509

54
TAB
LE 5
. C
ON
CEN
TRAT
ION
R
ATIO
(C
Rw
o-so
il)
VALU
ES
FOR
W
ILD
LIFE
G
RO
UPS
IN
TE
RR
ESTR
IAL
ECO
SYST
EMS
(con
t.)
Wild
life
grou
p(te
rres
trial
)
CR
wo-
soil
(Bq/
kg, f
resh
wei
ght w
hole
org
anis
m:B
q/kg
, dry
wei
ght s
oil)
ID n
umbe
ra
AM
AM
SDG
MG
MSD
Min
imum
Max
imum
N
Mam
mal
s: m
arsu
pial
6.2E
–37.
9E–3
3.9E
–32.
6E+0
8.0E
–42.
1E–2
1261
, 423
, 458
, 509
R
eptil
es1.
5E+0
3.1E
+06.
7E–1
3.6E
+01.
3E–4
2.5E
+021
450,
487
Sh
rubs
f2.
3E–1
6.4E
–18.
1E–2
4.3E
+01.
4E–5
5.9E
+097
022
0, 2
49, 3
42, 3
45, 3
47, 3
48, 4
69
Tree
s6.
8E–3
1.4E
–22.
9E–3
3.7E
+01.
4E–5
3.2E
–252
120
0, 2
20, 2
49
V (v
anad
ium
)
Lich
ens a
nd b
ryop
hyte
s2.
0E–1
2.9E
–11.
1E–1
2.9E
+02.
2E–2
1.2E
+032
348,
355
Sh
rubs
4.7E
–26.
9E–2
2.6E
–22.
9E+0
7.5E
–33.
4E–1
6434
7, 3
48
W (t
ungs
ten)
Tree
s: c
onife
rous
c4.
7E–1
146
7Y
b (y
tter
bium
)G
rass
es a
nd h
erbs
5.7E
–38.
5E–3
3.1E
–33.
0E+0
2.6E
–47.
5E–3
446
7Li
chen
s and
bry
ophy
tes
9.8E
–31.
2E–2
6.3E
–32.
6E+0
3.3E
–33.
1E–2
546
7Sh
rubs
8.4E
–33.
4E–3
7.8E
–31.
5E+0
6.0E
–31.
0E–2
546
7Tr
ees:
con
ifero
usc
3.2E
–32
467
Zn
(zin
c)A
nnel
ids
4.0E
+01.
6E+0
3.7E
+01.
5E+0
1.9E
+07.
0E+0
383
344
Arth
ropo
ds1.
1E+0
6.1E
–19.
7E–1
1.7E
+03.
0E–1
3.6E
+025
734
4G
rass
es a
nd h
erbs
1.8E
+02.
8E+0
9.6E
–13.
1E+0
1.8E
–28.
7E+0
1233
4, 4
67

55
TAB
LE 5
. C
ON
CEN
TRAT
ION
R
ATIO
(C
Rw
o-so
il)
VALU
ES
FOR
W
ILD
LIFE
G
RO
UPS
IN
TE
RR
ESTR
IAL
ECO
SYST
EMS
(con
t.)
Wild
life
grou
p(te
rres
trial
)
CR
wo-
soil
(Bq/
kg, f
resh
wei
ght w
hole
org
anis
m:B
q/kg
, dry
wei
ght s
oil)
ID n
umbe
ra
AM
AM
SDG
MG
MSD
Min
imum
Max
imum
N
Lich
ens a
nd b
ryop
hyte
s1.
8E+0
1.7E
+01.
3E+0
2.2E
+02.
9E–2
7.6E
+010
033
4, 3
42, 3
45, 3
48, 3
55, 4
67
Rep
tiles
: car
nivo
rous
c2.
0E–1
3.9E
–19.
2E–2
3.5E
+01.
6E–1
2.4E
–130
487
Shru
bs4.
5E+0
3.5E
+03.
5E+0
2.0E
+04.
0E–2
1.6E
+125
034
2, 3
45, 3
47, 3
48, 4
67
Tree
s3.
1E–2
2.0E
–22.
6E–2
1.8E
+08.
4E–3
4.7E
–24
467
Zr
(zir
coni
um)
Shru
bs9.
4E–5
8.1E
–57.
2E–5
2.1E
+064
252
Not
e: A
M:
arith
met
ic m
ean;
AM
SD:
arith
met
ic m
ean
stan
dard
dev
iatio
n; D
W:
dry
wei
ght;
FW:
fres
h w
eigh
t; G
M:
geom
etric
mea
n;
GM
SD: g
eom
etric
mea
n st
anda
rd d
evia
tion;
ID: i
dent
ifica
tion;
N: n
umbe
r of d
ata.
a Th
e pu
blic
atio
ns c
orre
spon
ding
to th
ese
ID n
umbe
rs a
re g
iven
in th
e Ann
ex.
b N
ot in
clud
ed in
the
mam
mal
s wild
life
grou
p va
lue.
c A
ll of
the
data
for t
he w
ildlif
e gr
oup
are
for t
he su
bcat
egor
y pr
esen
ted.
d In
clud
ing
outly
ing
valu
es; C
Rw
o-so
il val
ue fo
r Se
gras
ses a
nd h
erbs
(see
Sec
tion
3.4)
is A
M ±
SD
= 8
3 ±
170,
GM
± G
SD =
37
± 3.
6, n
= 9
38.
e In
clud
ing
outly
ing
valu
es; C
Rw
o-so
il va
lue
for S
e he
rbs (
see
Sect
ion
3.4)
AM
± S
D =
110
± 1
90, G
M ±
GSD
= 5
9 ±
3.1,
n =
606
.f
Incl
udin
g ou
tlyin
g va
lues
; CR
wo-
soil v
alue
for U
shru
bs (s
ee S
ectio
n 3.
4) A
M ±
SD
= 0
.4 ±
1.6
, GM
± G
SD =
0.0
95 ±
5.4
, n =
983
.

56
TAB
LE 6
. C
ON
CEN
TRAT
ION
R
ATIO
(C
Rw
o-w
ater
) VA
LUES
FO
R
WIL
DLI
FE
GR
OU
PS
IN
FRES
HW
ATER
EC
OSY
STEM
S (c
ont.)
Wild
life
grou
p(f
resh
wat
er)
CR
wo-
wat
er(B
q/kg
, fre
sh w
eigh
t who
le o
rgan
ism
:Bq/
L w
ater
)ID
num
bera
AM
AM
SDG
MG
MSD
Min
imum
Max
imum
N
Al (
alum
iniu
m)
Fish
7.9E
+11.
3E+2
4.1E
+13.
2E+0
1.0E
+01.
5E+3
250
333,
336
, 340
, 343
, 346
, 350
, 355
, 35
6, 3
57, 3
58, 3
59, 3
63, 3
64, 3
74,
376,
378
, 517
Fi
sh: b
enth
ic fe
edin
g8.
8E+1
1.1E
+25.
5E+1
2.6E
+02.
5E+0
6.5E
+285
333,
336
, 343
, 346
, 355
, 356
, 357
, 35
8, 3
76, 3
78
Fish
: pis
civo
rous
7.5E
+11.
4E+2
3.4E
+13.
5E+0
1.9E
+01.
5E+3
157
333,
336
, 340
, 343
, 350
, 355
, 356
, 35
8, 3
59, 3
63, 3
64, 3
76, 3
78, 5
17
Vasc
ular
pla
nts
1.6E
+21.
5E+2
1.2E
+22.
2E+0
6.6E
+15.
7E+2
1834
3, 5
17
Am
(am
eric
ium
)A
lgae
5.3E
+28
309
Fish
: for
ageb
7.6E
+26.
7E+2
5.7E
+22.
1E+0
2.4E
+01.
5E+3
1730
9, 4
11
Inse
cts
1.3E
+27
309
Inse
ct la
rvae
1.8E
+315
309
Mol
lusc
s1.
0E+4
1.3E
+46.
6E+3
2.6E
+01.
2E+2
3.6E
+460
309,
411
M
ollu
scs:
gas
tropo
d6.
3E+3
9.4E
+33.
5E+3
3.0E
+01.
2E+2
2.8E
+450
309,
411
R
eptil
es3.
2E+3
148
7Va
scul
ar p
lant
s1.
3E+3
2.6E
+36.
2E+2
3.5E
+06.
7E+0
7.5E
+366
309,
410
, 411

57
TAB
LE 6
. C
ON
CEN
TRAT
ION
R
ATIO
(C
Rw
o-w
ater
) VA
LUES
FO
R
WIL
DLI
FE
GR
OU
PS
IN
FRES
HW
ATER
EC
OSY
STEM
S (c
ont.)
Wild
life
grou
p(f
resh
wat
er)
CR
wo-
wat
er(B
q/kg
, fre
sh w
eigh
t who
le o
rgan
ism
:Bq/
L w
ater
)ID
num
bera
AM
AM
SDG
MG
MSD
Min
imum
Max
imum
N
As (
arse
nic)
Fish
3.6E
+24.
2E+2
2.3E
+22.
5E+0
1.4E
+12.
0E+3
148
339,
340
, 355
, 356
, 357
, 358
, 359
, 36
1, 3
63, 3
64, 3
76, 3
77, 3
78
Fish
: ben
thic
feed
ing
3.9E
+24.
4E+2
2.5E
+22.
5E+0
1.4E
+12.
0E+3
7533
9, 3
55, 3
56, 3
57, 3
58, 3
61, 3
63,
364,
376
, 377
, 378
Fi
sh: p
isci
voro
us3.
2E+2
3.9E
+22.
0E+2
2.6E
+04.
4E+1
1.5E
+372
339,
340
, 355
, 358
, 359
, 361
, 363
, 37
6, 3
77, 3
78
Rep
tiles
2.6E
+29.
5E+1
2.5E
+21.
4E+0
7.2E
+13.
3E+2
948
7Va
scul
ar p
lant
s8.
8E+1
5.2E
+11.
2E+2
233
3B
(bor
on)
Rep
tiles
1.1E
+11.
1E+0
2.0E
+12
487
Ba
(bar
ium
)Fi
sh8.
1E+1
1.3E
+24.
3E+1
3.1E
+03.
0E–1
8.8E
+249
730
4, 3
33, 3
36, 3
39, 3
40, 3
43, 3
50,
355,
356
, 357
, 358
, 359
, 361
, 363
, 37
1, 3
76, 3
78, 5
17
Fish
: ben
thic
feed
ing
9.5E
+11.
3E+2
5.7E
+12.
8E+0
1.4E
+06.
6E+2
148
333,
336
, 339
, 343
, 355
, 356
, 357
, 35
8, 3
61, 3
63, 3
71, 3
76, 3
78
Fish
: pis
civo
rous
7.6E
+11.
3E+2
3.9E
+13.
2E+0
3.0E
–18.
8E+2
340
333,
336
, 340
, 350
, 355
, 356
, 358
, 35
9, 3
63, 3
76, 3
78, 5
17

58
TAB
LE 6
. C
ON
CEN
TRAT
ION
R
ATIO
(C
Rw
o-w
ater
) VA
LUES
FO
R
WIL
DLI
FE
GR
OU
PS
IN
FRES
HW
ATER
EC
OSY
STEM
S (c
ont.)
Wild
life
grou
p(f
resh
wat
er)
CR
wo-
wat
er(B
q/kg
, fre
sh w
eigh
t who
le o
rgan
ism
:Bq/
L w
ater
)ID
num
bera
AM
AM
SDG
MG
MSD
Min
imum
Max
imum
N
Rep
tiles
1.4E
+21
487
Vasc
ular
pla
nts
1.4E
+31.
2E+3
1.1E
+32.
1E+0
3.2E
+24.
4E+3
1834
3, 5
17
Ca
(cal
cium
)A
lgae
5.5E
+24.
6E+2
4.2E
+22.
1E+0
1.0E
+21.
5E+3
1433
3A
mph
ibia
ns1.
2E+3
1.2E
+38.
7E+2
2.3E
+02.
8E+2
3.7E
+39
333
Cru
stac
eans
6.6E
+21.
8E+2
6.4E
+21.
3E+0
4.3E
+28.
1E+2
433
3Fi
sh1.
4E+3
1.8E
+38.
6E+2
2.7E
+01.
6E+1
1.6E
+448
131
4, 3
22, 3
33, 3
39, 3
43, 3
50, 3
61,
363,
371
, 517
Fi
sh: b
enth
ic fe
edin
g7.
7E+2
1.3E
+34.
0E+2
3.2E
+01.
6E+1
6.0E
+312
733
3, 3
39, 3
43, 3
61, 3
63, 3
71
Fish
: for
age
2.9E
+34.
5E+3
1.6E
+33.
0E+0
5.2E
+11.
6E+4
3533
3, 5
17
Fish
: pis
civo
rous
1.5E
+31.
3E+3
1.1E
+32.
1E+0
8.3E
+17.
2E+3
318
322,
333
, 339
, 343
, 350
, 361
, 363
, 37
1, 5
17
Inse
cts
7.4E
+04.
5E+0
1.0E
+12
333
Inse
ct la
rvae
4.3E
+14.
5E+1
3.0E
+12.
4E+0
1.1E
+11.
1E+2
433
3M
amm
als:
her
bivo
rous
b3.
9E+2
3.5E
+24.
3E+2
233
3M
ollu
scs:
biv
alve
b1.
1E+3
1.9E
+21.
1E+3
1.2E
+03
517
Phyt
opla
nkto
n2.
4E+2
3.5E
+21.
4E+2
2.9E
+02.
6E+1
8.2E
+220
416
Rep
tiles
5.0E
+21.
2E+1
9.9E
+22
487
Vasc
ular
pla
nts
2.0E
+21.
3E+2
1.7E
+21.
8E+0
2.0E
+14.
4E+2
2033
3, 3
43, 5
17

59
TAB
LE 6
. C
ON
CEN
TRAT
ION
R
ATIO
(C
Rw
o-w
ater
) VA
LUES
FO
R
WIL
DLI
FE
GR
OU
PS
IN
FRES
HW
ATER
EC
OSY
STEM
S (c
ont.)
Wild
life
grou
p(f
resh
wat
er)
CR
wo-
wat
er(B
q/kg
, fre
sh w
eigh
t who
le o
rgan
ism
:Bq/
L w
ater
)ID
num
bera
AM
AM
SDG
MG
MSD
Min
imum
Max
imum
N
Cd
(cad
miu
m)
Fish
2.3E
+21.
8E+2
1.9E
+22.
0E+0
5.7E
+01.
0E+3
7535
8, 3
91, 3
92, 4
27, 4
31, 4
41
Fish
: ben
thic
feed
ing
3.4E
+27.
9E+1
3.3E
+21.
3E+0
4.8E
+13.
6E+2
3939
1, 4
41
Fish
: for
age
1.3E
+22.
0E+2
7.5E
+12.
9E+0
5.7E
+01.
0E+3
3035
8, 3
91, 3
92, 4
27, 4
31
Mol
lusc
s: b
ival
veb
2.8E
+52.
4E+5
2.1E
+52.
1E+0
351
7Ph
ytop
lank
ton
1.8E
+31.
2E+3
1.5E
+31.
8E+0
5.2E
+23.
4E+3
3041
6R
eptil
es1.
7E+3
1.4E
+31.
3E+3
2.0E
+05.
9E+0
2.4E
+37
487
Vasc
ular
pla
nts
6.3E
+25.
8E+2
4.6E
+22.
2E+0
351
7C
e (c
eriu
m)
Alg
ae1.
9E+3
1.0E
+31.
7E+3
1.7E
+09.
0E+2
4.4E
+310
320,
424
Fi
sh1.
6E+2
3.6E
+26.
5E+1
3.8E
+01.
8E+0
2.3E
+327
630
4, 3
14, 3
33
Fish
: ben
thic
feed
ing
5.1E
+27.
3E+2
2.9E
+22.
9E+0
3.4E
+02.
3E+3
4433
3Fi
sh: p
isci
voro
us9.
4E+1
1.7E
+24.
5E+1
3.4E
+01.
8E+0
1.3E
+322
533
3M
ollu
scs:
biv
alve
b1.
0E+3
1.2E
+36.
6E+2
2.6E
+02.
5E+2
2.3E
+38
456,
517
Ph
ytop
lank
ton
8.8E
+37.
8E+3
6.6E
+32.
1E+0
1.0E
+32.
6E+4
3541
6, 4
19
Rep
tiles
6.3E
+26.
0E+2
6.5E
+22
487
Vasc
ular
pla
nts
1.2E
+21.
0E+2
9.0E
+12.
1E+0
6.7E
+11.
7E+2
651
7

60
TAB
LE 6
. C
ON
CEN
TRAT
ION
R
ATIO
(C
Rw
o-w
ater
) VA
LUES
FO
R
WIL
DLI
FE
GR
OU
PS
IN
FRES
HW
ATER
EC
OSY
STEM
S (c
ont.)
Wild
life
grou
p(f
resh
wat
er)
CR
wo-
wat
er(B
q/kg
, fre
sh w
eigh
t who
le o
rgan
ism
:Bq/
L w
ater
)ID
num
bera
AM
AM
SDG
MG
MSD
Min
imum
Max
imum
N
Cl (
chlo
rine
)Fi
sh1.
3E+2
130
4Va
scul
ar p
lant
s2.
6E+2
2.0E
+22.
1E+2
2.0E
+01.
1E+2
4.1E
+26
517
Cm
(cur
ium
)A
lgae
6.7E
+18
309
Fish
: for
ageb,
c2.
4E–1
730
9In
sect
s1.
7E+1
730
9In
sect
larv
ae2.
5E+2
1530
9M
ollu
scs:
gas
tropo
db1.
7E+1
3030
9R
eptil
es7.
7E+1
148
7Va
scul
ar p
lant
s2.
3E+0
8.0E
+06.
3E–1
5.0E
+03.
3E–1
4.2E
+126
309
Co
(cob
alt)
Alg
ae4.
0E+2
4.6E
+22.
6E+2
2.5E
+02.
4E+1
1.0E
+315
396,
445
Fi
sh1.
4E+2
1.8E
+28.
2E+1
2.7E
+02.
4E–1
1.6E
+338
130
0, 3
01, 3
14, 3
24, 3
31, 3
33, 3
59,
394,
431
, 445
, 449
, 461
, 462
, 517
Fi
sh: b
enth
ic fe
edin
g7.
7E+1
5.8E
+16.
2E+1
2.0E
+07.
4E–1
3.5E
+210
032
4, 3
33, 3
94, 4
45, 4
61, 4
62
Fish
: for
age
4.3E
+18.
9E+1
1.9E
+13.
6E+0
2.4E
–14.
1E+2
8730
0, 3
24, 3
31, 3
33, 3
94, 4
31, 4
49,
461,
517
Fi
sh: p
isci
voro
us2.
0E+2
1.9E
+21.
5E+2
2.2E
+02.
6E+0
7.5E
+219
232
4, 3
33, 3
59, 3
94, 5
17

61
TAB
LE 6
. C
ON
CEN
TRAT
ION
R
ATIO
(C
Rw
o-w
ater
) VA
LUES
FO
R
WIL
DLI
FE
GR
OU
PS
IN
FRES
HW
ATER
EC
OSY
STEM
S (c
ont.)
Wild
life
grou
p(f
resh
wat
er)
CR
wo-
wat
er(B
q/kg
, fre
sh w
eigh
t who
le o
rgan
ism
:Bq/
L w
ater
)ID
num
bera
AM
AM
SDG
MG
MSD
Min
imum
Max
imum
N
Mol
lusc
s: b
ival
veb
1.1E
+37.
6E+2
9.6E
+21.
8E+0
351
7Ph
ytop
lank
ton
6.5E
+21.
2E+3
3.1E
+23.
4E+0
4.4E
+13.
5E+3
3541
6, 4
19
Rep
tiles
1.2E
+12.
2E+1
5.9E
+03.
3E+0
4.7E
+01.
1E+2
2848
7Va
scul
ar p
lant
s5.
9E+2
8.4E
+23.
4E+2
2.9E
+02.
2E+1
4.0E
+315
839
6, 4
45, 4
49, 4
61, 4
62, 4
63, 5
17
Cr
(chr
omiu
m)
Alg
ae2.
9E+2
2.5E
+22.
2E+2
2.1E
+04.
9E+1
5.3E
+210
396
Am
phib
ians
6.5E
+14.
9E+1
8.2E
+12
333
Fish
1.6E
+21.
5E+2
1.1E
+22.
3E+0
2.2E
–19.
0E+2
377
304,
333
, 343
, 350
, 358
, 391
, 427
, 44
1, 4
49
Fish
: ben
thic
feed
ing
1.8E
+21.
2E+2
1.5E
+21.
9E+0
1.6E
+03.
2E+2
105
333,
343
, 391
, 441
Fi
sh: f
orag
e2.
0E+1
6.9E
+15.
6E+0
4.9E
+02.
2E–1
2.9E
+266
333,
391
, 427
, 449
Fi
sh: p
isci
voro
us1.
9E+2
1.6E
+21.
4E+2
2.1E
+01.
7E+0
9.0E
+220
533
3, 3
43, 3
50, 3
58, 3
91
Rep
tiles
1.3E
+31.
2E+3
9.7E
+22.
2E+0
6.0E
+02.
2E+3
948
7Va
scul
ar p
lant
s3.
6E+2
4.1E
+22.
4E+2
2.5E
+01.
4E+1
1.1E
+344
333,
343
, 396
, 449
, 517
C
s (ca
esiu
m)
Alg
ae1.
3E+3
2.6E
+36.
0E+2
3.5E
+04.
4E+0
1.1E
+499
320,
402
, 417
, 419
, 461
, 464
C
rust
acea
ns1.
8E+3
1.2E
+31.
5E+3
1.8E
+01.
1E+2
4.9E
+320
454,
490

62
TAB
LE 6
. C
ON
CEN
TRAT
ION
R
ATIO
(C
Rw
o-w
ater
) VA
LUES
FO
R
WIL
DLI
FE
GR
OU
PS
IN
FRES
HW
ATER
EC
OSY
STEM
S (c
ont.)
Wild
life
grou
p(f
resh
wat
er)
CR
wo-
wat
er(B
q/kg
, fre
sh w
eigh
t who
le o
rgan
ism
:Bq/
L w
ater
)ID
num
bera
AM
AM
SDG
MG
MSD
Min
imum
Max
imum
N
Fish
3.1E
+35.
1E+3
1.6E
+33.
1E+0
1.3E
+18.
2E+4
722
146,
153
, 178
, 300
, 301
, 302
, 313
, 31
4, 3
15, 3
19, 3
23, 3
26, 3
27, 3
31,
332,
333
, 393
, 394
, 402
, 408
, 411
, 41
5, 4
16, 4
18, 4
19, 4
45, 4
46, 4
54,
461,
462
, 465
Fi
sh: b
enth
ic fe
edin
g1.
0E+3
2.0E
+34.
6E+2
3.5E
+01.
8E+1
2.0E
+415
614
6, 1
78, 3
02, 3
32, 3
33, 3
93, 3
94,
402,
411
, 416
, 418
, 419
, 445
, 446
, 46
1, 4
62, 4
65
Fish
: for
age
9.2E
+21.
6E+3
4.7E
+23.
2E+0
1.7E
+18.
6E+3
125
153,
300
, 302
, 313
, 323
, 331
, 332
, 33
3, 3
94, 4
02, 4
08, 4
11, 4
15, 4
18,
446,
454
, 461
, 465
Fi
sh: p
isci
voro
us4.
5E+3
6.0E
+32.
7E+3
2.8E
+01.
3E+1
8.2E
+443
914
6, 1
78, 3
02, 3
13, 3
15, 3
19, 3
26,
327,
332
, 333
, 393
, 394
, 402
, 411
, 41
5, 4
16, 4
18, 4
19, 4
46, 4
65
Inse
cts
2.2E
+31
490
Inse
ct la
rvae
2.0E
+32.
1E+3
1.4E
+32.
4E+0
1.3E
+25.
9E+3
649
0M
ollu
scs
1.3E
+21.
0E+2
1.0E
+22.
0E+0
3.3E
+13.
8E+2
7040
2, 4
08, 4
11
Mol
lusc
s: b
ival
ve1.
1E+2
6.3E
+19.
8E+1
1.7E
+04.
7E+1
2.0E
+220
402,
411
M
ollu
scs:
gas
tropo
d1.
4E+2
1.2E
+21.
0E+2
2.1E
+03.
3E+1
3.8E
+250
408,
411
Ph
ytop
lank
ton
1.4E
+21.
9E+2
8.5E
+12.
7E+0
1.9E
+16.
6E+2
5041
6, 4
19, 4
54
Rep
tiles
4.0E
+37.
0E+3
2.0E
+33.
3E+0
7.1E
+11.
0E+4
9348
7

63
TAB
LE 6
. C
ON
CEN
TRAT
ION
R
ATIO
(C
Rw
o-w
ater
) VA
LUES
FO
R
WIL
DLI
FE
GR
OU
PS
IN
FRES
HW
ATER
EC
OSY
STEM
S (c
ont.)
Wild
life
grou
p(f
resh
wat
er)
CR
wo-
wat
er(B
q/kg
, fre
sh w
eigh
t who
le o
rgan
ism
:Bq/
L w
ater
)ID
num
bera
AM
AM
SDG
MG
MSD
Min
imum
Max
imum
N
Vasc
ular
pla
nts
3.1E
+21.
3E+3
7.0E
+15.
6E+0
1.7E
+12.
4E+4
627
153,
178
, 331
, 393
, 402
, 408
, 410
, 41
1, 4
19, 4
20, 4
21, 4
22, 4
25, 4
45,
454,
461
, 462
, 464
Zo
opla
nkto
n9.
0E+1
6.4E
+17.
3E+1
1.9E
+09.
0E+0
3.3E
+241
393,
490
C
u (c
oppe
r)Fi
sh3.
9E+2
3.6E
+22.
8E+2
2.2E
+02.
2E–1
2.8E
+358
330
4, 3
33, 3
39, 3
40, 3
43, 3
46, 3
55,
356,
357
, 358
, 359
, 361
, 363
, 391
, 42
7, 4
31, 4
41, 4
49, 4
60, 5
17
Fish
: ben
thic
feed
ing
5.0E
+24.
0E+2
3.9E
+22.
0E+0
3.2E
+02.
8E+3
169
333,
339
, 343
, 346
, 355
, 356
, 357
, 35
8, 3
61, 3
91, 4
41
Fish
: for
age
7.3E
+12.
4E+2
2.1E
+14.
8E+0
2.2E
–11.
3E+3
7833
3, 3
91, 4
27, 4
31, 4
49, 5
17
Fish
: pis
civo
rous
4.0E
+23.
3E+2
3.1E
+22.
0E+0
4.2E
+01.
6E+3
335
333,
339
, 340
, 343
, 346
, 355
, 356
, 35
8, 3
59, 3
61, 3
63, 3
91, 4
60, 5
17
Rep
tiles
1.5E
+31.
3E+3
1.1E
+32.
1E+0
2.4E
+23.
3E+3
948
7Va
scul
ar p
lant
s2.
6E+2
3.1E
+21.
7E+2
2.6E
+07.
7E+1
8.5E
+220
333,
343
, 449
, 517
D
y (d
yspr
osiu
m)
Mol
lusc
s: b
ival
veb
7.7E
+23.
6E+2
7.0E
+21.
6E+0
351
7Va
scul
ar p
lant
s5.
6E+1
3.6E
+14.
7E+1
1.8E
+04.
2E+1
6.9E
+16
517

64
TAB
LE 6
. C
ON
CEN
TRAT
ION
R
ATIO
(C
Rw
o-w
ater
) VA
LUES
FO
R
WIL
DLI
FE
GR
OU
PS
IN
FRES
HW
ATER
EC
OSY
STEM
S (c
ont.)
Wild
life
grou
p(f
resh
wat
er)
CR
wo-
wat
er(B
q/kg
, fre
sh w
eigh
t who
le o
rgan
ism
:Bq/
L w
ater
)ID
num
bera
AM
AM
SDG
MG
MSD
Min
imum
Max
imum
N
Er
(erb
ium
)M
ollu
scs:
biv
alve
b5.
1E+2
2.5E
+24.
6E+2
1.6E
+03
517
Vasc
ular
pla
nts
4.9E
+13.
5E+1
4.0E
+11.
9E+0
3.6E
+16.
3E+1
651
7E
u (e
urop
ium
)Fi
sh6.
3E+1
4.2E
+15.
3E+1
1.8E
+07.
6E+0
2.3E
+254
304,
333
Fi
sh: p
isci
voro
us6.
8E+1
3.4E
+16.
1E+1
1.6E
+07.
6E+0
1.6E
+243
333
Mol
lusc
s: b
ival
veb
1.5E
+37.
0E+2
1.4E
+31.
6E+0
351
7Va
scul
ar p
lant
s7.
8E+1
5.0E
+16.
5E+1
1.8E
+04.
8E+1
1.1E
+26
517
Fe (i
ron)
Alg
ae1.
1E+2
9.0E
+18.
7E+1
2.0E
+02.
6E+1
2.0E
+210
396
Fish
5.2E
+21.
1E+3
2.3E
+23.
6E+0
6.4E
–17.
0E+3
764
314,
333
, 336
, 339
, 340
, 343
, 350
, 35
5, 3
56, 3
57, 3
58, 3
59, 3
61, 3
63,
364,
371
, 376
, 378
, 431
, 441
, 449
Fi
sh: b
enth
ic fe
edin
g4.
9E+2
1.0E
+32.
2E+2
3.6E
+08.
7E–1
5.3E
+324
133
3, 3
36, 3
39, 3
43, 3
55, 3
56, 3
57,
358,
361
, 363
, 371
, 376
, 378
, 441
Fi
sh: f
orag
e5.
5E+2
1.3E
+32.
1E+2
4.0E
+08.
2E–1
5.7E
+368
333,
431
, 449
Fi
sh: p
isci
voro
us5.
2E+2
1.0E
+32.
4E+2
3.5E
+06.
4E–1
7.0E
+345
433
3, 3
36, 3
39, 3
40, 3
43, 3
50, 3
55,
356,
358
, 359
, 361
, 363
, 364
, 371
, 37
6, 3
78, 4
31

65
TAB
LE 6
. C
ON
CEN
TRAT
ION
R
ATIO
(C
Rw
o-w
ater
) VA
LUES
FO
R
WIL
DLI
FE
GR
OU
PS
IN
FRES
HW
ATER
EC
OSY
STEM
S (c
ont.)
Wild
life
grou
p(f
resh
wat
er)
CR
wo-
wat
er(B
q/kg
, fre
sh w
eigh
t who
le o
rgan
ism
:Bq/
L w
ater
)ID
num
bera
AM
AM
SDG
MG
MSD
Min
imum
Max
imum
N
Mol
lusc
s: b
ival
veb
1.8E
+34.
9E+2
1.8E
+31.
3E+0
351
7Ph
ytop
lank
ton
4.4E
+32.
7E+3
3.7E
+31.
8E+0
1.8E
+37.
0E+3
1041
9R
eptil
es1.
0E+3
1.3E
+36.
3E+2
2.6E
+01.
3E+2
2.8E
+34
487
Vasc
ular
pla
nts
3.4E
+23.
8E+2
2.2E
+22.
5E+0
2.0E
+11.
9E+3
3533
3, 3
43, 3
96, 4
49, 5
17
Gd
(gad
olin
ium
)M
ollu
scs:
biv
alve
b1.
0E+3
4.9E
+29.
4E+2
1.6E
+03
517
Vasc
ular
pla
nts
5.1E
+13.
3E+1
4.2E
+11.
8E+0
3.9E
+16.
3E+1
651
7H
f (ha
fniu
m)
Vasc
ular
pla
nts
1.2E
+12.
2E+1
5.4E
+03.
4E+0
1.1E
+11.
3E+1
651
7H
g (m
ercu
ry)
Fish
3.5E
+25.
6E+2
1.9E
+23.
1E+0
2.7E
+11.
0E+3
330
4, 4
27
Phyt
opla
nkto
n1.
1E+4
4.1E
+39.
9E+3
1.5E
+04.
7E+3
1.5E
+425
416
Rep
tiles
5.7E
+36.
5E+3
3.7E
+32.
5E+0
2.2E
+11.
3E+4
4648
7H
o (h
olm
ium
)M
ollu
scs:
biv
alve
b5.
3E+2
2.5E
+24.
8E+2
1.6E
+03
517
Vasc
ular
pla
nts
5.3E
+13.
5E+1
4.4E
+11.
8E+0
4.0E
+16.
6E+1
651
7

66
TAB
LE 6
. C
ON
CEN
TRAT
ION
R
ATIO
(C
Rw
o-w
ater
) VA
LUES
FO
R
WIL
DLI
FE
GR
OU
PS
IN
FRES
HW
ATER
EC
OSY
STEM
S (c
ont.)
Wild
life
grou
p(f
resh
wat
er)
CR
wo-
wat
er(B
q/kg
, fre
sh w
eigh
t who
le o
rgan
ism
:Bq/
L w
ater
)ID
num
bera
AM
AM
SDG
MG
MSD
Min
imum
Max
imum
N
I (io
dine
)A
lgae
1.2E
+22.
8E+1
1.1E
+21.
3E+0
1.0E
+21.
3E+2
940
1Fi
sh3.
7E+2
3.9E
+22.
6E+2
2.4E
+09.
0E+0
1.3E
+313
530
1, 3
14, 3
29, 3
33, 4
01, 5
17
Fish
: pis
civo
rous
4.0E
+23.
9E+2
2.9E
+22.
3E+0
1.0E
+11.
3E+3
122
301,
329
, 333
, 401
, 517
M
ollu
scs
8.3E
+12.
6E+1
7.9E
+11.
4E+0
8.0E
+11.
0E+2
740
1Va
scul
ar p
lant
s5.
0E+1
3.5E
+14.
0E+1
1.9E
+02.
2E+1
9.6E
+133
401,
517
L
a (la
ntha
num
)Fi
sh1.
2E+2
2.1E
+26.
0E+1
3.2E
+03.
3E–1
1.3E
+325
030
4, 3
33, 5
17
Fish
: ben
thic
feed
ing
3.0E
+24.
0E+2
1.8E
+22.
7E+0
3.8E
+01.
3E+3
4433
3Fi
sh: p
isci
voro
us8.
1E+1
1.0E
+25.
0E+1
2.7E
+07.
3E–1
4.4E
+219
733
3, 5
17
Mol
lusc
s: b
ival
veb
3.1E
+31.
4E+3
2.9E
+31.
5E+0
351
7R
eptil
es2.
4E+2
2.1E
+22.
6E+2
248
7Va
scul
ar p
lant
s9.
2E+1
6.0E
+17.
7E+1
1.8E
+06.
5E+1
1.2E
+26
517
Lu
(lute
tium
)M
ollu
scs:
biv
alve
b2.
5E+2
2.3E
+21.
8E+2
2.2E
+03
517
Vasc
ular
pla
nts
3.1E
+13.
3E+1
2.1E
+12.
4E+0
2.0E
+14.
1E+1
651
7

67
TAB
LE 6
. C
ON
CEN
TRAT
ION
R
ATIO
(C
Rw
o-w
ater
) VA
LUES
FO
R
WIL
DLI
FE
GR
OU
PS
IN
FRES
HW
ATER
EC
OSY
STEM
S (c
ont.)
Wild
life
grou
p(f
resh
wat
er)
CR
wo-
wat
er(B
q/kg
, fre
sh w
eigh
t who
le o
rgan
ism
:Bq/
L w
ater
)ID
num
bera
AM
AM
SDG
MG
MSD
Min
imum
Max
imum
N
Mg
(mag
nesi
um)
Am
phib
ians
1.4E
+16.
7E+0
2.1E
+12
333
Fish
1.4E
+22.
1E+2
7.9E
+12.
9E+0
4.1E
+09.
7E+2
153
333,
339
, 343
, 350
, 361
, 363
, 371
, 51
7 Fi
sh: b
enth
ic fe
edin
g9.
3E+1
1.5E
+24.
8E+1
3.2E
+04.
1E+0
5.9E
+265
333,
339
, 343
, 361
, 363
, 371
Fi
sh: p
isci
voro
us1.
9E+2
2.5E
+21.
1E+2
2.8E
+02.
9E+1
9.7E
+276
333,
339
, 343
, 350
, 361
, 363
, 371
, 51
7 M
ollu
scs:
biv
alve
b2.
5E+1
4.4E
+02.
5E+1
1.2E
+03
517
Rep
tiles
6.0E
+14.
9E+1
7.1E
+12
487
Vasc
ular
pla
nts
1.5E
+21.
0E+2
1.3E
+21.
8E+0
1.2E
+12.
9E+2
2033
3, 3
43, 5
17
Mn
(man
gane
se)
Alg
ae1.
5E+2
8.8E
+11.
3E+2
1.7E
+06.
5E+1
2.3E
+210
396
Fish
2.0E
+34.
4E+3
8.6E
+23.
7E+0
3.3E
+02.
6E+4
670
314,
333
, 336
, 339
, 340
, 343
, 350
, 35
5, 3
56, 3
57, 3
58, 3
59, 3
61, 3
63,
364,
376
, 378
, 517
Fi
sh: b
enth
ic fe
edin
g2.
6E+3
5.8E
+31.
0E+3
3.8E
+03.
3E+0
2.6E
+420
133
3, 3
36, 3
39, 3
43, 3
55, 3
56, 3
57,
358,
361
, 363
, 376
, 378
Fi
sh: p
isci
voro
us1.
7E+3
3.6E
+37.
2E+2
3.7E
+06.
3E+0
1.8E
+445
133
3, 3
36, 3
39, 3
40, 3
43, 3
50, 3
55,
356,
358
, 359
, 361
, 363
, 364
, 376
, 37
8, 5
17

68
TAB
LE 6
. C
ON
CEN
TRAT
ION
R
ATIO
(C
Rw
o-w
ater
) VA
LUES
FO
R
WIL
DLI
FE
GR
OU
PS
IN
FRES
HW
ATER
EC
OSY
STEM
S (c
ont.)
Wild
life
grou
p(f
resh
wat
er)
CR
wo-
wat
er(B
q/kg
, fre
sh w
eigh
t who
le o
rgan
ism
:Bq/
L w
ater
)ID
num
bera
AM
AM
SDG
MG
MSD
Min
imum
Max
imum
N
Mam
mal
s: o
mni
voro
usb
3.4E
+27.
2E+2
1.5E
+23.
7E+0
8.5E
+01.
8E+3
651
1M
ollu
scs:
biv
alve
b1.
2E+4
6.9E
+31.
0E+4
1.7E
+03
517
Rep
tiles
7.4E
+23.
0E+3
1.8E
+25.
4E+0
5.7E
+11.
5E+4
2448
7Va
scul
ar p
lant
s2.
3E+3
4.0E
+31.
1E+3
3.3E
+06.
0E+1
1.4E
+450
333,
343
, 396
, 449
, 517
M
o (m
olyb
denu
m)
Fish
1.5E
+12.
0E+1
8.9E
+02.
8E+0
1.8E
–11.
9E+2
289
333,
339
, 356
, 357
, 358
, 359
, 376
, 37
8, 5
17
Fish
: ben
thic
feed
ing
9.7E
+01.
5E+1
5.3E
+03.
0E+0
1.8E
–19.
8E+1
6433
3, 3
39, 3
56, 3
57, 3
58, 3
76, 3
78
Fish
: pis
civo
rous
1.7E
+12.
2E+1
1.0E
+12.
7E+0
3.8E
–11.
9E+2
217
333,
359
, 517
M
ollu
scs:
biv
alve
b2.
6E+2
5.1E
+12.
5E+2
1.2E
+03
517
Rep
tiles
8.7E
+22.
1E+1
1.7E
+32
487
Vasc
ular
pla
nts
3.9E
+24.
3E+2
2.7E
+22.
4E+0
7.8E
+17.
1E+2
651
7N
a (s
odiu
m)
Fish
1.9E
+22.
3E+2
1.2E
+22.
5E+0
2.0E
+09.
8E+2
380
304,
333
, 339
, 343
, 350
, 361
, 363
, 37
1, 5
17
Fish
: ben
thic
feed
ing
1.2E
+21.
1E+2
8.8E
+12.
2E+0
2.0E
+05.
4E+2
122
333,
339
, 343
, 361
, 363
, 371
Fi
sh: p
isci
voro
us2.
4E+2
2.7E
+21.
6E+2
2.5E
+02.
0E+1
9.8E
+224
033
3, 3
39, 3
43, 3
50, 3
61, 3
63, 3
71,
517
Mol
lusc
s: b
ival
veb
6.8E
+11.
2E+1
6.7E
+11.
2E+0
351
7

69
TAB
LE 6
. C
ON
CEN
TRAT
ION
R
ATIO
(C
Rw
o-w
ater
) VA
LUES
FO
R
WIL
DLI
FE
GR
OU
PS
IN
FRES
HW
ATER
EC
OSY
STEM
S (c
ont.)
Wild
life
grou
p(f
resh
wat
er)
CR
wo-
wat
er(B
q/kg
, fre
sh w
eigh
t who
le o
rgan
ism
:Bq/
L w
ater
)ID
num
bera
AM
AM
SDG
MG
MSD
Min
imum
Max
imum
N
Rep
tiles
4.0E
+21
487
Vasc
ular
pla
nts
4.6E
+14.
3E+1
3.4E
+12.
2E+0
6.9E
+01.
4E+2
2033
3, 3
43, 5
17
Nd
(neo
dym
ium
)M
ollu
scs:
biv
alve
b1.
6E+3
7.2E
+21.
4E+3
1.5E
+03
517
Vasc
ular
pla
nts
6.5E
+14.
4E+1
5.4E
+11.
8E+0
4.8E
+18.
3E+1
651
7N
i (ni
ckel
)Fi
sh2.
3E+2
3.8E
+21.
2E+2
3.2E
+01.
6E+0
3.0E
+320
733
3, 3
36, 3
40, 3
43, 3
55, 3
56, 3
57,
358,
359
, 374
, 391
, 441
Fi
sh: b
enth
ic fe
edin
g3.
6E+2
2.9E
+22.
8E+2
2.0E
+06.
6E+0
6.2E
+268
333,
343
, 355
, 356
, 357
, 358
, 391
, 44
1 Fi
sh: f
orag
e6.
1E+2
8.3E
+23.
6E+2
2.8E
+04.
5E+0
3.0E
+323
358,
374
, 391
Fi
sh: p
isci
voro
us7.
5E+1
1.2E
+24.
0E+1
3.1E
+01.
6E+0
7.1E
+211
633
3, 3
36, 3
40, 3
55, 3
56, 3
58, 3
59,
391
Mol
lusc
s: b
ival
veb
1.2E
+23.
2E+1
1.2E
+21.
3E+0
351
7R
eptil
es9.
5E+2
2.2E
+01.
9E+3
248
7Va
scul
ar p
lant
s6.
7E+1
6.1E
+15.
0E+1
2.2E
+02.
5E+1
2.8E
+221
333,
343
, 449
, 517
N
p (n
eptu
nium
)A
lgae
3.0E
+25
396
Vasc
ular
pla
nts
2.2E
+28.
3E+1
2.1E
+21.
4E+0
1.2E
+23.
1E+2
1539
6

70
TAB
LE 6
. C
ON
CEN
TRAT
ION
R
ATIO
(C
Rw
o-w
ater
) VA
LUES
FO
R
WIL
DLI
FE
GR
OU
PS
IN
FRES
HW
ATER
EC
OSY
STEM
S (c
ont.)
Wild
life
grou
p(f
resh
wat
er)
CR
wo-
wat
er(B
q/kg
, fre
sh w
eigh
t who
le o
rgan
ism
:Bq/
L w
ater
)ID
num
bera
AM
AM
SDG
MG
MSD
Min
imum
Max
imum
N
P (p
hosp
horo
us)
Fish
6.8E
+52.
5E+5
6.4E
+51.
4E+0
3.5E
+51.
2E+6
163
333,
350
Fi
sh: b
enth
ic fe
edin
g7.
1E+5
2.0E
+56.
9E+5
1.3E
+04.
6E+5
9.5E
+545
333
Fish
: pis
civo
rous
6.6E
+52.
7E+5
6.1E
+51.
5E+0
3.5E
+51.
2E+6
113
333,
350
Ph
ytop
lank
ton
1.3E
+31.
9E+3
7.4E
+22.
9E+0
6.2E
+15.
8E+3
3541
6Pb
(lea
d)A
mph
ibia
ns5.
3E+0
1.7E
+08.
9E+0
233
3C
rust
acea
ns3.
9E+1
4.7E
+12.
5E+1
2.6E
+05
507
Fish
2.5E
+27.
0E+2
8.7E
+14.
3E+0
2.0E
+07.
5E+3
379
333,
336
, 340
, 355
, 356
, 357
, 358
, 35
9, 3
61, 3
64, 3
83, 3
91, 4
02, 4
27,
431,
441
, 507
Fi
sh: b
enth
ic fe
edin
g1.
8E+2
6.3E
+24.
8E+1
5.0E
+03.
2E+0
7.5E
+314
833
3, 3
36, 3
55, 3
56, 3
57, 3
58, 3
61,
364,
383
, 391
, 402
, 441
, 507
Fi
sh: f
orag
e2.
6E+1
6.2E
+19.
9E+0
4.0E
+02.
0E+0
3.5E
+230
333,
358
, 391
, 427
, 431
, 507
Fi
sh: p
isci
voro
us3.
5E+2
7.8E
+21.
4E+2
3.8E
+08.
3E+0
5.7E
+320
133
3, 3
36, 3
40, 3
56, 3
58, 3
59, 3
61,
364,
383
, 391
, 402
, 507
M
ollu
scs:
biv
alve
b6.
0E+3
1.5E
+42.
3E+3
4.0E
+01.
1E+2
2.9E
+432
383,
402
, 505
, 508
, 517
R
eptil
es4.
4E+2
6.2E
+22.
5E+2
2.9E
+01.
3E+1
1.9E
+312
487
Vasc
ular
pla
nts
6.2E
+17.
0E+1
4.1E
+12.
5E+0
1.3E
+11.
9E+2
2133
3, 3
43, 4
02, 5
17

71
TAB
LE 6
. C
ON
CEN
TRAT
ION
R
ATIO
(C
Rw
o-w
ater
) VA
LUES
FO
R
WIL
DLI
FE
GR
OU
PS
IN
FRES
HW
ATER
EC
OSY
STEM
S (c
ont.)
Wild
life
grou
p(f
resh
wat
er)
CR
wo-
wat
er(B
q/kg
, fre
sh w
eigh
t who
le o
rgan
ism
:Bq/
L w
ater
)ID
num
bera
AM
AM
SDG
MG
MSD
Min
imum
Max
imum
N
Pm (p
rom
ethi
um)
Ph
ytop
lank
ton
7.0E
+34.
8E+3
5.7E
+31.
9E+0
2.1E
+31.
5E+4
2541
6Po
(pol
oniu
m)
Cru
stac
eans
8.3E
+37.
0E+3
6.3E
+32.
1E+0
1.2E
+31.
6E+4
1231
2, 3
28, 5
07
Fish
2.0E
+36.
6E+3
5.9E
+24.
8E+0
4.9E
+13.
7E+4
203
303,
311
, 312
, 328
, 336
, 339
, 343
, 34
6, 3
50, 3
55, 3
63, 3
83, 5
07
Fish
: ben
thic
feed
ing
1.6E
+34.
4E+3
5.7E
+24.
2E+0
6.3E
+11.
9E+4
9030
3, 3
12, 3
28, 3
36, 3
39, 3
43, 3
46,
355,
383
, 507
Fi
sh: f
orag
e7.
6E+3
1.2E
+44.
2E+3
3.0E
+01.
3E+2
2.6E
+418
311,
312
, 328
, 507
Fi
sh: p
isci
voro
us1.
3E+3
6.7E
+32.
6E+2
6.1E
+04.
9E+1
3.7E
+495
336,
343
, 346
, 350
, 355
, 363
, 383
, 50
7 M
ollu
scs
1.2E
+55.
2E+4
1.1E
+51.
5E+0
1.7E
+31.
7E+5
147
311,
312
, 328
, 383
, 504
, 508
M
ollu
scs:
biv
alve
1.3E
+54.
9E+4
1.2E
+51.
5E+0
1.7E
+31.
7E+5
141
311,
312
, 328
, 383
, 504
, 508
R
eptil
es3.
6E+3
2.3E
+33.
1E+3
1.8E
+01.
5E+3
7.3E
+37
487
Vasc
ular
pla
nts
2.0E
+31.
5E+3
1.6E
+32.
0E+0
5.5E
+24.
6E+3
3131
1, 3
12, 3
28, 3
43
Pr (p
rase
odym
ium
)M
ollu
scs:
biv
alve
b1.
7E+3
7.2E
+21.
6E+3
1.5E
+03
517
Vasc
ular
pla
nts
7.2E
+14.
7E+1
6.0E
+11.
8E+0
5.2E
+19.
1E+1
651
7

72
TAB
LE 6
. C
ON
CEN
TRAT
ION
R
ATIO
(C
Rw
o-w
ater
) VA
LUES
FO
R
WIL
DLI
FE
GR
OU
PS
IN
FRES
HW
ATER
EC
OSY
STEM
S (c
ont.)
Wild
life
grou
p(f
resh
wat
er)
CR
wo-
wat
er(B
q/kg
, fre
sh w
eigh
t who
le o
rgan
ism
:Bq/
L w
ater
)ID
num
bera
AM
AM
SDG
MG
MSD
Min
imum
Max
imum
N
Pu (p
luto
nium
)A
lgae
1.3E
+38
309
Fish
7.8E
+11.
4E+2
3.8E
+13.
3E+0
4.0E
–27.
0E+2
7330
1, 3
06, 3
07, 3
08, 3
09, 3
21, 3
31,
411,
462
Fi
sh: f
orag
e6.
8E+1
1.2E
+23.
4E+1
3.2E
+01.
5E+0
5.9E
+260
301,
306
, 307
, 308
, 309
, 321
, 331
, 41
1 In
sect
s1.
7E+2
730
9In
sect
larv
ae2.
5E+3
1530
9M
ollu
scs
5.5E
+31.
2E+4
2.3E
+33.
7E+0
1.7E
+24.
2E+4
6030
9, 4
11
Mol
lusc
s: g
astro
pod
1.4E
+32.
3E+3
7.4E
+23.
1E+0
1.7E
+27.
1E+3
5030
9, 4
11
Rep
tiles
5.9E
+33.
8E+3
8.1E
+32
487
Vasc
ular
pla
nts
1.1E
+31.
7E+3
5.7E
+23.
0E+0
3.3E
+04.
7E+3
9930
9, 4
10, 4
11, 4
61, 4
62
Ra
(rad
ium
)C
rust
acea
ns2.
7E+2
4.4E
+21.
4E+2
3.1E
+05
507
Fish
1.7E
+25.
0E+2
5.5E
+14.
5E+0
1.4E
–14.
8E+3
277
299,
301
, 305
, 318
, 339
, 340
, 343
, 34
6, 3
50, 3
55, 3
57, 3
61, 3
71, 5
07
Fish
: ben
thic
feed
ing
3.1E
+28.
1E+2
1.1E
+24.
2E+0
1.4E
+14.
8E+3
8830
5, 3
39, 3
43, 3
46, 3
55, 3
57, 3
61,
371,
507
Fi
sh: p
isci
voro
us1.
1E+2
2.1E
+25.
1E+1
3.5E
+06.
7E+0
8.5E
+268
305,
339
, 340
, 343
, 350
, 355
, 361
, 37
1, 5
07

73
TAB
LE 6
. C
ON
CEN
TRAT
ION
R
ATIO
(C
Rw
o-w
ater
) VA
LUES
FO
R
WIL
DLI
FE
GR
OU
PS
IN
FRES
HW
ATER
EC
OSY
STEM
S (c
ont.)
Wild
life
grou
p(f
resh
wat
er)
CR
wo-
wat
er(B
q/kg
, fre
sh w
eigh
t who
le o
rgan
ism
:Bq/
L w
ater
)ID
num
bera
AM
AM
SDG
MG
MSD
Min
imum
Max
imum
N
Mam
mal
s: h
erbi
voro
usb
2.1E
–11.
6E–1
1.7E
–11.
9E+0
1.0E
–15.
0E–1
4551
3M
ollu
scs:
biv
alve
b2.
4E+4
3.5E
+41.
4E+4
2.9E
+01.
2E+1
1.3E
+543
397,
502
, 505
, 508
Ph
ytop
lank
ton
5.5E
+27.
3E+2
3.3E
+22.
7E+0
1.8E
+22.
4E+3
4041
6R
eptil
es8.
0E+2
1.5E
+33.
7E+2
3.4E
+01.
0E+2
4.0E
+318
487
Vasc
ular
pla
nts
2.2E
+32.
7E+3
1.4E
+32.
6E+0
4.0E
+21.
0E+4
7331
8, 3
43
Rb
(rub
idiu
m)
Fish
: pis
civo
rous
b5.
9E+3
1.2E
+35.
8E+3
1.2E
+03
517
Mol
lusc
s: b
ival
veb
9.5E
+11.
0E+1
9.4E
+11.
1E+0
351
7Ph
ytop
lank
ton
2.6E
+23.
5E+2
1.5E
+22.
8E+0
5.2E
+11.
0E+3
3041
6R
eptil
es1.
7E+3
1.6E
+03.
4E+3
248
7Va
scul
ar p
lant
s2.
6E+3
1.7E
+32.
2E+3
1.8E
+01.
1E+3
4.1E
+36
517
Ru
(rut
heni
um)
Alg
ae5.
2E+2
6.3E
+23.
3E+2
2.6E
+01.
1E+2
1.6E
+35
320
Fish
1.0E
+23.
5E+2
2.9E
+14.
9E+0
1.7E
–11.
4E+3
1730
1, 3
94
Phyt
opla
nkto
n1.
3E+3
1.6E
+38.
0E+2
2.6E
+01.
9E+2
4.5E
+330
416
S (s
ulph
ur)
Phyt
opla
nkto
n2.
0E+2
2.9E
+21.
1E+2
2.9E
+02.
9E+1
7.6E
+225
416

74
TAB
LE 6
. C
ON
CEN
TRAT
ION
R
ATIO
(C
Rw
o-w
ater
) VA
LUES
FO
R
WIL
DLI
FE
GR
OU
PS
IN
FRES
HW
ATER
EC
OSY
STEM
S (c
ont.)
Wild
life
grou
p(f
resh
wat
er)
CR
wo-
wat
er(B
q/kg
, fre
sh w
eigh
t who
le o
rgan
ism
:Bq/
L w
ater
)ID
num
bera
AM
AM
SDG
MG
MSD
Min
imum
Max
imum
N
Sb (a
ntim
ony)
Fish
3.3E
+19.
7E+1
1.1E
+14.
5E+0
2.4E
–17.
5E+2
141
304,
333
, 399
Fi
sh: b
enth
ic fe
edin
g2.
0E+1
2.1E
+11.
4E+1
2.4E
+03.
0E+0
7.8E
+122
333
Fish
: pis
civo
rous
3.6E
+11.
1E+2
1.1E
+14.
6E+0
2.4E
–17.
5E+2
113
333,
399
In
sect
larv
ae8.
2E+1
6.9E
+16.
3E+1
2.1E
+02.
5E+0
2.4E
+214
399
Mol
lusc
s: g
astro
podb
4.9E
+11
399
Rep
tiles
2.3E
+35.
7E+1
4.5E
+32
487
Vasc
ular
pla
nts
2.5E
+11.
8E+1
2.0E
+11.
9E+0
1.3E
+13.
7E+1
651
7Sc
(sca
ndiu
m)
Alg
ae1.
8E+3
1.7E
+31.
4E+3
2.2E
+02.
5E+2
3.4E
+310
396
Fish
6.9E
+03.
4E+0
6.2E
+01.
6E+0
6.3E
+07.
4E+0
651
7Va
scul
ar p
lant
s7.
8E+1
3.4E
+17.
1E+1
1.5E
+04.
2E+1
1.2E
+221
396,
517
Se
(sel
eniu
m)
Alg
ae3.
1E+3
1.3E
+32.
8E+3
1.5E
+03
438
Fish
4.8E
+33.
3E+3
4.0E
+31.
9E+0
1.6E
+21.
4E+4
127
304,
310
, 340
, 356
, 357
, 359
, 361
, 37
1, 3
76, 3
78, 5
17
Fish
: ben
thic
feed
ing
6.2E
+33.
7E+3
5.4E
+31.
7E+0
1.7E
+31.
4E+4
5135
6, 3
57, 3
61, 3
71, 3
76, 3
78
Fish
: pis
civo
rous
4.2E
+32.
7E+3
3.5E
+31.
8E+0
1.6E
+21.
1E+4
7034
0, 3
56, 3
59, 3
61, 3
71, 3
76, 3
78,
517

75
TAB
LE 6
. C
ON
CEN
TRAT
ION
R
ATIO
(C
Rw
o-w
ater
) VA
LUES
FO
R
WIL
DLI
FE
GR
OU
PS
IN
FRES
HW
ATER
EC
OSY
STEM
S (c
ont.)
Wild
life
grou
p(f
resh
wat
er)
CR
wo-
wat
er(B
q/kg
, fre
sh w
eigh
t who
le o
rgan
ism
:Bq/
L w
ater
)ID
num
bera
AM
AM
SDG
MG
MSD
Min
imum
Max
imum
N
Inse
ct la
rvae
2.4E
+31.
9E+3
1.8E
+32.
0E+0
8.1E
+23.
9E+3
943
8M
ollu
scs:
gas
tropo
db3.
2E+3
2.9E
+32.
4E+3
2.1E
+03
438
Rep
tiles
2.7E
+32.
5E+3
1.9E
+32.
2E+0
3.3E
+15.
2E+3
1148
7Va
scul
ar p
lant
s2.
2E+2
5.7E
+12.
2E+2
1.3E
+03
517
Zoop
lank
ton
6.6E
+33.
9E+3
5.7E
+31.
7E+0
343
8Si
(sili
con)
Vasc
ular
pla
nts
8.4E
+29.
7E+2
5.5E
+22.
5E+0
5.5E
+11.
6E+3
651
7Sm
(sam
ariu
m)
Mol
lusc
s: b
ival
veb
1.4E
+36.
7E+2
1.3E
+31.
6E+0
351
7Va
scul
ar p
lant
s6.
2E+1
4.2E
+15.
1E+1
1.9E
+04.
5E+1
7.9E
+16
517
Sn (t
in)
Fish
9.9E
+27.
0E+1
9.9E
+21.
1E+0
9.2E
+21.
1E+3
334
0, 3
58
Sr (s
tron
tium
)
Alg
ae4.
9E+2
7.6E
+22.
7E+2
3.0E
+01.
6E+1
3.5E
+399
320,
402
, 417
, 419
, 445
, 456
, 461
, 46
4 C
rust
acea
ns6.
5E+2
145
4

76
TAB
LE 6
. C
ON
CEN
TRAT
ION
R
ATIO
(C
Rw
o-w
ater
) VA
LUES
FO
R
WIL
DLI
FE
GR
OU
PS
IN
FRES
HW
ATER
EC
OSY
STEM
S (c
ont.)
Wild
life
grou
p(f
resh
wat
er)
CR
wo-
wat
er(B
q/kg
, fre
sh w
eigh
t who
le o
rgan
ism
:Bq/
L w
ater
)ID
num
bera
AM
AM
SDG
MG
MSD
Min
imum
Max
imum
N
Fish
8.9E
+25.
2E+3
1.5E
+26.
6E+0
3.8E
+01.
2E+5
789
178,
314
, 317
, 324
, 331
, 332
, 333
, 33
6, 3
39, 3
40, 3
50, 3
55, 3
56, 3
57,
358,
359
, 361
, 363
, 371
, 376
, 389
, 39
4, 4
11, 4
15, 4
16, 4
18, 4
19, 4
46,
454,
461
, 462
, 517
Fi
sh: b
enth
ic fe
edin
g1.
2E+3
4.5E
+33.
3E+2
5.1E
+03.
8E+0
4.8E
+422
417
8, 3
24, 3
33, 3
36, 3
39, 3
55, 3
56,
357,
358
, 361
, 363
, 371
, 376
, 389
, 39
4, 4
16, 4
18, 4
19, 4
46, 4
62
Fish
: for
age
4.7E
+25.
9E+2
2.9E
+22.
6E+0
1.7E
+12.
8E+3
7331
7, 3
24, 3
31, 3
33, 3
94, 4
11, 4
16,
446,
454
, 461
, 517
Fi
sh: p
isci
voro
us7.
9E+2
5.8E
+31.
1E+2
7.4E
+05.
3E+0
1.2E
+549
117
8, 3
17, 3
24, 3
32, 3
33, 3
36, 3
39,
340,
350
, 355
, 356
, 358
, 359
, 361
, 36
3, 3
71, 3
76, 3
89, 3
94, 4
15, 4
16,
418,
419
, 446
, 517
M
ollu
scs
4.6E
+26.
1E+2
2.8E
+22.
7E+0
3.8E
+12.
7E+3
8340
2, 4
08, 4
11, 5
17
Mol
lusc
s: b
ival
ve3.
8E+2
1.6E
+23.
5E+2
1.5E
+02.
1E+2
6.6E
+223
402,
411
, 517
M
ollu
scs:
gas
tropo
d4.
9E+2
7.0E
+22.
8E+2
2.9E
+03.
8E+1
2.7E
+360
402,
408
, 411
Ph
ytop
lank
ton
1.3E
+21.
2E+2
9.0E
+12.
3E+0
2.1E
+13.
7E+2
5041
6, 4
19, 4
54, 4
56
Rep
tiles
1.2E
+44.
9E+4
2.8E
+35.
5E+0
8.9E
+02.
8E+4
4048
7

77
TAB
LE 6
. C
ON
CEN
TRAT
ION
R
ATIO
(C
Rw
o-w
ater
) VA
LUES
FO
R
WIL
DLI
FE
GR
OU
PS
IN
FRES
HW
ATER
EC
OSY
STEM
S (c
ont.)
Wild
life
grou
p(f
resh
wat
er)
CR
wo-
wat
er(B
q/kg
, fre
sh w
eigh
t who
le o
rgan
ism
:Bq/
L w
ater
)ID
num
bera
AM
AM
SDG
MG
MSD
Min
imum
Max
imum
N
Vasc
ular
pla
nts
1.8E
+24.
7E+2
6.1E
+14.
3E+0
1.7E
+14.
4E+3
533
153,
331
, 402
, 410
, 411
, 412
, 419
, 42
0, 4
21, 4
22, 4
25, 4
45, 4
49, 4
54,
456,
461
, 462
, 464
, 517
Zo
opla
nkto
n3.
7E+3
7.4E
+23.
6E+3
1.2E
+03.
0E+3
4.4E
+310
412
Tc (t
echn
etiu
m)
Fish
: for
ageb
9.9E
+19.
6E+1
7.1E
+12.
3E+0
5.3E
+02.
0E+2
330
1Te
(tel
luri
um)
Fish
: pis
civo
rous
b3.
3E+2
2.1E
+22.
8E+2
1.8E
+09.
6E+1
8.9E
+215
333
Th
(tho
rium
)Fi
sh6.
7E+2
4.6E
+39.
8E+1
7.1E
+03.
3E+1
3.7E
+464
304,
318
, 339
, 507
Ph
ytop
lank
ton
1.2E
+41.
0E+4
8.7E
+32.
1E+0
2.1E
+22.
9E+4
3041
6, 4
28
Rep
tiles
1.0E
+36.
4E+2
8.7E
+21.
8E+0
2.4E
+21.
5E+3
748
7Va
scul
ar p
lant
s1.
1E+5
3.6E
+53.
1E+4
4.8E
+07.
1E+1
4.7E
+584
318,
517
Ti
(tita
nium
)Fi
sh8.
0E+2
1.6E
+33.
6E+2
3.6E
+03.
0E+1
6.1E
+314
633
6, 3
40, 3
55, 3
56, 3
57, 3
58, 3
59,
376
Fish
: ben
thic
feed
ing
1.7E
+21.
1E+2
1.4E
+21.
8E+0
3.0E
+13.
8E+2
4333
6, 3
55, 3
56, 3
57, 3
58
Fish
: pis
civo
rous
1.1E
+31.
9E+3
5.8E
+23.
2E+0
3.5E
+16.
1E+3
9333
6, 3
40, 3
55, 3
56, 3
58, 3
59, 3
76

78
TAB
LE 6
. C
ON
CEN
TRAT
ION
R
ATIO
(C
Rw
o-w
ater
) VA
LUES
FO
R
WIL
DLI
FE
GR
OU
PS
IN
FRES
HW
ATER
EC
OSY
STEM
S (c
ont.)
Wild
life
grou
p(f
resh
wat
er)
CR
wo-
wat
er(B
q/kg
, fre
sh w
eigh
t who
le o
rgan
ism
:Bq/
L w
ater
)ID
num
bera
AM
AM
SDG
MG
MSD
Min
imum
Max
imum
N
Tl (
thal
lium
)Fi
sh: p
isci
voro
usb
1.0E
+22
359
Tm
(thu
lium
)M
ollu
scs:
biv
alve
b3.
4E+2
1.5E
+23.
1E+2
1.5E
+03
517
Vasc
ular
pla
nts
4.6E
+13.
1E+1
3.8E
+11.
8E+0
3.4E
+15.
7E+1
651
7U
(ura
nium
)C
rust
acea
ns2.
0E+2
3.1E
+21.
1E+2
3.1E
+05
507
Fish
3.1E
+11.
0E+2
9.1E
+04.
8E+0
5.0E
–27.
6E+2
1294
299,
301
, 303
, 318
, 339
, 340
, 350
, 35
7, 3
58, 3
61, 3
71, 3
76, 3
77, 3
78,
507,
517
Fi
sh: b
enth
ic fe
edin
g7.
5E+1
2.1E
+22.
6E+1
4.3E
+06.
0E–1
7.6E
+299
303,
339
, 357
, 358
, 361
, 371
, 376
, 37
7, 3
78, 5
07
Fish
: pis
civo
rous
2.2E
+14.
0E+1
1.1E
+13.
4E+0
5.1E
–11.
7E+2
8430
1, 3
40, 3
50, 3
58, 3
61, 3
71, 3
77,
378,
507
M
ollu
scs:
biv
alve
b5.
6E+2
1.3E
+25.
4E+2
1.3E
+03
517
Phyt
opla
nkto
n7.
1E+1
4.7E
+15.
9E+1
1.8E
+04.
0E+1
1.8E
+240
416
Rep
tiles
1.2E
+29.
6E+1
9.0E
+12.
1E+0
4.5E
+11.
9E+2
848
7Va
scul
ar p
lant
s3.
7E+2
9.9E
+21.
3E+2
4.2E
+02.
9E+1
2.7E
+338
631
8, 5
17
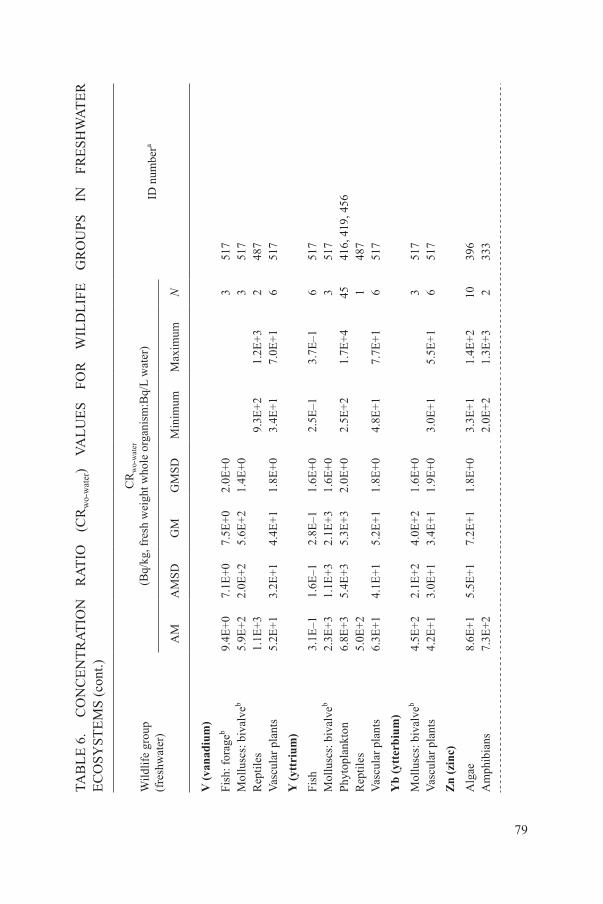
79
TAB
LE 6
. C
ON
CEN
TRAT
ION
R
ATIO
(C
Rw
o-w
ater
) VA
LUES
FO
R
WIL
DLI
FE
GR
OU
PS
IN
FRES
HW
ATER
EC
OSY
STEM
S (c
ont.)
Wild
life
grou
p(f
resh
wat
er)
CR
wo-
wat
er(B
q/kg
, fre
sh w
eigh
t who
le o
rgan
ism
:Bq/
L w
ater
)ID
num
bera
AM
AM
SDG
MG
MSD
Min
imum
Max
imum
N
V (v
anad
ium
)Fi
sh: f
orag
eb9.
4E+0
7.1E
+07.
5E+0
2.0E
+03
517
Mol
lusc
s: b
ival
veb
5.9E
+22.
0E+2
5.6E
+21.
4E+0
351
7R
eptil
es1.
1E+3
9.3E
+21.
2E+3
248
7Va
scul
ar p
lant
s5.
2E+1
3.2E
+14.
4E+1
1.8E
+03.
4E+1
7.0E
+16
517
Y (y
ttri
um)
Fish
3.1E
–11.
6E–1
2.8E
–11.
6E+0
2.5E
–13.
7E–1
651
7M
ollu
scs:
biv
alve
b2.
3E+3
1.1E
+32.
1E+3
1.6E
+03
517
Phyt
opla
nkto
n6.
8E+3
5.4E
+35.
3E+3
2.0E
+02.
5E+2
1.7E
+445
416,
419
, 456
R
eptil
es5.
0E+2
148
7Va
scul
ar p
lant
s6.
3E+1
4.1E
+15.
2E+1
1.8E
+04.
8E+1
7.7E
+16
517
Yb
(ytt
erbi
um)
Mol
lusc
s: b
ival
veb
4.5E
+22.
1E+2
4.0E
+21.
6E+0
351
7Va
scul
ar p
lant
s4.
2E+1
3.0E
+13.
4E+1
1.9E
+03.
0E+1
5.5E
+16
517
Zn
(zin
c)A
lgae
8.6E
+15.
5E+1
7.2E
+11.
8E+0
3.3E
+11.
4E+2
1039
6A
mph
ibia
ns7.
3E+2
2.0E
+21.
3E+3
233
3

80
TAB
LE 6
. C
ON
CEN
TRAT
ION
R
ATIO
(C
Rw
o-w
ater
) VA
LUES
FO
R
WIL
DLI
FE
GR
OU
PS
IN
FRES
HW
ATER
EC
OSY
STEM
S (c
ont.)
Wild
life
grou
p(f
resh
wat
er)
CR
wo-
wat
er(B
q/kg
, fre
sh w
eigh
t who
le o
rgan
ism
:Bq/
L w
ater
)ID
num
bera
AM
AM
SDG
MG
MSD
Min
imum
Max
imum
N
Fish
7.6E
+36.
0E+3
6.0E
+32.
0E+0
1.6E
+13.
4E+4
522
314,
333
, 336
, 339
, 340
, 346
, 355
, 35
6, 3
57, 3
58, 3
59, 3
63, 3
92, 4
31,
460,
517
Fi
sh: b
enth
ic fe
edin
g6.
8E+3
6.7E
+34.
9E+3
2.3E
+02.
2E+2
3.4E
+413
633
3, 3
36, 3
39, 3
46, 3
55, 3
56, 3
57,
358,
363
Fi
sh: f
orag
e3.
0E+3
4.2E
+31.
7E+3
2.8E
+01.
6E+1
1.1E
+420
333,
392
, 431
, 517
Fi
sh: p
isci
voro
us8.
1E+3
5.7E
+36.
7E+3
1.9E
+03.
9E+2
2.4E
+436
533
3, 3
36, 3
39, 3
40, 3
46, 3
55, 3
56,
358,
359
, 363
, 460
, 517
M
amm
als:
om
nivo
rous
b1.
6E+3
151
1Ph
ytop
lank
ton
4.5E
+33.
9E+3
3.4E
+32.
1E+0
1.6E
+21.
1E+4
3541
6R
eptil
es2.
3E+4
2.3E
+41.
6E+4
2.3E
+02.
7E+3
5.3E
+46
487
Vasc
ular
pla
nts
5.7E
+21.
4E+3
2.2E
+24.
0E+0
4.5E
+14.
5E+3
3833
3, 3
96, 4
49, 5
17
Zr
(zir
coni
um)
Fish
1.1E
+21.
8E+2
5.4E
+13.
2E+0
9.2E
+06.
9E+2
3133
3, 5
17
Fish
: pis
civo
rous
1.2E
+22.
0E+2
6.3E
+13.
1E+0
1.2E
+16.
9E+2
2033
3Ph
ytop
lank
ton
1.9E
+38.
0E+2
1.7E
+31.
5E+0
1.1E
+32.
7E+3
1041
6

81
TAB
LE 6
. C
ON
CEN
TRAT
ION
R
ATIO
(C
Rw
o-w
ater
) VA
LUES
FO
R
WIL
DLI
FE
GR
OU
PS
IN
FRES
HW
ATER
EC
OSY
STEM
S (c
ont.)
Wild
life
grou
p(f
resh
wat
er)
CR
wo-
wat
er(B
q/kg
, fre
sh w
eigh
t who
le o
rgan
ism
:Bq/
L w
ater
)ID
num
bera
AM
AM
SDG
MG
MSD
Min
imum
Max
imum
N
Rep
tiles
1.2E
+37.
5E+2
1.7E
+32
487
Vasc
ular
pla
nts
4.1E
+13.
5E+1
3.1E
+12.
1E+0
4.0E
+14.
2E+1
651
7
Not
e: A
M: a
rithm
etic
mea
n; A
MSD
: arit
hmet
ic m
ean
stan
dard
dev
iatio
n; F
W: f
resh
wei
ght;
GM
: geo
met
ric m
ean;
GM
SD: g
eom
etric
mea
n st
anda
rd
devi
atio
n; ID
: ide
ntifi
catio
n; N
: num
ber o
f dat
a.a
The
publ
icat
ions
cor
resp
ondi
ng to
thes
e ID
num
bers
are
giv
en in
the A
nnex
.b
All
of th
e da
ta fo
r the
wild
life
grou
p ar
e fo
r the
subc
ateg
ory
pres
ente
d.c
This
val
ue is
from
a si
ngle
stud
y an
d is
low
com
pare
d w
ith th
ose
for P
u an
d A
m fo
r whi
ch th
ere
are
cons
ider
ably
larg
er d
atas
ets.

82
TAB
LE 7
. C
ON
CEN
TRAT
ION
RAT
IO (C
Rw
o-w
ater
) VA
LUES
FO
R W
ILD
LIFE
GR
OU
PS IN
MA
RIN
E EC
OSY
STEM
S (c
ont.)
Wild
life
grou
p(m
arin
e)
CR
wo-
wat
er(B
q/kg
, fre
shw
eigh
t who
le o
rgan
ism
:Bq/
L w
ater
)ID
num
bera
AM
AM
SDG
MG
MSD
Min
imum
Max
imum
N
Ag
(silv
er)
Ann
elid
sb2.
7E+4
121
Fish
b1.
1E+4
9.5E
+38.
1E+3
2.1E
+07.
2E+2
2.4E
+45
8, 2
1, 3
1 M
acro
alga
eb3.
9E+3
6.0E
+32.
1E+3
3.0E
+02.
0E+2
1.5E
+420
7, 1
0, 1
6, 2
1, 1
49
Mam
mal
s: c
arni
voro
usb,
c2.
2E+4
2.1E
+41.
6E+4
2.2E
+010
154
Mol
lusc
sb3.
6E+4
7.2E
+41.
6E+4
3.6E
+03.
3E+2
1.0E
+519
8, 1
0, 1
5, 2
1, 3
1, 1
49
Phyt
opla
nkto
nb6.
9E+4
8.2E
+44.
4E+4
2.6E
+01.
3E+4
2.0E
+510
7, 2
1, 4
4 Se
a an
emon
es/tr
ue c
oral
s1.
3E+2
8.2E
+11.
7E+2
248
Zoop
lank
tonb
6.0E
+39.
6E+3
3.2E
+33.
1E+0
4.7E
+21.
7E+4
310
, 21
Am
(am
eric
ium
)C
rust
acea
ns: l
arge
c5.
0E+2
513
3Fi
sh: b
enth
ic fe
edin
gc3.
2E+2
4.2E
+21.
9E+2
2.7E
+01.
7E+1
1.5E
+323
55, 7
8, 1
16
Mac
roal
gae
4.3E
+27.
8E+2
2.1E
+23.
3E+0
3.9E
+13.
8E+3
4716
, 55,
60,
100
, 106
, 133
, 381
M
ollu
scs
9.9E
+31.
1E+4
6.7E
+32.
4E+0
2.0E
+22.
0E+4
3352
, 55,
78,
133
M
ollu
scs:
gas
tropo
d8.
7E+3
1.1E
+45.
4E+3
2.7E
+026
78Ph
ytop
lank
ton
2.1E
+52.
1E+5
1.5E
+52.
3E+0
7.0E
+36.
9E+5
1541
, 42,
44
Sea
anem
ones
/true
cor
als
4.5E
+14.
2E+1
3.3E
+12.
2E+0
6.0E
+01.
2E+2
648
Ca
(cal
cium
)Fi
sh: b
enth
ic fe
edin
gc6.
2E+0
5.5E
+04.
6E+0
2.2E
+04.
0E–1
1.1E
+13
333

83
TAB
LE 7
. C
ON
CEN
TRAT
ION
RAT
IO (C
Rw
o-w
ater
) VA
LUES
FO
R W
ILD
LIFE
GR
OU
PS IN
MA
RIN
E EC
OSY
STEM
S (c
ont.)
Wild
life
grou
p(m
arin
e)
CR
wo-
wat
er(B
q/kg
, fre
shw
eigh
t who
le o
rgan
ism
:Bq/
L w
ater
)ID
num
bera
AM
AM
SDG
MG
MSD
Min
imum
Max
imum
N
Cd
(cad
miu
m)
Ann
elid
s1.
5E+3
153
Cru
stac
eans
: lar
gec
9.6E
+35.
0E+3
8.5E
+31.
6E+0
7.6E
+21.
2E+4
553
, 514
Fi
sh2.
9E+4
5.9E
+41.
3E+4
3.6E
+03.
0E+1
1.5E
+56
10, 3
1, 3
6, 8
7 M
acro
alga
e8.
4E+2
8.4E
+25.
9E+2
2.3E
+01.
6E+1
4.7E
+363
10, 3
2, 4
0, 8
4, 8
7, 9
7 M
amm
alsb
4.7E
+35.
0E+3
3.2E
+32.
4E+0
529
39M
ollu
scs
9.0E
+44.
3E+5
1.9E
+45.
9E+0
1.0E
+12.
3E+6
8010
, 31,
32,
36,
40,
53
Mol
lusc
s: b
ival
ve1.
3E+5
5.0E
+53.
4E+4
5.2E
+02.
2E+2
2.3E
+621
32, 3
6, 5
3 M
ollu
scs:
gas
tropo
d5.
7E+3
2.1E
+41.
5E+3
5.2E
+01.
0E+1
1.5E
+550
32, 3
6, 4
0 Ph
ytop
lank
ton
8.1E
+21.
1E+3
4.7E
+22.
8E+0
2.2E
+13.
2E+3
5610
, 44,
150
, 152
Zo
opla
nkto
n5.
0E+4
210
Ce
(cer
ium
)C
rust
acea
ns1.
0E+2
8.5E
+11.
2E+2
283
Fish
: for
agec
3.9E
+26.
2E+2
2.1E
+23.
1E+0
2.1E
+11.
1E+3
383
, 141
M
acro
alga
e2.
1E+3
3.2E
+31.
2E+3
2.9E
+01.
4E+1
1.1E
+440
10, 8
3, 9
3, 1
14, 1
41, 1
45
Mol
lusc
s2.
2E+3
3.5E
+31.
1E+3
3.1E
+06.
0E+1
1.0E
+49
10, 2
7, 8
3, 1
41Ph
ytop
lank
ton
1.1E
+42.
2E+4
4.8E
+33.
6E+0
3.4E
+24.
5E+4
1110
, 120
Se
a an
emon
es/tr
ue c
oral
s1.
3E+2
5.4E
+11.
2E+2
1.5E
+04.
9E+1
1.7E
+24
11, 1
19, 1
20
Vasc
ular
pla
nts
1.6E
+21.
3E+2
1.8E
+22
119,
120

84
TAB
LE 7
. C
ON
CEN
TRAT
ION
RAT
IO (C
Rw
o-w
ater
) VA
LUES
FO
R W
ILD
LIFE
GR
OU
PS IN
MA
RIN
E EC
OSY
STEM
S (c
ont.)
Wild
life
grou
p(m
arin
e)
CR
wo-
wat
er(B
q/kg
, fre
shw
eigh
t who
le o
rgan
ism
:Bq/
L w
ater
)ID
num
bera
AM
AM
SDG
MG
MSD
Min
imum
Max
imum
N
Cl (
chlo
rine
)C
rust
acea
nsb
5.6E
–21
21Fi
shb
5.6E
–21
21M
acro
alga
eb8.
2E–1
4.3E
–17.
3E–1
1.6E
+04.
4E–2
1.0E
+036
21, 6
5 M
ollu
scsb
4.7E
–21
21C
m (c
uriu
m)
Mac
roal
gae
1.2E
+41.
2E+4
8.2E
+32.
3E+0
1.3E
+35.
2E+4
2335
, 60
Mol
lusc
s3.
2E+4
2.7E
+42.
4E+4
2.1E
+01.
2E+4
5.7E
+410
35Ph
ytop
lank
ton
2.7E
+52.
2E+5
2.1E
+52.
0E+0
1.2E
+56.
4E+5
544
Co
(cob
alt)
Ann
elid
s8.
3E+3
1.0E
+45.
3E+3
2.6E
+01.
0E+3
2.0E
+43
120
Cru
stac
eans
3.5E
+36.
4E+3
1.7E
+33.
3E+0
2.2E
+22.
2E+4
118,
67,
72,
120
, 147
, 149
Fi
sh5.
3E+3
1.5E
+41.
8E+3
4.3E
+02.
8E+1
7.8E
+499
8, 1
0, 2
0, 6
7, 7
2, 7
4, 1
20, 1
23,
140,
147
Fi
sh: b
enth
ic fe
edin
g4.
8E+2
6.8E
+22.
8E+2
2.8E
+05.
3E+1
3.3E
+324
67, 7
2, 1
20, 1
47
Fish
: for
age
1.1E
+32.
8E+3
3.8E
+24.
2E+0
3.5E
+11.
0E+4
1267
, 72,
120
, 147
Fi
sh: p
isci
voro
us1.
1E+4
2.0E
+45.
0E+3
3.4E
+02.
8E+1
7.8E
+446
67, 7
2, 7
4, 1
20, 1
47
Mac
roal
gae
1.7E
+33.
2E+3
7.8E
+23.
5E+0
9.0E
+01.
4E+4
130
8, 1
0, 2
6, 7
2, 9
8, 1
00, 1
08, 1
20,
140,
147
, 149
, 381
M
amm
als:
car
nivo
rous
b,c
5.0E
+21.
4E+3
1.7E
+24.
4E+0
1015
4

85
TAB
LE 7
. C
ON
CEN
TRAT
ION
RAT
IO (C
Rw
o-w
ater
) VA
LUES
FO
R W
ILD
LIFE
GR
OU
PS IN
MA
RIN
E EC
OSY
STEM
S (c
ont.)
Wild
life
grou
p(m
arin
e)
CR
wo-
wat
er(B
q/kg
, fre
shw
eigh
t who
le o
rgan
ism
:Bq/
L w
ater
)ID
num
bera
AM
AM
SDG
MG
MSD
Min
imum
Max
imum
N
Mol
lusc
s5.
3E+3
1.5E
+41.
7E+3
4.5E
+01.
7E+2
4.1E
+442
8, 1
0, 1
5, 2
0, 6
7, 7
2, 1
20, 1
40,
147,
148
, 149
M
ollu
scs:
biv
alve
5.5E
+31.
6E+4
1.8E
+34.
5E+0
1.7E
+24.
1E+4
2610
, 20,
67,
72,
120
, 147
, 148
, 149
Ph
ytop
lank
ton
3.1E
+34.
3E+3
1.8E
+32.
9E+0
1.0E
+21.
2E+4
229,
10,
17,
44,
58
Sea
anem
ones
/true
cor
als
3.3E
+25.
2E+2
1.7E
+23.
1E+0
2.0E
+11.
1E+3
448
, 120
Va
scul
ar p
lant
s5.
2E+1
5.9E
+13.
4E+1
2.5E
+01.
8E+1
1.2E
+23
18, 1
20
Zoop
lank
ton
4.8E
+36.
5E+3
2.9E
+32.
8E+0
2.0E
+22.
6E+4
2410
, 120
, 147
C
s (ca
esiu
m)
Ann
elid
s1.
8E+2
1.6E
+21.
3E+2
2.2E
+01.
0E+1
5.1E
+240
6, 1
20, 1
25
Bird
s4.
8E+2
6.4E
+22.
9E+2
2.8E
+05.
0E+1
3.5E
+366
43, 6
3, 9
1, 1
25
Cru
stac
eans
5.3E
+11.
2E+2
2.1E
+13.
9E+0
5.5E
–11.
3E+3
287
6, 2
4, 4
3, 5
1, 6
7, 7
8, 8
3, 9
0, 9
1,
99, 1
08, 1
10, 1
11, 1
20, 1
25,
133,
139
, 147
C
rust
acea
ns: l
arge
5.6E
+11.
4E+2
2.1E
+14.
0E+0
1.3E
+11.
3E+3
225
24, 4
3, 5
1, 7
8, 9
0, 9
1, 1
10, 1
20,
125,
133
, 139
, 147
C
rust
acea
ns: s
mal
l4.
4E+1
3.8E
+13.
4E+1
2.1E
+05.
5E–1
1.2E
+254
24, 5
1, 6
7, 9
1, 9
9, 1
08, 1
10, 1
11,
120,
125
, 139

86
TAB
LE 7
. C
ON
CEN
TRAT
ION
RAT
IO (C
Rw
o-w
ater
) VA
LUES
FO
R W
ILD
LIFE
GR
OU
PS IN
MA
RIN
E EC
OSY
STEM
S (c
ont.)
Wild
life
grou
p(m
arin
e)
CR
wo-
wat
er(B
q/kg
, fre
shw
eigh
t who
le o
rgan
ism
:Bq/
L w
ater
)ID
num
bera
AM
AM
SDG
MG
MSD
Min
imum
Max
imum
N
Fish
8.4E
+11.
2E+2
4.8E
+12.
9E+0
5.0E
+01.
8E+3
1812
5, 6
, 14,
20,
24,
43,
49,
51,
62,
67
, 74,
76,
78,
79,
83,
90,
91,
92
, 99,
103
, 106
, 107
, 108
, 10
9, 1
10, 1
11, 1
13, 1
17, 1
20,
125,
131
, 132
, 137
, 143
, 145
, 14
6, 1
47, 3
85, 3
86Fi
sh: b
enth
ic fe
edin
g7.
1E+1
1.5E
+23.
1E+1
3.6E
+05.
0E+0
1.8E
+351
524
, 51,
62,
67,
78,
90,
99,
106
, 10
7, 1
10, 1
11, 1
17, 1
20, 1
25,
132,
137
, 143
, 145
, 147
, 385
, 38
6 Fi
sh: f
orag
e1.
2E+2
1.8E
+26.
8E+1
2.9E
+01.
2E+1
1.0E
+392
14, 4
9, 6
2, 6
7, 9
1, 9
9, 1
06, 1
07,
110,
111
, 113
, 117
, 125
, 146
, 14
7, 3
85, 3
86
Fish
: pis
civo
rous
7.9E
+16.
9E+1
5.9E
+12.
1E+0
7.4E
+03.
6E+2
903
6, 1
4, 2
4, 6
2, 6
7, 7
4, 7
8, 9
0, 9
1,
92, 9
9, 1
06, 1
08, 1
09, 1
10, 1
11,
113,
117
, 120
, 125
, 131
, 132
, 13
7, 1
43, 1
46, 1
47, 3
85
Mac
roal
gae
9.6E
+13.
7E+2
2.4E
+15.
3E+0
3.7E
+04.
8E+3
654
10, 1
2, 4
3, 5
1, 6
2, 6
3, 6
5, 7
8, 8
3,
90, 9
1, 9
3, 9
5, 1
00, 1
06, 1
07,
108,
109
, 110
, 111
, 113
, 114
, 12
0, 1
25, 1
33, 1
44, 1
45, 1
46,
147,
381
, 386

87
TAB
LE 7
. C
ON
CEN
TRAT
ION
RAT
IO (C
Rw
o-w
ater
) VA
LUES
FO
R W
ILD
LIFE
GR
OU
PS IN
MA
RIN
E EC
OSY
STEM
S (c
ont.)
Wild
life
grou
p(m
arin
e)
CR
wo-
wat
er(B
q/kg
, fre
shw
eigh
t who
le o
rgan
ism
:Bq/
L w
ater
)ID
num
bera
AM
AM
SDG
MG
MSD
Min
imum
Max
imum
N
Mam
mal
sb2.
2E+2
5.1E
+28.
4E+1
3.9E
+08.
7E+0
8.2E
+271
71,
5, 1
2, 1
4, 3
0, 3
3, 4
3, 5
4, 6
3,
77, 9
1, 1
11, 1
28, 1
33, 1
54, 1
56
Mol
lusc
s5.
0E+1
5.1E
+13.
5E+1
2.3E
+02.
0E+0
2.1E
+233
66,
20,
24,
43,
51,
67,
78,
83,
90,
91
, 94,
95,
103
, 113
, 120
, 125
, 13
3, 1
40, 1
47, 3
85
Mol
lusc
s: b
ival
ve6.
3E+1
5.9E
+14.
6E+1
2.2E
+02.
0E+0
1.7E
+219
16,
20,
24,
43,
67,
78,
90,
91,
94,
95
, 103
, 113
, 125
, 133
, 147
, 38
5 M
ollu
scs:
gas
tropo
d3.
7E+1
2.8E
+13.
0E+1
2.0E
+03.
0E+0
1.3E
+210
220
, 78,
94,
95,
113
, 120
, 125
, 147
Ph
ytop
lank
ton
8.5E
+01.
8E+1
3.6E
+03.
7E+0
1.0E
+07.
3E+1
1519
, 51,
120
Se
a an
emon
es/tr
ue c
oral
s2.
3E+2
3.2E
+21.
3E+2
2.8E
+01.
0E+0
8.0E
+29
48, 5
1, 1
19, 1
25
Vasc
ular
pla
nts
1.0E
+17.
2E+0
8.5E
+01.
9E+0
2.0E
+01.
5E+1
318
, 119
Zo
opla
nkto
n1.
3E+2
2.2E
+26.
7E+1
3.2E
+02.
9E+0
9.9E
+223
88, 1
47
Cu
(cop
per)
Fish
2.1E
+31.
2E+3
1.9E
+31.
7E+0
1.1E
+34.
2E+3
933
3E
u (e
urop
ium
)Fi
sh: f
orag
ec7.
3E+2
114
1M
acro
alga
e1.
4E+3
1.0E
+31.
1E+3
1.9E
+03.
0E+2
2.6E
+34
141
Mol
lusc
s: b
ival
vec
6.9E
+31
141

88
TAB
LE 7
. C
ON
CEN
TRAT
ION
RAT
IO (C
Rw
o-w
ater
) VA
LUES
FO
R W
ILD
LIFE
GR
OU
PS IN
MA
RIN
E EC
OSY
STEM
S (c
ont.)
Wild
life
grou
p(m
arin
e)
CR
wo-
wat
er(B
q/kg
, fre
shw
eigh
t who
le o
rgan
ism
:Bq/
L w
ater
)ID
num
bera
AM
AM
SDG
MG
MSD
Min
imum
Max
imum
N
Hg
(mer
cury
)C
rust
acea
ns: l
arge
c1.
6E+4
5.7E
+31.
5E+4
1.4E
+04
514
I (io
dine
)M
acro
alga
eb4.
2E+3
1.1E
+41.
4E+3
4.3E
+01.
6E+2
8.5E
+461
10, 2
1, 6
2, 6
5, 1
20
Mam
mal
s: c
arni
voro
usb,
c6.
8E–1
2.3E
–16.
4E–1
1.4E
+08
154
Mol
lusc
sb8.
8E+3
1.8E
+43.
8E+3
3.6E
+01.
4E+1
5.0E
+48
10, 2
1, 1
20
Phyt
opla
nkto
nb9.
5E+2
121
Vasc
ular
pla
nts
2.4E
+11
18Zo
opla
nkto
n3.
1E+3
210
Mg
(mag
nesi
um)
Fish
: ben
thic
feed
ingc
1.6E
–14.
1E–2
1.6E
–11.
3E+0
1.2E
–11.
9E–1
333
3M
n (m
anga
nese
)A
nnel
ids
3.2E
+31
53C
rust
acea
ns4.
5E+4
9.8E
+41.
9E+4
3.7E
+04.
5E+2
1.3E
+59
10, 5
3, 8
5, 1
20, 1
47
Fish
2.6E
+31.
5E+4
4.4E
+26.
6E+0
2.0E
+15.
0E+4
5710
, 31,
85,
87,
115
, 120
, 123
, 14
7, 3
33
Mac
roal
gae
8.6E
+31.
0E+4
5.6E
+32.
5E+0
3.0E
+25.
2E+4
4410
, 47,
56,
85,
87,
120
, 147
M
amm
als:
car
nivo
rous
b,c
4.5E
+31.
1E+4
1.7E
+34.
0E+0
1015
4M
ollu
scs
1.2E
+42.
0E+4
5.9E
+33.
2E+0
2.4E
+28.
5E+4
4110
, 31,
53,
85,
120
, 147
M
ollu
scs:
biv
alve
5.8E
+39.
2E+3
3.1E
+33.
1E+0
4.0E
+23.
5E+4
2153
, 85,
120
, 147

89
TAB
LE 7
. C
ON
CEN
TRAT
ION
RAT
IO (C
Rw
o-w
ater
) VA
LUES
FO
R W
ILD
LIFE
GR
OU
PS IN
MA
RIN
E EC
OSY
STEM
S (c
ont.)
Wild
life
grou
p(m
arin
e)
CR
wo-
wat
er(B
q/kg
, fre
shw
eigh
t who
le o
rgan
ism
:Bq/
L w
ater
)ID
num
bera
AM
AM
SDG
MG
MSD
Min
imum
Max
imum
N
Phyt
opla
nkto
n3.
5E+3
3.5E
+32.
5E+3
2.3E
+02.
0E+1
5.0E
+36
10, 1
20
Sea
anem
ones
/true
cor
als
1.0E
+11
48Va
scul
ar p
lant
s3.
0E+4
8.9E
+35.
2E+4
256
, 85
Zoop
lank
ton
2.5E
+33.
4E+3
1.5E
+32.
8E+0
2.0E
+21.
1E+4
1810
, 120
, 147
N
a (s
odiu
m)
Fish
: ben
thic
feed
ingc
2.0E
–16.
4E–2
1.9E
–11.
4E+0
1.3E
–12.
4E–1
333
3N
b (n
iobi
um)
Cru
stac
eans
1.0E
+21
10M
acro
alga
e4.
9E+2
5.6E
+23.
2E+2
2.5E
+02.
0E+1
1.7E
+315
10, 1
20
Mol
lusc
s8.
8E+2
210
Ni (
nick
el)
Ann
elid
sb4.
2E+3
121
Fish
2.5E
+21.
9E+2
2.0E
+22.
0E+0
5.5E
+16.
7E+2
1610
, 31,
333
M
acro
alga
e9.
5E+2
9.0E
+26.
9E+2
2.2E
+02.
5E+2
2.8E
+314
10, 4
7 M
ollu
scs
6.4E
+31.
3E+4
2.8E
+33.
6E+0
5.5E
+12.
1E+4
1210
, 31
Phyt
opla
nkto
nb5.
7E+2
7.4E
+23.
5E+2
2.7E
+01.
6E+2
1.4E
+33
10, 2
1 Zo
opla
nkto
n5.
0E+2
210

90
TAB
LE 7
. C
ON
CEN
TRAT
ION
RAT
IO (C
Rw
o-w
ater
) VA
LUES
FO
R W
ILD
LIFE
GR
OU
PS IN
MA
RIN
E EC
OSY
STEM
S (c
ont.)
Wild
life
grou
p(m
arin
e)
CR
wo-
wat
er(B
q/kg
, fre
shw
eigh
t who
le o
rgan
ism
:Bq/
L w
ater
)ID
num
bera
AM
AM
SDG
MG
MSD
Min
imum
Max
imum
N
Np
(nep
tuni
um)
Cru
stac
eans
: lar
gec
1.1E
+21
515
Mac
roal
gae
5.2E
+12.
2E+1
4.8E
+11.
5E+0
1.5E
+16.
6E+1
5335
, 86,
515
M
ollu
scs
3.8E
+23.
7E+2
2.7E
+22.
3E+0
1.1E
+18.
9E+2
1435
, 515
M
ollu
scs:
gas
tropo
d4.
3E+2
4.1E
+23.
1E+2
2.2E
+01.
1E+1
8.9E
+211
35, 5
15
Phyt
opla
nkto
n1.
4E+2
6.2E
+11.
3E+2
1.5E
+03.
0E+1
2.4E
+212
41Zo
opla
nkto
n1.
7E+1
251
P (p
hosp
horo
us)
Ann
elid
sb2.
6E+4
121
Fish
9.9E
+43.
0E+4
9.5E
+41.
3E+0
2175
Mac
roal
gaeb
9.8E
+31.
9E+3
9.6E
+31.
2E+0
8.4E
+31.
2E+4
321
Mam
mal
sb3.
8E+4
1.1E
+51.
3E+4
4.4E
+02.
3E+4
1.9E
+511
21, 1
54
Mol
lusc
sb2.
0E+4
121
Phyt
opla
nkto
nb3.
3E+4
221
Zoop
lank
tonb
2.3E
+41
21Pb
(lea
d)C
rust
acea
ns3.
1E+4
9.1E
+41.
0E+4
4.5E
+02.
0E+2
2.9E
+510
4, 3
1, 5
9 Fi
sh9.
4E+3
2.6E
+43.
1E+3
4.4E
+06.
3E+1
1.2E
+521
4, 3
1, 8
7, 3
33
Mac
roal
gae
8.8E
+21.
3E+3
5.0E
+22.
9E+0
1.0E
+16.
1E+3
804,
32,
40,
84,
87,
95,
97
Mam
mal
sb1.
9E+4
1.5E
+41.
5E+4
2.0E
+045
239

91
TAB
LE 7
. C
ON
CEN
TRAT
ION
RAT
IO (C
Rw
o-w
ater
) VA
LUES
FO
R W
ILD
LIFE
GR
OU
PS IN
MA
RIN
E EC
OSY
STEM
S (c
ont.)
Wild
life
grou
p(m
arin
e)
CR
wo-
wat
er(B
q/kg
, fre
shw
eigh
t who
le o
rgan
ism
:Bq/
L w
ater
)ID
num
bera
AM
AM
SDG
MG
MSD
Min
imum
Max
imum
N
Mol
lusc
s1.
4E+3
7.4E
+32.
7E+2
6.2E
+01.
1E+1
6.1E
+468
31, 3
2, 4
0, 5
9, 9
5 M
ollu
scs:
biv
alve
1.0E
+31.
9E+3
4.9E
+23.
4E+0
3.0E
+17.
4E+3
1632
, 95
Mol
lusc
s: g
astro
pod
3.6E
+29.
9E+2
1.2E
+24.
3E+0
1.1E
+16.
9E+3
4832
, 40,
95
Phyt
opla
nkto
n4.
8E+5
8.9E
+52.
2E+5
3.4E
+01.
2E+3
2.6E
+636
42, 4
5, 5
1, 5
9 Zo
opla
nkto
n2.
6E+4
3.0E
+41.
7E+4
2.5E
+02.
4E+1
9.1E
+412
51, 5
9, 7
3 Po
(pol
oniu
m)
Ann
elid
s2.
0E+4
1.7E
+42.
3E+4
213
5C
rust
acea
ns4.
7E+4
5.8E
+43.
0E+4
2.6E
+03.
5E+3
2.2E
+520
4, 2
8, 4
6, 5
9, 1
33, 1
35
Cru
stac
eans
: sm
all
5.9E
+45.
1E+4
4.5E
+42.
1E+0
1.0E
+41.
5E+5
1028
, 59,
135
Fi
sh3.
8E+4
1.1E
+51.
2E+4
4.5E
+08.
5E+2
6.9E
+589
4, 2
8, 2
9, 4
6, 5
1 M
acro
alga
e1.
3E+3
2.0E
+37.
1E+2
3.0E
+07.
0E+1
5.0E
+338
4, 2
8, 2
9, 4
6, 9
5, 1
33
Mam
mal
s8.
8E+4
1.2E
+55.
2E+4
2.8E
+08.
0E+3
2.5E
+57
29, 4
6 M
ollu
scs
3.7E
+43.
2E+4
2.8E
+42.
1E+0
1.0E
+31.
7E+5
8328
, 29,
46,
52,
59,
94,
95,
130
, 13
3, 1
35, 1
38
Mol
lusc
s: b
ival
ve4.
4E+4
3.3E
+43.
5E+4
1.9E
+02.
2E+3
1.7E
+562
28, 4
6, 9
4, 9
5, 1
30, 1
33, 1
35, 1
38
Mol
lusc
s: g
astro
pod
1.2E
+49.
1E+3
9.5E
+32.
0E+0
1.7E
+33.
2E+4
1194
, 95
Phyt
opla
nkto
n5.
3E+4
8.2E
+42.
9E+4
3.0E
+02.
8E+3
2.4E
+523
29, 4
2, 5
1, 5
9, 1
34, 3
87
Zoop
lank
ton
6.2E
+47.
9E+4
3.8E
+42.
7E+0
6.0E
+23.
3E+5
4928
, 29,
51,
59,
73,
134

92
TAB
LE 7
. C
ON
CEN
TRAT
ION
RAT
IO (C
Rw
o-w
ater
) VA
LUES
FO
R W
ILD
LIFE
GR
OU
PS IN
MA
RIN
E EC
OSY
STEM
S (c
ont.)
Wild
life
grou
p(m
arin
e)
CR
wo-
wat
er(B
q/kg
, fre
shw
eigh
t who
le o
rgan
ism
:Bq/
L w
ater
)ID
num
bera
AM
AM
SDG
MG
MSD
Min
imum
Max
imum
N
Pu (p
luto
nium
)A
nnel
ids
1.5E
+32.
2E+3
8.4E
+23.
0E+0
1.0E
+24.
1E+3
351
, 104
C
rust
acea
ns1.
2E+2
7.6E
+19.
7E+1
1.8E
+03.
8E+1
2.7E
+214
51, 1
33
Fish
1.5E
+36.
0E+3
3.6E
+25.
4E+0
1.0E
+04.
5E+4
124
20, 2
9, 4
3, 5
1, 5
5, 7
8, 1
06, 1
07,
108,
111
, 120
, 125
, 126
, 145
, 14
6, 3
85, 3
86
Fish
: ben
thic
feed
ing
2.5E
+38.
1E+3
7.3E
+24.
8E+0
2.0E
+02.
7E+4
3451
, 55,
78,
106
, 120
, 125
, 126
, 14
5, 3
86
Fish
: for
age
6.9E
+21.
2E+3
3.4E
+23.
3E+0
2.0E
+24.
8E+3
1455
, 106
, 107
, 126
, 146
, 385
, 386
Fi
sh: p
isci
voro
us1.
9E+2
1.7E
+21.
4E+2
2.2E
+01.
0E+0
5.5E
+219
51, 1
08, 1
11, 1
26, 1
46
Mac
roal
gae
4.1E
+38.
6E+3
1.7E
+33.
7E+0
8.5E
+14.
9E+4
308
43, 5
0, 5
1, 5
5, 6
0, 6
3, 6
4, 6
8, 9
1,
95, 1
00, 1
04, 1
06, 1
07, 1
08,
111,
127
, 133
, 146
, 381
, 385
, 38
6 M
amm
als
1.3E
+31.
4E+3
9.2E
+22.
4E+0
1.0E
+24.
0E+3
2430
, 63,
126
, 128
, 133
M
ollu
scs
1.1E
+31.
4E+3
6.6E
+22.
7E+0
1.8E
+09.
2E+3
169
20, 5
0, 5
1, 5
2, 5
5, 7
8, 9
4, 9
5,
104,
126
, 133
, 142
, 385
M
ollu
scs:
biv
alve
6.5E
+28.
2E+2
4.0E
+22.
7E+0
2.0E
+14.
8E+3
6120
, 51,
55,
94,
95,
104
, 126
, 133
, 38
5 M
ollu
scs:
gas
tropo
d1.
7E+3
1.7E
+31.
2E+3
2.3E
+07.
0E+1
9.2E
+381
20, 5
0, 5
1, 7
8, 9
4, 9
5, 1
04, 1
26,
142
Phyt
opla
nkto
n1.
3E+5
1.5E
+58.
3E+4
2.5E
+04.
0E+2
6.3E
+555
29, 4
1, 5
1, 1
55, 3
87

93
TAB
LE 7
. C
ON
CEN
TRAT
ION
RAT
IO (C
Rw
o-w
ater
) VA
LUES
FO
R W
ILD
LIFE
GR
OU
PS IN
MA
RIN
E EC
OSY
STEM
S (c
ont.)
Wild
life
grou
p(m
arin
e)
CR
wo-
wat
er(B
q/kg
, fre
shw
eigh
t who
le o
rgan
ism
:Bq/
L w
ater
)ID
num
bera
AM
AM
SDG
MG
MSD
Min
imum
Max
imum
N
Sea
anem
ones
/true
cor
als
4.9E
+21
105
Zoop
lank
ton
7.8E
+31.
1E+4
4.5E
+32.
9E+0
2.0E
+32.
8E+4
529
, 51
Ra
(rad
ium
)C
rust
acea
ns8.
6E+1
5.4E
+17.
3E+1
1.8E
+014
96Fi
sh1.
9E+2
4.2E
+27.
5E+1
3.8E
+03.
0E+1
1.9E
+355
29, 7
4, 9
6, 1
21
Fish
: ben
thic
feed
ing
9.4E
+11.
0E+2
6.3E
+12.
4E+0
4.2E
+11.
2E+2
2496
, 121
Fi
sh: p
isci
voro
us3.
3E+2
5.4E
+21.
7E+2
3.1E
+03.
0E+1
1.9E
+321
74, 9
6 M
acro
alga
e9.
0E+1
1.6E
+24.
4E+1
3.3E
+08.
0E–1
1.3E
+28
18, 2
9 M
ollu
scs
6.5E
+16.
3E+1
4.7E
+12.
3E+0
4.0E
+11.
7E+2
203,
96
Mol
lusc
s: b
ival
ve6.
7E+1
6.7E
+14.
7E+1
2.3E
+04.
0E+1
1.7E
+218
3, 9
6 Ph
ytop
lank
ton
1.1E
+31.
1E+4
1.2E
+28.
3E+0
3.0E
+21.
7E+3
729
, 45
Zoop
lank
ton
8.1E
+11.
6E+2
3.6E
+13.
6E+0
4.9E
+01.
0E+2
529
, 51
Ru
(rut
heni
um)
Fish
2.9E
+14.
4E+1
1.6E
+13.
0E+0
5.5E
+01.
0E+2
810
Mac
roal
gae
1.2E
+31.
1E+3
8.8E
+22.
2E+0
1.5E
+23.
9E+3
4810
, 62,
114
M
ollu
scs
1.6E
+31.
3E+3
1.3E
+32.
0E+0
1.0E
+32.
2E+3
910
Phyt
opla
nkto
n6.
7E+3
8.5E
+34.
1E+3
2.7E
+05.
4E+1
1.0E
+43
10, 8
0 Se
a an
emon
es/tr
ue c
oral
s2.
9E+1
1.3E
+14.
4E+1
211

94
TAB
LE 7
. C
ON
CEN
TRAT
ION
RAT
IO (C
Rw
o-w
ater
) VA
LUES
FO
R W
ILD
LIFE
GR
OU
PS IN
MA
RIN
E EC
OSY
STEM
S (c
ont.)
Wild
life
grou
p(m
arin
e)
CR
wo-
wat
er(B
q/kg
, fre
shw
eigh
t who
le o
rgan
ism
:Bq/
L w
ater
)ID
num
bera
AM
AM
SDG
MG
MSD
Min
imum
Max
imum
N
S (s
ulph
ur)
Ann
elid
s1.
8E+0
121
Cru
stac
eans
: lar
gec
2.0E
+07.
2E–1
1.8E
+01.
4E+0
451
4M
acro
alga
eb3.
0E+0
2.3E
+02.
4E+0
2.0E
+01.
5E+0
4.4E
+04
21M
amm
als:
car
nivo
rous
b,c
1.5E
+01.
3E–1
1.5E
+01.
1E+0
1015
4M
ollu
scs
3.2E
+01
21Ph
ytop
lank
ton
9.0E
–12
21Sb
(ant
imon
y)M
acro
alga
e2.
2E+2
4.9E
+29.
4E+1
3.8E
+05.
0E+1
3.0E
+344
10, 6
5, 8
9, 1
47, 1
49
Mol
lusc
s4.
7E+2
8.6E
+22.
2E+2
3.4E
+01.
5E+1
2.4E
+37
10, 1
5, 3
1, 1
47, 1
49
Sea
anem
ones
/true
cor
als
9.0E
+11
120
Zoop
lank
ton
1.3E
+32.
5E+3
6.1E
+23.
5E+0
1.3E
+18.
7E+3
1314
7Se
(sel
eniu
m)
Ann
elid
s4.
5E+3
153
Mac
roal
gae
4.3E
+27.
9E+2
2.0E
+23.
4E+0
2.9E
+24.
7E+3
3665
, 87
Mam
mal
sb8.
3E+3
2.7E
+37.
9E+3
1.4E
+072
039
Mol
lusc
s6.
7E+3
4.6E
+35.
5E+3
1.9E
+01.
3E+3
1.2E
+44
15, 3
1, 5
3 Ph
ytop
lank
ton
3.6E
+31.
3E+4
9.7E
+25.
1E+0
1.1E
+11.
1E+5
9444
, 150
, 151
, 152
, 157
Se
a an
emon
es/tr
ue c
oral
s1.
0E+1
148

95
TAB
LE 7
. C
ON
CEN
TRAT
ION
RAT
IO (C
Rw
o-w
ater
) VA
LUES
FO
R W
ILD
LIFE
GR
OU
PS IN
MA
RIN
E EC
OSY
STEM
S (c
ont.)
Wild
life
grou
p(m
arin
e)
CR
wo-
wat
er(B
q/kg
, fre
shw
eigh
t who
le o
rgan
ism
:Bq/
L w
ater
)ID
num
bera
AM
AM
SDG
MG
MSD
Min
imum
Max
imum
N
Sr (s
tron
tium
)A
nnel
idsb
4.6E
–11
21C
rust
acea
ns4.
9E+1
7.7E
+12.
7E+1
3.0E
+01.
5E–1
2.3E
+236
13, 2
2, 5
1, 8
3, 1
10, 1
20, 1
33,
145,
514
C
rust
acea
ns: l
arge
7.8E
+11.
1E+2
4.5E
+12.
9E+0
1.4E
+02.
3E+2
1551
, 120
, 133
, 145
, 514
C
rust
acea
ns: s
mal
l3.
0E+1
2.8E
+12.
2E+1
2.2E
+01.
5E–1
7.0E
+118
13, 2
2, 5
1, 1
10, 1
20
Fish
2.5E
+13.
9E+1
1.4E
+13.
0E+0
1.5E
–11.
9E+2
118
6, 1
3, 4
3, 4
9, 5
1, 7
6, 8
3, 9
1, 1
10,
111,
120
, 145
, 146
, 385
Fi
sh: b
enth
ic fe
edin
g1.
1E+1
1.3E
+17.
4E+0
2.5E
+03.
0E+0
6.0E
+125
13, 5
1, 9
1, 1
10, 1
45
Fish
: for
age
4.4E
+14.
0E+1
3.3E
+12.
2E+0
1.5E
–11.
4E+2
2513
, 49,
110
, 120
, 146
, 385
Fi
sh: p
isci
voro
us3.
8E+1
5.9E
+12.
0E+1
3.0E
+02.
0E–1
1.9E
+230
91, 1
10, 1
11, 1
20
Mac
roal
gae
2.9E
+15.
4E+1
1.4E
+13.
4E+0
2.0E
–13.
3E+2
385
10, 1
3, 4
3, 5
1, 6
5, 8
2, 8
3, 1
06,
107,
108
, 111
, 118
, 120
, 133
, 14
5, 1
46, 3
81
Mam
mal
s1.
6E+2
3.6E
+26.
8E+1
3.8E
+01.
4E+0
1.0E
+333
1, 4
3, 1
28, 1
33, 1
54
Mol
lusc
s1.
5E+2
1.5E
+21.
1E+2
2.3E
+01.
0E–1
5.0E
+232
13, 5
1, 8
3, 1
20, 1
33
Mol
lusc
s: b
ival
ve8.
8E+1
5.0E
+17.
7E+1
1.7E
+02.
0E–1
1.3E
+212
13, 1
20, 1
33
Mol
lusc
s: g
astro
pod
2.3E
+21.
6E+2
1.9E
+21.
9E+0
1.0E
–13.
9E+2
1213
, 120
Ph
ytop
lank
ton
1.9E
+23.
2E+2
9.6E
+13.
2E+0
4.0E
+01.
6E+3
3019
, 34,
51,
118
, 124
Se
a an
emon
es/tr
ue c
oral
s9.
5E+1
1.0E
+26.
6E+1
2.4E
+01.
0E+0
2.0E
+26
48, 5
1, 1
05, 1
19

96
TAB
LE 7
. C
ON
CEN
TRAT
ION
RAT
IO (C
Rw
o-w
ater
) VA
LUES
FO
R W
ILD
LIFE
GR
OU
PS IN
MA
RIN
E EC
OSY
STEM
S (c
ont.)
Wild
life
grou
p(m
arin
e)
CR
wo-
wat
er(B
q/kg
, fre
shw
eigh
t who
le o
rgan
ism
:Bq/
L w
ater
)ID
num
bera
AM
AM
SDG
MG
MSD
Min
imum
Max
imum
N
Vasc
ular
pla
nts
3.0E
+01
119
Zoop
lank
ton
6.8E
+16.
7E+1
4.8E
+12.
3E+0
1.1E
+11.
5E+2
1913
, 88
Tc (t
echn
etiu
m)
Cru
stac
eans
1.7E
+42.
2E+4
1.1E
+42.
7E+0
5.0E
+19.
1E+4
235
23, 2
4, 2
5, 7
8, 8
1, 1
10, 1
12, 1
29,
133,
136
C
rust
acea
ns: l
arge
1.8E
+42.
2E+4
1.1E
+42.
6E+0
5.0E
+19.
1E+4
226
23, 2
4, 2
5, 7
8, 8
1, 1
10, 1
12, 1
29,
133,
136
M
acro
alga
e5.
3E+4
6.2E
+43.
5E+4
2.5E
+08.
3E+2
4.3E
+517
412
, 23,
38,
66,
78,
89,
109
, 110
, 11
2, 1
33, 3
81
Mol
lusc
s8.
2E+3
9.1E
+35.
5E+3
2.5E
+01.
2E+2
2.0E
+463
23, 2
4, 2
5, 7
8, 1
12, 1
33, 1
36
Mol
lusc
s: b
ival
ve1.
1E+4
1.0E
+47.
7E+3
2.2E
+01.
2E+2
2.0E
+444
23, 2
4, 2
5, 7
8, 1
12, 1
33, 1
36
Mol
lusc
s: g
astro
pod
2.7E
+32.
1E+3
2.1E
+32.
0E+0
1.5E
+23.
1E+3
1925
, 78
Phyt
opla
nkto
n4.
9E+0
5.4E
+03.
3E+0
2.4E
+05.
0E–1
1.7E
+110
51Te
(tel
luri
um)
Phyt
opla
nkto
n1.
3E+4
1.6E
+48.
4E+3
2.6E
+01.
0E+3
4.5E
+412
102
Th
(tho
rium
)Fi
sh1.
3E+3
129
Mac
roal
gae
4.6E
+37.
3E+3
2.4E
+33.
1E+0
2.3E
+22.
0E+4
729
, 64,
100

97
TAB
LE 7
. C
ON
CEN
TRAT
ION
RAT
IO (C
Rw
o-w
ater
) VA
LUES
FO
R W
ILD
LIFE
GR
OU
PS IN
MA
RIN
E EC
OSY
STEM
S (c
ont.)
Wild
life
grou
p(m
arin
e)
CR
wo-
wat
er(B
q/kg
, fre
shw
eigh
t who
le o
rgan
ism
:Bq/
L w
ater
)ID
num
bera
AM
AM
SDG
MG
MSD
Min
imum
Max
imum
N
Mol
lusc
s1.
7E+3
2.6E
+39.
0E+2
3.0E
+09.
0E+1
6.3E
+35
3, 2
9, 5
2 Ph
ytop
lank
ton
7.3E
+57.
6E+5
5.1E
+52.
4E+0
7.5E
+32.
0E+6
2529
, 45
Zoop
lank
ton
7.2E
+37.
5E+3
5.0E
+32.
4E+0
2.0E
+11.
5E+4
629
, 51
U (u
rani
um)
Fish
8.8E
+06.
1E+0
7.3E
+01.
9E+0
2.0E
+01.
8E+1
912
2M
acro
alga
e8.
3E+1
9.9E
+15.
4E+1
2.6E
+02.
1E+1
5.1E
+247
2, 2
9, 6
4, 9
5, 1
00, 3
81
Mol
lusc
s3.
2E+1
3.0E
+12.
4E+1
2.2E
+04.
0E+0
9.7E
+122
3, 9
5 M
ollu
scs:
biv
alve
3.5E
+13.
5E+1
2.5E
+12.
3E+0
4.0E
+09.
7E+1
133,
95
Phyt
opla
nkto
n2.
2E+2
2.3E
+21.
5E+2
2.4E
+01.
0E+1
6.0E
+210
29, 4
5 Se
a an
emon
es/tr
ue c
oral
s9.
9E+2
4.4E
+29.
1E+2
1.5E
+04.
2E+2
1.8E
+338
2, 2
9 Va
scul
ar p
lant
s2.
4E+2
1.7E
+23.
0E+2
22
Zoop
lank
ton
3.7E
+04.
8E+0
2.3E
+02.
7E+0
1.7E
–15.
5E+0
329
, 51
Zn
(zin
c)Fi
sh2.
5E+4
5.5E
+32.
4E+4
1.2E
+01.
9E+4
3.8E
+49
333
Zr
(zir
coni
um)
Cru
stac
eans
4.9E
+12
83Fi
sh8.
5E+1
6.9E
+16.
6E+1
2.0E
+03.
7E+1
2.0E
+25
10, 8
3, 1
23
Mac
roal
gae
1.7E
+32.
5E+3
9.3E
+22.
9E+0
2.3E
+11.
0E+4
4410
, 37,
83,
93,
114
M
ollu
scs
3.3E
+37.
4E+3
1.3E
+33.
8E+0
4.4E
+12.
0E+4
710
, 83
Phyt
opla
nkto
n3.
3E+4
5.4E
+41.
7E+4
3.1E
+01.
1E+4
5.5E
+44
10

98
TAB
LE 7
. C
ON
CEN
TRAT
ION
RAT
IO (C
Rw
o-w
ater
) VA
LUES
FO
R W
ILD
LIFE
GR
OU
PS IN
MA
RIN
E EC
OSY
STEM
S (c
ont.)
Wild
life
grou
p(m
arin
e)
CR
wo-
wat
er(B
q/kg
, fre
shw
eigh
t who
le o
rgan
ism
:Bq/
L w
ater
)ID
num
bera
AM
AM
SDG
MG
MSD
Min
imum
Max
imum
N
Sea
anem
ones
/true
cor
als
1.3E
+21
120
Vasc
ular
pla
nts
1.1E
+31
120
Zoop
lank
ton
2.2E
+42.
5E+4
1.4E
+42.
5E+0
2.0E
+42.
5E+4
310
, 37
Not
e: A
M: a
rithm
etic
mea
n; A
MSD
: arit
hmet
ic m
ean
stan
dard
dev
iatio
n; F
W: f
resh
wei
ght;
GM
: geo
met
ric m
ean;
GM
SD: g
eom
etric
mea
n st
anda
rd
devi
atio
n; ID
: ide
ntifi
catio
n; N
: num
ber o
f dat
a.a
The
publ
icat
ions
cor
resp
ondi
ng to
thes
e ID
num
bers
are
giv
en in
the A
nnex
.b
All
of th
e da
ta fo
r the
wild
life
grou
p ar
e fo
r the
subc
ateg
ory
pres
ente
d.c
Bas
ed o
n a
sing
le g
ener
ic c
once
ntra
tion
for s
ea w
ater
.

99
TAB
LE 8
. C
ON
CEN
TRAT
ION
RAT
IO (C
Rw
o-w
ater
) VA
LUES
FO
R W
ILD
LIFE
GR
OU
PS IN
BR
AC
KIS
H E
CO
SYST
EMS
Wild
life
grou
p(b
rack
ish)
CR
wo-
wat
er(B
q/kg
, fre
sh w
eigh
t who
le o
rgan
ism
:Bq/
L w
ater
)ID
num
bera
AM
AM
SDG
MG
MSD
Min
imum
Max
imum
N
Al (
alum
iniu
m)
Cru
stac
eans
9.2E
+42
506
Fish
1.0E
+22.
1E+2
4.4E
+13.
7E+0
2.8E
+03.
9E+2
1750
6, 5
17
Mac
roal
gae
1.8E
+51.
4E+5
1.4E
+52.
0E+0
1.0E
+52.
6E+5
650
6M
ollu
scs
1.3E
+55.
1E+4
1.2E
+51.
5E+0
6.2E
+41.
7E+5
750
6Ph
ytop
lank
ton
8.0E
+42.
1E+4
7.7E
+41.
3E+0
350
6Va
scul
ar p
lant
s1.
2E+5
1.3E
+57.
7E+4
2.5E
+07.
1E+3
2.2E
+56
506,
517
Zo
opla
nkto
n1.
8E+4
150
6A
m (a
mer
iciu
m)
Fish
3.1E
+23.
4E+2
2.0E
+22.
5E+0
6.5E
+17.
0E+2
357
Mol
lusc
s6.
8E+2
1.0E
+33.
7E+2
3.0E
+05.
0E+2
1.2E
+35
57A
s (ar
seni
c)Fi
sh3.
5E+2
3.8E
+22.
3E+2
2.4E
+05.
0E+1
7.5E
+28
517
Vasc
ular
pla
nts
2.4E
+21.
0E+2
2.2E
+21.
5E+0
351
7B
a (b
ariu
m)
Cru
stac
eans
8.0E
+22
506
Fish
1.2E
+18.
1E+0
9.6E
+01.
9E+0
4.4E
+02.
0E+1
1550
6, 5
17
Mac
roal
gae
1.9E
+31.
1E+3
1.6E
+31.
7E+0
4.6E
+22.
9E+3
950
6, 5
17
Mol
lusc
s4.
8E+2
1.7E
+24.
6E+2
1.4E
+02.
5E+2
5.8E
+27
506

100
TAB
LE 8
. C
ON
CEN
TRAT
ION
RAT
IO (
CR
wo-
wat
er)
VALU
ES F
OR
WIL
DLI
FE G
RO
UPS
IN
BR
AC
KIS
H E
CO
SYST
EMS
(con
t.)
Wild
life
grou
p(b
rack
ish)
CR
wo-
wat
er(B
q/kg
, fre
sh w
eigh
t who
le o
rgan
ism
:Bq/
L w
ater
)ID
num
bera
AM
AM
SDG
MG
MSD
Min
imum
Max
imum
N
Phyt
opla
nkto
n5.
1E+1
8.8E
+05.
0E+1
1.2E
+03
506
Vasc
ular
pla
nts
1.9E
+27.
5E+1
1.7E
+21.
5E+0
1.3E
+22.
4E+2
650
6, 5
17
Zoop
lank
ton
2.4E
+11
506
Br
(bro
min
e)Fi
sh1.
7E–1
8.2E
–21.
5E–1
1.6E
+08.
3E–2
2.4E
–16
506
Mac
roal
gae
2.5E
+01.
2E+0
2.3E
+01.
6E+0
1.3E
+03.
6E+0
750
6, 5
17
Mol
lusc
s1.
4E+0
1.0E
+01.
2E+0
1.9E
+06.
3E–1
2.3E
+04
506
Phyt
opla
nkto
n1.
6E+0
250
6Va
scul
ar p
lant
s2.
0E+0
4.9E
–12.
0E+0
1.3E
+03
517
Zoop
lank
ton
6.6E
+01
506
Ca
(cal
cium
)C
rust
acea
ns4.
4E+1
8.8E
+12.
0E+1
3.6E
+08.
2E–1
2.5E
+214
101,
439
, 506
Fi
sh1.
2E+2
1.2E
+28.
6E+1
2.3E
+02.
6E+1
3.8E
+223
506,
517
M
acro
alga
e7.
5E+0
1.3E
+13.
8E+0
3.2E
+05.
6E–2
5.5E
+171
101,
439
, 506
, 517
Mol
lusc
s2.
5E+2
4.9E
+21.
1E+2
3.5E
+05.
5E–1
1.3E
+334
101,
439
, 506
, 517
Phyt
opla
nkto
n8.
7E–1
5.1E
–28.
7E–1
1.1E
+03
506
Vasc
ular
pla
nts
2.9E
+11.
1E+1
2.6E
+11.
5E+0
2.6E
+13.
1E+1
650
6, 5
17
Zoop
lank
ton
9.1E
+01
506

101
TAB
LE 8
. C
ON
CEN
TRAT
ION
RAT
IO (
CR
wo-
wat
er)
VALU
ES F
OR
WIL
DLI
FE G
RO
UPS
IN
BR
AC
KIS
H E
CO
SYST
EMS
(con
t.)
Wild
life
grou
p(b
rack
ish)
CR
wo-
wat
er(B
q/kg
, fre
sh w
eigh
t who
le o
rgan
ism
:Bq/
L w
ater
)ID
num
bera
AM
AM
SDG
MG
MSD
Min
imum
Max
imum
N
Cd
(cad
miu
m)
Cru
stac
eans
2.2E
+43.
1E+4
1.3E
+42.
8E+0
3.3E
+21.
2E+5
1410
1, 4
39, 5
06
Fish
1.2E
+26.
5E+1
1.0E
+21.
7E+0
8.7E
+11.
8E+2
950
6M
acro
alga
e5.
9E+3
1.4E
+42.
4E+3
3.9E
+07.
0E+1
5.6E
+452
101,
439
, 506
M
ollu
scs
8.8E
+41.
4E+5
4.7E
+43.
1E+0
8.2E
+25.
2E+5
3210
1, 4
39, 5
06
Phyt
opla
nkto
n2.
8E+2
7.6E
+12.
7E+2
1.3E
+03
506
Vasc
ular
pla
nts
5.5E
+31.
4E+3
5.3E
+31.
3E+0
350
6Zo
opla
nkto
n2.
2E+3
150
6C
e (c
eriu
m)
Cru
stac
eans
2.4E
+42.
9E+4
1.6E
+42.
6E+0
4.7E
+29.
5E+4
910
1, 4
39
Mac
roal
gae
3.1E
+44.
4E+4
1.8E
+42.
9E+0
1.1E
+32.
3E+5
4610
1, 4
39
Mol
lusc
s3.
5E+4
4.7E
+42.
1E+4
2.8E
+04.
9E+2
2.1E
+525
101,
439
Va
scul
ar p
lant
s4.
5E+3
9.6E
+31.
9E+3
3.7E
+03
517
Cl (
chlo
rine
)Fi
sh6.
7E–2
2.9E
–26.
2E–2
1.5E
+03.
0E–2
8.7E
–26
506
Mac
roal
gae
1.2E
+04.
3E–1
1.1E
+01.
4E+0
6.8E
–11.
6E+0
750
6, 5
17
Mol
lusc
s2.
8E–1
7.5E
–22.
7E–1
1.3E
+02.
2E–1
3.4E
–14
506
Phyt
opla
nkto
n4.
6E–1
250
6Va
scul
ar p
lant
s1.
4E+0
3.3E
–11.
3E+0
1.3E
+03
517

102
TAB
LE 8
. C
ON
CEN
TRAT
ION
RAT
IO (
CR
wo-
wat
er)
VALU
ES F
OR
WIL
DLI
FE G
RO
UPS
IN
BR
AC
KIS
H E
CO
SYST
EMS
(con
t.)
Wild
life
grou
p(b
rack
ish)
CR
wo-
wat
er(B
q/kg
, fre
sh w
eigh
t who
le o
rgan
ism
:Bq/
L w
ater
)ID
num
bera
AM
AM
SDG
MG
MSD
Min
imum
Max
imum
N
Co
(cob
alt)
Cru
stac
eans
4.0E
+32.
2E+3
3.5E
+31.
7E+0
3.6E
+28.
4E+3
1010
1, 4
39
Fish
1.3E
+11.
0E+1
1.0E
+12.
0E+0
8.0E
+01.
8E+1
851
7M
acro
alga
e8.
4E+3
1.2E
+44.
8E+3
2.9E
+01.
7E+2
6.4E
+446
101,
439
M
ollu
scs
8.1E
+37.
0E+3
6.1E
+32.
1E+0
2.7E
+22.
8E+4
2757
, 101
, 439
Va
scul
ar p
lant
s1.
9E+3
1.6E
+31.
4E+3
2.1E
+03
517
Cr
(chr
omiu
m)
Cru
stac
eans
2.8E
+22
506
Mac
roal
gae
4.4E
+23.
3E+2
3.5E
+22.
0E+0
2.8E
+26.
1E+2
650
6M
ollu
scs
2.0E
+28.
1E+1
1.8E
+21.
5E+0
1.2E
+22.
7E+2
750
6Ph
ytop
lank
ton
2.0E
+25.
6E+1
2.0E
+21.
3E+0
350
6Va
scul
ar p
lant
s7.
3E+2
5.8E
+25.
7E+2
2.0E
+05.
3E+2
9.3E
+26
506,
517
Zo
opla
nkto
n1.
3E+2
150
6C
s (ca
esiu
m)
Ann
elid
s1.
1E+2
170
Bird
s1.
1E+2
9.5E
+18.
6E+1
2.1E
+04.
0E+1
2.5E
+24
70C
rust
acea
ns9.
1E+1
8.3E
+16.
7E+1
2.2E
+01.
5E+1
2.3E
+266
57, 7
0 Fi
sh1.
5E+2
7.4E
+11.
3E+2
1.6E
+06.
7E+1
3.9E
+286
57, 7
0 M
acro
alga
e1.
2E+2
6.0E
+11.
1E+2
1.6E
+06.
2E+1
2.0E
+24
70

103
TAB
LE 8
. C
ON
CEN
TRAT
ION
RAT
IO (
CR
wo-
wat
er)
VALU
ES F
OR
WIL
DLI
FE G
RO
UPS
IN
BR
AC
KIS
H E
CO
SYST
EMS
(con
t.)
Wild
life
grou
p(b
rack
ish)
CR
wo-
wat
er(B
q/kg
, fre
sh w
eigh
t who
le o
rgan
ism
:Bq/
L w
ater
)ID
num
bera
AM
AM
SDG
MG
MSD
Min
imum
Max
imum
N
Mam
mal
s3.
5E+2
4.0E
+22.
3E+2
2.5E
+05.
5E+1
7.9E
+28
69, 7
1 M
ollu
scs
3.5E
+13.
7E+1
2.4E
+12.
4E+0
5.2E
+01.
5E+2
8457
, 70
Phyt
opla
nkto
n2.
7E+2
2.1E
+22.
1E+2
2.0E
+04.
0E+0
7.0E
+238
57, 7
0 Va
scul
ar p
lant
s2.
7E+1
1.4E
+12.
4E+1
1.6E
+01.
0E+1
4.6E
+16
70Zo
opla
nkto
n9.
8E+0
7.6E
+01.
2E+1
270
Cu
(cop
per)
Cru
stac
eans
6.6E
+47.
1E+4
4.5E
+42.
4E+0
1.2E
+42.
9E+5
1410
1, 4
39, 5
06
Fish
3.9E
+22.
8E+2
3.1E
+21.
9E+0
2.3E
+28.
4E+2
1750
6, 5
17
Mac
roal
gae
5.6E
+38.
2E+3
3.2E
+32.
9E+0
3.2E
+24.
5E+4
5210
1, 4
39, 5
06
Mol
lusc
s7.
7E+4
1.8E
+53.
1E+4
3.9E
+06.
8E+2
9.8E
+532
101,
439
, 506
Ph
ytop
lank
ton
6.0E
+21.
5E+2
5.8E
+21.
3E+0
350
6Va
scul
ar p
lant
s1.
1E+3
3.9E
+29.
9E+2
1.4E
+01.
1E+3
1.1E
+36
506,
517
Zo
opla
nkto
n2.
1E+3
150
6D
y (d
yspr
osiu
m)
Cru
stac
eans
5.2E
+34.
9E+3
3.8E
+32.
2E+0
6.0E
+21.
4E+4
810
1, 4
39
Mac
roal
gae
5.2E
+35.
3E+3
3.7E
+32.
3E+0
2.7E
+22.
2E+4
4610
1, 4
39
Mol
lusc
s5.
6E+3
4.7E
+34.
3E+3
2.1E
+02.
4E+2
1.7E
+424
101,
439

104
TAB
LE 8
. C
ON
CEN
TRAT
ION
RAT
IO (
CR
wo-
wat
er)
VALU
ES F
OR
WIL
DLI
FE G
RO
UPS
IN
BR
AC
KIS
H E
CO
SYST
EMS
(con
t.)
Wild
life
grou
p(b
rack
ish)
CR
wo-
wat
er(B
q/kg
, fre
sh w
eigh
t who
le o
rgan
ism
:Bq/
L w
ater
)ID
num
bera
AM
AM
SDG
MG
MSD
Min
imum
Max
imum
N
Er
(erb
ium
)C
rust
acea
ns4.
8E+3
5.5E
+33.
1E+3
2.5E
+05.
4E+2
1.6E
+410
101,
439
M
acro
alga
e5.
3E+3
5.9E
+33.
6E+3
2.4E
+01.
9E+2
3.0E
+446
101,
439
M
ollu
scs
6.5E
+38.
4E+3
4.0E
+32.
7E+0
5.7E
+24.
0E+4
2410
1, 4
39
Eu
(eur
opiu
m)
Cru
stac
eans
2.1E
+43.
1E+4
1.2E
+42.
9E+0
1.8E
+37.
9E+4
910
1, 4
39
Mac
roal
gae
1.3E
+41.
5E+4
8.8E
+32.
5E+0
6.5E
+26.
4E+4
4610
1, 4
39
Mol
lusc
s1.
9E+4
2.2E
+41.
2E+4
2.5E
+01.
1E+3
9.0E
+423
101,
439
Fe
(iro
n)C
rust
acea
ns8.
4E+4
1.0E
+55.
3E+4
2.6E
+03.
6E+3
4.1E
+513
101,
439
, 506
Fi
sh1.
3E+3
4.9E
+21.
2E+3
1.4E
+01.
0E+3
1.5E
+39
506
Mac
roal
gae
2.9E
+57.
4E+5
1.1E
+54.
1E+0
3.2E
+35.
1E+6
5210
1, 4
39, 5
06
Mol
lusc
s4.
3E+5
7.5E
+52.
1E+5
3.3E
+05.
2E+3
3.1E
+632
101,
439
, 506
Ph
ytop
lank
ton
3.2E
+47.
9E+3
3.2E
+41.
3E+0
350
6Va
scul
ar p
lant
s9.
7E+4
2.9E
+49.
3E+4
1.3E
+03
506
Zoop
lank
ton
7.0E
+31
506

105
TAB
LE 8
. C
ON
CEN
TRAT
ION
RAT
IO (
CR
wo-
wat
er)
VALU
ES F
OR
WIL
DLI
FE G
RO
UPS
IN
BR
AC
KIS
H E
CO
SYST
EMS
(con
t.)
Wild
life
grou
p(b
rack
ish)
CR
wo-
wat
er(B
q/kg
, fre
sh w
eigh
t who
le o
rgan
ism
:Bq/
L w
ater
)ID
num
bera
AM
AM
SDG
MG
MSD
Min
imum
Max
imum
N
Gd
(gad
olin
ium
)C
rust
acea
ns5.
9E+3
5.9E
+34.
2E+3
2.3E
+04.
0E+2
1.7E
+49
101,
439
M
acro
alga
e7.
0E+3
7.3E
+34.
8E+3
2.4E
+03.
9E+2
3.4E
+446
101,
439
M
ollu
scs
8.2E
+37.
7E+3
6.0E
+32.
2E+0
3.3E
+22.
8E+4
2510
1, 4
39
Ho
(hol
miu
m)
Cru
stac
eans
1.4E
+41.
8E+4
8.6E
+32.
7E+0
1.1E
+34.
1E+4
710
1, 4
39
Mac
roal
gae
6.9E
+37.
0E+3
4.9E
+32.
3E+0
2.1E
+22.
7E+4
4610
1, 4
39
Mol
lusc
s1.
3E+4
2.3E
+46.
3E+3
3.3E
+02.
9E+2
1.1E
+523
101,
439
I (
iodi
ne)
Fish
1.0E
+15.
0E+0
9.1E
+01.
6E+0
7.0E
+01.
3E+1
750
6, 5
17
Mac
roal
gae
1.2E
+31.
0E+3
9.2E
+22.
1E+0
1.7E
+22.
1E+3
750
6, 5
17
Mol
lusc
s6.
7E+1
5.4E
+15.
3E+1
2.0E
+02.
2E+1
1.1E
+24
506
Phyt
opla
nkto
n1.
3E+1
250
6Va
scul
ar p
lant
s1.
5E+2
1.2E
+21.
2E+2
2.0E
+03
517
Zoop
lank
ton
2.5E
+11
506
La
(lant
hanu
m)
Cru
stac
eans
6.5E
+37.
3E+3
4.3E
+32.
5E+0
2.9E
+22.
7E+4
1210
1, 4
39
Fish
5.3E
+01.
1E+1
2.3E
+03.
6E+0
351
7

106
TAB
LE 8
. C
ON
CEN
TRAT
ION
RAT
IO (
CR
wo-
wat
er)
VALU
ES F
OR
WIL
DLI
FE G
RO
UPS
IN
BR
AC
KIS
H E
CO
SYST
EMS
(con
t.)
Wild
life
grou
p(b
rack
ish)
CR
wo-
wat
er(B
q/kg
, fre
sh w
eigh
t who
le o
rgan
ism
:Bq/
L w
ater
)ID
num
bera
AM
AM
SDG
MG
MSD
Min
imum
Max
imum
N
Mac
roal
gae
1.0E
+41.
5E+4
5.9E
+32.
9E+0
6.5E
+27.
9E+4
4610
1, 4
39
Mol
lusc
s1.
4E+4
1.6E
+48.
8E+3
2.5E
+04.
7E+2
6.3E
+425
101,
439
Va
scul
ar p
lant
s4.
1E+3
7.9E
+31.
9E+3
3.5E
+03
517
Li (
lithi
um)
Cru
stac
eans
9.2E
+02
506
Fish
1.6E
+06.
1E–1
1.5E
+01.
4E+0
9.4E
–12.
2E+0
950
6M
acro
alga
e1.
1E+1
7.5E
+09.
0E+0
1.9E
+02.
7E+0
1.9E
+19
506,
517
M
ollu
scs
5.2E
+08.
5E–1
5.1E
+01.
2E+0
4.4E
+05.
7E+0
750
6Ph
ytop
lank
ton
6.6E
+01.
6E+0
6.4E
+01.
3E+0
350
6Va
scul
ar p
lant
s1.
2E+1
4.2E
+01.
1E+1
1.4E
+08.
4E+0
1.5E
+16
506,
517
Zo
opla
nkto
n3.
0E+0
150
6L
u (lu
tetiu
m)
Cru
stac
eans
3.0E
+43.
8E+4
1.8E
+42.
7E+0
9.0E
+28.
8E+4
610
1, 4
39
Mac
roal
gae
9.1E
+31.
0E+4
6.1E
+32.
5E+0
1.4E
+24.
3E+4
4610
1, 4
39
Mol
lusc
s2.
1E+4
3.8E
+41.
0E+4
3.3E
+06.
1E+2
1.6E
+520
101,
439
M
g (m
agne
sium
)C
rust
acea
ns1.
3E+0
2.3E
+06.
5E–1
3.2E
+01.
7E–1
6.6E
+014
101,
439
, 506
Fi
sh2.
1E+0
9.6E
–11.
9E+0
1.6E
+08.
1E–1
3.3E
+023
506,
517

107
TAB
LE 8
. C
ON
CEN
TRAT
ION
RAT
IO (
CR
wo-
wat
er)
VALU
ES F
OR
WIL
DLI
FE G
RO
UPS
IN
BR
AC
KIS
H E
CO
SYST
EMS
(con
t.)
Wild
life
grou
p(b
rack
ish)
CR
wo-
wat
er(B
q/kg
, fre
sh w
eigh
t who
le o
rgan
ism
:Bq/
L w
ater
)ID
num
bera
AM
AM
SDG
MG
MSD
Min
imum
Max
imum
N
Mac
roal
gae
2.5E
+03.
8E+0
1.4E
+03.
0E+0
1.4E
–11.
4E+1
5510
1, 4
39, 5
06, 5
17M
ollu
scs
7.0E
–14.
0E–1
6.1E
–11.
7E+0
2.9E
–12.
1E+0
3410
1, 4
39, 5
06, 5
17Ph
ytop
lank
ton
8.3E
–12.
5E–2
8.3E
–11.
0E+0
350
6Va
scul
ar p
lant
s7.
6E+0
3.4E
+07.
0E+0
1.5E
+05.
1E+0
1.0E
+16
506,
517
Zo
opla
nkto
n1.
2E+0
150
6M
n (m
anga
nese
)C
rust
acea
ns2.
6E+3
2.6E
+31.
8E+3
2.3E
+07.
5E+1
7.0E
+314
101,
439
, 506
Fi
sh4.
1E+2
1.7E
+23.
7E+2
1.5E
+03.
6E+2
4.9E
+29
506
Mac
roal
gae
5.0E
+41.
6E+5
1.5E
+44.
7E+0
1.7E
+21.
1E+6
5210
1, 4
39, 5
06
Mol
lusc
s1.
0E+4
1.5E
+45.
7E+3
3.0E
+02.
1E+2
5.2E
+432
101,
439
, 506
Ph
ytop
lank
ton
4.6E
+37.
1E+2
4.5E
+31.
2E+0
350
6Va
scul
ar p
lant
s4.
2E+4
1.5E
+44.
0E+4
1.4E
+03
506
Zoop
lank
ton
7.0E
+21
506
Mo
(mol
ybde
num
)C
rust
acea
ns1.
8E+1
1.6E
+11.
3E+1
2.1E
+04.
3E+0
6.1E
+113
101,
439
, 506
Fi
sh1.
7E+0
5.8E
–11.
6E+0
1.4E
+01.
3E+0
2.4E
+023
506,
517
M
acro
alga
e1.
8E+1
1.4E
+11.
4E+1
2.0E
+01.
4E+0
4.8E
+155
101,
439
, 506
, 517
Mol
lusc
s5.
2E+1
4.9E
+13.
8E+1
2.2E
+09.
1E+0
1.8E
+234
101,
439
, 506
, 517
Phyt
opla
nkto
n4.
1E+0
3.1E
–14.
1E+0
1.1E
+03
506

108
TAB
LE 8
. C
ON
CEN
TRAT
ION
RAT
IO (
CR
wo-
wat
er)
VALU
ES F
OR
WIL
DLI
FE G
RO
UPS
IN
BR
AC
KIS
H E
CO
SYST
EMS
(con
t.)
Wild
life
grou
p(b
rack
ish)
CR
wo-
wat
er(B
q/kg
, fre
sh w
eigh
t who
le o
rgan
ism
:Bq/
L w
ater
)ID
num
bera
AM
AM
SDG
MG
MSD
Min
imum
Max
imum
N
Vasc
ular
pla
nts
8.5E
+12.
2E+1
8.3E
+11.
3E+0
8.5E
+18.
5E+1
650
6, 5
17
Zoop
lank
ton
1.3E
+11
506
Na
(sod
ium
)C
rust
acea
ns5.
0E–1
4.5E
–13.
7E–1
2.2E
+01.
9E–1
1.5E
+014
101,
439
, 506
Fi
sh4.
0E–1
1.2E
–13.
8E–1
1.4E
+01.
8E–1
5.2E
–123
506,
517
M
acro
alga
e5.
8E–1
8.8E
–13.
2E–1
3.0E
+08.
3E–3
2.8E
+039
101,
506
, 517
M
ollu
scs
5.0E
–14.
0E–1
3.9E
–12.
0E+0
1.1E
–11.
5E+0
3410
1, 4
39, 5
06, 5
17Ph
ytop
lank
ton
6.6E
–13.
4E–2
6.6E
–11.
1E+0
350
6Va
scul
ar p
lant
s1.
8E+0
5.3E
–11.
8E+0
1.3E
+01.
6E+0
2.1E
+06
506,
517
Zo
opla
nkto
n1.
1E+0
150
6N
d (n
eody
miu
m)
Cru
stac
eans
5.3E
+35.
9E+3
3.6E
+32.
5E+0
2.2E
+22.
0E+4
1410
1, 4
39, 5
06
Mac
roal
gae
8.9E
+31.
2E+4
5.1E
+32.
8E+0
1.0E
+26.
6E+4
5210
1, 4
39, 5
06
Mol
lusc
s9.
7E+3
1.1E
+46.
3E+3
2.5E
+03.
3E+2
5.1E
+432
101,
439
, 506
Ph
ytop
lank
ton
6.8E
+02.
1E+0
6.5E
+01.
4E+0
350
6Va
scul
ar p
lant
s3.
0E+2
1.6E
+22.
6E+2
1.7E
+03
506
Zoop
lank
ton
1.2E
+31
506

109
TAB
LE 8
. C
ON
CEN
TRAT
ION
RAT
IO (
CR
wo-
wat
er)
VALU
ES F
OR
WIL
DLI
FE G
RO
UPS
IN
BR
AC
KIS
H E
CO
SYST
EMS
(con
t.)
Wild
life
grou
p(b
rack
ish)
CR
wo-
wat
er(B
q/kg
, fre
sh w
eigh
t who
le o
rgan
ism
:Bq/
L w
ater
)ID
num
bera
AM
AM
SDG
MG
MSD
Min
imum
Max
imum
N
Ni (
nick
el)
Cru
stac
eans
1.0E
+37.
1E+2
8.7E
+21.
9E+0
2.8E
+22.
4E+3
1410
1, 4
39, 5
06
Fish
1.1E
+18.
1E+0
8.7E
+01.
9E+0
8.1E
–11.
7E+1
1150
6, 5
17
Mac
roal
gae
2.7E
+33.
1E+3
1.7E
+32.
5E+0
2.7E
+21.
5E+4
5510
1, 4
39, 5
06, 5
17M
ollu
scs
2.5E
+33.
1E+3
1.6E
+32.
6E+0
1.8E
+21.
5E+4
3410
1, 4
39, 5
06, 5
17Ph
ytop
lank
ton
1.3E
+24.
5E+1
1.3E
+21.
4E+0
350
6Va
scul
ar p
lant
s6.
5E+2
3.3E
+25.
8E+2
1.6E
+04.
7E+2
8.3E
+26
506,
517
Zo
opla
nkto
n1.
1E+2
150
6P
(pho
spho
rous
)C
rust
acea
ns1.
5E+5
8.6E
+41.
3E+5
1.7E
+07.
9E+4
2.3E
+54
506
Fish
3.4E
+52.
9E+5
2.5E
+52.
1E+0
7.6E
+31.
0E+6
3250
6, 5
17
Mac
roal
gae
3.3E
+41.
4E+4
3.1E
+41.
5E+0
1.3E
+45.
2E+4
1550
6, 5
17
Mol
lusc
s5.
0E+4
4.7E
+43.
7E+4
2.2E
+01.
1E+4
1.2E
+514
506
Phyt
opla
nkto
n6.
7E+3
2.4E
+36.
3E+3
1.4E
+04.
9E+3
8.5E
+36
506
Vasc
ular
pla
nts
2.7E
+42.
5E+4
2.0E
+42.
2E+0
2.2E
+25.
6E+4
950
6, 5
17
Zoop
lank
ton
5.3E
+41.
4E+4
9.2E
+42
506
Pb (l
ead)
Bird
s1.
9E+2
138
3C
rust
acea
ns9.
6E+2
1.1E
+36.
5E+2
2.4E
+07.
6E+1
3.6E
+315
101,
383
, 439
, 506

110
TAB
LE 8
. C
ON
CEN
TRAT
ION
RAT
IO (
CR
wo-
wat
er)
VALU
ES F
OR
WIL
DLI
FE G
RO
UPS
IN
BR
AC
KIS
H E
CO
SYST
EMS
(con
t.)
Wild
life
grou
p(b
rack
ish)
CR
wo-
wat
er(B
q/kg
, fre
sh w
eigh
t who
le o
rgan
ism
:Bq/
L w
ater
)ID
num
bera
AM
AM
SDG
MG
MSD
Min
imum
Max
imum
N
Fish
1.3E
+12.
4E+1
6.3E
+03.
4E+0
4.1E
+08.
4E+1
1138
3, 5
06
Mac
roal
gae
4.9E
+37.
4E+3
2.7E
+33.
0E+0
9.1E
+13.
6E+4
5210
1, 4
39, 5
06
Mol
lusc
s3.
5E+3
4.7E
+32.
0E+3
2.8E
+03.
9E+1
2.2E
+432
101,
439
, 506
Ph
ytop
lank
ton
1.2E
+21.
2E+2
8.9E
+12.
3E+0
350
6Va
scul
ar p
lant
s1.
8E+2
1.8E
+21.
3E+2
2.3E
+03
506
Zoop
lank
ton
7.9E
+11
506
Po (p
olon
ium
)Fi
sh3.
0E+3
6.7E
+25.
3E+3
238
3M
amm
als
1.0E
+42
69Pr
(pra
seod
ymiu
m)
Cru
stac
eans
1.0E
+49.
3E+3
7.8E
+32.
1E+0
7.8E
+22.
6E+4
1010
1, 4
39
Mac
roal
gae
1.2E
+41.
5E+4
7.3E
+32.
6E+0
6.1E
+27.
5E+4
4610
1, 4
39
Mol
lusc
s1.
4E+4
1.4E
+41.
0E+4
2.2E
+03.
7E+2
5.8E
+425
101,
439
Pu
(plu
toni
um)
Cru
stac
eans
5.4E
+31.
0E+4
2.5E
+33.
5E+0
3.5E
+39.
0E+3
1157
Fish
2.6E
+24.
5E+2
1.3E
+23.
3E+0
4.3E
+11.
4E+3
857
Mol
lusc
s1.
4E+3
1.0E
+31.
1E+3
1.9E
+08.
0E+2
2.5E
+33
57

111
TAB
LE 8
. C
ON
CEN
TRAT
ION
RAT
IO (
CR
wo-
wat
er)
VALU
ES F
OR
WIL
DLI
FE G
RO
UPS
IN
BR
AC
KIS
H E
CO
SYST
EMS
(con
t.)
Wild
life
grou
p(b
rack
ish)
CR
wo-
wat
er(B
q/kg
, fre
sh w
eigh
t who
le o
rgan
ism
:Bq/
L w
ater
)ID
num
bera
AM
AM
SDG
MG
MSD
Min
imum
Max
imum
N
Rb
(rub
idiu
m)
Cru
stac
eans
1.1E
+19.
1E+0
8.9E
+02.
0E+0
5.1E
+03.
2E+1
1410
1, 4
39, 5
06
Fish
6.8E
+13.
4E+1
6.1E
+11.
6E+0
2.9E
+11.
2E+2
2050
6, 5
17
Mac
roal
gae
3.1E
+14.
1E+1
1.9E
+12.
7E+0
1.5E
+01.
4E+2
5510
1, 4
39, 5
06, 5
17M
ollu
scs
1.2E
+17.
4E+0
1.0E
+11.
8E+0
5.1E
+03.
0E+1
3410
1, 4
39, 5
06, 5
17Ph
ytop
lank
ton
1.4E
+12.
8E+0
1.4E
+11.
2E+0
350
6Va
scul
ar p
lant
s4.
5E+1
1.8E
+14.
2E+1
1.5E
+03.
1E+1
5.9E
+16
506,
517
Zo
opla
nkto
n1.
8E+1
150
6S
(sul
phur
)C
rust
acea
ns1.
1E+1
250
6Fi
sh9.
3E+0
2.4E
+09.
1E+0
1.3E
+06.
5E+0
1.2E
+19
506
Mac
roal
gae
2.7E
+12.
3E+1
2.1E
+12.
1E+0
6.5E
+04.
8E+1
650
6M
ollu
scs
2.8E
+01.
3E+0
2.6E
+01.
6E+0
1.3E
+03.
8E+0
750
6Ph
ytop
lank
ton
1.1E
+03.
3E–2
1.1E
+01.
0E+0
350
6Va
scul
ar p
lant
s6.
5E+0
1.1E
+06.
4E+0
1.2E
+03
506
Zoop
lank
ton
2.9E
+01
506
Sb (a
ntim
ony)
Mol
lusc
s1.
6E+2
157

112
TAB
LE 8
. C
ON
CEN
TRAT
ION
RAT
IO (
CR
wo-
wat
er)
VALU
ES F
OR
WIL
DLI
FE G
RO
UPS
IN
BR
AC
KIS
H E
CO
SYST
EMS
(con
t.)
Wild
life
grou
p(b
rack
ish)
CR
wo-
wat
er(B
q/kg
, fre
sh w
eigh
t who
le o
rgan
ism
:Bq/
L w
ater
)ID
num
bera
AM
AM
SDG
MG
MSD
Min
imum
Max
imum
N
Se (s
elen
ium
)Fi
sh2.
3E+3
2.9E
+22.
3E+3
1.1E
+02.
0E+3
2.5E
+38
517
Vasc
ular
pla
nts
4.2E
+21.
0E+2
4.0E
+21.
3E+0
351
7Si
(sili
con)
Cru
stac
eans
2.5E
+32
506
Fish
8.6E
+11.
3E+2
4.7E
+13.
0E+0
1.7E
+11.
5E+2
950
6M
acro
alga
e5.
9E+3
6.3E
+34.
0E+3
2.4E
+07.
5E+2
1.4E
+49
506,
517
M
ollu
scs
1.7E
+38.
0E+2
1.5E
+31.
6E+0
7.8E
+22.
6E+3
750
6Ph
ytop
lank
ton
7.4E
+38.
3E+2
7.4E
+31.
1E+0
350
6Va
scul
ar p
lant
s1.
1E+4
2.0E
+31.
1E+4
1.2E
+03
506
Zoop
lank
ton
2.1E
+31
506
Sm (s
amar
ium
)C
rust
acea
ns9.
8E+3
1.0E
+46.
8E+3
2.3E
+06.
2E+2
2.8E
+49
101,
439
M
acro
alga
e1.
0E+4
1.2E
+46.
5E+3
2.5E
+04.
9E+2
5.7E
+446
101,
439
M
ollu
scs
1.2E
+41.
1E+4
9.1E
+32.
2E+0
1.2E
+34.
0E+4
2410
1, 4
39
Sr (s
tron
tium
)C
rust
acea
ns1.
7E+2
2.3E
+21.
0E+2
2.8E
+01.
1E–1
4.7E
+238
57, 1
01, 4
39
Fish
1.9E
+13.
5E+1
9.2E
+03.
4E+0
1.1E
+01.
2E+2
4257
, 517

113
TAB
LE 8
. C
ON
CEN
TRAT
ION
RAT
IO (
CR
wo-
wat
er)
VALU
ES F
OR
WIL
DLI
FE G
RO
UPS
IN
BR
AC
KIS
H E
CO
SYST
EMS
(con
t.)
Wild
life
grou
p(b
rack
ish)
CR
wo-
wat
er(B
q/kg
, fre
sh w
eigh
t who
le o
rgan
ism
:Bq/
L w
ater
)ID
num
bera
AM
AM
SDG
MG
MSD
Min
imum
Max
imum
N
Mac
roal
gae
2.1E
+14.
6E+1
8.4E
+03.
8E+0
9.3E
–21.
9E+2
4910
1, 4
39, 5
17
Mol
lusc
s1.
8E+2
2.1E
+21.
1E+2
2.5E
+07.
9E–2
6.5E
+260
57, 1
01, 4
39, 5
17Ph
ytop
lank
ton
1.7E
+11.
1E+1
1.4E
+11.
8E+0
7.1E
+02.
9E+1
357
Vasc
ular
pla
nts
2.4E
+15.
9E+0
2.4E
+11.
3E+0
351
7T
b (t
erbi
um)
Cru
stac
eans
2.9E
+44.
0E+4
1.7E
+42.
8E+0
1.6E
+39.
0E+4
710
1, 4
39
Mac
roal
gae
1.1E
+41.
3E+4
7.2E
+32.
6E+0
3.4E
+25.
2E+4
4610
1, 4
39
Mol
lusc
s2.
2E+4
3.4E
+41.
2E+4
3.1E
+07.
3E+2
1.3E
+522
101,
439
Ti
(tita
nium
)C
rust
acea
ns8.
0E+4
250
6Fi
sh1.
9E+3
1.9E
+31.
4E+3
2.3E
+08.
5E+2
3.8E
+39
506
Mac
roal
gae
1.6E
+51.
3E+5
1.3E
+52.
1E+0
9.3E
+42.
3E+5
650
6M
ollu
scs
8.3E
+44.
1E+4
7.4E
+41.
6E+0
4.5E
+41.
1E+5
750
6Ph
ytop
lank
ton
6.8E
+42.
8E+4
6.3E
+41.
5E+0
350
6Va
scul
ar p
lant
s1.
9E+5
8.4E
+41.
7E+5
1.5E
+03
506
Zoop
lank
ton
1.6E
+41
506

114
TAB
LE 8
. C
ON
CEN
TRAT
ION
RAT
IO (
CR
wo-
wat
er)
VALU
ES F
OR
WIL
DLI
FE G
RO
UPS
IN
BR
AC
KIS
H E
CO
SYST
EMS
(con
t.)
Wild
life
grou
p(b
rack
ish)
CR
wo-
wat
er(B
q/kg
, fre
sh w
eigh
t who
le o
rgan
ism
:Bq/
L w
ater
)ID
num
bera
AM
AM
SDG
MG
MSD
Min
imum
Max
imum
N
Tm
(thu
lium
)C
rust
acea
ns3.
5E+4
4.4E
+42.
1E+4
2.7E
+02.
0E+3
9.7E
+46
101,
439
M
acro
alga
e1.
0E+4
1.2E
+46.
5E+3
2.6E
+01.
6E+2
5.1E
+446
101,
439
M
ollu
scs
2.9E
+45.
9E+4
1.3E
+43.
6E+0
5.2E
+22.
5E+5
1910
1, 4
39
U (u
rani
um)
Cru
stac
eans
3.5E
+02.
3E+0
3.0E
+01.
8E+0
8.3E
–17.
6E+0
910
1, 4
39
Fish
4.6E
–11.
7E–1
4.4E
–11.
4E+0
4.0E
–15.
6E–1
951
7M
acro
alga
e3.
9E+1
7.8E
+11.
7E+1
3.6E
+08.
6E–1
3.3E
+249
101,
439
, 517
M
ollu
scs
2.6E
+12.
5E+1
1.9E
+12.
2E+0
3.7E
+09.
1E+1
2710
1, 4
39, 5
17
Vasc
ular
pla
nts
1.4E
+24.
6E+1
1.3E
+21.
4E+0
351
7V
(van
adiu
m)
Cru
stac
eans
3.9E
+25.
7E+2
2.2E
+22.
9E+0
9.6E
+01.
6E+3
1310
1, 4
39, 5
06
Fish
1.2E
+21.
9E+2
5.9E
+13.
2E+0
1.6E
+12.
9E+2
950
6M
acro
alga
e9.
3E+2
1.3E
+35.
4E+2
2.8E
+07.
6E+1
4.5E
+355
101,
439
, 506
, 517
Mol
lusc
s6.
7E+2
6.5E
+24.
8E+2
2.2E
+01.
1E+1
2.1E
+334
101,
439
, 506
, 517
Phyt
opla
nkto
n1.
1E+3
2.8E
+21.
1E+3
1.3E
+03
506
Vasc
ular
pla
nts
3.0E
+31.
6E+3
2.6E
+31.
7E+0
1.9E
+34.
0E+3
650
6, 5
17
Zoop
lank
ton
2.5E
+21
506

115
TAB
LE 8
. C
ON
CEN
TRAT
ION
RAT
IO (
CR
wo-
wat
er)
VALU
ES F
OR
WIL
DLI
FE G
RO
UPS
IN
BR
AC
KIS
H E
CO
SYST
EMS
(con
t.)
Wild
life
grou
p(b
rack
ish)
CR
wo-
wat
er(B
q/kg
, fre
sh w
eigh
t who
le o
rgan
ism
:Bq/
L w
ater
)ID
num
bera
AM
AM
SDG
MG
MSD
Min
imum
Max
imum
N
Y (y
ttri
um)
Cru
stac
eans
1.5E
+31.
0E+3
1.2E
+31.
8E+0
2.7E
+23.
1E+3
910
1, 4
39
Fish
1.1E
+02
517
Mac
roal
gae
2.7E
+32.
7E+3
1.9E
+32.
3E+0
1.3E
+21.
2E+4
4610
1, 4
39M
ollu
scs
2.6E
+32.
4E+3
1.9E
+32.
2E+0
1.1E
+29.
7E+3
2510
1, 4
39
Vasc
ular
pla
nts
2.8E
+34.
8E+3
1.5E
+33.
2E+0
351
7
Yb
(ytt
erbi
um)
Cru
stac
eans
5.5E
+36.
5E+3
3.5E
+32.
6E+0
1.1E
+31.
9E+4
910
1, 4
39
Mac
roal
gae
4.7E
+35.
0E+3
3.2E
+32.
4E+0
1.7E
+22.
3E+4
4610
1, 4
39
Mol
lusc
s6.
4E+3
8.4E
+33.
8E+3
2.7E
+02.
4E+2
4.0E
+425
101,
439
Z
n (z
inc)
Cru
stac
eans
6.5E
+32
506
Fish
6.5E
+35.
0E+3
5.1E
+32.
0E+0
1.6E
+31.
0E+4
1750
6, 5
17
Mac
roal
gae
1.8E
+41.
8E+4
1.3E
+42.
3E+0
2.7E
+33.
3E+4
650
6M
ollu
scs
5.3E
+34.
0E+3
4.2E
+32.
0E+0
1.5E
+38.
9E+3
750
6
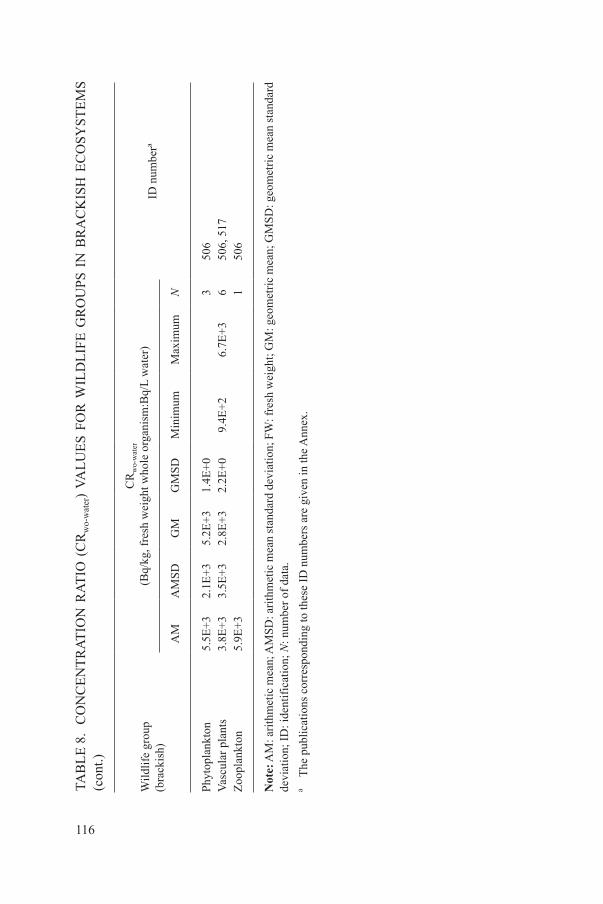
116
TAB
LE 8
. C
ON
CEN
TRAT
ION
RAT
IO (
CR
wo-
wat
er)
VALU
ES F
OR
WIL
DLI
FE G
RO
UPS
IN
BR
AC
KIS
H E
CO
SYST
EMS
(con
t.)
Wild
life
grou
p(b
rack
ish)
CR
wo-
wat
er(B
q/kg
, fre
sh w
eigh
t who
le o
rgan
ism
:Bq/
L w
ater
)ID
num
bera
AM
AM
SDG
MG
MSD
Min
imum
Max
imum
N
Phyt
opla
nkto
n5.
5E+3
2.1E
+35.
2E+3
1.4E
+03
506
Vasc
ular
pla
nts
3.8E
+33.
5E+3
2.8E
+32.
2E+0
9.4E
+26.
7E+3
650
6, 5
17
Zoop
lank
ton
5.9E
+31
506
Not
e: A
M: a
rithm
etic
mea
n; A
MSD
: arit
hmet
ic m
ean
stan
dard
dev
iatio
n; F
W: f
resh
wei
ght;
GM
: geo
met
ric m
ean;
GM
SD: g
eom
etric
mea
n st
anda
rd
devi
atio
n; ID
: ide
ntifi
catio
n; N
: num
ber o
f dat
a.a
The
publ
icat
ions
cor
resp
ondi
ng to
thes
e ID
num
bers
are
giv
en in
the A
nnex
.

117
4.2. APPLICATION OF THE CRwo-media VALUES
The CRwo-media values can be used to calculate the whole organism radionuclide activity concentration of wildlife in environmental risk assessments in three ways depending on the requirements of the assessment:
(a) Generic average value using either the geometric mean or arithmetic mean;(b) Conservative estimate using either the maximum value or the standard
deviation to derive an upper percentile (e.g. 95th percentile);(c) Probabilistic assessment using the mean and associated standard deviation.
The use of the generic average CRwo-media value does not account for uncertainties in the estimation of radionuclide activity concentrations in the whole organism in contrast to both the conservative and probabilistic approaches. The conservative approach, often used within screening assessments [84], aims to provide an upper estimate of radionuclide activity concentration and should be an overestimate for a population. In some approaches [24, 35], a conservative CRwo-media value may be applied together with other conservative assumptions (e.g. of media radionuclide activity concentration, exposure pathway). The maximum (and minimum) values presented in the CRwo-media tables are often the maximum mean value from any individual study entered into the database and not the maximum individual measurement. Consequently, if the user were to estimate, for example, a 95th percentile from the arithmetic mean and standard deviation values presented here, the resultant estimated 95th percentile value may be greater than the maximum value that appears in Tables 5–8.
To estimate the uncertainty within the end-points of an exposure assessment, the uncertainties in the inputs and parameters must be propagated through the model, often using a probabilistic approach such as Monte Carlo analysis [85]. In the Monte Carlo method, point estimates in a model equation are replaced with probability distributions, samples are taken from each distribution, and the results aggregated, usually in the form of a probability density function or cumulative distribution. For much radioecological data, including the CRwo-media values presented here, the most appropriate probability density function is log-normal. Where the number of data used to derive a CRwo-media value is low, then the assumption of a log-normal probability density function may be inappropriate and other distributions, such as exponential, might be more relevant. The most defensible approach to selecting distributions is one in which all available information (subjective and objective) is examined [86]. In undertaking such evaluations, it is necessary to consider whether there are sufficient data to conduct a probabilistic analysis or more data should be obtained. A sensitivity analysis may help to determine whether additional data are needed.

118
Suitable radionuclide activity concentrations in media are required when applying the CRwo-media values to estimate those in the whole body of organisms. Deriving such suitable media concentrations for use within an assessment requires consideration of spatial and temporal averaging which will depend on the aims of the assessment. For conservative assessments, the maximum activity concentrations of a radionuclide in media close to the facility or habitat of the wildlife group (or species) under assessment may be used. For more realistic assessments, the area over which radionuclide activity concentrations in media are averaged should reflect the home range of the wildlife group (or species) considered. Similarly, it may be reasonable to assume that an organism is present in a contaminated area for 100% of its time in a conservative assessment, whereas in a more realistic assessment the length of time the organism is likely to be present in the contaminated area (occupancy) will be taken into account. Appropriate temporal averaging of radionuclide activity concentrations in media may be required when considering facilities making pulsed discharges. Estimation (and applications) of CRwo-media values for migratory species (e.g. some species of birds or salmonids) is particularly difficult because whole organism concentrations may not reflect media concentrations in the area in which the animals were sampled. The lack of equilibrium between concentrations in the whole organism and the surrounding media will depend on the biological half-life and the duration of occupancy. It is, therefore, necessary to use caution when applying CRwo-media values to migratory species. As the values presented in Section 4 are intended to reflect equilibrium conditions, their application to migratory species is likely to be conservative.
The CRwo-media values presented in this handbook are intended for application when site specific data are not available. However, site specific data based on few measurements may not provide a better estimate of radionuclide activity concentrations in the whole organism than that provided by a generic CRwo-media value as provided in the tables below (see Ref. [87] for a discussion). It will be necessary to take this issue into account when deciding upon inputs to assessments. However, where site specific data are available, it is useful to compare them with estimates using the CRwo-media values presented here. The effort used in assessments should be commensurate with the risks and some assessments may require a better site specific understanding and prediction of radionuclide transfer [23].
4.3. LIMITATIONS OF THE EXISTING DATABASE
The data included for many organisms were predominantly from Europe, Japan, North America and Australasia, and originate in temperate or arctic

119
ecosystems. This is because the need for radioecological information has been linked to nuclear power industries (as well as other nuclear facilities) which tend to be focused in Europe, Japan and North America. Little analysis is available of the applicability of transfer values from these regions to other areas of the world. It is, therefore, not possible to comment on whether the CRwo-media values are appropriate for wildlife groups and ecosystems in other areas of the world.
There are many data for the transfer of some radionuclides (e.g. caesium and strontium isotopes) and few, if any, for others (e.g. technetium). The considerable variation in availability of data needs to be borne in mind when applying the CRwo-media values in assessments. Some of the CRwo-media values are based on few data (345 of 946 CRwo-media values for the generic wildlife groups are derived from three or fewer observations). Such low replication may not provide a reliable estimate and will not reflect likely variations. It is, therefore, necessary to use caution when applying such values in assessments. While all of the available data have been quality controlled, such values need to be judged against more numerous data for biogeochemically similar elements or similar organism types. It may be helpful to consider the use of alternative approaches to provide CRwo-media values, discussed in Section 5, rather than the CRwo-media value in the table in these instances. An example where such a decision may be taken is the curium CRwo-water value for freshwater fish which originates from a single study and is 3–4 orders of magnitude lower than those for americium and plutonium which are based on larger datasets. Furthermore, the source study for the value also reports some of the lowest americium and plutonium CRwo-media values although they are not outliers.
Bayesian inference provides a mechanism for using prior knowledge to improve statistical parameters in cases where limited observational data are available. For example, the methods outlined in Section 5 (on filling knowledge gaps) have the potential to provide suitable CRwo-media values and probability distribution functions, which can subsequently be refined using Bayesian updating [88, 89] when empirical data for a specific CRwo-media become available.
Many of the CRwo-media values are derived from stable element data. This will result in a conservative estimate for radionuclides with short physical half-lives (e.g. isotopes of phosphorus), especially if an element has a comparatively long biological half-life. The uptake of some of the elements included within the tables will be subject to homeostatic control (e.g. calcium, phosphorus, sodium and magnesium are major essential elements). Nevertheless, the derived values for such elements are likely to be a reasonable estimate of those relevant for the organism when based upon comparatively large datasets from a range of sources. However, mean values are unlikely to be representative of areas with especially low or high bioavailable concentrations of these elements.

120
The source of the data, e.g. specific sampling areas or certain species, influences some wildlife CRwo-media values. For example, the large amount of data from post-Chernobyl studies for radiocaesium is probably dominated by data from areas with a comparatively high transfer to wildlife. Similarly, data from Canada dominates in some cases, for example: (i) the freshwater database for a number of radionuclide–organism combinations; and (ii) the data for natural radionuclide transfer to shrubs (which are largely for two species). The CRwo-water values for technetium transfer to marine crustaceans are dominated by data for European lobster (Homarus gammarus) and Norwegian lobster (Nephrops norvegicus) which accumulate relatively high activity concentrations of technetium compared with other crustaceans such as the edible crab (Cancer pagarus) [90]. All brackish ecosystem data are from Japanese estuaries or the Baltic Sea.
Almost all of the CRwo-media values presented here are for the adult life stages. Many organisms have different characteristics at different stages in their life cycle, including environment and feeding habits (e.g. amphibians, some flying insects which have aquatic larvae). While the ICRP [20] has identified life stages for their RAPs, there are few relevant data [8] and the ICRP compilation of transfer values does not provide CRwo-media values for life stages other than the adult.
The CRwo-media values for plants refer only to the part of the plant that is above ground because a number of assessment approaches currently only consider dose rates to that part of the plant. For radionuclides which accumulate in roots, such as uranium, the CRwo-media values presented here will underestimate the total internal dose rate. For certain assessments, it may be necessary to decide whether the root content of radionuclides needs to be considered separately and whether the lack of a dosimetric approach for roots in some models is likely to lead to significant errors in estimating dose (e.g. for elements with a low root to shoot transfer or for subsoil source terms [91]).
The CRwo-media values are based on the whole organism but excluding gut contents and parts of organisms which are likely to be contaminated by soil and sediment. However, when considering food chain modelling, these parts of organisms may be ingested by predators. Thus, if CRwo-media values are used for food chain modelling, they may underestimate the extent of transfer to higher trophic levels for some radionuclides. For instance, a study shows that >95% of the plutonium found in the whole body of rodents was in the pelt and gastrointestinal tract [92]. Similarly, a modelling study concluded that the cadmium intake of predators could be underestimated by up to a factor of ten if the gastrointestinal tract contents of wood mice (Apodemus sylvaticus) were neglected [93]. Conversely, in some circumstances, the CRwo-media values presented here would overestimate transfer. For instance, the majority of 90Sr is located in the bones of

121
vertebrates which are not generally consumed by predators, so applying whole organism CRwo-media values for the prey species would overestimate 90Sr intake.
A number of limitations in the availability of CRwo-media values are discussed here. However, before defining future research requirements, it is important to critically determine whether current models are fit for the purposes to which they are being applied. This should include an evaluation of which radionuclides need to be assessed in different scenarios and their probable relative importance in contributing to total internal exposure of different wildlife groups.
5. APPROACHES FOR FILLING DATA GAPS
A large number of transfer parameter values for radionuclide–wildlife group combinations are required to enable assessments to be made of the radiation exposure of wildlife. Even when concentration ratio values for radionuclides are collated at the level of broad wildlife group, as presented in this handbook, there are many radionuclide–wildlife group combinations with no reported CRwo-media values. Thus, this handbook does not contain all of the CRwo-media values which may be required in generic assessments.
If the relevant data are not available in the CRwo-media tables, the first response would be to consider whether appropriate sampling is necessary to provide the required CRwo-media values (or site specific whole organism radionuclide activity concentrations). Before carrying out environmental sampling programmes to fill these data gaps, it is important to consider which radionuclides contribute most to the overall dose and to focus data gathering efforts accordingly. Such data collection also needs to take account of the ethical justification for sampling of each wildlife group. If such data are collected, it is recommended that the values be entered into the on-line Wildlife Transfer Parameter Database9 to increase the overall available data underpinning the CRwo-media values in the future.
Existing models use a number of approaches to overcome the lack of CRwo-media values [24, 27, 66, 72, 73, 94]. Approaches considered to be the most appropriate for deriving missing CRwo-media values are described below. They are not presented in order of preference as the availability of data on which to base decisions will differ. If more than one option is available, it is often useful to compare the resultant values. The choice of approach may be dependent on the purpose of the assessment, any assumptions used and whether the derived CRwo-media values
9 http://www.wildlifetransferdatabase.org.

122
are likely to be conservative or realistic. Most of the techniques outlined in this section are already being used in assessments [27, 72, 73, 95]. However, this does not necessarily mean that their validity has been rigorously tested; rather, it reflects the need for a pragmatic approach to provide a value in assessments when there are no directly relevant data available.
5.1. SURROGATE ORGANISMS
When a CRwo-media value is missing, a surrogate value for a similar organism, defined by factors such as taxonomy, physiology and trophic level may be used [27, 72, 73]. For example, suitable surrogates include:
— Macroalgae CRwo-media value for a marine vascular plant; — Piscivorous fish CRwo-media value for a benthic feeding fish; — Detritivorous arthropod CRwo-media value for an arachnid; — Mammalian CRwo-media value for a bird.
The approach is supported by the study presented in Ref. [96] which demonstrated that data for leafy vegetables could be used as a surrogate for tree leaves. Furthermore, data given in Ref. [6] show that, in many instances, CRwo-soil values for crops are broadly similar to those for grass. The available data presented in Section 4 also enable a partial evaluation of the extent of agreement between CRwo-media values for similar wildlife groups.
5.2. PHYLOGENETIC RELATIONSHIPS
Differences in CRwo-media values between species can be related to their evolutionary history, or phylogeny, for vascular plants and marine organisms [97, 98]. However, this approach is data intensive. Reference [97] presents an analysis for caesium, strontium, cobalt, chlorine and ruthenium transfer to plants, and describes how the approach is applied. Reference [99] demonstrates that variation in the accumulation of radiologically relevant metals (Ni, Pb, Zn, Cd, Cr and Cu) could be explained by taxonomic classification at the level of order. In aquatic systems, Ref. [98] demonstrates that the rates of uptake of nine radionuclides from water differed between chondrichthyans and species of pleuronectiform and perciform teleosts; it also describes a methodology to investigate such phylogenetic questions.
Where detailed analyses are not available, the rationale behind the approach can also be used to identify the most suitable surrogate organisms by selecting

123
the most closely related organism for which data exist from a phylogenetic tree. Examples of phylogenetic trees are available on-line10.
For detailed site specific assessments, the approach may also be useful to identify CRwo-media values for specific species which are protected and cannot be sampled.
5.3. BIOGEOCHEMICAL ANALOGUES AND IONIC POTENTIAL
Biogeochemical analogues are elements which are assumed to have the same general behaviour under similar environmental/biological conditions (simple examples include caesium and potassium ions in water systems). The similarity can be used to identify CRwo-media values for missing data. For instance, if a curium CRwo-media value for a given organism is missing, available CRwo-media values for plutonium and americium for that organism might provide a reasonable substitute. As for the surrogate organism approach, the feasibility of this option can be partially evaluated using the available data presented in Section 4. It may be appropriate to combine the surrogate organism and biogeochemical analogue approaches, for instance, using the CRwo-soil value for plutonium in mammals to predict transfer of americium to birds.
While such approaches have been used to provide surrogate values for application in both human and wildlife assessments, Refs [5, 72, 73, 76] suggest that ionic potential may better predict environmental mobility and root uptake than simple placement within the periodic table. Ionic potential is calculated as the ratio of ionic charge to ionic radius; data presented in Refs [76, 100] show an exponential decrease in plant CRwo-soil with decreasing ionic potential.
5.4. ALLOMETRY
The dependence of a biological variable Y on a body mass M has been typically characterized by allometric equations of the form Y = aM b. Radioecological transfer parameters for terrestrial and marine animals for a limited number of radionuclides have been shown to fit such allometric relationships [15, 94, 95, 101, 102]. Application of these relationships requires suitable dietary intake values, often also derived allometrically [103].
10 http://tolweb.org. http://www.treebase.org. http://www.mobot.org/mobot/research/apweb/welcome.html.

124
Combining radioecological allometric expressions with those for dietary intake, Ref. [94] proposes that for many radionuclides the concentration ratio of whole organism radionuclide activity concentration to dietary radionuclide activity concentration would be a constant for different species. This assumption can be used to estimate whole organism to dietary concentration ratios where it is not possible to derive allometric relationships. However, the assumption does not appear to be valid, based on currently available data, for the actinide elements.
Some biological traits for plants can be described by allometric functions [104, 105]. However, Ref. [76] reports that evidence to support the concept of using allometric scaling functions to estimate radionuclide activity concentrations in plants was inconclusive. This is consistent with what is observed in Ref. [96].
5.5. DATA FROM A DIFFERENT ECOSYSTEM
If data are lacking for an organism–radionuclide combination in a given ecosystem, then available CRwo-media values from a similar ecosystem could be applied [73]. The approach is likely to be only applicable to provide CRwo-media values for aquatic brackish environments by assuming values from the marine environment and vice versa.
Examination of the marine and brackish datasets (Tables 7 and 8) suggests that the approach has some validity. Taking the example of large crustaceans (to remove some of the variance that may have been introduced by considering a broader wildlife grouping), the difference between CRwo-water values for brackish and marine ecosystems is <5 for cadmium, cobalt, lead, manganese and strontium (where data are available for both ecosystems). The difference varies from similar values for cobalt (marine CRwo-water to estuarine CRwo-water ratio = 1.6) to greater variation for CRwo-water for lead (marine CRwo-water to estuarine CRwo-water ratio = 4.9). Testing for the statistical significance of the difference between the datasets is not informative because these datasets are consistently small (n ≤ 5). Furthermore, the data for the brackish environment considered above are derived primarily from environments with relatively high salinity, characteristic of coastal marine environments. For less saline water bodies, the use of CRwo-media values as surrogates for the marine environment may be less appropriate.
5.6. USE OF PUBLISHED REVIEWS
There are reviews available of elemental media and wildlife concentrations [80, 106, 107] which often present data as typical concentrations in various organism tissues and in environmental media. While these have not been

125
compiled to produce CRwo-media values, it is possible to use them for this purpose. However, the data for environmental media and wildlife may not be from the same geographical locations, which adds to the uncertainties associated with applying these data.
Previous compilations of wildlife radionuclide CRwo-media values [27, 72, 73] present complete sets of CRwo-media values for all of the radionuclide–organism combinations considered. However, many of these data were derived by methods such as those described here, using more limited underlying databases. This handbook, therefore, supersedes these previous reviews.
There are a large number of reviews in Russian (>400) with relevant information for the handbook. These publications were reviewed to provide CRwo-water values for terrestrial, freshwater and marine species [56, 58]. None of these studies were previously available in English. For freshwater and marine ecosystems, these CRwo-water values have been compared with those derived in international reviews [56, 58].


127
Appendix I
CONVERSION FACTORS FOR ASH OR DRY WEIGHT TO FRESH WEIGHT
The conversion factors for ash or dry weight to fresh weight used for the on-line database when required are listed in Tables 9 and 10. The data were derived from ERICA [108]; other useful values can be found in Ref. [6].
TABLE 9. ASSUMED ASH OR DRY WEIGHT TO FRESH WEIGHT CONVERSION FACTORS (EXPRESSED AS ASH OR DRY WEIGHT AS A FRACTION OF FRESH WEIGHT) (adapted from Ref. [72])
Organism Dry weight fraction Ash weight fraction
Lichens 0.36 0.07
Grasses and herbs 0.25 —
Shrubs (wood) 0.5 0.013
Shrubs (other parts) 0.1 0.003
Trees (wood) 0.5 0.013
Trees (other parts) 0.1 0.003
Small mammals (whole organism) 0.3 —
Mammals (bone) 0.8 0.5
Mammals (muscle) 0.25 —
Amphibians (whole organism) 0.21 —
Birds (whole organism) 0.3 —
Terrestrial arthropods 0.25 0.024
Annelids 0.17 —
Gastropods 0.2 —

128
TABLE 10. ASSUMED DRY WEIGHT TO FRESH WEIGHT CONVERSION FACTORS (EXPRESSED DRY WEIGHT AS A FRACTION OF FRESH WEIGHT) FOR AQUATIC ORGANISMS (adapted from Ref. [73])
Organism Dry weight fraction
MarineAll organismsa 0.18
FreshwaterPhytoplanktonVascular plantsBivalve molluscs, crustaceans, insect larvaeAmphibians (whole organism)Fishb
0.20.250.250.210.18
a Assumed ash weight fraction is 0.01. b Value assumed for fish in this work; conversion was not required in Ref. [73].
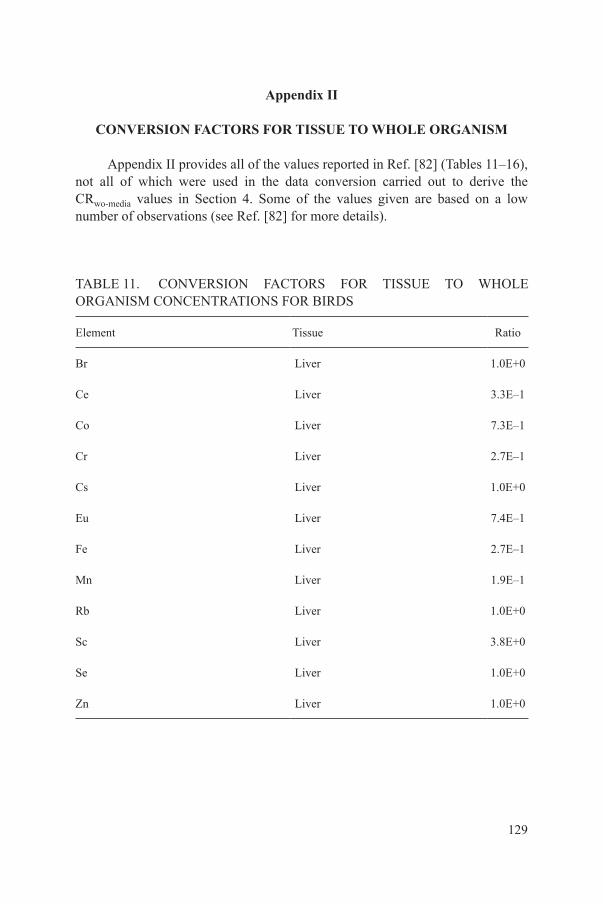
129
Appendix II
CONVERSION FACTORS FOR TISSUE TO WHOLE ORGANISM
Appendix II provides all of the values reported in Ref. [82] (Tables 11–16), not all of which were used in the data conversion carried out to derive the CRwo-media values in Section 4. Some of the values given are based on a low number of observations (see Ref. [82] for more details).
TABLE 11. CONVERSION FACTORS FOR TISSUE TO WHOLE ORGANISM CONCENTRATIONS FOR BIRDS
Element Tissue Ratio
Br Liver 1.0E+0
Ce Liver 3.3E–1
Co Liver 7.3E–1
Cr Liver 2.7E–1
Cs Liver 1.0E+0
Eu Liver 7.4E–1
Fe Liver 2.7E–1
Mn Liver 1.9E–1
Rb Liver 1.0E+0
Sc Liver 3.8E+0
Se Liver 1.0E+0
Zn Liver 1.0E+0

130
TABLE 12. CONVERSION FACTORS FOR TISSUE TO WHOLE ORGANISM CONCENTRATIONS FOR MARINE CRUSTACEANS (EXCLUDING EXOSKELETON) (cont.)
ElementRatio
Crustaceans (large) Crustaceans (small)
Ca 2.5E+0 1.0E+1
Cd 6.3E+0 1.5E+1
Ce 4.6E+0 1.3E+1
Co 5.5E+0 8.0E+0
Cr 8.1E+0 —
Cu 3.3E+0 3.5E+0
Dy 4.5E+0 1.5E+1
Er 4.7E+0 9.7E+0
Eu 4.1E+0 1.2E+1
Fe 5.7E+0 2.6E+1
Gd 4.4E+0 1.0E+1
Ho — 2.9E+1
La 3.5E+0 1.9E+1
Mg 1.0E+0 1.0E+0
Mn 3.2E+0 1.4E+1
Mo 3.3E+0 5.3E+0
Na 1.0E+0 1.0E+0
Nd 3.8E+0 2.4E+1
Ni 1.0E+0 1.2E+1

131
TABLE 12. CONVERSION FACTORS FOR TISSUE TO WHOLE ORGANISM CONCENTRATIONS FOR MARINE CRUSTACEANS (EXCLUDING EXOSKELETON) (cont.)
ElementRatio
Crustaceans (large) Crustaceans (small)
Pb 4.4E+0 6.0E+0
Po 3.5E+0 —
Pr 4.3E+0 2.3E+1
Rb 1.0E+0 1.0E+0
Sm 3.8E+0 1.1E+1
Sr 2.5E+0 9.3E+0
Tb — 1.5E+1
Tm — 2.4E+1
U — 1.7E+1
V 5.2E+0 2.1E+1
Y 4.2E+0 1.0E+1
Yb 2.9E+0 5.8E+1
TABLE 13. CONVERSION FACTORS FOR TISSUE TO WHOLE ORGANISM CONCENTRATIONS FOR MAMMALS (cont.)
Element Tissue Ratio
Ag MuscleLiver
KidneyBone
1.2E+21.3E–21.5E+13.3E+3

132
TABLE 13. CONVERSION FACTORS FOR TISSUE TO WHOLE ORGANISM CONCENTRATIONS FOR MAMMALS (cont.)
Element Tissue Ratio
Am MuscleKidneyBone
1.3E+14.1E–28.3E–2
Ca MuscleLiver
KidneyBone
1.0E+01.0E+06.2E–17.3E–1
Cd MuscleLiver
KidneyBone
1.0E+01.6E–19.3E–25.2E–1
Ce MuscleLiver
KidneyBone
3.4E+12.9E–11.0E+07.6E–2
Cr MuscleLiver
KidneyBone
1.0E+02.0E+01.8E+01.0E+0
Cs MuscleLiver
KidneyBone
1.0E+01.0E+0
—1.8E+0
Cu MuscleLiver
KidneyBone
1.0E+05.8E–16.8E–11.7E+0
F LiverKidneyBone
4.5E+03.7E+01.5E–1
Mn LiverKidneyBone
3.2E–15.7E–11.0E+0

133
TABLE 13. CONVERSION FACTORS FOR TISSUE TO WHOLE ORGANISM CONCENTRATIONS FOR MAMMALS (cont.)
Element Tissue Ratio
Pb MuscleLiver
KidneyBone
1.0E+01.0E+01.0E+01.6E–1
Po MuscleLiver
KidneyBone
2.0E+09.6E–21.1E–11.8E–1
Pu MuscleLiver
KidneyBone
5.3E+02.4E–11.0E+02.5E–1
Ra MuscleLiver
Kidney
3.8E+11.6E+17.3E+0
Ru MuscleLiver
KidneyBone
1.1E+01.2E–14.1E–26.4E+0
Se MuscleLiver
KidneyBone
1.0E+01.8E–11.4E–11.0E+0
U MuscleLiver
KidneyBone
4.7E+04.2E+01.0E+01.3E–1
Zn MuscleLiver
KidneyBone
1.8E+01.0E+01.0E+02.8E–1

134
TABLE 14. CONVERSION FACTORS FOR TISSUE TO WHOLE ORGANISM CONCENTRATIONS FOR MARINE MOLLUSCS (EXCLUDING SHELL)
ElementRatio
ElementRatio
Bivalves Gastropods Bivalves Gastropods
Ca 3.9E+0 1.7E+0 Na 1.7E+0 1.0E+0
Cd 1.4E+1 4.8E+1 Nd 2.7E+0 2.6E+0
Ce 2.7E+0 3.6E+0 Ni 2.3E+0 3.9E+0
Co 3.5E+0 1.0E+1 Pb 3.3E+0 1.3E+1
Cu — 6.5E+0 Po 2.9E+0 3.2E+0
Dy 2.7E+0 2.3E+0 Pr 2.5E+0 2.7E+0
Er 2.7E+0 8.0E+0 Pu 1.8E+0 5.2E+0
Eu 2.8E+0 1.9E+0 Rb 1.0E+0 1.0E+0
Fe 5.9E+0 1.9E+1 Sm 2.8E+0 2.6E+0
Gd 2.5E+0 2.4E+0 Sr 3.6E+0 2.2E+0
Ho 2.2E+0 2.8E+0 Tb 2.3E+0 2.1E+0
K 1.0E+0 1.0E+0 Tm 2.2E+0 1.0E+0
La 2.1E+0 2.4E+0 U 4.2E+0 3.9E+0
Lu 2.3E+0 1.0E+0 V 1.1E+1 4.0E+0
Mg 1.0E+0 1.0E+0 Y 5.2E+0 3.4E+0
Mn 2.7E+0 3.7E+0 Yb 3.2E+0 2.1E+0
Mo 5.0E+0 3.8E+0

135
TABLE 15. CONVERSION FACTORS FOR TISSUE TO WHOLE ORGANISM CONCENTRATIONS FOR FISH AND AMPHIBIANS (cont.)
Element TissueRatio
Freshwater fish Marine fish Amphibians
Ag Bone 5.9E–1 — —
Ag Kidney 1.0E+0 — —
Ag Liver 3.4E–1 — —
Ag Muscle 1.0E+0 — —
Al Bone 2.4E–1 — —
Al Kidney 2.9E–1 — —
Al Liver 5.6E–1 — —
Al Muscle 2.0E+0 — —
As Bone 1.0E+0 — —
As Kidney 1.0E+0 — —
As Liver 1.0E+0 — —
As Muscle 1.0E+0 — —
B Bone 5.3E–1 — —
B Kidney 5.3E–1 — —
B Liver 1.0E+0 — —
B Muscle 1.0E+0 — —
Ba Bone 1.5E–1 — 4.4E–2
Ba Kidney 1.8E+0 — 5.0E–1
Ba Liver 6.7E+0 — 3.9E–1
Ba Muscle 5.6E+0 — 2.4E+0

136
TABLE 15. CONVERSION FACTORS FOR TISSUE TO WHOLE ORGANISM CONCENTRATIONS FOR FISH AND AMPHIBIANS (cont.)
Element TissueRatio
Freshwater fish Marine fish Amphibians
Be Bone 5.6E–1 — —
Be Kidney 1.0E+0 — —
Be Liver 1.0E+0 — —
Be Muscle 1.0E+0 — —
Ca Bone 1.4E–1 — 2.1E–2
Ca Kidney 1.9E+1 — 2.1E+1
Ca Liver 8.3E+1 — 1.4E+1
Ca Muscle 4.2E+1 — 1.4E+1
Cd Bone 5.3E–1 3.1E–1 —
Cd Kidney 2.3E–1 — —
Cd Liver 5.6E–1 1.0E+0 —
Cd Muscle 1.0E+0 3.0E+0 —
Ce Bone 2.6E–1 2.9E+0 6.9E–1
Ce Kidney 1.5E–1 — 2.4E–1
Ce Liver 5.3E–1 — 4.6E–2
Ce Muscle 2.0E+0 — 3.3E+0
Co Bone 4.2E–1 6.7E–1 7.1E–1
Co Kidney 2.6E–1 — —
Co Liver 1.0E+0 1.8E–1 1.0E+0
Co Muscle 1.0E+0 1.8E+0 1.0E+0

137
TABLE 15. CONVERSION FACTORS FOR TISSUE TO WHOLE ORGANISM CONCENTRATIONS FOR FISH AND AMPHIBIANS (cont.)
Element TissueRatio
Freshwater fish Marine fish Amphibians
Cr Bone 2.1E–1 3.7E–1 2.7E–1
Cr Kidney 6.3E–1 — —
Cr Liver 1.0E+0 3.7E–1 7.1E–1
Cr Muscle 2.3E+0 1.0E+0 1.0E+0
Cs Bone 5.6E–1 1.0E+0 1.0E+0
Cs Kidney 1.7E+0 — 1.0E+0
Cs Liver 2.6E+0 2.8E+0 2.0E+0
Cs Muscle 1.0E+0 1.0E+0 1.0E+0
Cu Bone 1.0E+0 5.6E–1 1.0E+0
Cu Kidney 1.3E–1 — 5.1E–1
Cu Liver 3.8E–2 1.0E+0 1.1E–1
Cu Muscle 1.8E+0 1.0E+0 2.4E+0
Dy Bone — — —
Dy Kidney 5.3E–3 — —
Dy Liver — — —
Dy Muscle — — —
Eu Bone 2.2E–1 — —
Eu Kidney 1.0E+0 — —
Eu Liver 1.0E+0 — —
Eu Muscle 2.3E+0 — —
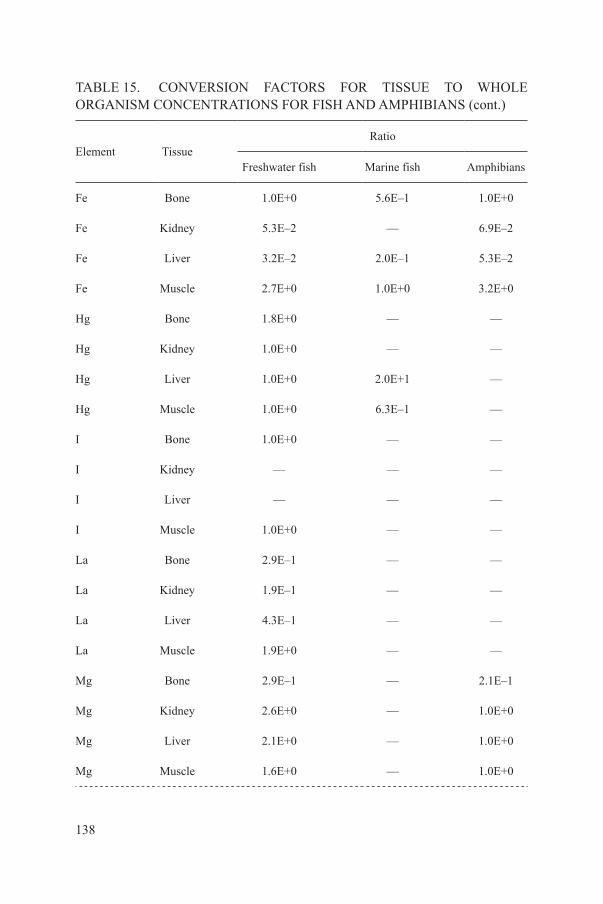
138
TABLE 15. CONVERSION FACTORS FOR TISSUE TO WHOLE ORGANISM CONCENTRATIONS FOR FISH AND AMPHIBIANS (cont.)
Element TissueRatio
Freshwater fish Marine fish Amphibians
Fe Bone 1.0E+0 5.6E–1 1.0E+0
Fe Kidney 5.3E–2 — 6.9E–2
Fe Liver 3.2E–2 2.0E–1 5.3E–2
Fe Muscle 2.7E+0 1.0E+0 3.2E+0
Hg Bone 1.8E+0 — —
Hg Kidney 1.0E+0 — —
Hg Liver 1.0E+0 2.0E+1 —
Hg Muscle 1.0E+0 6.3E–1 —
I Bone 1.0E+0 — —
I Kidney — — —
I Liver — — —
I Muscle 1.0E+0 — —
La Bone 2.9E–1 — —
La Kidney 1.9E–1 — —
La Liver 4.3E–1 — —
La Muscle 1.9E+0 — —
Mg Bone 2.9E–1 — 2.1E–1
Mg Kidney 2.6E+0 — 1.0E+0
Mg Liver 2.1E+0 — 1.0E+0
Mg Muscle 1.6E+0 — 1.0E+0

139
TABLE 15. CONVERSION FACTORS FOR TISSUE TO WHOLE ORGANISM CONCENTRATIONS FOR FISH AND AMPHIBIANS (cont.)
Element TissueRatio
Freshwater fish Marine fish Amphibians
Mn Bone 1.4E–1 6.7E–1 2.9E–2
Mn Kidney 1.7E+0 — 1.0E+0
Mn Liver 1.0E+0 — 3.1E+0
Mn Muscle 1.0E+1 — 3.5E+0
Mo Bone 4.5E–1 — —
Mo Kidney 1.0E–1 1.0E+0 —
Mo Liver 1.6E–1 1.0E+0 —
Mo Muscle 1.0E+0 — —
Na Bone 3.1E–1 — 3.3E–1
Na Kidney 5.9E–1 — 6.2E–1
Na Liver 1.0E+0 — 6.3E–1
Na Muscle 1.6E+0 — 1.0E+0
Nb Bone 6.3E–1 — —
Nb Kidney — — —
Nb Liver — — —
Nb Muscle 1.0E+0 — —
Ni Bone 4.0E–1 — 2.4E–2
Ni Kidney 2.6E–1 — 1.0E+0
Ni Liver 7.1E–1 2.9E+1 6.2E+0
Ni Muscle 1.3E+0 1.0E+0 2.9E+0

140
TABLE 15. CONVERSION FACTORS FOR TISSUE TO WHOLE ORGANISM CONCENTRATIONS FOR FISH AND AMPHIBIANS (cont.)
Element TissueRatio
Freshwater fish Marine fish Amphibians
P Bone 1.9E–1 — 6.7E–2
P Kidney 2.5E+0 — 1.0E+0
P Liver 2.0E+0 — 1.0E+0
P Muscle 3.1E+0 — 1.0E+0
Pb Bone 4.2E–1 2.0E–1 1.6E–1
Pb Kidney 6.7E–1 — 2.3E–1
Pb Liver 5.3E–1 1.0E+0 1.0E+0
Pb Muscle 1.0E+0 2.4E+0 1.0E+0
Po Bone 1.0E+0 1.0E+0 —
Po Kidney — — —
Po Liver — 6.7E–1 —
Po Muscle 1.0E+0 7.0E+0 —
Pu Bone — 5.6E–1 —
Pu Kidney — — —
Pu Liver — 5.1E–1 —
Pu Muscle — 3.6E+1 —
Ra Bone 2.1E–1 2.9E–1 —
Ra Kidney — — —
Ra Liver — — —
Ra Muscle 2.4E+0 1.7E+0 —
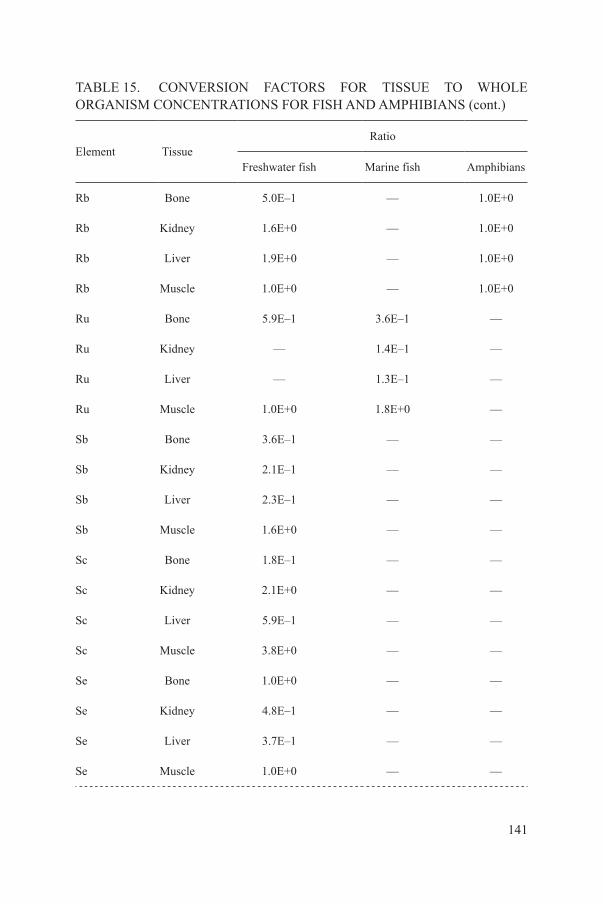
141
TABLE 15. CONVERSION FACTORS FOR TISSUE TO WHOLE ORGANISM CONCENTRATIONS FOR FISH AND AMPHIBIANS (cont.)
Element TissueRatio
Freshwater fish Marine fish Amphibians
Rb Bone 5.0E–1 — 1.0E+0
Rb Kidney 1.6E+0 — 1.0E+0
Rb Liver 1.9E+0 — 1.0E+0
Rb Muscle 1.0E+0 — 1.0E+0
Ru Bone 5.9E–1 3.6E–1 —
Ru Kidney — 1.4E–1 —
Ru Liver — 1.3E–1 —
Ru Muscle 1.0E+0 1.8E+0 —
Sb Bone 3.6E–1 — —
Sb Kidney 2.1E–1 — —
Sb Liver 2.3E–1 — —
Sb Muscle 1.6E+0 — —
Sc Bone 1.8E–1 — —
Sc Kidney 2.1E+0 — —
Sc Liver 5.9E–1 — —
Sc Muscle 3.8E+0 — —
Se Bone 1.0E+0 — —
Se Kidney 4.8E–1 — —
Se Liver 3.7E–1 — —
Se Muscle 1.0E+0 — —

142
TABLE 15. CONVERSION FACTORS FOR TISSUE TO WHOLE ORGANISM CONCENTRATIONS FOR FISH AND AMPHIBIANS (cont.)
Element TissueRatio
Freshwater fish Marine fish Amphibians
Sm Bone — — —
Sm Kidney — — —
Sm Liver — — —
Sm Muscle — — —
Sr Bone 1.4E–1 2.1E–1 2.1E–2
Sr Kidney 1.4E+1 — 1.0E+1
Sr Liver 2.7E+1 1.0E+0 1.3E+1
Sr Muscle 3.8E+1 3.1E+0 1.9E+1
Te Bone 6.3E–1 — —
Te Kidney 1.0E+0 — —
Te Liver 1.0E+0 — —
Te Muscle 1.0E+0 — —
Th Bone 2.2E–1 — —
Th Kidney 1.0E+0 — —
Th Liver 1.7E+0 — —
Th Muscle 2.2E+0 — —
Ti Bone 3.6E–1 — —
Ti Kidney 4.2E–1 — —
Ti Liver 1.0E+0 — —
Ti Muscle 1.0E+0 — —

143
TABLE 15. CONVERSION FACTORS FOR TISSUE TO WHOLE ORGANISM CONCENTRATIONS FOR FISH AND AMPHIBIANS (cont.)
Element TissueRatio
Freshwater fish Marine fish Amphibians
Tl Bone 2.2E–1 — —
Tl Kidney 5.6E–1 — —
Tl Liver 5.6E–1 — —
Tl Muscle 2.4E+0 — —
U Bone 2.1E–1 — —
U Kidney 2.0E+0 — —
U Liver 4.8E+0 — —
U Muscle 2.5E+0 — —
V Bone 5.3E–1 — 1.8E–1
V Kidney 1.0E+0 — 5.0E–1
V Liver 7.1E–1 2.2E+2 1.8E–1
V Muscle 1.0E+0 8.3E+0 1.0E+0
Y Bone 3.1E–1 — —
Y Kidney 3.1E–1 — —
Y Liver 4.2E–1 — —
Y Muscle 1.8E+0 — —
Zn Bone 2.6E–1 1.0E+0 1.7E–1
Zn Kidney 1.6E–1 — 4.7E–1
Zn Liver 2.7E–1 1.0E+0 4.1E–1
Zn Muscle 2.1E+0 1.0E+0 1.3E+0

144
TABLE 15. CONVERSION FACTORS FOR TISSUE TO WHOLE ORGANISM CONCENTRATIONS FOR FISH AND AMPHIBIANS (cont.)
Element TissueRatio
Freshwater fish Marine fish Amphibians
Zr Bone 4.8E–1 — —
Zr Kidney 1.0E+0 — —
Zr Liver 1.0E+0 8.3E+0 —
Zr Muscle 1.0E+0 2.4E+0 —
TABLE 16. CONVERSION FACTORS FOR TISSUE TO WHOLE ORGANISM CONCENTRATIONS FOR REPTILES (cont.)
Element TissueRatio
Turtles only Excluding turtles
Ag BoneKidneyLiver
Muscle
—5.5E+06.0E–24.0E+1
————
Al BoneKidneyLiver
Muscle
4.5E–11.9E+16.2E+09.2E+0
————
As BoneKidneyLiver
Muscle
1.0E+01.0E+01.0E+01.0E+0
—7.3E–15.9E–11.0E+0
Ca BoneKidneyLiver
Muscle
4.4E–1—
1.7E+11.2E+1
————

145
TABLE 16. CONVERSION FACTORS FOR TISSUE TO WHOLE ORGANISM CONCENTRATIONS FOR REPTILES (cont.)
Element TissueRatio
Turtles only Excluding turtles
Cd BoneKidneyLiver
Muscle
1.9E+02.3E–14.8E–11.4E+1
—5.9E–13.1E–11.0E+0
Co BoneKidneyLiver
Muscle
—3.4E–22.4E–16.0E+0
————
Cr BoneKidneyLiver
Muscle
—1.0E+01.0E+02.0E+0
—1.0E+01.0E+01.0E+0
Cs BoneKidneyLiver
Muscle
5.1E+02.0E+02.9E+01.0E+0
—2.5E–14.3E–11.0E+0
Cu BoneKidneyLiver
Muscle
—1.9E+04.6E–12.0E+1
—1.6E+03.7E–11.0E+0
Fe BoneKidneyLiver
Muscle
5.8E+01.7E+07.4E–15.6E+0
—2.2E+01.6E–12.3E+0
Mn BoneKidneyLiver
Muscle
—1.8E+07.4E+02.1E+1
—1.5E+19.0E+02.9E+0
Ni BoneKidneyLiver
Muscle
2.9E+01.0E+01.0E+02.1E+0
—1.0E+01.0E+01.0E+0

146
TABLE 16. CONVERSION FACTORS FOR TISSUE TO WHOLE ORGANISM CONCENTRATIONS FOR REPTILES (cont.)
Element TissueRatio
Turtles only Excluding turtles
Pb BoneKidneyLiver
Muscle
1.9E+07.5E+08.0E+01.8E+1
—4.5E+07.1E+04.3E+0
Ra BoneKidneyLiver
Muscle
1.0E+0—
8.7E+01.0E+1
————
Rb BoneKidneyLiver
Muscle
—1.0E+01.0E+01.0E+0
————
Se BoneKidneyLiver
Muscle
—1.0E+07.4E–11.7E+0
—5.7E–14.8E–11.0E+0
U BoneKidneyLiver
Muscle
————
——
2.6E–12.6E+0
Zn BoneKidneyLiver
Muscle
1.0E+04.8E+03.0E+05.4E+0
—1.0E+01.0E+01.0E+0

147
REFERENCES
[1] INTERNATIONAL ATOMIC ENERGY AGENCY, Generic Models for Use in Assessing the Impact of Discharges of Radioactive Substances to the Environment, Safety Reports Series No. 19, IAEA, Vienna (2001).
[2] INTERNATIONAL ATOMIC ENERGY AGENCY, Generic Models and Parameters for Assessing the Environmental Transfer of Radionuclides from Routine Releases: Exposures of Critical Groups, IAEA Safety Series No. 57, IAEA, Vienna (1982).
[3] INTERNATIONAL ATOMIC ENERGY AGENCY, Handbook of Parameter Values for the Prediction of Radionuclide Transfer in Temperate Environments, Technical Reports Series No. 364, IAEA, Vienna (1994).
[4] INTERNATIONAL ATOMIC ENERGY AGENCY, Sediment Kds and Concentration Factors for Radionuclides in the Marine Environment, Technical Reports Series No. 247, IAEA, Vienna (1985).
[5] INTERNATIONAL ATOMIC ENERGY AGENCY, Sediment Distribution Coefficients and Concentration Factors for Biota in the Marine Environment, Technical Reports Series No. 422, IAEA, Vienna (2004).
[6] INTERNATIONAL ATOMIC ENERGY AGENCY, Handbook of Parameter Values for the Prediction of Radionuclide Transfer in Terrestrial and Freshwater Environments, Technical Reports Series No. 472, IAEA, Vienna (2010).
[7] INTERNATIONAL ATOMIC ENERGY AGENCY, Methodology for Assessing Impacts of Radioactivity on Aquatic Ecosystems, Technical Reports Series No. 190, IAEA, Vienna (1979).
[8] INTERNATIONAL ATOMIC ENERGY AGENCY, Assessing the Impact of Deep Sea Disposal of Low Level Radioactive Waste on Living Marine Resources, Technical Reports Series No. 288, IAEA, Vienna (1988).
[9] INTERNATIONAL ATOMIC ENERGY AGENCY, Effects of Ionizing Radiation on Plants and Animals at Levels Implied by Current Radiation Protection Standards, Technical Reports Series No. 332, IAEA, Vienna (1992).
[10] BERESFORD, N.A., et al., Inter-comparison of models to estimate radionuclide activity concentrations in non-human biota, Radiat. Environ. Biophys. 47 (2008) 491–514.
[11] BERESFORD, N.A., et al., Findings and recommendations from an international comparison of models and approaches for the estimation of radiological exposure to non-human biota, Radioprotection 44 (2009) 565–570.
[12] BERESFORD, N.A., et al., Predicting the radiation exposure of terrestrial wildlife in the Chernobyl exclusion zone: An international comparison of approaches, J. Radiol. Prot. 30 (2010) 341–373.
[13] YANKOVICH, T.L., et al., An international model validation exercise on radionuclide transfer and doses to freshwater biota, J. Radiol. Prot. 30 (2010) 299–340.
[14] INTERNATIONAL ATOMIC ENERGY AGENCY, “Modelling radiation exposure and radionuclide transfer for non-human species, Report of the Biota Working Group of EMRAS Theme 3”, Environmental Modelling for Radiation Safety (EMRAS) — A Summary Report of the Results of the EMRAS Programme (2003–2007), IAEA-TECDOC-1678, IAEA, Vienna (2012) (on the accompanying CD-ROM),

148
http://www-pub.iaea.org/MTCD/publications/PDF/TE_1678_CD/Reports/Theme_3_WorkingGroup1(Biota)/ModellingRadiationExposureandRadionuclideTransferforNon-humanSpecies.pdf
[15] VIVES I BATLLE, J., et al., Inter-comparison of unweighted absorbed dose rates for non-human biota, Radiat. Environ. Biophys. 46 (2007) 349–373.
[16] HOWARD, B.J., et al., Protection of the environment from ionizing radiation in a regulatory context — An overview of the PROTECT coordinated action, J. Radiol. Prot. 30 (2010) 195–214.
[17] BERESFORD, N.A., et al., Evaluation of the practicability of different approaches for protecting the environment from ionizing radiation in a regulatory context and their relative merits, Deliverable 4, PROTECT Report, Centre for Ecology and Hydrology, Lancaster, UK (2008).
[18] INTERNATIONAL ATOMIC ENERGY AGENCY, Coordination Group on Radiation Protection of the Environment, http://www-ns.iaea.org/tech-areas/waste-safety/coord-group-on-environment.asp?s=3
[19] INTERNATIONAL COMMISSION ON RADIOLOGICAL PROTECTION, Recommendations of the International Commission on Radiological Protection, Publication 103, Elsevier (2008).
[20] INTERNATIONAL COMMISSION ON RADIOLOGICAL PROTECTION, Environmental Protection: The Concept and Use of Reference Animals and Plants, Publication 108, Elsevier (2009).
[21] INTERNATIONAL ATOMIC ENERGY AGENCY, Fundamental Safety Principles, IAEA Safety Standards Series No. SF-1, IAEA, Vienna (2006).
[22] INTERNATIONAL COMMISSION ON RADIOLOGICAL PROTECTION, A Framework for Assessing the Impact of Ionising Radiation on Non-human Species, Publication 91, Pergamon Press, Oxford and New York (2003).
[23] EUROPEAN COMMISSION, FOOD AND AGRICULTURE ORGANIZATION OF THE UNITED NATIONS, INTERNATIONAL ATOMIC ENERGY AGENCY, INTERNATIONAL LABOUR ORGANIZATION, OECD NUCLEAR ENERGY AGENCY, PAN AMERICAN HEALTH ORGANIZATION, UNITED NATIONS ENVIRONMENT PROGRAMME, WORLD HEALTH ORGANIZATION, Radiation Protection and Safety of Radiation Sources: International Basic Safety Standards, IAEA Safety Standards Series No. GSR Part 3, IAEA, Vienna (2014).
[24] UNITED STATES DEPARTMENT OF ENERGY, A Graded Approach for Evaluating Radiation Doses to Aquatic and Terrestrial Biota, Rep. DOE-STD-1153-2002, Modules 1–3, USDOE, Washington, DC (2002).
[25] UNITED STATES DEPARTMENT OF ENERGY, Environmental Protection Program, DOE O 450.1A, USDOE, Washington, DC (2008).
[26] ENVIRONMENTAL CANADA, HEALTH CANADA, Canadian Environmental Protection Act 1999, Priority Substances List Assessment Report Releases of Radionuclides from Nuclear Facilities (Impact on Non-human Biota), Final Rep. (2003).
[27] COPPLESTONE, D., et al., Habitat Regulations for Stage 3 Assessments: Radioactive Substances Authorisations, Environment Agency R&D Technical Rep. P3-101/SP1a, Environment Agency, Bristol (2003).

149
[28] COPPLESTONE, D., et al., Impact Assessment of Ionizing Radiation on Wildlife, R&D Publication 128, Environment Agency and English Nature, Bristol (2001).
[29] STRÅLSÄKERHETSMYNDIGHETEN, Strålsäkerhetsmyndighetens föreskrifter och allmänna råd om skydd av människors hälsa och miljön vid slutligt omhändertagande av använt kärnbränsle och kärnavfall, SSMFS 2008:37, ISSN 2000-0987. The Swedish Radiation Protection Institute’s Regulations on the Protection of Human Health and the Environment in connection with the Final Management of Spent Nuclear Fuel and Nuclear Waste, SSM, Stockholm (2009). Unofficial translation available from: http://www.stralsakerhetsmyndigheten.se/Global/Publikationer/Forfattning/ Stralskydd/1998/ssifs-1998-1e.pdf
[30] RADIATION AND NUCLEAR SAFETY AUTHORITY, Long-term Safety of Disposal of Spent Nuclear Fuel, Guide YVL 8.4, Radiation and Nuclear Safety Authority, Helsinki (2001).
[31] COPPLESTONE, D., HINGSTON, J., REAL, A., The development and purpose of the FREDERICA radiation effects database, J. Environ. Radioact. 99 (2008) 1456–1463.
[32] ANDERSSON, P., et al., Protection of the environment from ionizing radiation in a regulatory context (PROTECT): Proposed numerical benchmark values, J. Environ. Radioact. 100 (2009) 1100–1108.
[33] INTERNATIONAL ATOMIC ENERGY AGENCY, Quantification of Radionuclide Transfer in Terrestrial and Freshwater Environments for Radiological Assessments, IAEA-TECDOC-1616, IAEA, Vienna (2009).
[34] LARSSON, C.-M., The FASSET framework for assessment of environmental impact of ionising radiation in European ecosystems: An overview, J. Radiol. Prot. 30 (2004) A1–A12.
[35] BROWN, J.E., et al., The ERICA Tool, J. Environ. Radioact. 99 (2008) 1371–1383. [36] GARISTO, N.C., COOPER, F., FERNANDES, S.L., No-effect Concentrations
for Screening Assessment of Radiological Impacts on Non-human Biota, NWMO TR2008-02, Nuclear Waste Management Organisation, Toronto (2008).
[37] INTERNATIONAL COMMISSION ON RADIOLOGICAL PROTECTION, Environmental Protection: Transfer Parameters for Reference Animals and Plants, Publication 114, Elsevier (2009).
[38] PRÖHL, G., Interception of dry and wet deposited radionuclides by vegetation, J. Environ. Radioact. 100 (2009) 675–682.
[39] LECLERC, E., CHOI, Y.H., “Weathering”, Quantification of Radionuclide Transfer in Terrestrial and Freshwater Environments for Radiological Assessments, IAEA-TECDOC-1616, IAEA, Vienna (2009) 45–48.
[40] JOURDAIN, F., “Resuspension”, Quantification of Radionuclide Transfer in Terrestrial and Freshwater Environments for Radiological Assessments, IAEA-TECDOC-1616, IAEA, Vienna (2009) 63–68.
[41] STREBL, F., LETTNER, H., HUBMER, A.K., BOSSEW, P., “Radionuclide transfer in alpine ecosystems”, Quantification of Radionuclide Transfer in Terrestrial and Freshwater Environments for Radiological Assessments, IAEA-TECDOC-1616, IAEA, Vienna (2009) 397–401.

150
[42] COMANS, R.N.J., et al., Mobilization of radiocaesium in pore water of lake sediments, Nature 339 (1989) 367–369.
[43] VIDAL, M., TENT, J., LLAURADO, M., RAURET, G., Study of the evolution of radionuclide distribution in soils using sequential extraction schemes, J. Radioecol. 1 (1993) 49–55.
[44] HIRD, A.B., RIMMER, D.L., LIVENS, F.R., Factors affecting the sorption and fixation of caesium in acid organic soils, Eur. J. Soil Sci. 47 (1996) 97–104.
[45] SMITH, J.T., et al., Temporal change in fallout 137Cs in terrestrial and aquatic systems: A whole ecosystem approach, Environ. Sci. Technol. 33 (1999) 49–54.
[46] FESENKO, S., SANZHAROVA, N., TAGAMI, K., “Evolution of plant contamination with time”, Quantification of Radionuclide Transfer in Terrestrial and Freshwater Environments for Radiological Assessments, IAEA-TECDOC-1616, IAEA, Vienna (2009) 259–263.
[47] INTERNATIONAL COMMISSION ON RADIOLOGICAL PROTECTION, Nuclear Decay Data for Dosimetric Calculations, Publication 107, Elsevier (2008).
[48] SANZHAROVA, N., FESENKO, S., REED, E., “Processes governing radionuclide transfer to plants”, Quantification of Radionuclide Transfer in Terrestrial and Freshwater Environments for Radiological Assessments, IAEA-TECDOC-1616, IAEA, Vienna (2009) 123–138.
[49] FESENKO, S.V., et al., Identification of processes governing long-term accumulation of 137Cs by forest trees following the Chernobyl accident, Radiat. Environ. Biophys. 40 (2001) 105–113.
[50] BEYER, W.N., CONNOR, E.E., GEROULD, S., Estimates of soil ingestion by wildlife, J. Wildl. Manage. 58 (1994) 375–382.
[51] RICH, B.N., TALENT, L.G., Soil ingestion may be an important route for the uptake of contaminants by some reptiles, Environ. Toxicol. Chem. 28 (2009) 311–315.
[52] BERESFORD, N.A., HOWARD, B.J., The importance of soil adhered to vegetation as a source of radionuclides ingested by grazing animals, Sci. Total Environ. 107 (1991) 237.
[53] BERESFORD, N.A., et al., The importance of source dependent bioavailability in determining the transfer of ingested radionuclides to ruminant derived food products, Environ. Sci. Technol. 34 (2000) 4455–4462.
[54] HOWARD, B.J,. BERESFORD, N.A., BARNETT, C.L., FESENKO, S., Revision of TRS 364: Gastrointestinal fractional absorption of radionuclides in adult domestic ruminants, J. Environ. Radioact. 100 (2009) 1069–1078.
[55] HOWARD, B.J., BERESFORD, N.A., BARNETT, C.L., FESENKO, S., “Transfer to animals”, Quantification of Radionuclide Transfer in Terrestrial and Freshwater Environments for Radiological Assessments, IAEA-TECDOC-1616, IAEA, Vienna (2009) 267–307.
[56] FESENKO, S., FESENKO, J., SANZHAROVA, N., KARPENKO, E., TITOV, I., Radionuclide transfer to freshwater biota species: Review of Russian language studies, J. Environ. Radioact. 102 (2011) 8–25.
[57] RAMADE, F., Elements d’ecologie; ecologie appliqué, McGraw Hill, Paris (1989).[58] FESENKO, S., et al., Radionuclide transfer to marine biota species: Review of Russian
language studies, Radiat. Environ. Biophys. 49 (2010) 531–547.

151
[59] THOMANN, R.V., Equilibrium model of fate of microcontaminants in diverse aquatic food-chains, Can. J. Fish. Aquat. Sci. 38 (1981) 280–296.
[60] UNITED STATES DEPARTMENT OF ENERGY, RESRAD-BIOTA: A Tool for Implementing a Graded Approach to Biota Dose Evaluation, User’s Guide, Version 1, Rep. DOE/EH-0676, USDOE, Washington, DC (2004).
[61] HOWARD, B.J., BERESFORD, N.A., “Radiation protection of the environment: A summary of current approaches for assessment of radionuclides in terrestrial ecosystems”, Nuclear Power and the Environment, Issues in Environmental Science and Technology, Vol. 32 (HESTER, R.E., HARRISON, R.M., Eds), RSC Publishing (2011) 177–198.
[62] GARNIER-LAPLACE, J., et al., A multi-criteria weight of evidence approach for deriving ecological benchmarks for radioactive substances, J. Radiol. Prot. 30 (2010) 215–233.
[63] NAPIER, B.A., Alternative Conceptual Models for Assessing Food Chain Pathways in Biosphere Models, Rep. NUREG/CR-6910, US Nuclear Regulatory Commission, Washington, DC (2006).
[64] VIVES I BATLLE, J., et al., Dynamic model for the assessment of radiological exposure to marine biota, J. Environ. Radioact. 99 (2008) 1711–1730.
[65] CIFFROY, P., DURRIEU, G., GARNIER, J.-M., Probabilistic distribution coefficients (Kds) in freshwater for radioisotopes of Ag, Am, Ba, Be, Ce, Co, Cs, I, Mn, Pu, Ra, Ru, Sb, Sr and Th — Implications for uncertainty analysis of models simulating the transport of radionuclides in rivers, J. Environ. Radioact. 100 (2009) 785–794.
[66] BROWN, J., STRAND, P., HOSSEINI, A., BØRRETZEN, P., Handbook for Assessment of the Exposure of Biota to Ionizing Radiation from Radionuclides in the Environment, Deliverable 5: Appendix 2, Underpinning Scientific Information (life history sheets, empirical data and models), FASSET project, NRPA, Østerås (2003).
[67] GALERIU, D., et al., A metabolic derivation of tritium transfer coefficients in animal products, Radiat. Environ. Biophys. 40 (2001) 325–334.
[68] GALERIU, D., BELOT, Y., A standard guide for dose assessment of routine releases of tritium for any tritium facility, Report WP3, IDRANAP 31-02/2002 (2002).
[69] BELOT, Y., ROY, M., METIVIER, H., Le tritium: de l’environment a l’homme, Les éditions de physique (1996).
[70] GALERIU, D., et al., Modelling 3H and 14C transfer to farm animals and their products under steady state conditions, J. Environ. Radioact. 98 (2007) 205–217.
[71] MELINTESCU, A., GALERIU, D., Dynamic model for tritium transfer in an aquatic food chain, Radiat. Environ. Biophys. 50 (2011) 459–473.
[72] BERESFORD, N.A., et al., Derivation of transfer parameters for use within the ERICA Tool and the default concentration ratios for terrestrial biota, J. Environ. Radioact. 99 (2008) 1393–1407.
[73] HOSSEINI, A., THØRRING, H., BROWN, J.E., SAXÉN, R., ILUS, E., Transfer of radionuclides in aquatic ecosystems — Default concentration ratios for aquatic biota in the Erica Tool, J. Environ. Radioact. 99 (2008) 1408–1429.

152
[74] INTERNATIONAL COMMISSION ON RADIOLOGICAL PROTECTION, Radionuclide Transformations — Energy and Intensity of Emissions, Publication 38, Pergamon Press, Oxford and New York (1983).
[75] VANDENHOVE, H., CREMERS, A., SMOLDERS, E., Potassium bentonite addition to soil reduces availability of cesium to plants, Eur. J. Soil Sci. 54 (2003) 91–102.
[76] HIGLEY, K.A., Estimating transfer parameters in the absence of data, Radiat. Environ. Biophys. 49 (2010) 645–656.
[77] THIRY, Y., et al., Uranium distribution and cycling in Scots pine (Pinus sylvestris L.) growing on a revegetated U-mining heap, J. Environ. Radioact. 81 (2005) 201–219.
[78] DUQUÈNE, L., et al., Plant-induced changes in soil chemistry do not explain differences in uranium transfer, J. Environ. Radioact. 90 (2006) 1–14.
[79] STRACZEK, A., et al., Differences in U root-to-shoot translocation between plant species explained by U distribution in roots, J. Environ. Radioact. 101 (2010) 258–266.
[80] BOWEN, H.J.M., Trace Elements in Biochemistry, Academic Press, London (1966).[81] MILLERO, F.J., Chemical Oceanography, 2nd edn, CRC Press, Boca Raton, FL (1996)
469.[82] YANKOVICH, T.L., et al., Whole-body to tissue concentration ratios for use in biota
dose assessments for animals, Radiat. Environ. Biophys. 49 (2010) 549–565.[83] WOOD, M.D., BERESFORD, N.A., SEMENOV, D.V., YANKOVICH, T.L,
COPPLESTONE, D., Radionuclide transfer to reptiles, Radiat. Environ. Biophys. 49 (2010) 509–530.
[84] BERESFORD, N.A., et al., Assessment of risk to wildlife from ionizing radiation: Can initial screening tiers be used with a high level of confidence? J. Radiol. Prot. 30 (2010) 265–284.
[85] VOSE, D., Quantitative Risk Analysis, A Guide to Monte Carlo Simulation Modelling, John Wiley and Sons (1996).
[86] TAYLOR, A.C., Using objective and subjective information to develop distributions for probabilistic exposure assessment, J. Expo. Anal. Environ. Epidemiol. 3 (1993) 285–298.
[87] SHEPPARD, S.C., Perspective: Transfer parameters: Are on-site data really better? Hum. Ecol. Risk Assess. 11 (2005) 939–949.
[88] GELMAN, A., CARLIN, J.B., STERN, H.S., RUBIN, D.B., Bayesian Data Analysis, Chapman Hall/CRC (2003).
[89] GAMERMAN, D., LOPES, H.F., Markov Chain Monte Carlo: Stochastic Simulation for Bayesian Inference, 2nd edn, Chapman Hall/CRC Texts in Statistical Science (2006).
[90] BUSBY, R., McCARTNEY, M., McDONALD, P., Technetium-99 concentration factors in Cumbrian seafood, Radioprotection Colloq. 32 (1997) 311–316.
[91] JOHANSEN, M.P., et al., Assessing doses to terrestrial wildlife at a radioactive waste disposal site: Inter-comparison of modelling approaches, Sci. Total Environ. 427–428 (2012) 238–246.
[92] HAKONSON, T.E., NYHAN, J.W., “Ecological relationships of plutonium in southwest ecosystems”, Transuranic Elements in the Environment (HANSON, W.C., Ed.), Rep. DOE/TIC-22800, USDOE, Washington, DC (1980) 403–419.

153
[93] TOAL, M.E., WALKER, L.A., SHORE, R.F., Modeling cadmium dynamics in the guts and tissues of small mammals: Dose implications for predators, Environ. Toxicol. Chem. 21 (2002) 2493–2499.
[94] BERESFORD, N.A., BROADLEY, H.R., HOWARD, B.J., BARNETT, C.L., WHITE, P.J., Estimating radionuclide transfer to wild species — Data requirements and availability for terrestrial ecosystems, J. Radiol. Prot. 24 (1994) A89–A103.
[95] HIGLEY, K.A., DOMOTOR, S.L., ANTONIO, E.J., A kinetic-allometric approach to predicting tissue radionuclide concentrations for biota, J. Environ. Radioact. 66 (2003) 61–74.
[96] TAGAMI, K., UCHIDA, S., Can elemental composition of crop leaves be used to estimate radionuclide transfer to tree leaves? Radiat. Environ. Biophys. 49 (2010) 583–590.
[97] WILLEY, N.J., Phylogeny can be used to make useful predictions of soil-to-plant transfer factors for radionuclides, Radiat. Environ. Biophys. 49 (2010) 613–623.
[98] JEFFREE, R.A., OBERHANSLI, F., TEYSSIE, J.-L., Phylogenetic consistencies among chondrichthyan and teleost fishes in their bioaccumulation of multiple trance elements from seawater, Sci. Total Environ. 408 (2010) 3200–3210.
[99] BROADLEY, M.R., et al., Phylogenetic variation in heavy metal accumulation in angiosperms, New Phytol. 152 (2001) 9–27.
[100] TYLER, G., Ionic charge, radius, and potential control root/soil concentration ratios of fifty cationic elements in the organic horizon of a beech (Fagus sylvatica) forest podzol, Sci. Total Environ. 329 (2004) 231–239.
[101] MacDONALD, C.R., Ingestion rates and radionuclide transfer in birds and mammals on the Canadian shield, Rep. TR-722 COG-95-551, AECL, Ontario (1996).
[102] VIVES I BATLLE, J., WILSON, R.C., WATTS, S.J., McDONALD, P., CRAZE, A., Derivation of allometric relationships for radionuclides in marine phyla, Radioprotection 44 (2009) 47–52.
[103] NAGY, K.A., Food requirements of wild animals: Predictive equations for free-living mammals, reptiles, and birds, Nutr. Abstr. Rev. Ser. B Livest. Feeds Feed. 71 (2001) 1R–12R.
[104] ENQUIST, B.J., et al., A general integrative model for scaling plant growth, carbon flux, and functional trait spectra, Nature 449 (2007) 218–222.
[105] NIKLAS, K.J., Plant allometry, leaf nitrogen and phosphorus stoichiometry, and interspecific trends in annual growth rates, Ann. Bot. 97 (2006) 155–163.
[106] MERTZ, W., Trace Elements in Human and Animal Nutrition, 5th edn, Vol. 1, Academic Press, London (1987).
[107] HOFFMAN, D.J., BARNETT, A., RATTNER, G., BURTON, A., Jr., CAIRNS, J., Jr. (Eds), Handbook of Ecotoxicology, 2nd edn, CRC Press, Boca Raton, FL (2002).
[108] HOWARD, B.J., LARSSON, C.-M., The ERICA integrated approach and its contribution to protection of the environment from ionizing radiation, J. Environ. Radioact. 99 (2008) 1371–1363.


155
Annex
PUBLICATIONS USED TO BUILD THE CONCENTRATION RATIO TABLES
The publications given below relate to identification (ID) numbers in the tables with concentration ratios (CRwo-media) (Tables 5–8, in Section 4 in this report). Some ID numbers are not sequential as some of the on-line database entries are not used in Tables 5–8.
Publication ID number
AARKROG, A., et al., AMAP Greenland 1994–1996, Environmental Project No. 356, Ministry of Environment and Energy, Danish Environmental Protection Agency, Copenhagen (1997).
1
ABU-HILAL, A.H., Effect of depositional environment and sources of pollution on uranium concentration in sediment, coral, algae and seagrass species from the Gulf of Aqaba (Red Sea), Mar. Poll. Bull. 28 (1994) 81–88.
2
ALAM, M.N., et al., Radionuclide concentrations in mussels collected from the southern coast of Bangladesh, J. Environ. Radioact. 47 (1999) 201–212.
3
AL-MASRI, M.S., MAMISH, S., BUDEIR, Y., “Assessment of the potential impact of the phosphate industry along the Syrian coast by evaluating 210Po and 210Pb levels in sediment, seawater and selected marine organisms”, Rep. AECS-PR\FRSR 232, Atomic Energy Commission of Syria, Damascus (2000) 27.
4
ARCTIC MONITORING AND ASSESSMENT PROGRAMME, Assessment Report: Arctic Pollution Issues, AMAP, Oslo (1998).
5
ARCTIC MONITORING AND ASSESSMENT PROGRAMME, Assessment Report: Radioactive Contamination in the Russian Arctic, Report by Russian Experts, AMAP, Oslo (1999).
6
AMIARD, J.C., 110mAg contamination mechanisms in a marine benthic food chain. 3. Influence of the mode of contamination upon the distribution of the radionuclide, Helgol. Wissenschaftliche Meeresunters. 31 (1978) 444–456.
7

156
Publication ID number
AMIARD, J.C., “A study of the uptake and toxicity of some stable and radioactive pollutants in marine organisms: antimony, silver, cobalt and strontium in molluscs, crustaceans and teleosts”, Rep. (CEA)-R4928, CEA, Saclay, France (1978).
8
AMIARD, J.C., AMIARD-TRIQUET, C., Health and ecological aspects of cobalt-60 transfer in seawater food chain typical of an intertidal mudflat, Int. J. Environ. Stud. 10 (1977) 113–118.
9
ANCELLIN, J., GUEGUENIAT, P., GERMAINE, P., Radioecologie Marine, Eyrolles, Paris (1979).
10
ANCELLIN, J., VILQUIN, A., Nouvelles etudes de contaminations experimentales d’espèces marines par le cesium-137, le ruthenium-106 et le cerium-144, Radioprotection 33 (1968) 185–213.
11
ARCTIC MAR, “Radiological assessment of consequences from radioactive contamination of arctic marine areas” (IOSJPE, M., Ed.), Annual Progress Rep. 01.09.99-31.08.00, Norwegian Radiation Protection Authority, Østerås (2000).
12
BACHURIN, А.А., KULEBYAKINA, L.G., POLIKARPOV, G.G., Concentration ratios of calcium, strontium and strontium-90 in some marine hydrobionts, Radiobiologiya 7 (1967) 481–483 (in Russian).
13
BERROW, S.D., et al., Radionuclides (Cs-137 and K-40) in harbour porpoises Phocoena phocoena from British and Irish coastal waters, Mar. Poll. Bull. 36 (1998) 569–576.
14
BERTINE, K.K., GOLDBERG, E.D., Trace elements in clams, mussels and shrimps, Limnol. Oceanogr. 17 (1972) 877–884.
15
BOISSON, F., HUTCHINS, D.A., FOWLER, S.W., FISHER, N.S., TEYSSIE, J.L., Influence of temperature on the accumulation and retention of 11 radionuclides by the marine alga Fucus vesiculosus (L.), Mar. Poll. Bull. 35 (1997) 313–321.
16
BONOTTO, S., et al., Contamination d’organismes marins par le H-3, le Cs-134 et le Co-60, Revue internationale d’oceanographie medicale 49 (1978) 127–133.
17
BONOTTO, S., et al., “Ten years of investigation on radioactive contamination of the marine environment”, Impacts of Radionuclide Releases into the Marine Environment (Proc. Symp. Vienna, 1980), IAEA, Vienna (1981) 649–660.
18

157
Publication ID number
BOROUGHS, H., CHIPMAN, W.A., RICE, T.R., “Laboratory experiments on the uptake, accumulation, and loss of radionuclides by marine organisms”, The Effects of Atomic Radiation on Oceanography and Fisheries, Publication No. 551, National Academy of Sciences, National Research Council, Washington (1957).
19
BOURLAT, Y., MILLIES-LACROIX, J.C., CHIAPPINI, R., LE PETIT, G., BABLET, J.P., Determination of long-lived radionuclides in biological samples collected at Mururoa by a scientific delegation headed by the IAEA, J. Radioanal. Nucl. Chem. 226 (1997) 15–22.
20
BOWEN, H.J.M., Environmental Chemistry of the Elements, Academic Press, London (1979).
21
BROWN, J., IOSJPE, M., Radioactivity in the marine environment 1999, in NRPA Rep. 9, Norwegian Radiation Protection Authority, Østerås (2001) 29–30.
22
BROWN, J.E., et al., Levels of Tc-99 in seawater and biota samples from Norwegian coastal waters and adjacent seas, Mar. Poll. Bull. 38 (1999) 560–571.
23
BRUNGOT, A.L., CARROL, J.L., RUDJORD, A.L., FOYN, L., “A presentation of the Norwegian national surveillance programme of radioactivity in the marine environment in the period 1996–1998”, Extended Abstracts of the 4th Int. Conf. on Environmental Radioactivity, Edinburgh, 1999 (STRAND, P., JØLLE, T., Eds), Norwegian Radiation Protection Authority, Østerås (1999) 189–192.
24
BUSBY, R., McCARTNEY, M., McDONALD, P., Technetium-99 concentration factors in Cumbrian seafood, Radioprotection Colloq. 32 (1997) 311–316.
25
BUYANOV, N.I., BOIKO, E.V., Cobalt-60 accumulation by brown algae of different age, Okeanologiya 12 (1972) 471–474 (in Russian).
26
CARPENTER, J.H., GRANT, V.F., Concentration and state of cerium in coastal waters, J. Mar. Res. 25 (1967) 228–238.
27
CARVALHO, F.P., Po-210 in marine organisms: A wide range of natural radiation dose domains, Radiat. Prot. Dosimetry 24 (1988) 113–117.
28
CHERRY, R.D., SHANNON, L.V., The alpha radioactivity of marine organisms, At. Energy Rev. 12 (1974) 3–45.
29

158
Publication ID number
CHRISTENSEN, G.C., STEINNES, E., “Radionuclides in minke whale from the Arctic Ocean”, Extended Abstracts of the 4th Int. Conf. on Environmental Radioactivity in the Arctic (STRAND, P., JØLLE, T., Eds), Norwegian Radiation Protection Authority, Østerås (1999) 197–199.
30
COHEN, B.L., Bioaccumulation factors in marine organisms, Health Phys. 49 (1985) 1290–1294.
31
CONTI, M.E., CECCHETTI, G., A biomonitoring study: Trace metals in algae and molluscs from Tyrrhenian coastal areas, Environ. Res. 93 (2003) 99–112.
32
COOPER, L.W., et al., Radionuclide contamination burdens in Arctic marine mammals harvested during subsistence hunting, Arctic 53 (2000) 174–182.
33
CORCORAN, E.F., KIMBALL, J.F., “The uptake, accumulation and exchange of strontium-90 by open sea phytoplankton”, Radioecology (SCHULTZ, V., KLEMENT, A.W., Jr., Eds), (Proc. 1st Int. Symp on Radioecology, Colorado, Fort Collins, 1961), Reinhold Publishing, NY, and American Institute of Biological Sciences, Washington, DC (1963) 187–191.
34
COUGHTREY, P.J., JACKSON, D., JONES, C.H., THORNE, M.C., Radionuclide Distribution and Transport in Terrestrial and Aquatic Ecosystems — A Critical Review of Data, Vol. 5, A.A. Balkema, Rotterdam (1984).
35
COUGHTREY, P.J., THORNE, M.C., Radionuclide Distribution and Transport in Terrestrial and Aquatic Ecosystems — A Critical Review of Data, Vol. 2, A.A. Balkema, Rotterdam (1983).
36
COUGHTREY, P.J., THORNE, M.C., Radionuclide Distribution and Transport in Terrestrial and Aquatic Ecosystems — A Critical Review of Data, Vol. 1, A.A. Balkema, Rotterdam (1983).
37
DAHLGAARD, H., BERGAN, T.D.S., CHRISTENSEN, G.C., Technetium-99 and caesium-137 time series at the Norwegian coast monitored by the brown alga Fucus vesiculosus, Radioprotection Colloq. 32 (1997) 353–358.
38
DIETZ, R., PACYNA, J., THOMAS, D.J., “Heavy metals”, AMAP Assessment Report: Arctic Pollution Issues, AMAP, Oslo (1998) 373–524.
39
EL-MOSELHY, K.M., GABAL, M.N., Trace metals in water, sediments and marine organisms from the northern part of the Gulf of Suez, Red Sea, J. Mar. Syst. 46 (2004) 39–46.
40

159
Publication ID number
FISHER, N.S., BJERREGAARD, P., FOWLER, S.W., Interactions of marine plankton with transuranic elements. 1. Biokinetics of neptunium, plutonium, americium, and californium in phytoplankton, Limnol. Oceanogr. 28 (1983) 432–447.
41
FISHER, N.S., BURNS, K.A., CHERRY, R.D., HEYRAUD, M., Accumulation and cellular distribution of 241Am, 210Po and 210Pb in two marine algae, Mar. Ecol. Prog. Ser. 11 (1983) 233–237.
42
FISHER, N.S., et al., Radionuclide bioconcentration factors and sediment partition coefficients in Arctic Seas subject to contamination from dumped nuclear wastes, Environ. Sci. Technol. 33 (1999) 1979–1982.
43
FISHER, N.S., REINFELDER, J.R., “The trophic transfer of metals in marine systems”, Metal Speciation and Bioavailability in Aquatic Systems (TESSIER, A., TURNER, D.R., Eds), John Wiley & Sons, Chichester (1995) 363–406.
44
FISHER, N.S., TEYSSIE, J.L., KRISHNASWAMI, S., BASKARAN, M., Accumulation of Th, Pb, U, and Ra in marine phytoplankton and its geochemical significance, Limnol. Oceanogr. 32 (1987) 131–142.
45
FOLSOM, T.R., WONG, K.M., HODGE, V.F., “Some extreme accumulations of natural polonium radioactivity observed in certain oceanic organisms” (Proc. Symp. on the Natural Radiation Environment, Houston, TX, 1972), Vol. 2, USERDA, Rep. CONF-720805 (1973) 863–882.
46
FOSTER, P., Concentrations and concentration factors of heavy metals in brown algae, Environ. Poll. 10 (1976) 45–53.
47
FOWLER, S.W., TEYSSIE, J.L., ACOSTA, A., GATTUSO, J.P., JAUBERT, J., “Radiotracer studies on radionuclide and trace element cycling in corals”, Marine Pollution (Proc. Symp. Monaco, 1998), IAEA-TECDOC-1094, IAEA, Vienna (1999) 587–588.
48
FRANIĆ, Z., LOKOBAUER, N., Sr-90 and Cs-137 in pilchards from the Adriatic Sea, Arhiv za Higijenu Rada i Toksikologiju (Archives of Industrial Hygiene and Toxicology) 44 (1993) 293–301.
49
GERMAIN, P., LECLERC, G., LE CAVELIER, S., SOLIER, L., BARON, Y., Évolution spatio-temporelle des concentrations, des rapports isotopiques et des facteurs de concentration du plutonium dans une espèce d’algue et deux espèces de mollusques en Manche, Radioprotection 35 (2000) 175–200.
50

160
Publication ID number
GOMEZ, L.S., MARIETTA, M.G., JACKSON, D.W., Compilation of Selected Marine Radioecological Data for the Formerly Utilized Sites Remedial Action Program: Summaries of Available Radioecological Concentration Factors and Biological Half-lives, Sandia National Laboratories, Rep. SAND89-1585 RS-8232-2/, Sandia National Laboratories, Albuquerque, NM (1991).
51
GUARY, J.C., HIGGO, J.J.W., CHERRY, R.D., HEYRAUD, M., High concentrations of transuranics and natural radioactive elements in the branchial hearts of the cephalopod, Octopus vulgaris, Mar. Ecol. Prog. Ser. 4 (1981) 123–126.
52
GUTHRIE, R.K., DAVIS, E.M., CHERRY, D.S., MURRAY, H.E., Biomagnification of heavy metals by organisms in the marine microcosm, Bull. Environ. Contam. Toxicol. 31 (1979) 53–61.
53
GWYNN, J.P., ANDERSEN, M., DOWDALL, M., LYDERSEN, C., KOVACS, K., “Cesium-137 in marine mammals from Svalbard and the Barents and Greenland Seas”, Proc. 6th Int. Conf. on Environmental Radioactivity in the Arctic and Antarctic, Nice, 2005, Norwegian Radiation Protection Authority, Østerås (2005).
54
HAYASHI, N., KATAGIRI, H., NARITA, O., KINOSHITA, M., Concentration factors of plutonium and americium for marine products, J. Radioanal. Nuclear Chem. 138 (1990) 331–336.
55
HEFT, R.E., HARRISON, F.L., PHILLIPS, W.A., “Radioecological study of the Humbolt Bay marine environment”, Nuclear Methods in Environmental Research (VOGT, J.R., PARKINSON, T.F., CLARK R.L., Eds), University of Missouri, Columbia (1971) 158–168.
56
HELCOM, HELCOM MORS Database on Environmental Radioactivity in the Baltic Sea, Baltic Marine Environment Protection Commission, Helsinki (2010).
57
HELDAL, H.E., STUPAKOFF, I., FISHER, N.S., Bioaccumulation of Cs-137 and Co-57 by five marine phytoplankton species, J. Environ. Radioact. 57 (2001) 231–236.
58
HEYRAUD, M., CHERRY, R.D., Polonium-210 and lead-210 in marine food chains, Mar. Biol. 52 (1979) 227–236.
59
HOLM, E., et al., Transuranium elements in macroalgae at Monaco following the Chernobyl accident, Eur. J. Solid State Inorg. Chem. 28 (1991) 375–378.
60

161
Publication ID number
WILLIAMS, A.R., “Background radiological data for the proposed Beverly Uranium Development”, South Australia, Australian Atomic Energy Commission, Lucas Heights (1981).
61
HOLM, E., et al., Radionuclides in macro algae at Monaco following the Chernobyl accident, J. Radioanal. Nuclear Chem. 177 (1994) 51–72.
62
HOLM, E., PERSSON, B.R.R., HALLSTADIUS, L., AARKROG, A., DAHLGAARD, H., Radiocesium and transuranium elements in the Greenland and Barents Seas, Oceanol. Acta 6 (1983) 457–462.
63
HOLM, E., PERSSON, R.B.R., “Behaviour of natural (Th, U) and artificial (Pu, Am) actinides in coastal waters”, Marine Radioecology (Proc. 3rd NEA Sem. Tokyo, 1979), OECD, Paris (1980) 237–244.
64
HOU, X., YAN, X., Study on the concentration and seasonal variation of inorganic elements in 35 species of marine algae, Sci. Total Environ. 222 (1998) 141–156.
65
HURTGEN, C., KOCH, G., VAN DER BEN, D., BONOTTO, S., The determination of technetium-99 in the brown marine alga Fucus spiralis collected along the Belgian Coast, Sci. Total Environ. 70 (1988) 131–149.
66
ICHIKAWA, R., OHNO, S., Levels of cobalt, caesium and zinc in some marine organisms in Japan, Bull. Jap. Soc. Sci. Fish. 40 (1974) 501–508.
67
IKAHEIMONEN, T.K., RISSANEN, K., MATISHOV, D.G., MATISHOV, G.G., “Plutonium in fish, algae, and sediments in the Barents, Petshora, and Kara Sea” (Proc. Int. Conf. on Environmental Radioactivity in the Arctic, Oslo), Norwegian Radiation Protection Authority, Østerås (1995) 227–232.
68
ILUS, E., Summary Report of the NKS-B/INDOFERN Project (New Indicator Organisms for Environmental Radioactivity), (Proc. of Summary Seminar NKS-B Programme 2002–2005, Tartu, 2005), NKS-143, STUK, Finland (2005) 1–13.
69
ILUS, E., KLEMOLA, S., IKAHEIMONEN, T.K., VARTTI, V.-P., MATTILA, J., “Indicator value of certain aquatic organisms for radioactive substances in the sea areas off the Loviisa and Olkiluoto nuclear power plants (Finland)” (Proc. of Summary Seminar NKS-B Programme 2002–2005, Tartu, 2005), Nordic Nuclear Safety Research, Roskilde, Denmark (2005) 67–73.
70

162
Publication ID number
ILUS, E., KLEMOLA, S., IKAHEIMONEN, K., “Radiocaesium in seals and terns off the Finnish coast after the Chernobyl accident”, Proc. 6th Int. Conf. on Environmental Radioactivity in the Arctic and Antarctic, Nice, 2005, Norwegian Radiation Protection Authority, Østerås (2005).
71
ISHII, T., SUZUKI, H., IIMURA, M., KOYANAGI, T., “Concentration of trace elements in marine organisms”, NIRS-R-5, National Institute of Radiological Sciences, Chiba, Japan (1976) 28–29.
72
JEFFREE, R.A., SZYMCZAK, R., PECK, G.A., “Po-210 and Pb-210 concentration factors for zooplankton and pellets in the oligotrophic South-West pacific” (Proc. Int. Conf. on Isotopes in Environmental Studies — Aquatic Forum, Monaco, 2004) (2004).
73
JENKINS, C.E., Radionuclide distribution in Pacific Salmon, Health Phys. 17 (1969) 507–512.
74
KAHN, B., TURGEON, K.S., “The bioaccumulation factor for phosphorus-32 in edible fish tissue”, US Nuclear Regulatory Commission, Rep. NUREG/CR-1336, University of Michigan Library (1980) 1–116.
75
KANISCH, G., NAGEL, G., Radioactivity in fish from the North Sea, Information for the Fishing Industry in Fisheries Research 39 (1992) 32–39 (in German).
76
KASAMATSU, F., KAWABE, K., INATOMI, N., MURAYAMA, T., A note on radionuclide 137Cs and 40K concentrations in Dall’s porpoises Phocoenoides dalli in coastal waters of Japan, J. Cetacean Res. Manage. 1 (1999) 275–278.
77
KERSHAW, P.J., McMAHON, C.A., RUDJORD, A.L., SMEDLEY, C., LEONARD, K.S., Spatial and temporal variations in concentration factors in NW European Seas secondary use of monitoring data, Radioprotection 40 (2005) S93–S99.
78
KILIZHENKO, V.P., “Some data on Barents Sea contamination”, Atomic Energy on Sea Safety and Ecology, International Scientific Seminar of the USSR Nuclear Society, Moscow, 1990, Nuclear Society (1992) 250–252.
79
KIMURA, Y., OGAWA, Y., HONDA, Y., KATSURAYAMA, K., Studies on the concentration of radioactive substances by plankton, Chlorella pyrenoidosa, Igaku 25 (1990) 361–368.
80

163
Publication ID number
KOLSTAD, A.K., RUDJORD, A.L., “Organ distribution of technetium-99 in lobster (Homarus gammarus) from Norwegian coastal areas”, Proc. 6th Int. Conf. on Environmental Radioactivity in the Arctic and Antarctic, Nice, 2005, Norwegian Radiation Protection Authority, Østerås (2005).
81
KULEBAKINA, L.G., POLIKARPOV, G.G., On algal radioecology of the Black sea shelf, Okeanologiya 7 (1967) 278–286 (in Russian).
82
KURABAYASHI, M., FUKUDA, S., KUROKAWA, Y., “Concentration factors of marine organisms used for the environmental dose assessment”, Marine Radioecology (Proc. 3rd OECD/NEA Sem. Tokyo, 1979), OECD Paris (1980) 355.
83
LEAL, M.C.F., VASCONCELOS, M.T., SOUSA-PINTO, I., CABRAL, J.P.S., Biomonitoring with benthic macroalgae and direct assay of heavy metals in seawater of the Oporto coast (Northwest Portugal), Mar. Poll. Bull. 34 (1997) 1006–1015.
84
LENTSCH, J.W., KNEIP, T.J., WREN McDONALD, E., HOWELLS, G.P., EISENBUD, M., “Stable Mn and Mn-54 distributions in the physical and biological components of the Hudson River Estuary”, Radionuclides in Ecosystems (NELSON, D.J., Ed.), CONF-710501, NTIS Springfield, VA (1971) 752–768.
85
LINDAHL, P., ROOS, P., HOLM, E., DAHLGAARD, H., Studies of Np and Pu in the marine environment of Swedish–Danish waters and the North Atlantic Ocean, J. Environ. Radioact. 82 (2005) 285–301.
86
LOCATELLI, C., TORSI, G., Determination of Se, As, Cu, Pb, Cd, Zn and Mn by anodic and cathodic stripping voltammetry in marine environmental matrices in the presence of reciprocal interference. Proposal of a new analytical procedure, Microchemical J. 65 (2000) 293–303.
87
MARUMO, K., ISHII, T., ISHIKAWA, Y., UEDA, T., Concentration of elements in marine zooplankton from coastal waters of Boso Peninsula, Jap. Fish. Sci. 64 (1998) 185–190.
88
MASSON, M., et al., Time series for sea water and seaweed of Tc-99 and Sb-125 originating from releases at La Hague, J. Mar. Syst. 6 (1995) 397–413.
89

164
Publication ID number
MATISHOV, G.G., MATISHOV, D.G., NAMJATOV, A.A., “Modern level of the content of 137Cs in fish and seaweed of the Barents Sea”, Extended Abstracts of the 4th Int. Conf. on Environmental Radioactivity, Edinburgh, 1999 (STRAND, P., JØLLE, T., Eds), Norwegian Radiation Protection Authority, Østerås (1999) 242–243.
90
MATISHOV, G.G., MATISHOV, D.G., SZCZYPA, J., RISSANEN, K., “Radionuclides in the Ecosystem of the Barents and Kara Seas Region”, Proc. Kola Science Center, Apatity (1994) (in Russian).
91
MATISHOV, G.G., RODIN, A.V., (Eds), Atlantic Cod. Biology, Ecology, Fishery, Nauka, St. Petersburg (1996) (in Russian).
92
MAUCHLINE, J., TEMPLETON, W.L., Dispersion in the Irish Sea of the radioactive liquid effluent from Windscale Works of the UK Atomic Energy Authority, Nature 198 (1963) 623–626.
93
McDONALD, P., BAXTER, M.S., FOWLER, S.W., Distribution of radionuclides in mussels, winkles and prawns. Part 1. Study of organisms under environmental conditions using conventional radio-analytical techniques, J. Environ. Radioact. 18 (1993) 181–202.
94
McDONALD, P., COOK, G.T., BAXTER, M.S., Natural and anthropogenic radioactivity in coastal regions of the UK, Radiat. Prot. Dosimet. 45 (1992) 707–710.
95
MEINHOLD, A.F., HAMILTON, L.D., “Radium concentration factors and their use in health and environmental risk assessment”, Proc. Int. Conf. Produced Water: Technological/environmental Issues and Solutions (RAY, J.P., ENGELHARDT, F.R., Eds), Plenum Press, New York (1992) 293–302.
96
MELHUUS, A., SEIP, K.L., SEIP, H.M., MYKLESTAD, S., A preliminary study of the use of benthic algae as biological indicators of heavy metal pollution in Sørfjorde Norway, Environ. Poll. 15 (1978) 101–107.
97
NAKAHARA, M., KOYANAGI, T., SAIKI, M., “Concentrations of radioactive cobalt by seaweeds in the food chains”, Impacts of Nuclear Releases into the Aquatic Environment (Proc. Symp. Otaniemi, 1975), IAEA, Vienna (1975) 301–312.
98
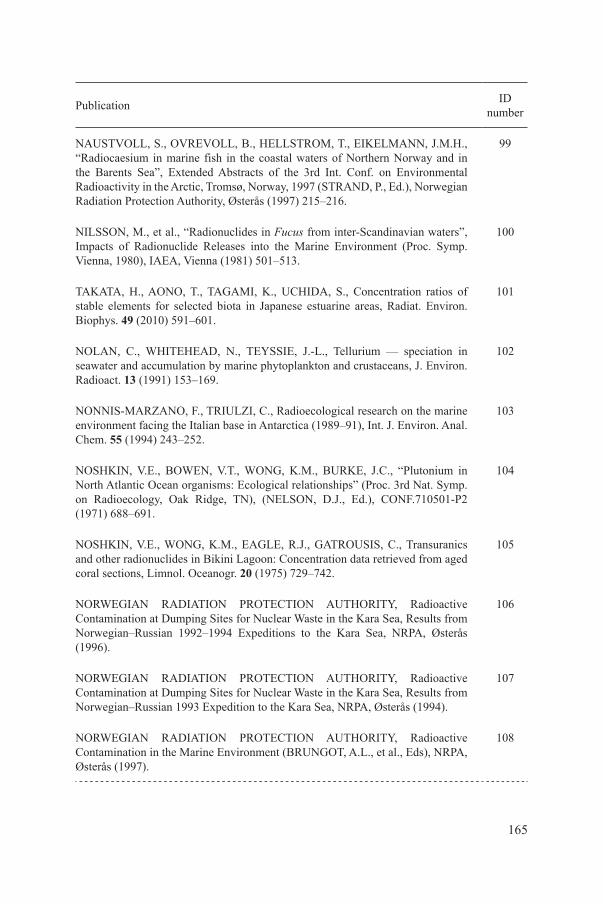
165
Publication ID number
NAUSTVOLL, S., OVREVOLL, B., HELLSTROM, T., EIKELMANN, J.M.H., “Radiocaesium in marine fish in the coastal waters of Northern Norway and in the Barents Sea”, Extended Abstracts of the 3rd Int. Conf. on Environmental Radioactivity in the Arctic, Tromsø, Norway, 1997 (STRAND, P., Ed.), Norwegian Radiation Protection Authority, Østerås (1997) 215–216.
99
NILSSON, M., et al., “Radionuclides in Fucus from inter-Scandinavian waters”, Impacts of Radionuclide Releases into the Marine Environment (Proc. Symp. Vienna, 1980), IAEA, Vienna (1981) 501–513.
100
TAKATA, H., AONO, T., TAGAMI, K., UCHIDA, S., Concentration ratios of stable elements for selected biota in Japanese estuarine areas, Radiat. Environ. Biophys. 49 (2010) 591–601.
101
NOLAN, C., WHITEHEAD, N., TEYSSIE, J.-L., Tellurium — speciation in seawater and accumulation by marine phytoplankton and crustaceans, J. Environ. Radioact. 13 (1991) 153–169.
102
NONNIS-MARZANO, F., TRIULZI, C., Radioecological research on the marine environment facing the Italian base in Antarctica (1989–91), Int. J. Environ. Anal. Chem. 55 (1994) 243–252.
103
NOSHKIN, V.E., BOWEN, V.T., WONG, K.M., BURKE, J.C., “Plutonium in North Atlantic Ocean organisms: Ecological relationships” (Proc. 3rd Nat. Symp. on Radioecology, Oak Ridge, TN), (NELSON, D.J., Ed.), CONF.710501-P2 (1971) 688–691.
104
NOSHKIN, V.E., WONG, K.M., EAGLE, R.J., GATROUSIS, C., Transuranics and other radionuclides in Bikini Lagoon: Concentration data retrieved from aged coral sections, Limnol. Oceanogr. 20 (1975) 729–742.
105
NORWEGIAN RADIATION PROTECTION AUTHORITY, Radioactive Contamination at Dumping Sites for Nuclear Waste in the Kara Sea, Results from Norwegian–Russian 1992–1994 Expeditions to the Kara Sea, NRPA, Østerås (1996).
106
NORWEGIAN RADIATION PROTECTION AUTHORITY, Radioactive Contamination at Dumping Sites for Nuclear Waste in the Kara Sea, Results from Norwegian–Russian 1993 Expedition to the Kara Sea, NRPA, Østerås (1994).
107
NORWEGIAN RADIATION PROTECTION AUTHORITY, Radioactive Contamination in the Marine Environment (BRUNGOT, A.L., et al., Eds), NRPA, Østerås (1997).
108

166
Publication ID number
NORWEGIAN RADIATION PROTECTION AUTHORITY, Radioactive Contamination in the Marine Environment, StrålevernRapport 1999:6 (BRUNGOT, A.L., et al., Eds), NRPA, Østerås (1999).
109
NORWEGIAN RADIATION PROTECTION AUTHORITY, Radionuclide Uptake and Transfer in Pelagic Food Chains of the Barents Sea and Resulting Doses to Man and Biota, Final Rep., Norwegian Transport and Effects Programme, NRPA, Østerås (2000).
110
NORWEGIAN RADIATION PROTECTION AUTHORITY, Radioactivity in the Marine Environment, NRPA Rep. 1995:1 (SICKEL, M.A.K., et al., Eds), NRPA, Østerås (1995).
111
NORWEGIAN RADIATION PROTECTION AUTHORITY, Technetium-99 Contamination in the North Sea and in Norwegian Coastal Areas 1996 and 1997 (BROWN, J., KOLSTAD, A.K., LIND, B., RUDJORD, A.L., STRAND, P., Eds), NRPA, Østerås (1998).
112
OSVATH, I., BOLOGA, A., DOVLETE, C., Environmental Cs-137 concentration factors for Black Sea biota. Preliminary data, Rapport du Commission Internationale Mer Méditerranée 32 (1990) 320.
113
PENTREATH, R.J., Monitoring of Radionuclides, FAO Fisheries Technical Paper 150, FAO, Rome (1976) 8–23.
114
PENTREATH, R.J., Radionuclides in marine fish, Oceanogr. Mar. Biol. Ann. Rev. 15 (1977) 365–460.
115
PENTREATH, R.J., LOVETT, M.B., Transuranic nuclides in plaice (Pleuronectes platessa) from the north-eastern Irish Sea, Mar. Biol. 48 (1978) 19–26.
116
PERTSOV, L.A., Biological aspects of radioactive contamination of sea, Atomizdat, Moscow (1978) (in Russian).
117
POLIKARPOV, G.G., Radioecology of marine organisms, Atomizdat, Moscow (1964) 85–90 (in Russian).
118
POLIKARPOV, G.G., Ability of some Black Sea organisms to accumulate fission products, Science 133 (1961) 1127–1128.
119
POLIKARPOV, G.G., “Radioecology of aquatic organisms: The accumulation and biological effects of radioactive substances”, Reinhold, New York (1966).
120

167
Publication ID number
PORNTEPKASEMSAN, B., NEVISSI, A.E., Mechanism of radium-226 transfer from sediments and water to marine fishes, Geochem. J. 24 (1990) 223–228.
121
POSTON, T.M., KLOPFER, D.C., “A literature review of the concentration ratios of selected radionuclides in freshwater and marine fish”, PNL-5484, Pacific Northwest Laboratory, Richland, WA (1986).
122
POSTON, T.M., KLOPFER, D.C., Concentration factors used in the assessment of radiation dose to consumers of fish: A review of 27 radionuclides, Health Phys. 55 (1988) 751–766.
123
RICE, T.R., The accumulation and exchange of strontium by marine planktonic algae, Limnol. Oceanogr. 1 (1956) 123–138.
124
RISSANEN, K., IKAHEIMONEN, T.K., MATISHOV, D., MATISHOV, G.G., Radioactivity levels in fish, benthic fauna, seals, and sea birds collected in the northwest arctic of Russia, Radioprotection Colloq. 32 (1997) 323–331.
125
RISSANEN, K., IKAHEIMONEN, T.K., VLIPIETI, J., MATISHOV, D.G., MATISHOV, G.G., “Plutonium in algae, sediments and biota in the Barents, Pechora and Kara Seas” (Proc. Int. Workshop on Distribution and Speciation of Radionuclides in the Environment), (INABA, J., HISAMATSU, S., OHTSUKA, Y., Eds), Rokkasho, Aomori, Japan (2000) 107–114.
126
RISSANEN, K., MATISHOV, D.G., MATISHOV, G.G., “Radioactivity levels in Barents, Petshora, Kara Sea, Laptev and White Sea” (Proc. Int. Conf. on Environmental Radioactivity in the Arctic, Oslo), Norwegian Radiation Protection Authority, Østerås (1995) 208–214.
127
RISSANEN, K., PEMPKOWIAK, K.J., IKAHEIMONEN, T.K., MATISHOV, D.G., MATISHOV, G.G., “137Cs, 239,240Pu, 90Sr and selected metal concentrations in organs of Greenland seal pups in the White Sea area”, Extended Abstracts of the 4th Int. Conf. on Environmental Radioactivity, Edinburgh, 1999 (STRAND, P., JØLLE, T., Eds), Norwegian Radiation Protection Authority, Østerås (1999) 186–188.
128
RUDJORD, A.L., KOLSTAD, A.K., HELDAL, H.E., “Concentration factors for Tc-99 in lobster (Homarus gammarus) from Norwegian coastal areas”, Isotopes in Environmental Studies — Aquatic Forum 2004 (Proc. Int. Conf. Monaco, 2004) (2006) 318–320.
129

168
Publication ID number
RYAN, T.P., DOWDALL, A.M., McGARRY, A.T., POLLARD, D., CUNNINGHAM, J.D., Po-210 in Mytilus edulis in the Irish marine environment, J. Environ. Radioact. 43 (1999) 325–342.
130
SAZYKINA, T.G., Long-distance radionuclide transfer in the Arctic Seas related to fish migrations, Radiat. Prot. Dosimetry 75 (1998) 219–222.
131
SHUTOV, V.N., et al., “The current radioactive contamination of the environment and foodstuffs in the Kola Region of Russia”, Extended Abstracts of the 4th Int. Conf. on Environmental Radioactivity, Edinburgh, 1999 (STRAND, P., JØLLE, T., Eds), Norwegian Radiation Protection Authority, Østerås (1999) 307–309.
132
SIVINTSEV, Yu.V., et al., Anthropogenic radionuclides in seas bounding Russia. Radioecological Impact of Radioactive Waste Disposal to Arctic and Far East Seas (“WHITE BOOK — 2000”), Moscow, IzdaT (2005) 248 (in Russian).
133
SKWARZEC, B., BOJANOWSKI, R., Po-210 content in sea water and its accumulation in southern Baltic plankton, Mar. Biol. 97 (1988) 301–307.
134
SKWARZEC, B., FALKOWSKI, L., Accumulation of Po-210 in Baltic invertebrates, J. Environ. Radioact. 8 (1988) 99–109.
135
SMITH, V., et al., Technetium-99 in the Irish marine environment, J. Environ. Radioact. 56 (2001) 269–284.
136
STEELE, A.K., Derived concentration factors for Cs-137 in edible species of North Sea fish, Mar. Poll. Bull. 21 (1990) 591–594.
137
STEPNOWSKI, P., SKWARZEC, B., A comparison of Po-210 accumulation in molluscs from the southern Baltic, the coast of Spitsbergen and Sasek Wielki lake in Poland, J. Environ. Radioact. 49 (2000) 201–208.
138
STRAND, P., et al., “Survey of artificial radionuclides in the Kara Sea”, Environmental Radioactivity in the Arctic and Antarctic (STRAND, P., HOLM, E., Eds), Norwegian Radiation Protection Authority, Østerås (1993) 53–65.
139
SUZUKI, H., ISHII, T., IIMURA, M., KOYANAGI, T., “Studies on concentration of minor stable elements in marine environmental samples”, NIRS-R-8, National Institute of Radiological Sciences, Chiba, Japan (1978) 17–21.
140

169
Publication ID number
SUZUKI, H., KOYANAGI, T., SAIKI, M., “Studies on rare earth elements in seawater and uptake by marine organisms”, Impacts of Nuclear Releases into the Aquatic Environment (Proc. Symp. Otaniemi, 1975), IAEA, Vienna (1975) 77–91.
141
SWIFT, D.J., PENTREATH, R.J., The accumulation of plutonium by the edible winkle (Littorina littorea L.), J. Environ. Radioact. 7 (1988) 29–48.
142
TATEDA, Y., KOYANAGI, T., Concentration factors for Cs-137 in Japanese coastal fish (1984–1990), J. Radiat. Res. 37 (1996) 71–79.
143
TATEDA, Y., KOYANAGI, T., Concentration factors for Cs-137 in marine algae from Japanese coastal waters, J. Radiat. Res. 35 (1994) 213–221.
144
TEMPLETON, W.L., “Fission products and aquatic organisms”, The Effects of Pollution on Living Material, Institute for Biology, London (1959) 125–140.
145
VAKULOVSKY, S.M., (Ed.), The Radiation Situation within Russia and Adjacent States in 2007, RosHydromet-SPA Typhoon, Obninsk (2008) (in Russian).
146
VAN AS, D., FOURIE, H.O., VLEGGAAR, C.M., Trace element concentrations in marine organisms from the Cape West Coast South African, J. Sci. 71 (1975) 151–154.
147
VAN WEERS, A.W., “Uptake and loss of 65Zn and 60Co by the mussel Mytilus edulis L.”, Radioactive Contamination of the Marine Environment (Proc. Symp. Seattle, 1972), IAEA, Vienna (1973) 385–401.
148
VAN WEERS, Q.W., VAN RAAPHORST, J.G., “Accumulation of trace metals in coastal marine organisms”, Marine Radioecology (Proc. 3rd OECD/NEA Sem. Tokyo, 1979), OECD, Paris (1980) 303.
149
WANG, W.-X., DEI, R.C.H., Effects of major nutrient additions on metal uptake in phytoplankton, Environ. Pollut. 111 (2001) 233–240.
150
WANG, W.-X., DEI, R.C.H., Influences of phosphate and silicate on Cr(VI) and Se(IV) accumulation in marine phytoplankton, Aquat. Toxicol. 5 (2001) 39–47.
151
WANG, W.-X., DEI, R.C.H., Metal uptake in a coastal diatom influenced by major nutrients (N, P, and Si), Water Res. 35 (2001) 315–321.
152
VINTSUKEVICH, N.V., TOMILIN, Yu.A., Radionuclide distribution in aquatic system (NPP cooling pond-river-sea estuary), Ekologiya 6 (1987) 72–74.
153

170
Publication ID number
YEATS, P., STENSON, G., HELLOU, J., Essential elements and priority contaminants in liver, kidney, muscle and blubber of harp seal beaters, Sci. Total Environ. 243/244 (1999) 157–167.
154
YEN, J., Sorption of plutonium-237 by two species of marine phytoplankton, J. Phycol. 17 (1981) 346–352.
155
YOSHITOME, R., et al., Global distribution of radionuclides (137Cs and 40K) in marine mammals, Environ. Sci. Technol. 37 (2003) 4597–4602.
156
ZHANG, G.H., HU, M.H., HUANG, Y.P., HARRISON, P.J., Se uptake and accumulation in marine phytoplankton and transfer of Se to the calm Puditapes phillippnarum, Mar. Environ. Res. 30 (1990) 179–190.
157
ANDREWS, S.M., COOKE, J.A., “Cadmium within a contaminated grassland ecosystem established on metalliferous mine waste”, Metals in Animals (OSBORN, D., Ed.), CEH Monkswood, Huntingdon (1982).
158
ANDREWS, S.M., JOHNSON, M.S., COOKE, J.A., Distribution of trace-element pollutants in a contaminated grassland ecosystem established on metalliferous fluorspar tailings, 1. Lead, Environ. Poll. 58 (1989) 73–85.
159
BAKUNOV, N.A., PANASENKOVA, O.I., DRICHKO, V.F., 90Sr, 137Cs and natural radionuclides in the ecosystem of a deep lake, Russian J. Ecol. 30 (1998) 361–363 (in Russian).
160
BASTIAN, R.K., JACKSON, W.B., “Cs-137 and Co-60 in a terrestrial community at Enewatak Atoll” (Proc. Symp. 4th Natl Symp. on Radioecology and Energy Resources, Corvallis, OR, 1975), (CUSHING, C.E.J., Ed.), The Ecological Society of American, Special Publication 1 (1975) 314–320.
161
BERESFORD, N.A., Estimating the transfer of 110mAg originating from the Chernobyl accident in west Cumbrian soil and vegetation samples, J. Radiol. Prot. 9 (1989) 281–283.
162
BERESFORD, N.A., et al., Approaches to estimating the transfer of radionuclides to Arctic biota, Radioprotection 40 (2005) S285–S290.
163
BERESFORD, N.A., WRIGHT, S.M., BROWN, J.E., SAZYKINA, T., “Review of approaches for the estimation of radionuclide transfer to reference Arctic biota”, EPIC Deliverable 2, Centre for Ecology and Hydrology, Merlewood (2002).
164

171
Publication ID number
BEYER, W.N., CHANEY, R.L., MULHERN, B.M., Heavy metal concentrations in earthworms from soil amended with sewage sludge, J. Environ. Qual. 11 (1982) 381–385.
165
BUNZL, K., et al., Examination of a relationship between Cs-137 concentrations in soils and plants from alpine pastures, J. Environ. Radioact. 48 (2000) 145–148.
166
BUNZL, K., KRACKE, W., Distribution of 210Pb, 210Po, stable lead and fallout 137Cs in soil, plants and moorland sheep of a heath, Sci. Total Environ. 39 (1984) 143–159.
167
CHRISTALDI, M., IERADI, L.A., MASCANZONI, D., MATTEI, T., Environmental impact of the Chernobyl accident: Mutagenesis in bank voles from Sweden, Int. J. Radiat. Biol. 59 (1991) 31–40.
168
COOPER, K., The Effect of Chronic Radiation on Invertebrate Diversity and Abundance within the Chernobyl Exclusion Zone, MSc Thesis, Liverpool Univ. (2002).
169
COPPLESTONE, D., Coniferous Woodland Ecosystem — Lady Wood. The Food Chain Transfer of Radionuclides through Semi Natural Habitats, Section 3, PhD Thesis, Liverpool Univ. (1996) 77–164.
170
COPPLESTONE, D., The Food Chain Transfer of Radionuclides through Semi Natural Habitats, PhD Thesis, Liverpool Univ. (1996).
171
COPPLESTONE, D., JOHNSON, M.S., JONES, S.R., TOAL, M.E., JACKSON, D., Radionuclide behaviour and transport in a coniferous woodland ecosystem: Vegetation, invertebrates and wood mice, Apodemus sylvaticus, Sci. Total Environ. 239 (1999) 96–109.
172
COUGHTREY, P.J., JACKSON, D., JONES, C.H., THORNE, M.C., Radionuclide Distribution and Transport in Terrestrial and Aquatic Ecosystems — A Critical Review of Data, Vol. 5, A.A. Balkema, Rotterdam (1984).
173
COUGHTREY, P.J., JACKSON, D., THORNE, M.C., Radionuclide Distribution and Transport in Terrestrial and Aquatic Ecosystems — A Critical Review of Data, Vol. 3, A.A. Balkema, Rotterdam (1983).
174
CROSSLEY, D.A.J., “Comparative movement of 106Ru, 60Co and 137Cs in arthropod food chains”, Proc. Symp. 2nd Natl Symp. on Radioecology, Washington (NELSON, D.J., EVANS, F.C., Eds), United States Atomic Energy Commission Rep. CONF-670503, Washington, DC (1973) 687–695.
175

172
Publication ID number
CROSSLEY, D.A.J., “Movement and accumulation of radiostrontium and radiocesium in insects”, Radioecology, Fort Collins, CO, Reinhold Publishing Corporation, The American Institute of Biological Sciences (1961).
176
DAVIDSON, M.F., GOW, C., WATSON, I.N., WELHAM, D., Grass and Soil Sampling around Nuclear Sites: 1996 Report, Rep. NRPB M798, National Radiological Protection Board, Didcot, United Kingdom (1997).
177
VETIKKO, V., SAXEN, R., Application of the ERICA Assessment Tool to freshwater biota in Finland, J. Environ. Radioact. 101 (2010) 82–87.
178
DEITERMANN, W.I., HAUSCHILD, J., ROBENSPALAVINSKAS, E., AUMANN, D.C., Soil-to-vegetation transfer of natural I-127, and of I-129 from global fallout, as revealed by field-measurements on permanent pastures, J. Environ. Radioact. 10 (1989) 79–88.
179
EFROYMSON, R.A., SAMPLE, B.E., SUTER, G.W., Uptake of inorganic chemicals from soil by plant leaves: Regressions of field data, Environ. Toxicol. Chem. 20 (2001) 2561–2571.
180
ENVIRONMENT AGENCY, ENVIRONMENT AND HERITAGE SERVICE, FOOD STANDARDS AGENCY, SCOTTISH ENVIRONMENT PROTECTION AGENCY, Radioactivity in Food and the Environment, 2002, RIFE 8, CEFAS (2003) 1–220.
181
ENVIRONMENT AGENCY, ENVIRONMENT AND HERITAGE SERVICE, FOOD STANDARDS AGENCY, SCOTTISH ENVIRONMENT PROTECTION AGENCY, Radioactivity in Food and the Environment, 2003, RIFE 9, CEFAS (2004) 1–234.
182
ERTEL, J., ZIEGLER, H., Cs-134/137 contamination and root uptake of different forest trees before and after the Chernobyl accident, Radiat. Environ. Biophys. 30 (1991) 147–157.
183
FERENBAUGH, J.K., FRESQUEZ, P.R., EBINGER, M.H., GONZALES, G.J., JORDAN, P.A., Radionuclides in soil and water near a low level disposal site and potential ecological and human health impacts, Environ. Monit. Assess. 74 (2002) 243–254.
184
FOOD STANDARDS AGENCY, SCOTTISH ENVIRONMENT PROTECTION AGENCY, Radioactivity in Food and the Environment, 1999, RIFE 5, CEFAS (2000) 1–180.
185

173
Publication ID number
FOOD STANDARDS AGENCY, SCOTTISH ENVIRONMENT PROTECTION AGENCY, Radioactivity in Food and the Environment, 2000, RIFE 6, CEFAS (2001) 1–186.
186
FOOD STANDARDS AGENCY, SCOTTISH ENVIRONMENT PROTECTION AGENCY, Radioactivity in Food and the Environment, 2001, RIFE 7 (2002) 1–194.
187
GASCHAK, S., International Radioecology Laboratory, Slavutych, Ukraine, personal communication, 2007.
188
GASCHAK, S., et al., “Radioecology of small birds in the Chernobyl zone”, Proc. Int. Conf. on Radioactivity in the Environment, Nice, 2005 (STRAND, P., BORRETZEN, P., JØLLE, T., Eds), Norwegian Radiation Protection Authority, Østerås (2005) 494–497.
189
GASCHAK, S., CHIZHEVSKY, I., ARKHIPOV, A., BERESFORD, N.A., BARNETT, C.L., “The transfer of 137Cs and 90Sr to wild animals within the Chernobyl exclusion zone”, Protection of the Environment from the Effects of Ionizing Radiation (Proc. Int. Conf. Stockholm, 2003), IAEA, Vienna (2005) (on accompanying CD-ROM).
190
GASO, I., SEGOVIA, N., MORTON, O., In situ biological monitoring of radioactivity and metal pollution in terrestrial snails Helix aspersa from a semiarid ecosystem, Radioprotection 37 (2002) 865–871.
191
GASO, M.I., SEGOVIA, N., MORTON, O., Environmental impact assessment of uranium ore mining and radioactive waste around a storage centre from Mexico, Radioprotection 40 (2005) S739–S745.
192
GASTBERGER, M., STEINHAUSLER, F., GERZABEK, M.H., LETTNER, H., HUBMER, A., Soil-to-plant transfer of fallout caesium and strontium in Austrian lowland and Alpine pastures, J. Environ. Radioact. 49 (2000) 217–233.
193
GILHEN, M., Current radionuclide activity concentrations in the Chernobyl Exclusion Zone and an assessment of the ecological impact, MSc Thesis, Liverpool Univ. (2001).
195
GREEN, N., HAMMOND, D.J., DAVIDSON, M.F., WILKINS, B.T., WILLIAMS, B., The radiological impact of naturally occurring radionuclides in foods from the wild, Rep. NRPB-W30, National Radiological Protection Board, Didcot, United Kingdom (2002).
196

174
Publication ID number
HANSON, W.C., “Transuranic elements in arctic tundra ecosystems”, Transuranic Elements in the Environment, Rep. DOE/TIC-22800 (HANSON, W.C., Ed.), USDOE, Washington, DC (1980) 441–458.
197
HASCHEK, W.M., LISK, D.J., STEHN, R.A, “Accumulation of lead in rodents from two old orchard sites in New York”, Animals as Monitors of Environmental Pollutants (NIELSEN, S.W., MIGAKI, G., SCARPELLI., D.G., Eds), National Academy of Sciences, Washington, DC (1979) 192–199.
198
HENDRIKS, A.J., MA, W.C., BROUNS, J.J., DE RUITER-DIJKMAN, E.M., GAST, R., Modelling and monitoring organochlorine and heavy metal accumulation in soils, earthworms, and shrews in Rhine-delta floodplains, Arch. Environ. Contam. Toxicol. 29 (1995) 115–127.
199
HINTON, T.G., KNOX, A.S., KAPLAN, D.I., SARITZ, R., Phytoextraction of uranium and thorium by native trees in a contaminated wetland, J. Radioanal. Nucl. Chem. 264 (2005) 417–422.
200
HOLTZMAN, R.B., “Radium-226 and the natural airborne of 210Pb and 210Po in Arctic biota”, Proc. First Int. Congr. on Radiation Protection, Italy, 1966, Part 2 (SNYDER, W.S., et al., Eds), Pergamon Press, New York (1968) 1087–1096.
201
HUNTER, B.A., JOHNSON, M.S., “Food chain relationship of copper and cadmium in herbivorous and insectivorous small mammals”, Metals in Animals (OSBORN, D., Ed.), CEH Monkswood, Huntingdon (1984) 5–10.
202
HUSSEIN, M.A., OBUID-ALLAH, A.H., MOHAMMAD, A.H., SCOTT-FORDSMAND, J.J., EL-WAKEIL, K.F.A., Seasonal variation in heavy metal accumulation in subtropical population of the terrestrial isopod, Porcellio laevis, Ecotoxicol. Environ. Saf. 63 (2006) 168–174.
204
JAGOE, C.H., MAJESKE, A.J., OLEKSYK, T.K., GLENN, T.C., SMITH, M.H., Radiocesium concentrations and DNA strand breakage in two species of amphibians from the Chernobyl exclusion zone, Radioprotection Colloq. 37 (2002) C1 873–878.
205
JAMES, S.M., LITTLE, E.E., SEMLITSCH, R.D., The effect of soil composition and hydration on the bioavailability and toxicity of cadmium to hibernating juvenile American toads (Bufo americanus), Environ. Poll. 132 (2004) 523–532.
206
JANSSEN, M.P.M., GLASTRA, P., LEMBRECHTS, J.F.M.M., Uptake of Cs-134 from a sandy soil by two earthworm species: The effects of temperature, Arch. Environ. Contam. Toxicol. 31 (1996) 184–191.
207

175
Publication ID number
JOHANSON, K.J., “Radiocaesium in game animals in Nordic countries”, Nordic Radioecology — The Transfer of Radionuclides through Nordic Ecosystems to Man (DAHLGARRD, H., Ed.), Elsevier, Amsterdam (1994) 287–301.
208
JOHANSON, K.J., BERGSTROM, R., Radiocesium transfer to man from moose and roe deer in Sweden, Sci. Total Environ. 157 (1994) 309–316.
209
JOHANSON, K.J., BERGSTROM, R., ERIKSSON, O., ERIXON, A., Activity concentrations of Cs-137 in moose and their forage plants in mid-Sweden, J. Environ. Radioact. 22 (1994) 251–267.
210
JOHNSON, M.S., ROBERTS, R.D., Distribution of lead, zinc and cadmium in small mammals from polluted environments, Oikos 30 (1978) 153–159.
211
JONES, K.C., PETERSON, P.J., DAVIES, B.E., MINSKI, M.J., Determination of silver in plants by flameless atomic-absorption spectrometry and neutron-activation analysis, Int. J. Environ. Anal. Chem. 21 (1985) 23–32.
212
KARASOV, W.H., JUNG, R.E., VAN DEN LANGENBERG, S., BERGESON, T.L.E., Field exposure of frog embryos and tadpoles along a pollution gradient in the Fox River and Green River ecosystem in Wisconsin, USA, Environ. Toxicol. Chem. 24 (2005) 942–953.
213
KAURANEN, P., MIETTINEN, J.K., Po-210 and Pb-210 in the Arctic food chain and the natural radiation exposure of Lapps, Health Phys. 16 (1969) 287–295.
214
LAPHAM, S.C., MILLARD, J.B., SAMET, J.M., Health implications of radionuclide levels in cattle raised near U mining and milling facilities in Ambrosia Lake, New Mexico, Health Phys. 56 (1989) 327–340.
215
LITTLE, C.A., “Plutonium in a grassland ecosystem“, Transuranic Elements in the Environment, Rep. DOE/TIC-22800 (HANSON, W.C., Ed.), USDOE, Washington, DC (1980) 420–440.
216
LITVER, B.Ya., NIZHNIKOV, A.I., RAMZAEV, P.V., TEPLYKH, L.A., TROITSKAYA, M.N., Pb-210, Po-210, Ra-226, Th-228 in the biosphere of Far North of USSR, Atomizdat, Moscow (1976) (in Russian).
217
LUBASHEVSKY, N., et al., Radioactive contamination of the Yamal Peninsula and assessment of radiation protection of its population, Ecology 4 (1993) 39–45 (in Russian).
218

176
Publication ID number
MA, W.C., The influence of soil properties and worm-related factors on the concentration of heavy metals in earthworms, Pedobiologia 24 (1982) 109–119.
219
MAHON, D.C., MATHEWS, R.W., Uptake of naturally-occurring radioisotopes by vegetation in a region of high radioactivity, Can. J. Soil Sci. 63 (1983) 281–290.
220
MARKHAM, O.D., PUPHAL, K.W., FILER, T.D., Radionuclides in soil and water near a low level disposal site and potential ecological and human health impacts, Environ. Monit. Assess. 7 (1978) 422–428.
221
MIETELSKI, J.W., “Plutonium in the environment of Poland (a review)”, Plutonium in the Environment (Proc. Second Int. Symp. Osaka, 1999), (KUDO, A., Ed.), Elsevier, Amsterdam (2001) 401–412.
222
MIETELSKI, J.W., et al., Cs-137, K-40, Sr-90, Pu-238, Pu-239+240, Am-241 and Cm243+244 in forest litter and their transfer to some species of insects and plants in boreal forests: Three case studies, J. Radioanal. Nucl. Chem. 262 (2004) 645–660.
223
MINISTRY OF AGRICULTURE, FISHERIES FOOD, Radioactivity in Food and the Environment, 1995, RIFE 1 (1996) 1–141.
224
MINISTRY OF AGRICULTURE, FISHERIES FOOD, SCOTTISH ENVIRONMENT PROTECTION AGENCY, Radioactivity in Food and the Environment, 1996, RIFE 2 (1997) 1–151.
225
MINISTRY OF AGRICULTURE, FISHERIES FOOD, SCOTTISH ENVIRONMENT PROTECTION AGENCY, Radioactivity in Food and the Environment, 1997, RIFE 3 (1998) 1–166.
226
MINISTRY OF AGRICULTURE, FISHERIES FOOD, SCOTTISH ENVIRONMENT PROTECTION AGENCY, Radioactivity in Food and the Environment, 1998, RIFE 4 (1999) 1–178.
227
MIRETSKY, G., ALEKSEEV, P.V., RAMZAEV, O.A., TEODOROVICH, I.E., SHUVALOV, I.E., “New radioecological data for the Russian Federation (from Alaska to Norway)”, Environmental Radioactivity in the Arctic and Antarctic (STRAND, P., HOLM, E., Eds), Norwegian Radiation Protection Authority, Østerås (1993) 69–272.
228

177
Publication ID number
MORGAN, J.E., MORGAN, A.J., The distribution of cadmium, copper, lead, zinc and calcium in the tissues of the earthworm Lumbricus rubellus sampled from one uncontaminated and four polluted soils, Oecologia 84 (1990) 559–566.
229
NELIN, P., Radiocesium uptake in moose in relation to home-range and habitat composition, J. Environ. Radioact. 26 (1995) 189–203.
230
NIELSEN, M.G., GISSEL-NIELSEN, G., Selenium in soil-animal relationships, Pedobiologia 15 (1975) 65–67.
231
NOTTEN, M.J.M., OOSTHOEK, A.J.P., ROZEMA, J., AERTS, R., Heavy metal concentrations in a soil-plant-snail food chain along a terrestrial soil pollution gradient, Environ. Pollut. 138 (2005) 178–190.
232
OPYDO, J., UFNALSKI, K., OPYDO, W., Heavy metals in Polish forest stands of Quercus robur and Q. petraea, Water Air Soil Pollut. 161 (2005) 175–192.
233
PETERSON, L.R., TRIVETT, V., BAKER, A.J.M., AGUIAR, C., POLLARD, A.J., Spread of metals through an invertebrate food chain as influenced by a plant that hyperaccumulates nickel, Chemoecology 13 (2003) 103–108.
234
PIETRZAKFLIS, Z., SKOWRONSKASMOLAK, M., Transfer of Pb-210 and Po-210 to plants via root-system and aboveground interception, Sci. Total Environ. 162 (1995) 139–147.
235
PIETRZAKFLIS, Z., RADWAN, I., ROSIAK, L., WIRTH, E., Migration of 137Cs in soils and its transfer to mushrooms and vascular plants in mixed forest, Sci. Total Environ. 186 (1996) 243–250.
236
PIETZ, R.I., PETERSON, J.R., PRATER, J.E., ZENZ, D.R., Metal concentrations in earthworms from sewage sludge amended soils at a strip mine reclamation site, J. Environ. Qual. 13 (1984) 651–654.
237
POKARZHEVSKII, A., ZHULIDOV, A., “Halogens in soil animal bodies: a background level”, Contaminated Soil (VAN DEN BRINK, W.J., BOSMAN, R., ARENDT, F., Eds), Academic Publishers, Dordrecht (1995) 403–404.
238
POKARZHEVSKII, A.D., KRIVOLUTZKII, D.A., Background concentrations of Ra-226 in terrestrial animals, Biogeochem. 39 (1997) 1–13.
239

178
Publication ID number
PRINCE, S.P.M., SENTHILKUMAR, P., SUBBURAM, V., Mulberry-Silkworm food chain — A template to assess heavy metal mobility in terrestrial ecosystems, Environ. Monit. Assess. 69 (2001) 231–238.
240
RAMZAEV, P.V., Hygienic Investigation of Radiation Situation in the Far North of the USSR Attributed to Global Fallout, PhD Thesis, Institute for Radiation Hygiene, Leningrad (1967) (in Russian).
241
RANTAVAARA, A.H., “Transfer of radiocesium through natural ecosystems to foodstuffs of terrestrial origin in Finland”, Transfer of Radionuclides in Natural and Semi-natural Environments (DESMET, G., NASSIMBENI, P., BELLI, M., Eds), Elsevier Applied Science, New York (1990) 202–209.
242
READ, H.J., MARTIN, M.H., The effect of heavy metals on populations of small mammals from woodlands in Avon (England); with particular emphasis on metal concentrations in Sorex araneus L. and Sorex minitus L., Chemosphere 27 (1993) 2197–2211.
243
ROBERTS, R.D., JOHNSON, M.S., HUTTON, M., Lead contamination of small mammals from abandoned metalliferous mines, Environ. Pollut. 15 (1978) 61–69.
244
RYABOKON, N.I., SMOLICH, I.I., KUDRYASHOV, V.P., GONCHAROVA, R.I., Long-term development of the radionuclide exposure of murine rodent populations in Belarus after the Chernobyl accident, Radiat. Environ. Biophys. 44 (2005) 169–181.
245
SAMPLE, B.E., SUTER, G.W., Screening evaluation of the ecological risks to terrestrial wildlife associated with a coal ash disposal site, Hum. Ecol. Risk Assess. 8 (2002) 637–656.
246
SCHEUHAMMER, A.M., BOND, D.E., BURGESS, N.M., RODRIGUE, J., Lead and stable lead isotope ratios in soil, earthworms, and bones of American woodcock (Scolopax minor) from eastern Canada, Environ. Toxicol. Chem. 22 (2003) 2585–2591.
247
SHARMA, R.P., SHUPE, J.L., “Trace metals in ecosystems: Relationships of residues of copper, molybdenum, selenium, and zinc in animal tissues to those in vegetation and soil in the surrounding environment”, Biological Implications of Metals in the Environment, Rep. CONF 750929 (DRUCKER, H., WILDUNG, R.E., Eds), National Technical Information Service, Springfield, VA (1977) 595–608.
248

179
Publication ID number
SHEPPARD, S.C., EVENDEN, W.G., Critical compilation and review of plant-soil concentration ratios for uranium, thorium and lead, J. Environ. Radioact. 8 (1988) 255–285.
249
SHEPPARD, S.C., Application of IUR soil plant database to Canadian settings, AECL-11474, Atomic Energy of Canada Limited, Pinawa (1995).
250
SHEPPARD, S.C., EVENDEN, W.G., MacDONALD, C.R., Variation among chlorine concentration ratios for native and agronomic plants, J. Environ. Radioact. 43 (1999) 65–76.
251
SHEPPARD, S.C., EVENDEN, W.G., Characteristics of plant concentration ratios assessed in a 64-site field survey of 23 elements, J. Environ. Radioact. 11 (1990) 15–36.
252
TSVETNOVA, O.V., SHEGLOV, A.I., 137Cs in components of natural ecosystems in the 30-km zone affected by Smolenskaya nuclear power plant, Vestnik Moskovskogo Universiteta, Pochvovedenie 17 (2009) 3–8 (in Russian).
253
SKUBALA, P., KAFEL, A., Oribatid mite communities and metal bioaccumulation in oribatid species (Acari, Oribatida) along the heavy metal gradient in forest ecosystems, Environ. Pollut. 132 (2004) 51–60.
254
STANICA, F., “Accumulation of different metals in apple tree organs from an unfertilised orchard”, IUR Soil to Plant Transfer Working Group (GERZABEK, M.H., Ed.), International Union of Radioecology, Cadarache, France (1999) 96–100.
255
STARK, K., AVILA, R., WALLBERG, P., Estimation of radiation doses from 137Cs to frogs in a wetland ecosystem, J. Environ. Radioact. 75 (2004) 1–14.
256
TOAL, M.E., COPPLESTONE, D., JOHNSON, M.S., JACKSON, D., JONES, S.R., Quantifying 137Cs aggregated transfer coefficients in a semi-natural woodland ecosystem adjacent to a nuclear reprocessing facility, J. Environ. Radioact. 63 (2002) 85–103.
257
TROITSKAYA, M.N., Hygienic Assessment of Increased Levels of Exposure of Population of the Far North, PhD Thesis, Institute for Radiation Hygiene, Leningrad (1981) (in Russian).
258
VARSKOG, P., NAEUMANN, R., STEINNES, E., Mobility and plant availability of radioactive Cs in natural soil in relation to stable Cs, other alkali elements and soil fertility, J. Environ. Radioact. 22 (1994) 43–53.
259

180
Publication ID number
VERHOVSKAYA, I.N., Radioecological Investigations in Natural Biogeocenoses, Nauka, Moscow (1972) (in Russian).
260
WHICKER, F.W., LITTLE, C.A., WINSOR, T.F., “Plutonium behaviour in the terrestrial environs of the Rocky Flats installation”, Environmental Surveillance around Nuclear Installations (Proc. Symp. Warsaw, 1973), Vol. II, IAEA, Vienna (1974) 89–103.
261
WILLIAMSON, P., EVANS, P.R., Lead: Levels in roadside invertebrates and small mammals, Bull. Environ. Cont. Toxicol. 8 (1972) 280–288.
262
WOOD, M.D., et al., Application of the ERICA Integrated Approach at the Drigg coastal sand dunes, J. Environ. Radioact. 99 (2008) 1484–1495.
263
YOSHIDA, S., MURAMATSU, Y., PEIJNENBURG, W.J.G.M., Multi-element analyses of earthworms for radioecology and ecotoxicology, Radioprotection 40 (2005) S491–S495.
264
ANJOS, R.M., MOSQUERA, B., SANCHES, N., CAMBUI, C.A., MERCIER, H., Caesium, potassium and ammonium distribution in different organs of tropical plants, Environ. Exper. Bot. 65 (2009) 111–118.
265
APPS, M.J., DUKE, M.J.M., STEPHENS NEWSHAM, L.G., A study of radionuclides in vegetation on abandoned uranium tailings, J. Radioanal. Nucl. Chem. Art. 123 (1988) 133–147.
266
BARNETT, C.L., GASCHAK, S., BERESFORD, N.A., HOWARD, B.J., MAKSIMENKO, A., Radionuclide activity concentrations in two species of reptiles from the Chernobyl exclusion zone, Radioprotection 44 (2009) 537–542.
267
BERESFORD, N.A., et al., Estimating the exposure of small mammals at three sites within the Chernobyl exclusion zone — A test application of the ERICA Tool, J. Environ. Radioact. 99 (2008) 1496–1502.
268
BOUDA, S., Uranium in Dartmoor plants of southwest England, J. Geochemical Exploration 26 (1986) 145–150.
269
BRAHIM, S.A., WHICKER, F.W., Plant-soil concentration ratios of Ra-226 for contrasting sites around an active U mine-Mill, Health Phys. 55 (1988) 903–910.
270
DAVY, D.R., O’BRIEN, B.G., The fate of discharged heavy metal in Rum Jungle Environmental Studies, Rep. AAEC/E365, Australian Atomic Energy Commission (1975).
271

181
Publication ID number
DOWDALL, M., et al., Uptake of radionuclides by vegetation at a High Arctic location, Environ. Pollut. 133 (2005) 327–332.
272
GERZABEK, M.H., STREBL, F., TEMMEL, B., Plant uptake of radionuclides in lysimeter experiments, Environ. Pollut. 99 (1998) 93–103.
273
GREEMAN, D.J., ROSE, A.W., WASHINGTON, J.W., DOBOS, R.R., CIOLKOSZ, E.J., Geochemistry of radium in soils of the Eastern United States, Appl. Geochem. 14 (1999) 365–385.
274
GWYNN, J.P., FUGLEI, E., DOWDAL, M., Cs-137 in arctic foxes (Alopex lagopus) on Svalbard, J. Environ. Radioact. 92 (2007) 30–40.
275
HARIDASAN, P.P., PAUL, A.C., DESAI, M.V.M., Natural radionuclides in the aquatic environment of a phosphogypsum disposal area, J. Environ. Radioact. 53 (2001) 155–165.
276
IBRAHIM, S.A., WHICKER, F.W., Plant accumulation and plant-soil concentration ratios of Pb-210 and Po-210 at various sites within a uranium mining and milling operation, Environ. Experim. Bot. 27 (1987) 203–213.
277
IBRAHIM, S.A., WHICKER, F.W., Comparative plant uptake and environmental behavior of U-series radionuclides at a uranium mine-mill, J. Radioanal. Nucl. Chem-Art. 156 (1992) 253–267.
278
IDIZ, E.F., CARLISLE, D., KAPLAN, I.R., Interaction between organic matter and trace metals in a uranium rich bog, Kern County, California, USA, Appl. Geochem. 1 (1986) 573–590.
279
LINSALATA, P., et al., An assessment of soil-to-plant concentration ratios for some natural analogs of the transuranic elements, Health Phys. 56 (1989) 33–46.
280
LINSALATA, P., et al., Transport pathways of Th, U, Ra and La from soil to cattle tissues, J. Environ. Radioact. 10 (1989) 115–140.
281
MASCANZONI, D., Long-term transfer from soil to plant of radioactive corrosion products, Environ. Pollut. 57 (1989) 49–62.
285
MASCANZONI, D., Plant uptake of activation and fission-products in a long-term field-study, J. Environ. Radioact. 10 (1989) 233–249.
286
MISLEVY, P., BLUE, W.G., ROESSLER, C.E., Productivity of clay tailings from phosphate mining 1, Biomass Crops, J. Environ. Qual. 18 (1989) 95–100.
287

182
Publication ID number
MORTVEDT, J.J., Plant and soil relationships of uranium and thorium decay series radionuclides — A review, J. Environ. Qual. 23 (1994) 643–650.
288
PALLER, M.H., JANNICK, T.G., WIKE, L.D., Concentration ratios for small mammals collected from the exposed sediments of a 137Cs contaminated reservoir, J. Environ. Radioact. 90 (2006) 224–235.
289
PAUL, A.C., PILLAI, K.C., Transfer and uptake of radium in a natural and in a technologically modified radiation environment, J. Environ. Radioact. 3 (1986) 55–73.
290
RUMBLE, M.A., BJUGSTAD, A.J., Uranium and radium concentrations in plants growing on uranium mill tailings in South-Dakota, Reclam. Reveg. Res. 4 (1986) 271–277.
292
SIMON, S.L., FRALEY, L., Uptake by sagebrush of uranium progeny injected in situ, J. Environ. Qual. 15 (1986) 345–350.
293
STEINNES, E., GAARE, E., ENGEN, S., Influence of soil acidification in southern Norway on the 137Cs exposure to moose? Sci. Total Environ. 407 (2009) 3905–3908.
294
TOME, F.V., RODRIGUEZ, P.B., LOZANO, J.C., Distribution and mobilization of U, Th and Ra-226 in the plant-soil compartments of a mineralized uranium area in south-west Spain, J. Environ. Radioact. 59 (2002) 41–60.
295
TOME, F.V., RODRIGUEZ, P.B., LOZANO, J.C., Soil-to-plant transfer factors for natural radionuclides and stable elements in a Mediterranean area, J. Environ. Radioact. 65 (2003) 161–175.
296
VANDENHOVE, H., et al., Assessment of radiation exposure in the uranium mining and milling area of Mailuu Suu, Kyrgyzstan, J. Environ. Radioact. 88 (2006) 118–139.
298
BEAK CONSULTANTS, Survey of data on the radionuclide content of fish in Canada, Report prepared for the Atomic Energy Control Board, Ottawa, Canada (1987).
299
BIRD, G., Fate of Co-60 and Cs-134 added to the hypolimnion of a Canadian Shield Lake: Accumulation in biota, Can. J. Fish. Aquat. Sci. 55 (1998) 987–998.
300
BLAYLOCK, B.G., Radionuclide data bases available for bioaccumulation factors for freshwater biota, Nucl. Saf. 23 (1982) 427–438.
301

183
Publication ID number
CARLSSON, S., LIDÉN, K., 137Cs and potassium in fish and littoral plants from a humus-rich oligotrophic lake 1961–1976, Oikos 30 (1978) 126–132.
302
CARVALHO, F.P., OLIVEIRA, J.M., LOPES, I., BATISTA, A., Radionuclides from past uranium mining in rivers of Portugal, J. Environ. Radioact. 98 (2007) 298–314.
303
CHAPMAN, W.H., FISHER, H.L., PRATT, M.W., “Concentration factors of chemical elements in edible aquatic organisms”, Rep. UCRL-50564, National Technical Information Service, Springfield, VA (1968).
304
CLULOW, F.V., DAVE, N.K., LIM, T.P., AVADHANULA, R., Radium-226 in water, sediments, and fish from lakes near the city of Elliot Lake, Ontario, Canada, Environ. Pollut. 99 (1998) 13–28.
305
EDGINGTON, D.N., WAHLGREN, M.A., MARSHALL, J.S., “The behaviour of plutonium in aquatic ecosystems: A summary of studies on the Great Lakes”, Environmental Toxicity of Aquatic Radionuclides: Models and Mechanisms (MILLER, M.W., STANNARD, J.N., Eds), Ann Arbor Science Publishers, Ann Arbor, MI (1976) 45–79.
306
EMERY, R.M., KLOPFER, D.C., GARLAND, T.R., WEIMER, W.C., “The ecological behaviour of plutonium and americium in a freshwater ecosystem”, PNL Annual Report for 1975, Part 2, Ecological Sciences, Rep. BNWL2000, Battelle Pacific Northwest Laboratories, Richland, WA (1976).
307
EYMAN, L.D., TRABALKA, J.R., “Patterns of transuranic uptake by aquatic organisms: Consequences and implications”, Transuranic Elements in the Environment (HANSON, W.C., Ed.), Technical Information Center, USDOE, Oak Ridge, TN (1980) 612–624.
308
GARTEN, C.T., TRABALKA, J.R., BOGLE, M.A., “Comparative food chain behaviour and distribution of actinide elements in and around a contaminated fresh-water pond”, Int. Symp. on Migration in the Terrestrial Environment of Long-lived Radionuclides from the Nuclear Fuel Cycle, Knoxville, TN, 1981 (1981) 12–24.
309
GRAHAM, R.V., BLAYLOCK, B.G., HOFFMAN, F.O., FRANK, M.L., Comparison of selenomethionine and selenite cycling in freshwater experimental ponds, Water Air Soil Pollut. 62 (1992) 25–42.
310

184
Publication ID number
HAMEED, P.S., ASOKAN, R., IYENGAR, M.A.R., KANNAN, V., The freshwater mussel Parreysia favidens (Benson) as a biological indicator of Polonium-210 in a riverine system, Chem. Ecol. 8 (1993) 11–18.
311
HAMEED, P.S., SHAHEED, K., SOMASUNDARAM, S.S.N., A study on distribution of natural radionuclide polonium-210 in a pond ecosystem, J. Biosci. 22 (1997) 627–634.
312
HEWETT, C.J., JEFFERIES, D.F., The accumulation of radioactive caesium from food by the plaice (Pleuronectes platessa) and the brown trout (Salmo trutta), J. Fish Biol. 13 (1978) 143–153.
313
JINKS, S.M., EISENBUD, M., Concentration factors in the aquatic environment, Radiat. Data Rep. 13 (1972) 243–247.
314
KEVERN, N.R., SPIGARELLI, S.A., “Effects of selected limnological factors on the accumulation of cesium-137 fallout by largemouth bass (Micropterus salmoides)”, Proc. 3rd Natl Symp. on Radioecology, Oak Ridge, TN (1971) 354–360.
315
KRUMHOLZ, L.A., Observations on the food population of a lake contaminated by radioactive wastes, Bull. Am. Mus. Nat. Hist. 110 (1956) 277–368.
317
LAMBRECHTS, A., FOULQUIER, L., GARNIER LAPLACE, J., Natural radioactivity in the aquatic components of the main French rivers, Radiat. Prot. Dosimetry 45 (1992) 253–256.
318
LINDNER, G., et al., “Biological transfer and sedimentation of Chernobyl radionuclides in Lake Constance”, Large Lakes: Ecological Structure and Function, Lake Constance (TILZERAND, M.M., SENUYA, C., Eds), Springer-Verlag, Berlin (1990) 265–287.
319
MARCHYULENENE, E.-D.P., Exchange of certain radionuclides between the environment and fresh-water algae, Ecologiya 9 (1978) 163–165 (in Russian).
320
MARSHALL, J.S., WAILERAND, B.J., YAGUCHI, E.M., Plutonium in the Laurentian Great Lakes: Food-chain relationship, Verh. Internat. Verein Limnol. 19 (1975) 323–329.
321
NELSON, D.J., “Cesium-137, and potassium concentrations in white crappie and other Clinch River fish”, Proc. 2nd Natl Symp. on Radioecology, Ann Arbor, MI, 1967, Rep. CONF-670503 (NELSON, D.J., EVANS, F.C., Eds), US Atomic Energy Commission, Washington, DC (1969) 240–248.
322

185
Publication ID number
NEWMAN, M.C., BRISBIN, I.L., Jr., Variation of 137Cs levels between sexes, body sizes, and collection localities of mosquitofish, Gambusia holbrooki (Girard, 1859), inhabiting a reactor cooling reservoir, J. Environ. Radioact. 12 (1990) 131–141.
323
OPHEL, I.L., FRASER, J.M., JUDD, J.M., “Concentration factors and bottom sediments of a freshwater lake”, Radioecology Applied to the Protection of Man and His Environment, Commission of the European Communities, Luxembourg (1972) 509–530.
324
PRESTON, D.F., DUTTON, J.W.R., The concentrations of caesium-137 and strontium-90 in the flesh of brown trout taken from rivers and lakes in the British isles between 1961 and 1966: The variables determining the concentrations and their use in radiological assessments, Water Res. 1 (1967) 475–496.
326
ROWAN, D.J., RASMUSSEN, J.B., Bioaccumulation of radiocesium by fish — The influence of physicochemical factors and trophic structure, Can. J. Fish. Aqua. Sci. 51 (1994) 2388–2410.
327
SHAHEED, K., SOMASUNDARAM, S.S.N., HAMEED, P.S., IYENGAR, M.A.R., A study of polonium-210 distribution aspects in the riverine ecosystem of Kaveri, Tiruchirappalli, India, Environ. Pollut. 95 (1997) 371–377.
328
SHORTI, Z.F., PALUMBO, R.F., OLDON, P.B., DONALDSON, J.R., Uptake of I-131 by biota of Fern Lake, Washington, in a laboratory and field experiment, Ecology 50 (1969) 979–989.
329
TRAPEZNIKOV, A.V., et al., Contamination of the Techa River, the Urals, Health Phys. 65 (1993) 481–488.
331
VANDERPLOEG, H.A., PARZCYK, D.C., WILCOX, W.H., KERCHNER, J.R., JAYE, S.V., Bioaccumulation Factors for Radionuclides in Freshwater Biota, Rep. ORNL-5002, Oak Ridge Natl Lab., Oak Ridge, TN (1975).
332
YANKOVICH, T.L., Compilation of Concentration Ratios for Aquatic Non-human Biota Collected by the Canadian Power Reactors Sector, CANDU Owners Group, Toronto, Ontario (2010) 7.
333
COGEMA — CONOR PACIFIC ENVIRONMENTAL TECHNOLOGIES, Cluff Lake Decommissioning Comprehensive Study, Sections on: Existing Environment and Assessment of Potential Impacts, Saskatoon, Saskatchewan (2000).
334

186
Publication ID number
AREVA, Shea Creek Project Area, Environmental Baseline Investigation 2007–2009, Draft Report, Prepared by Canada North Environmental Services, Saskatoon, Saskatchewan (2010).
336
COGEMA, Cluff Lake Uranium Mine 2004, Environmental Effects Monitoring and Environmental Monitoring Programs, Prepared by Canada North Environmental Services, Saskatoon, Saskatchewan (2005).
339
AREVA, Pore-water Study Using In Situ Dialysis for the Link Lakes at the Rabbit Lake Operation, Prepared by Canada North Environmental Services, Saskatoon, Saskatchewan (2007).
340
COGEMA, McClean Lake Project 1998/99 Environmental Monitoring Program, Prepared by Conor Pacific Environmental Technologies, Saskatoon, Saskatchewan (2000).
342
COGEMA, Cluff Lake Project, Suspension of Operations and Eventual Decommissioning of the TMA, Biological Environment, Prepared by Conor Pacific Environmental Technologies, Saskatoon, Saskatchewan (1998).
343
VERMEULEN, F., et al., Habitat type-based bioaccumulation and risk assessment of metal and As contamination in earthworms, beetles and woodlice, Environ. Pollut. 157 (2009) 3098–3105.
344
AREVA, 2003 Status of the Environment Report, McClean Lake Operation, Prepared by Jacques Whitford Environmental Ltd, Saskatoon, Saskatchewan (2003).
345
COGEMA, McClean Lake Project, Baseline Investigation 1993–1995, Prepared by Terrestrial Aquatic Environmental Managers Ltd, Saskatoon, Saskatchewan (1996).
346
COGEMA RESOURCES CANADA (AREVA), McClean Lake Operation Status of the Environment Report, Assessment Period 2003–2005, Saskatoon, Saskatchewan (2006).
347
AREVA RESOURCES CANADA (AREVA), McClean Lake Operation Status of the Environment Report, Assessment Period 2006–2008, Saskatoon, Saskatchewan (2009).
348
CAMECO, 2008 Lichen and Soil Monitoring Program at the Key Lake Operation, Prepared by Canada North Environmental Services, Saskatoon, Saskatchewan (2009).
349

187
Publication ID number
CAMECO, Beaverlodge Decommissioning, Results of the 2002 Aquatic Biological Investigations at the Dubyna Mine Site Area, Northern Saskatchewan, Prepared by Canada North Environmental Services, Saskatoon, Saskatchewan (2003).
350
CAMECO, Aquatic, Terrestrial, and Heritage Studies for the Rabbit Lake Optimism Tailings Disposal Site, Prepared by Canada North Environmental Services, Saskatoon, Saskatchewan (2009).
354
CAMECO, Biophysical Baseline Program for the Millennium Project Area, Draft Report, Prepared by Canada North Environmental Services, Saskatoon, Saskatchewan (2008).
355
CAMECO, Cigar Lake Project, 2007 Comprehensive Aquatic Environment Monitoring Report, Prepared by Canada North Environmental Services, Saskatoon, Saskatchewan (2008).
356
CAMECO, Pore-water Study Using In Situ Dialysis for the Link Lakes at the Rabbit Lake Operation, Prepared by Canada North Environmental Services, Saskatoon, Saskatchewan (2007).
357
CAMECO, Rabbit Lake Operation, 2008 Comprehensive Aquatic Environment Monitoring Report, Prepared by Canada North Environmental Services, Saskatoon, Saskatchewan (2009).
358
CAMECO, Results of the 2009 Key Lake Northern Pike Chemistry Monitoring Program, Prepared by Canada North Environmental Services, Saskatoon, Saskatchewan (2009).
359
CAMECO, Technical Memorandum — Water Quality Results from Eagle Drill Hole and Dubyna Drill Hole, Prepared by Canada North Environmental Services, Saskatoon, Saskatchewan (2001).
361
CAMECO, The Cigar Lake Uranium Project, Environmental Effects Monitoring and Biological Monitoring Studies 2004 Interpretive Report, Prepared by Canada North Environmental Services, Saskatoon, Saskatchewan (2005).
363
CAMECO, McArthur River Operation, 2007, Comprehensive Aquatic Environment Monitoring Report, Prepared by Canada North Environmental Services, Saskatoon, Saskatchewan (2008).
364

188
Publication ID number
CAMECO, Current Period Environmental Monitoring Program for the Beaverlodge Mine Site — Revision 2, Prepared by Conor Pacific Environmental Technologies, Saskatoon, Saskatchewan (2000).
371
CAMECO, Key Lake State of the Environment Report, Assessment Period 1993–1998, Prepared by Conor Pacific Environmental Technologies and SENES Consultants Ltd, Saskatoon, Saskatchewan (2000).
373
CAMECO, Key Lake Operation Comprehensive Environmental Effects Monitoring Program Interpretive Report, Prepared by Golder Associates, Saskatoon, Saskatchewan (2005).
374
CAMECO, McArthur River Operation Comprehensive Environmental Effects Monitoring Program, Interpretative Report, Prepared by Golder Associates, Saskatoon, Saskatchewan (2005).
376
CAMECO, Rabbit Lake Environmental Effect Monitoring/Environmental Monitoring Program, 2002, Prepared by Golder Associates, Saskatoon, Saskatchewan (2003).
377
CAMECO, Rabbit Lake Uranium Operation Comprehensive Environmental Effect Monitoring Program Interpretive Report, Prepared by Golder Associates, Saskatoon, Saskatchewan (2005).
378
BRITISH NUCLEAR FUELS, ROBERT Database, BNFL Statutory Environmental Database 1971–2004.
381
DRAGOVIC, S., HOWARD, B.J., CABORN, J.A., BARNETT, C.L., MIHAILOVIC, N., Transfer of natural and anthropogenic radionuclides to ants, bryophytes and lichen in a semi-natural ecosystem, Environ. Monit. Assess. 166 (2010) 667–686.
382
SAXEN, R., OUTOLA, I., “Polonium-210 in freshwater and brackish environment”, Deliverable Report for NKS-B, October 2008, GAPRAD — Filling Knowledge Gaps in Radiation Protection Methodologies for Non-human Biota (GJELSVIK, R., BROWN, J.E., Eds), Nordic Nuclear Safety Research, Roskilde, Denmark (2009) 13–21.
383
BROWN, J., et al., Filling Knowledge Gaps in Radiation Protection Methodologies for Non-human Biota, Final Summary Report, Nordic Nuclear Safety Research Report, NKS, Roskilde, Denmark 17 (2009).
384

189
Publication ID number
YUN, J.Y., et al., Marine Environmental Radioactivity Survey Data, Rep. KINS/ER-092, Vol. 3, Korea Institute of Nuclear Safety (2007).
385
LEE, D.M., et al., Marine Environmental Radioactivity Survey Data, Rep. KINS/ER-092, Vol. 2, Korea Institute of Nuclear Safety (2006).
386
WILSON, R.C., WATTS, S.J., VIVES I BATLLE, J., McDONALD, P., Laboratory and field studies of polonium and plutonium in marine plankton, J. Environ. Radioact. 100 (2009) 665–669.
387
DRAGOVIC, S., JANKOVIC MANDIC, L.J., Transfer of radionuclides to ants, mosses and lichens in seminatural ecosystems, Radiat. Environ. Biophys. 49 (2010) 625–634.
388
OUTOLA, I., SAXEN, R., HEINÄVAARA, S., Transfer of Sr-90 into fish in Finnish lakes, J. Environ. Radioact. 100 (2009) 657–664.
389
ADAMOVA, L.I., KIRUSHEVA, E.I., MUSAKKA, T.N., “Radioecology of ecosystem with high level of natural radioactivity, Uranium concentration and chemical forms in alluvial-soddy soils”, Proc. of Institute of Biology, Komi Scientific Center, Ural Division of USSR Academy of Sciences 81 (1987) 105–112 (in Russian).
390
AHMAD, M.K., ISLAM, S., RAHMAN, S. HAQUE, M.R., ISLAM, M.M., Heavy metals in water, sediment and some fishes of Buriganga River, Bangladesh, Int. J. Environ. Res. 4 (2010) 321–332.
391
AL-KAHTANI, M.A., Accumulation of heavy metals in talapia fish (Oreochromis niloticus) from Al-Khadoud spring, Al-Hassa, Saudia Arabia, Amer. J. Appl. Sci. 6 (2009) 2024–2029.
392
ANTONENKO, Т.М., Radioecological Study of 137Cs Accumulation, Distribution and Migration in the Water Bodies of the Steppe Zone of the Ukraine, PhD Thesis, INBUM Sevastopol (1978) (in Russian).
393
APOSTOAER, A.I., et al., Radionuclide Releases from X-10 to the Clinch River — Measurements in the Flesh of Edible Species of Fish, Task 4 Report, Radionuclide Release to the Clinch River from White Oak Creek on the Oak Ridge Reservation — An Assessment of Historical Quantities, Chemrisk/SENES Oak Ridge Inc., Oak Ridge, TN (1999).
394

190
Publication ID number
BEKYASHEVA, T.A., SHUTOV, V.N., BASALAYEVA, L.N., “Effects of soil properties on radiocesium accumulation by natural grasses”, Radioecology of Soil and Plants, Vol. 1, 3rd All-Union Conf. on Agricultural Radiology, Obninsk, 1990, Russian Institute for Agricultural Radiology and Agroecology, Obninsk (1990) 49–50.
395
BOLSUNOVSKY, A.I.A., ERMAKOV, A.I., BURGER, M., DEGERMENDZY, A.G., SOBOLEV, A.I., Accumulation of artificial radionuclides by the Yenisei river aquatic plants in the area affected by the activity of the mining-and-chemical combine, Radiatsionnaya Biologiya Radioekologiya 42 (2002) 194–199 (in Russian).
396
BRENNER, M., SMOAK, J.M., LEEPER, D.A., STREUBERT, M., BAKER, S.M., Radium-226 accumulation in Florida freshwater mussels, Limnol. Oceanogr. 52 (2007) 1614–1623.
397
BURTON, D.T., TURLEY, S.D., FISHER, D.J., GREEN, D.J., SHEDD, T.R., Bioaccumulation of total mercury and monomethylmercury in earthworms Eisenia fetida, Water Air Soil Pollut. 170 (2006) 37–54.
398
CULIOLI, J.-L., FOUQUOIRE, A., CALENDINI, S., MORI, C., ORSINI, A., Trophic transfer of arsenic and antinomy in a freshwater ecosystem: A field study, Aquat. Toxicol. 94 (2009) 286–293.
399
DRITCHKO, V.F., PONIKAROVA, T.M., EFREMOVA, M.A., Uptake 137Cs in Bromopsis inermis L. from peat soil on surface-applied K-fertilizer, Int. Conf. on Radiology of Peatlands, St. Petersburg (1994) 75–79.
400
DUBYNIN, О.D., Migration of 129I in a freshwater ecosystem, Ekologiya 5 (1987) 91–92 (in Russian).
401
DUSHAUSKENE-DUZH, N.-R.F., A Comparative Study into Accumulation of Strontium-90 and Lead-210 in Fresh Water Hydrobionts of the Lithuanian Republic, Candidate Thesis, PhD Thesis, INBUM Sebastopol (1969) (in Russian).
402
FESENKO, S.V., SPIRIDONOV, S.I., SANZHAROVA, N.I., ANISIMOV, V.S., ALEXAKHIN, R.M., Modelling of 137Cs migration in soil-plant system on peaty soils, which was contaminated after the accident at the Chernobyl NPP, Ekologiya 3 (2002) 185–182 (in Russian).
403
FIRSAKOVA, S.K., GREBENSCHIKOVA, N.V., Assimilation of 90Sr and 137Cs by Meadow Vegetation from Sod Layer, Reports of USSR Academy of Agricultural Sciences, Moscow 9 (1980) 19–22 (in Russian).
404

191
Publication ID number
GASHCHAK, S., BERESFORD, N.A., International Radioecology Laboratory, Slavutych, Ukraine; Centre for Ecology and Hydrology, United Kingdom, Personal communication, 2009.
405
GASHCHAK, S., BERESFORD, N.A., MAKSIMENKO, A., VLASCHENKO, A.S., Strontium-90 and caesium-137 activity concentrations in bats in the Chernobyl exclusion zone, Radiat. Environ. Biophys. 49 (2010) 635–644.
406
GILES, M.S., TWINING, J.R., WILLIAMS, A.R., JEFFREE, R.A., DOMEL, R.U., “Rehabilitation of former nuclear test sites in Australia”, Final Report of the Technical Assessment Group for the Maralinga Rehabilitation Project — Study No. 2, Radioecology, Technical Assessment Group, AGPS, Canberra (1990).
407
GOLUBEV, A.P., SIKORSKI, V.G., KALININ, V.N., AFONIN, V.Yu., CHEKAN, G.S., The radioactive contamination dynamics of water body ecosystems of different types in the Chernobyl atomic station alienation zone, Radiobiologiya 47 (2007) 326–329 (in Russian).
408
GREBENSHCHIKOVA, N.V., et al., Investigations of radiocaesium behavior in soil-vegetation cover of Belorussia Polesje after the accident at the Chernobyl NPP, Agrochimiya 1 (1992) 91–99 (in Russian).
409
GUDKOV, D.I., et al., Radionuclides Sr-90, Cs-137, Pu-239+240 and Am-241 in macrophytes of Krasnenskaya holm: Species specificity of concentration and distribution in phytocenoses components, Radiatsionnaya Biologiya Radioekologiya (2001) 206–217 (in Russian).
410
GUDKOV, D.I., et al., The distribution of the radionuclides in the main components of lake ecosystems within the Chernobyl NPP exclusion zone, Radiatsionnaya Biologiya Radioekologiya 45 (2005) 271–280 (in Russian).
411
ILIENKO, A.I., RYABTSEV, I.A., “Strontium-90 and cesium-137 in food chains of freshwater biogeocenosis”, Radioecological Problems of NPP Cooling Ponds, Proc. of Institute of Ecology of Plants and Animals, Ekaterinburg (1978) 81–85 (in Russian).
412
ILYIN, M.I., PEREPELYATNIKOV, G.P., PRISTER, B.S., Effects of radical improvement of natural meadows in the Ukrainian Polessie on radiocaesium transfer from soil into sward, Agrochimiya 1 (1991) 101–105 (in Russian).
413

192
Publication ID number
KHOMICH, V.K., “On biological peculiarities of plants and absorption coefficients — Kn and Kd — for various agricultural crops after the Chernobyl accident”, Radioecology of Soil and Plants, Vol. 1, 3rd All-Union Conf. on Agricultural Radiology, Obninsk, 1990, Russian Institute for Agricultural Radiology, Obninsk (1990) (in Russian).
414
KRYSHEV, A.I., RYABOV, I.N., Model for calculation of fish contamination by 137Cs and its application for lake Kozhanovskoe (Bryansk region), Radiatsionnaya Biologiya Radioekologiya 45 (2005) 338–345 (in Russian).
415
KULIKOV, N.V., CHEBOTINA, M.Ya., “Radioecology of fresh water biosystems”, Proc. Institute of Ecology of Plants and Animals, Nauka, Sverdlovsk (1988) (in Russian).
416
KULIKOV, N.V., CHEBOTINA, M.Ya., BOCHENIN, E.F., Sr-90 and 137Cs accumulation by some components of charophytes biocenosis, Ekologiya 8 (1977) 46–53 (in Russian).
417
KULIKOV, N.V., KULIKOVA, V.G., On 90Sr and 137Cs accumulation by some representatives of freshwater fish in natural conditions, Ekologiya 5 (1977) 45–49 (in Russian).
418
KULIKOV, N.V., MOLCHANOVA, I.V., “Continental radioecology”, Soil and Freshwater Ecosystems, Nauka, Moscow (1975) (in Russian).
419
LEVINA, S.G., SHIBKOVA, D.Z., DERYAGIN, V.V., ZAKHAROV, S.G., POPOVA, I.Ya., Current radioecological conditions of Lake Maly Igish located on the axial part of the East-Urals Radioactive Trace, Radiatsionnaya Biologiya Radioekologiya 46 (2006) 111–116 (in Russian).
420
LEVINA, S.G., ZEMEROVA, Z.P., SHIBKOVA, D.Z., DERYAGIN, V.V., POPOVA, I.Ya., 90Sr and 137Cs in higher aquatic plants of some water basins on the East-Urals radioactive trace: Species features of radionuclide concentration, Radiatsionnaya Biologiya Radioekologiya 46 (2006) 575–583 (in Russian).
421
LEVINA, S.G., POPOVA, I.Ya., ZAKHAROV, S.G., UDACHIN, V.N., DERYAGIN, V.V., “Radioecological and hydrochemical aspects of the man-made radionuclide behaviour in aquatic ecosystems illustrated by the East Urals Radioactive Trail lakes”, Problems of Radioecology and Adjacent Disciplines (URUSKUL, B., IGISH, B., SUNGUL, Eds), Institute of Ecology of Plants and Animals, Ekaterinburg (2005) 375–392 (in Russian).
422
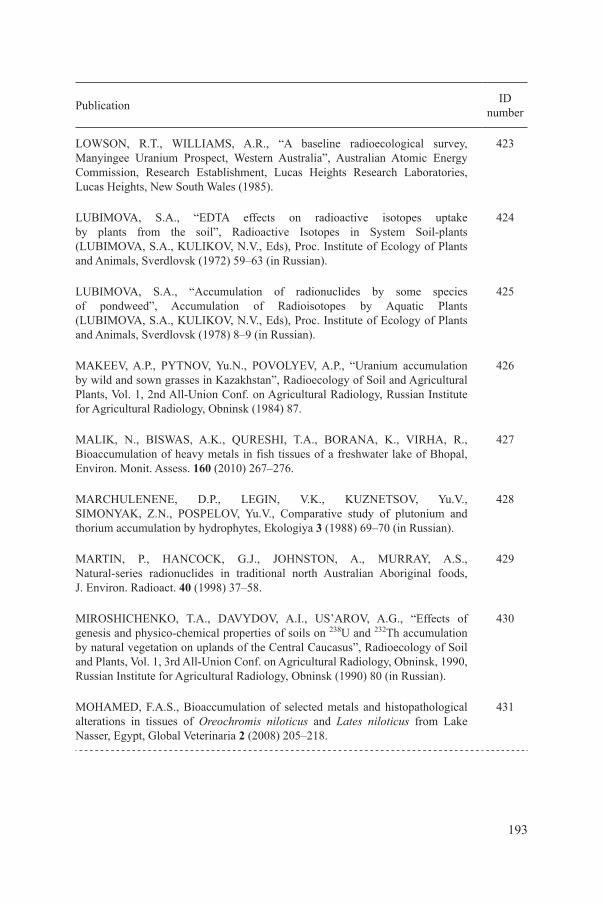
193
Publication ID number
LOWSON, R.T., WILLIAMS, A.R., “A baseline radioecological survey, Manyingee Uranium Prospect, Western Australia”, Australian Atomic Energy Commission, Research Establishment, Lucas Heights Research Laboratories, Lucas Heights, New South Wales (1985).
423
LUBIMOVA, S.A., “EDTA effects on radioactive isotopes uptake by plants from the soil”, Radioactive Isotopes in System Soil-plants (LUBIMOVA, S.A., KULIKOV, N.V., Eds), Proc. Institute of Ecology of Plants and Animals, Sverdlovsk (1972) 59–63 (in Russian).
424
LUBIMOVA, S.A., “Accumulation of radionuclides by some species of pondweed”, Accumulation of Radioisotopes by Aquatic Plants (LUBIMOVA, S.A., KULIKOV, N.V., Eds), Proc. Institute of Ecology of Plants and Animals, Sverdlovsk (1978) 8–9 (in Russian).
425
MAKEEV, A.P., PYTNOV, Yu.N., POVOLYEV, A.P., “Uranium accumulation by wild and sown grasses in Kazakhstan”, Radioecology of Soil and Agricultural Plants, Vol. 1, 2nd All-Union Conf. on Agricultural Radiology, Russian Institute for Agricultural Radiology, Obninsk (1984) 87.
426
MALIK, N., BISWAS, A.K., QURESHI, T.A., BORANA, K., VIRHA, R., Bioaccumulation of heavy metals in fish tissues of a freshwater lake of Bhopal, Environ. Monit. Assess. 160 (2010) 267–276.
427
MARCHULENENE, D.P., LEGIN, V.K., KUZNETSOV, Yu.V., SIMONYAK, Z.N., POSPELOV, Yu.V., Comparative study of plutonium and thorium accumulation by hydrophytes, Ekologiya 3 (1988) 69–70 (in Russian).
428
MARTIN, P., HANCOCK, G.J., JOHNSTON, A., MURRAY, A.S., Natural-series radionuclides in traditional north Australian Aboriginal foods, J. Environ. Radioact. 40 (1998) 37–58.
429
MIROSHICHENKO, T.A., DAVYDOV, A.I., US’AROV, A.G., “Effects of genesis and physico-chemical properties of soils on 238U and 232Th accumulation by natural vegetation on uplands of the Central Caucasus”, Radioecology of Soil and Plants, Vol. 1, 3rd All-Union Conf. on Agricultural Radiology, Obninsk, 1990, Russian Institute for Agricultural Radiology, Obninsk (1990) 80 (in Russian).
430
MOHAMED, F.A.S., Bioaccumulation of selected metals and histopathological alterations in tissues of Oreochromis niloticus and Lates niloticus from Lake Nasser, Egypt, Global Veterinaria 2 (2008) 205–218.
431

194
Publication ID number
MOLCHANOVA, I.V., KARAVAEVA, E.N., “Accumulation of radionuclides by herbs in Beloyarskaya NPP area”, Eco-geochemical Aspects of Radionuclides Migration in Soil-plant System, Vol. 3.2.3 (BOLSHAKOV, V.N., Ed.), Proc. of Institute of Ecology of Plants and Animals, Ekaterinburg (2001) 88–90 (in Russian).
432
MOLCHANOVA, I.V., KARAVAEVA, E.N., “Behaviour of 90Sr and 137Cs in floodplain of River Techa, which was contaminated by liquid sludge of Mayak”, Eco-geochemical Aspects of Radionuclides Migration in Soil-plant System, Vol. 3.3 (BOISHAKOV, V.N., Ed.), Proc. of Institute of Ecology of Plants and Animals, Ekaterinburg (2001) 91–100 (in Russian).
433
MOLCHANOVA, I.V., KARAVAEVA, E.N., “Behaviour of radionuclides in natural ecosystem of Beloyarskaya NPP area”, Eco-geochemical Aspects of Radionuclides Migration in Soil-plant System, Vol. 3.2 (BOLSHAKOV, V.N., Ed.), Proc. of Institute of Ecology of Plants and Animals, Ekaterinburg (2001) 50–62 (in Russian).
434
MOLCHANOVA, I.V., KARAVAEVA, E.N., “Radionuclides behaviour in ecosystem of Chernobyl NPP 30 km area”, Eco-geochemical Aspects of Radionuclides Migration in Soil-plant System, Vol. 4.2 (BOLSHAKOV, V.N., Ed.), Proc. of Institute of Ecology of Plants and Animals, Ekaterinburg (2001) 118–129 (in Russian).
435
MOLCHANOVA, I.V., KARAVAEVA, E.N., “Radionuclides behaviour in natural ecosystems contaminated by liquid radioactive waste of Beloyarskaya NPP”, Eco-geochemical Aspects of Radionuclides Migration in Soil-plant System, Vol. 3.2.2 (BOLSHAKOV, V.N., Ed.), Proc. of Institute of Ecology of Plants and Animals, Ekaterinburg (2001) 72–87 (in Russian).
437
MUSCATELLO, J.R., JANZ, D.M., Selenium accumulation in aquatic biota downstream of a uranium mining and milling operation, Sci. Total Environ. 407 (2009) 1318–1325.
438
NATIONAL INSTITUTE OF RADIOLOGICAL SCIENCE, Studies on the Environmental Transfer Parameters of Radionuclides in the Japanese Biosphere, NIRS Annual, Ministry of Economy, Trade and Industry (METI), Chiba City, Japan (2009).
439
NIFONTOVA, M.G., KULIKOV, N.V., TARSHIS, G.I., DJACHENKO, A.P., Radioecological investigation of natural ecosystems around nuclear power plants, Ekologiya 407 (1988) 40–45.
440

195
Publication ID number
OZTURK, M., OZOZEN, G., MINARECI, O., MINARECI, E., Determination of heavy metals in fish, water and sediments of Avsar dam lake in Turkey, Iran. J. Environ. Health Sci. Eng. 6 (2009) 73–80.
441
PODOLYAK, A.G., The Influence of Agrochemical and Agrotechnics Practices Improvement of the Main Types of Meadows in Belarussian Polesye on 137Cs and 90Sr Transfer into the Herbage, Belarussian Republic Institute of Radiology, Minsk (2002) (in Russian).
442
PODOLYAK, A.G., TIMOFEEV, S.F., PERSIKOVA, T.F., Cesium-137 and strontium-90 transfer to grass stands on peat-bog soils of lowland meadow, Agrochimiya 11 (2004) 63–70 (in Russian).
443
PODOLYAK, A.G., TIMOFEEV, S.F., PERSIKOVA, T.F., Prognosis of accumulation of 137Cs and 90Sr in the herbage of the main types of the Belarus polessje meadows using agrochemical soil properties, Radiatsionnaya Biologiya Radioekologiya 6 (2005) 100–111 (in Russian).
444
ТRAPEZNIKOV, А.V., Radioecology of Freshwater Ecosystems (Exemplified by the Urals Region), PhD Thesis, Institute of Ecology of Plants and Animals, Ekaterinburg (2001) (in Russian).
445
ZESENKO, А.Ya., KULEBYAKINA, L.G., 90Sr content in the Danube mouth and adjacent north-western part of the Black Sea, Ekologiya 5 (1982) 39–43 (in Russian).
446
PRISTER, B.S., LOSHILOV, N.A., NEMETS, O.F., POYARKOV, V.A., “Principles of agricultural radiology”, Radionuclide Behaviour in the Soil-plant System (KLIMENKO, R.F., Ed.), Urozhay Press, Kiev (1988) 163 (in Russian).
448
RASHED, M.N., Monitoring of environmental heavy metals in fish from Nasser Lake, Environment International 27 (2001) 27–33.
449
READ, J., PICKERING, R., Ecological and toxicological effects of exposure to an acid, radioactive tailings storage, Environ. Monit. Assess. 54 (1999) 69–85.
450
SANZHAROVA, N.I., ABRAMOVA, T.N., SHUKHOVTSEV, B.I., “90Sr content in soils and agricultural products”, Problems of Agricultural Radiology, Vol. 4, 3rd All-Union Conf. on Agricultural Radiology, Obninsk, 1990, Russian Institute for Agricultural Radiology, Obninsk (1990) 13–14 (in Russian).
451

196
Publication ID number
SAPEGIN, L.M., TIMOFEEV, S.F., DAYNEKO, N.M., AVSEENKO, S.V., “On reduction in the radionuclide accumulation by the grass stand of floodplain meadow communities of the Dnieper basin”, Radiobiological Congr., Vol. 3, Puschino, Kiev (1993) 888–889 (in Russian).
452
SHUTOV, V.N., BEKYASHEVA, T.A., BASALAYEVA, L.N., BRUK, G.Ya., PAVLOV, I.Yu., Influence of soil properties on 137Cs and 90Sr radionuclides uptake by natural grasses, Pochvovedenie 8 (1993) 67–71 (in Russian).
453
SMAGIN, A.I., The study of the multifactor anthropogenic influence on the ecosystems of the industrial reservoirs of “Mayak” PA, Radiatsionnaya Biologiya Radioekologiya 46 (2006) 94–110 (in Russian).
454
TASKAEV, A.I., Radioecology as an ecological factor of anthropogenic contamination, type of distribution and migration of the U and Th isotopes group in ecosystems with a naturally high level of radioactivity, Proc. of Institute of Biology, Komi Scientific Center, Syktuvkar (1984) 9–27 (in Russian).
455
TIMOFEEVA-RESOVSKAY, E.A., Distribution of radionuclides among the main compartments of freshwater water bodies, Proc. of Institute of Ecology of Plants and Animals, Sverdlovsk (1963) 49–204 (in Russian).
456
TITAEVA, N.A., “Uranium and thorium distribution in plants”, Nuclear Geochemistry (SHCHEHURA, I.I., BARINOVA, N.V., Eds), MSU Press, Moscow (1992) 78–80 (in Russian).
457
WILLIAMS, A.R., The Distribution of Some Naturally Occurring Elements in the Environment of the Yeelirrie Uranium Deposit, Western Australia, Three Baseline Studies in the Environment of the Uranium Deposit at Yeelirrie, AAEC/E447, Australian Atomic Energy Commission, Lucas Heights (1978).
458
TITAEVA, N.A., TOSKAEV, A.I., “Uranium and thorium distribution in plants”, Nuclear Geochemistry (SHCHEHURA, I.I., BARINOVA, N.V., Eds), MSU Press, Moscow (1983) 54–58 (in Russian).
459
TKATCHEVA, V., HOLOPAINEN, I.J., HYVARINEN, H., Heavy metals in perch (Perca fluviatilis) from the Kostomuksha region (North-western Karelia, Russia), Boreal Environ. Res. 5 (2000) 209–220 (in Russian).
460
TRAPEZNIKOV, А.V., MOLCHANOVA, I.V., KARAVAEVA, Е.N., TRAPEZNIKOVA, V.N., “Freshwater ecosystems”, Radionuclide Migration in Freshwater and Terrestrial Ecosystems, Urals Branch of the Russian Academy of Sciences, Ekaterinburg (2007) 356–357 (in Russian).
461

197
Publication ID number
TRAPEZNIKOV, А.V., et al., Radioactive contamination of the river Techa in the Urals, Ekologiya 6 (1993) 72–77 (in Russian).
462
TRAPEZNIKOV, А.V., TRAPEZNIKOVA, V.N., On 60Cо accumulation by freshwater plants in natural conditions, Ekologiya 2 (1979) 104–106 (in Russian).
463
TRAPEZNIKOV, А.V., et al., Radioecological characteristic of the Techa-Iset river system, Ekologiya 9 (2000) 248–256 (in Russian).
464
TRAPEZNIKOVA, V.N., TRAPEZNIKOV, А.V., KULIKOV, N.V., 137Cs accumulation in food fish of the cooling pond of the Beloyarsk NPP, Ekologiya 6 (1984) 36–39 (in Russian).
465
HIGLEY, K.A., Estimating transfer parameters in the absence of data, Radiat. Environ. Biophys. 49 (2010) 645–656.
467
PANCHENKO, S.V., PANFILOVA, A.A., “Regarding the role of the forest ecosystems in exposure of the population”, Problems of Forest Radioecology (PANCHENKO, S.V., Ed.), MOGUL, Moscow (2000) 228–293 (in Russian).
468
TITAEVA, N.A., TOSKAEV, A.I., “Uranium and thorium distribution in plants”, Nuclear Geochemistry (SHCHEHURA, I.I., BARINOVA, N.V., Eds), MSU Press, Moscow (1992) 78–80 (in Russian).
469
ALEXAKHIN, R.M., NARYSHKIN, М.А., Radionuclide Migration in Forest Biogeocenoses (PREVOLOTSKY, A.N., Ed.), Nauka, Moscow (1977) 148 (in Russian).
470
BOGACHEV, A.V., Са and 90Sr migration in the soil-plant system, Problems of Forest Radioecology (PANCHENKO, S.V., Ed.), Gidrometeoizdat, Moscow 302 (2000) 89–101 (in Russian).
471
DVORNIK, A.V., IPATYEV, V.A., “Modelling and predictive estimates of the radionuclide accumulation by woody plants and forest-derived foodstuffs”, Forest. Human. Chernobyl. Forest Ecosystems after the Accident at the Chernobyl NPP: Condition, Prediction, Response of the Population, Ways of Rehabilitation (IPATYEV, V.A., Ed.), Institute of Forest of National Academy of Science, Gomel Retchinsk 454 (2005) 178–213 (in Russian).
472

198
Publication ID number
BULKO, N.I., “The dynamics of radioactive contamination levels of the soil and tree layer”, Forest. Human. Chernobyl. Forest Ecosystems after the Accident at the Chernobyl NPP: Condition, Prediction, Response of the Population, Ways of Rehabilitation (IPATYEV, V.A., Ed.), Gomel Retchinsk 454 (1999) 94–137 (in Russian).
473
IPATYEV, M.A., BULKO, N.I., MITIN, N.V., SHABALEVA, M.A., DIDENKO, L.G., “The hydromeliorative method for decreasing radionuclide concentrations in forest ecosystems”, Radioecological Phenomena of Forest Ecosystems, The Institute of Forest of the National Academy of Science of Belarus, Gomel, Belarus (2004) 137–166 (in Russian).
474
IPATYEV, M.A., BULKO, N.I., MITIN, N.V., SHABALEVA, M.A., DIDENKO, L.G., “The silvicultural (phytologic) method for decreasing radioactivity levels in forest ecosystems”, Radioecological Phenomena of Forest Ecosystems, The Institute of Forest of the National Academy of Science of Belarus, Gomel, Belarus (2004) 67–104 (in Russian).
475
BULKO, N.I., IPATYEV, V.A., Forest. Human. Chernobyl. Forest Ecosystems after the Accident at the Chernobyl NPP: Condition, Prediction, Response of the Population, Ways of Rehabilitation (IPATYEV, V.A., Ed.), The Institute of Forest of the National Academy of Science of Belarus, Gomel, Belarus 454 (2005) 7–303 (in Russian).
476
MARTINOVICH, B.S., GOLUSHKO, R.M., VLASOV, V.K., AFINOGENOV, A.M., Interspecific differences in radionuclide accumulation by woody plants in the Chernobyl zone emissions and their causality, Radioactivity after Nuclear Detonations and Accidents 8 (2000) 187–194 (in Russian).
477
MOLCHANOV, A.A., et al., Some regularities of distribution of fission products deposited in composition of global fallout in forest vegetation, Lesovedenie (1968) 18–23 (in Russian).
478
MUKHAMEDSHIN, K.D., CHILIMOV, А.I., BEZUGLOV, V.K., SNYTKIN, G.V., “Certification of forest resources by the radiation characteristic as the basis to obtain safe forest products in areas affected by radionuclides”, Problems of Forest Radioecology (PANCHENKO, S.V., Ed.), MOGUL, Moscow 302 (2000) 7–46 (in Russian).
479
PEREVOLOTSKY, A.N., 137Cs and 90Sr Distribution in Forest Biogeocenoses (PREVOLOTSKY, A.N., Ed.), Institute for Radiology, Gomel (2006) 124–127 (in Russian).
480

199
Publication ID number
PEREVOLOTSKY, A.N., Effects of Cultivation Conditions on 137Cs and 90Sr Accumulation Levels in Wood and Bark of the Major Stand-forming Species (PREVOLOTSKY, A.N., Ed.), Gomel (2006) 267–273 (in Russian).
482
SHCHEGLOV, A.I., Biogeochemistry of Technogenic Radionuclides in Forest Ecosystems of the Central Regions of the East European Plain, PhD Thesis, Moscow State Univ. (1997) (in Russian).
484
YUSHKOV, P.I., 90Sr and 137Cs accumulation and distribution in birch near the liquid wastes disposal site of the Beloyarskaya NPP, Ekologiya 7 (2000) 106–112 (in Russian).
485
WOOD, M.D., Assessing the Impact of Ionizing Radiation in Temperate Coastal Sand Dunes: Measurement and Modelling, PhD Thesis, Liverpool Univ. (2010).
486
WOOD, M.D., BERESFORD, N.A., SEMENOV, D.V., YANKOVICH, T.L., COPPLESTONE, D., Radionuclide transfer to reptiles, Radiat. Environ. Biophys. 49 (2010) 509–530.
487
WOOD, M.D., LEAH, R.T., JONES, S.R., COPPLESTONE, D., Radionuclide transfer to invertebrates and small mammals in a coastal sand dune ecosystem, Sci. Total Environ. 407 (2009) 4062–4074.
488
VANDENHOVE, H., VAN HEES, M., WANNIJN, J., WOUTERS, K., WANG, L., Can we predict uranium bioavailability based on soil parameters? Part 2: Soil solution uranium concentration not a good bioavailability index, Environ. Pollut. 145 (2006) 577–586.
489
SAXEN, R., et al., Cs-137 in small forest lakes of Finland after the Chernobyl accident, STUK-A236, Helsinki (2009).
490
BOONE, F.W., NG, C., PALMS, J.M., Terrestrial pathways of radionuclide particulates, Health Phys. 41 (1981) 735–747.
491
GALEAS, M.L., ZHANG, L.H., FREEMAN, J.L., WEGNER, M., PILON-SMITS, E.A., Seasonal fluctuations of selenium and sulfur accumulation in selenium hyperaccumulators and related nonaccumulators, New Phytol. 173 (2007) 517–525.
492
GARTEN, C.T., Jr., HOFFMAN, F.O., BONDIETTI, E.A., Field and greenhouse experiments on the fate of technetium in plants and soil, Health Phys. 46 (1984) 647–656.
493

200
Publication ID number
KASHPAROV, V., COLLE, C., LEVCHUK, S., YOSCHENKO, V., ZVARICH, S., Radiochlorine concentration ratios for agricultural plants in various soil conditions, J. Environ. Radioact. 95 (2007) 10–22.
494
WYTTENBACH, A., FURRER, V., TOBLER, L., The concentration ratios plant to soil for the stable elements Cs, Rb and K, Sci. Total Environ. 173/174 (1995) 361–367.
495
SHARMASARKAR, S., VANCE, G.F., Soil and plant selenium at a reclaimed uranium mine, J. Environ. Radioact. 31 (2002) 1516–1521.
497
TSUKADA, H., NAKAMURA, L., Transfer factors of 31 elements in several agricultural plants collected from 150 farm fields in Aomori, Japan, J. Radioanal. Nucl. Chem. 236 (1998) 123–131.
498
TYLER, G., OLSSON, T., Rare earth elements in forest-floor herbs as related to soil conditions and mineral nutrition, Biol. Trace Elem. Res. 106 (2005) 177–192.
499
UCHIDA, S., TAGAMI, K., RUHM, W., STEINER, M., WIRTH, E., Separation of Tc-99 in soil and plant samples collected around the Chernobyl reactor using a Tc-selective chromatographic resin and determination of the nuclide by ICP-MS, Appl. Radiat. Isot. 53 (2000) 69–73.
500
VIDAL, M., et al., Soil- and plant-based countermeasures to reduce Cs-137 and Sr-90 uptake by grasses in natural meadows: The REDUP project, J. Environ. Radioact. 56 (2001) 139–156.
501
BOLLHÖFER, A., BRAZIER, J., HUMPHREY, C., RYAN, B., ESPARON, A., A study of radium bioaccumulation in freshwater mussels, Velesunio angasi, in the Magela Creek catchment, Northern Territory, Australia, J. Environ. Radioact. 102 (2010) 964–974.
502
JOHNSTON, A., Radiation Exposure of Members of the Public Resulting from Operation of the Ranger Uranium Mine, Technical Memorandum 20, Supervising Scientist for the Alligator Rivers Region, Australian Government Publishing Services, Canberra (1987).
504
JOHNSTON, A., MURRAY, A., MARTEN, R., MARTIN, P., PETTERSON, H., Uranium Series Radionuclide Concentrations in Significant Aboriginal Foods, Alligator Rivers Region Research Institute, Research Report 1983–84, Supervising Scientist for the Alligator Rivers Region, Australian Government Publishing Services, Canberra (1984) 43–44.
505

201
Publication ID number
KUMBLAD, L., BRADSHAW, C., Element composition of biota, water and sediment in the Forsmark area, Baltic Sea. Concentrations, bioconcentration factors and partitioning coefficients (Kd) of 48 elements, Technical Rep. SKB TR-08-09, Swedish Nuclear Fuel and Waste Management Co, Stockholm (2008) 1–109, http://www.skb.se/upload/publications/pdf/TR-08-09.pdf
506
MARTIN, P., HANCOCK, G.J., JOHNSTON, A., MURRAY, A.S., Bioaccumulation of Radionuclides in Traditional Aboriginal Foods from the Magela and Cooper Creek Systems, Research Rep. 11, Supervising Scientist for the Alligator Rivers Region, Australian Government Publishing Services, Canberra (1995).
507
RYAN, B., BOLLHÖFER, A., MARTIN, P., Radionuclides and metals in freshwater mussels of the upper South Alligator River, Australia, J. Environ. Radioact. 99 (2008) 509–526.
508
RYAN, B., BOLLHÖFER, A., MEDLEY, P., Bioaccumulation in Terrestrial Plants on Rehabilitated Landforms, ERISS Research Summary 2007–2008, Supervising Science Rep. 200, Supervising Scientist (JONES, D.R., WEBB, A., Eds), Darwin, NT (2009) 152–159.
509
PONIKAROVA, T.M., DRICHKO, V.F., KOMAROV, A.A., SHIDLOVSKAY, T.P., LUNINA, N.F., “Effects of hydrolysis lignin and surface-active substances on radiocaesium accumulation by plants”, Radioecology of Soil and Plants, Vol. 1, 3rd All-Union Conf. on Agricultural Radiology, Obninsk, 1990, Russian Institute for Agricultural Radiology, Obninsk (1990) 87–88 (in Russian).
510
CAMECO, Distribution of Metals in the Aquatic Environment at the Key Lake and McArthur River Operations, Prepared by Golder Associates, Saskatoon, Saskatchewan (2005).
511
TAGAMI, K., UCHIDA, S., Soil-to-plant transfer factors of technetium-99 for various plants collected in the Chernobyl area, J. Nucl. Radiochem. Sci. 6 (2005) 261–264.
512
CLULOW, F.V., MIRKA, M.A., DAVÉ, N.K., LIM, T.P., 226Ra and other radionuclides in water, vegetation, and tissues of Beavers (Castor canadensis) from a watershed containing U tailings near Elliot Lake, Canada, Environ. Pollut. 69 (1991) 277–310.
513
BARRENTO, S., et al., Accumulation of elements (S, As, Br, Sr, Cd, Hg, Pb) in two populations of Cancer pagurus: Ecological implications to human consumption, Food Chem. Toxicol. 47 (2009) 150–156.
514

202
Publication ID number
PENTREATH, R.J., The presence of 237Np in the Irish sea, Mar. Ecol. Prog. Ser. 6 (1981) 243–247.
515
BERESFORD, N.A., HOWARD, B.J., BARNETT, C.L., The uptake by vegetation of Chernobyl and aged radiocaesium in upland west Cumbria, J. Environ. Radioact. 16 (1992) 181–195.
516
ENGDAHL, A., TERNSELL, A., HANNU, S., “Oskarshamn site investigation — Chemical characterisation of deposits and biota”, SKB Rep. P-06-320, Swedish Nuclear Fuel and Waste Management Co, Stockholm (2006).
517
HOPE, B., LOY, C., MILLER, P., Uptake and trophic transfer of barium in a terrestrial ecosystem, Bull. Environ. Cont. Toxicol. 56 (1996) 683–689.
518
LIVENS, F.R., HORRILL, A.D., SINGLETON, D.L., Distribution of radiocesium in the soil-plant systems of upland areas of Europe, Health Phys. 60 (1991) 539–544.
519

203
DEFINITIONS
Where available, definitions are taken from the IAEA Safety Glossary11, in which further information can be found on some of the definitions.
absorbed dose, D. The fundamental dosimetric quantity D, defined as:
dd
Dm
=
where d is the mean energy imparted by ionizing radiation to matter in a volume element and dm is the mass of matter in the volume element.
The energy can be averaged over any defined volume, the average dose being equal to the total energy imparted in the volume divided by the mass in the volume.
Absorbed dose is defined at a point; for the average dose in a tissue or organ.
Unit: gray (Gy), equal to 1 J/kg (formerly, the rad was used).
activity concentration. See specific activity.
allometry. Mathematical relationships between body mass of organisms and various parameters (including radionuclide biological half-life and dietary dry matter intake).
bioaccumulation. The process whereby an organism accumulates substances in living tissues to concentrations higher than those existing in the surrounding media.
bioavailability. Defined as the fraction of the contaminant that can be taken up by living organisms, dependent both on the chemical speciation of the exposure source(s) and on the physiological status of the organism.
11 INTERNATIONAL ATOMIC ENERGY AGENCY, Safety Glossary, Terminology Used in Nuclear Safety and Radiation Protection, 2007 Edition, IAEA, Vienna (2007).

204
biogeochemical analogues. Elements which are assumed to have the same general behaviour under similar environmental/biological conditions.
biological half-life. The time taken for the quantity of a material in a specified tissue, organ or region of the body (or any other specified biota) to halve as a result of biological processes.
conversion factor. Factor used here to enable tissue specific data to be used in the estimation of whole organism concentration ratios.
concentration ratio, CRwo-media. Whole organism concentration ratio: used to quantify the equilibrium activity concentration between an environmental medium and the whole living organism. Previously referred to as concentration factor or bioaccumulation factor. Generally does not include parts of the organism which might be contaminated by environmental media (soil, silt) such as gut, pelt.
dietary component. Components of an animal’s diet, for instance, the different species ingested.
distribution coefficient, Kd. Distribution coefficient used to quantify the equilibrium between solid and liquid phases (soil or sediment–interstitial water), usually expressed in litres per kilogram. It is the ratio of the mass of the solute species adsorbed (or precipitated) on the solid particles per unit of dry mass of the soil or sediment to the solute concentration in the liquid phase. It represents the partition of the solute in the soil or sediment matrix and soil or sediment water, assuming that equilibrium conditions exist between the solid and liquid phases. The Kd values are dependent on the soil or sediment and water physical and chemical characteristics.
dosimetry. The measurement and calculation of radiation dose in matter and tissue resulting from exposure to ionizing radiation.
dynamic model. A model used to express and model the behaviour of the system over time.
environmental medium. The environmental compartment from which the contaminant (radionuclide) is derived. Can be soil, sediment, water or air.

205
equilibrium. In the context of this handbook, the steady state condition in which there is a constant ratio between the activity concentration in an organism and an environmental medium.
exposure pathway. A route by which radiation or radionuclides can reach humans and cause exposure.i An exposure pathway may be very simple, e.g. external exposure from airborne
radionuclides, or a more complex chain, e.g. internal exposure from drinking milk from cows that ate grass contaminated with deposited radionuclides.
i The term ‘exposure pathway’ can be applied to other organisms, e.g. wildlife, with similar caveats. In that case, internal exposure may be from ingestion of meat from a herbivorous prey species that ate grass contaminated with deposited radionuclides.
food chain. Food chains are components of the webs of predator–prey relationships between species within an ecosystem or habitat.
ionic potential. Measure of the strength of attraction of ions, expressed as the ratio of ionic charge Z to ionic radius r, Z:r.
Monte Carlo analysis. Analysis that uses Monte Carlo methods, a class of computational algorithms that rely on repeated random sampling to compute their results. Monte Carlo methods are often used in simulating physical and mathematical systems.
non-human biota. Commonly used term referring to all species other than humans.
phylogenetic relationship. The phylogenetic relationship refers to the relative times in the past that species shared common ancestors.
radionuclide. An unstable nuclide that undergoes spontaneous transformation, emitting ionizing radiation.
reference animals and plants. Group of idealized organisms representative of different environments used to assess radiation effects in the International Commission on Radiological Protection approach, to relate exposure to dose and dose to effect.

206
reference organisms. A series of entities that provide a basis for the estimation of radiation dose rate to a range of organisms that are typical, or representative, of a contaminated environment.
screening. A type of analysis aimed at eliminating from further consideration factors that are less significant for protection or safety in order to concentrate on the more significant factors. This is typically achieved by consideration of very pessimistic hypothetical scenarios.i Screening is usually conducted at an early stage to narrow the range of factors
needing detailed consideration in an analysis or assessment.
source. Anything that may cause radiation exposure — such as by emitting ionizing radiation or by releasing radioactive substances or materials — and can be treated as a single entity for protection and safety purposes.
specific activity. Of a radionuclide, the activity per unit mass of that nuclide. Of a material, the activity per unit mass or volume of the material in which the radionuclides are essentially uniformly distributed.i The distinction in usage between ‘specific activity’ and ‘activity concentration’
is controversial. Some regard the terms as synonymous, and may favour one or the other. ISO 92112 distinguishes between specific activity as the activity per unit mass and activity concentration as the activity per unit volume. Another common distinction is that specific activity is used (usually as activity per unit mass) with reference to a pure sample of a radionuclide or, less strictly, to cases where a radionuclide is intrinsically present in the material (e.g. 14C in organic materials, 235U in natural uranium), even if the abundance of the radionuclide is artificially changed. It is in this context, for 3H and 14C, that specific activity is used in this handbook consistent with Technical Reports Series No. 472 published by the IAEA in 201013. In this usage, activity concentration (which may be activity per unit mass or per unit volume) is used for any other situation (e.g. when the activity is in the form of contamination in or on a material).
i In general, the term ‘activity concentration’ is more widely applicable, is more self-evident in meaning, and is less likely than ‘specific activity’ to be confused with unrelated terms (such as ‘specified activities’). ‘Activity concentration’ is therefore preferred to ‘specific activity’ for general use in safety related IAEA publications.
12 INTERNATIONAL ORGANIZATION FOR STANDARDIZATION, Nuclear Energy — Vocabulary, ISO 921:1997, ISO, Geneva (1997).
13 INTERNATIONAL ATOMIC ENERGY AGENCY, Handbook of Parameter Values for the Prediction of Radionuclide Transfer in Terrestrial and Freshwater Environments, Technical Reports Series No. 472, IAEA, Vienna (2010).

207
uncertainty. Arises from imprecision due to lack of information, expert judgement and/or measurement errors, and could be reduced with increased knowledge and/or experimentation.
uncertainty analysis. An analysis to estimate the uncertainties and error bounds of the quantities involved in, and the results from, the solution of a problem.
wildlife. All non-domesticated plants, animals and other organisms.


209
CONTRIBUTORS TO DRAFTING AND REVIEW
Andersson, P. Swedish Radiation Safety Authority, Sweden
Barnett, C.L. Centre for Ecology and Hydrology, United Kingdom
Beresford, N.A. Centre for Ecology and Hydrology, United Kingdom
Bollhöfer, A. Department of Sustainability, Environment, Water, Population and Communities, Australia
Bradshaw, C. University of Stockholm, Sweden
Brittain, J. University of Oslo, Norway
Brown, J.E. Norwegian Radiation Protection Authority, Norway
Choi, Y.-H. Korea Atomic Energy Research Institute, Republic of Korea
Copplestone, D. University of Stirling, United Kingdom
Dagher, E. Canadian Nuclear Safety Commission, Canada
Dale, P. Scottish Environment Protection Agency, United Kingdom
Doering, C. Department of Sustainability, Environment, Water, Population and Communities, Australia
Dragović, S. Institute for the Application of Nuclear Energy, Serbia
Ernst, P. CANDU Owners Group, Canada
Fesenko, E. Russian Institute of Agricultural Radiology Agroecology, Russian Federation
Fesenko, S. International Atomic Energy Agency
Gaschak, S. International Radioecology Laboratory, Ukraine
Higley, K. Oregon State University, United States of America
Hosseini, A. Norwegian Radiation Protection Authority, Norway
Howard, B.J. Centre for Ecology and Hydrology, United Kingdom
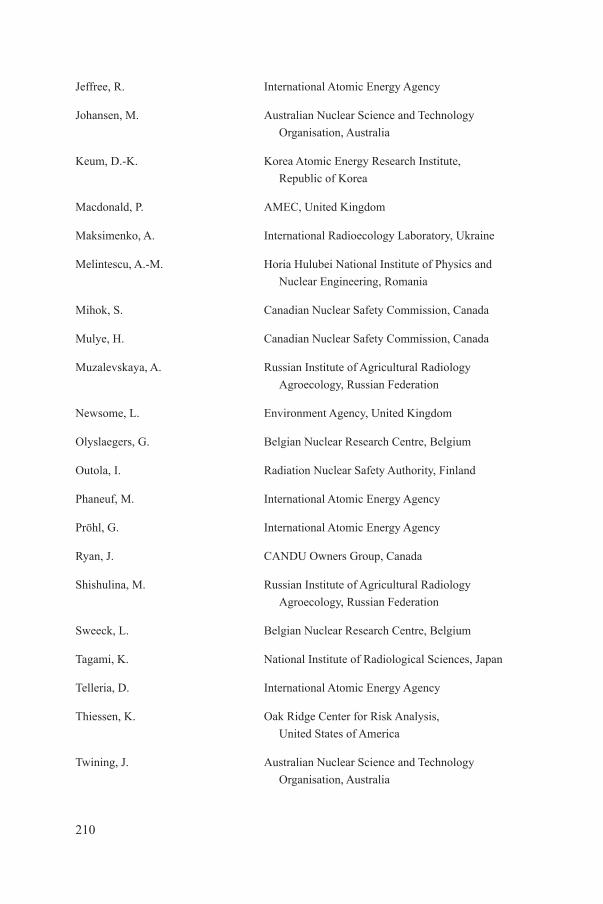
210
Jeffree, R. International Atomic Energy Agency
Johansen, M. Australian Nuclear Science and Technology Organisation, Australia
Keum, D.-K. Korea Atomic Energy Research Institute, Republic of Korea
Macdonald, P. AMEC, United Kingdom
Maksimenko, A. International Radioecology Laboratory, Ukraine
Melintescu, A.-M. Horia Hulubei National Institute of Physics and Nuclear Engineering, Romania
Mihok, S. Canadian Nuclear Safety Commission, Canada
Mulye, H. Canadian Nuclear Safety Commission, Canada
Muzalevskaya, A. Russian Institute of Agricultural Radiology Agroecology, Russian Federation
Newsome, L. Environment Agency, United Kingdom
Olyslaegers, G. Belgian Nuclear Research Centre, Belgium
Outola, I. Radiation Nuclear Safety Authority, Finland
Phaneuf, M. International Atomic Energy Agency
Pröhl, G. International Atomic Energy Agency
Ryan, J. CANDU Owners Group, Canada
Shishulina, M. Russian Institute of Agricultural Radiology Agroecology, Russian Federation
Sweeck, L. Belgian Nuclear Research Centre, Belgium
Tagami, K. National Institute of Radiological Sciences, Japan
Telleria, D. International Atomic Energy Agency
Thiessen, K. Oak Ridge Center for Risk Analysis, United States of America
Twining, J. Australian Nuclear Science and Technology Organisation, Australia

211
Uchida, S National Institute of Radiological Sciences, Japan
Vandenhove, H. Belgian Nuclear Research Centre, Belgium
Vlaschenko, A. Interdepartmental Research Laboratory for the Study of Biodiversity and Nature Reserve Development, Ukraine
Wannijn, J. Belgian Nuclear Research Centre, Belgium
Wells, C. Centre for Ecology and Hydrology, United Kingdom
Willey, N. University of the West of England, United Kingdom
Wilson, R. Westlakes Scientific Consulting Limited, United Kingdom
Wood, M.D. University of Salford, United Kingdom
Yankovich, T. Saskatchewan Research Council, Canada


@ No. 23
ORDERING LOCALLYIn the following countries, IAEA priced publications may be purchased from the sources listed below or from major local booksellers. Orders for unpriced publications should be made directly to the IAEA. The contact details are given at the end of this list.
AUSTRALIADA Information Services648 Whitehorse Road, Mitcham, VIC 3132, AUSTRALIATelephone: +61 3 9210 7777 Fax: +61 3 9210 7788Email: [email protected] Web site: http://www.dadirect.com.au
BELGIUMJean de LannoyAvenue du Roi 202, 1190 Brussels, BELGIUMTelephone: +32 2 5384 308 Fax: +32 2 5380 841Email: [email protected] Web site: http://www.jean-de-lannoy.be
CANADARenouf Publishing Co. Ltd.5369 Canotek Road, Ottawa, ON K1J 9J3, CANADATelephone: +1 613 745 2665 Fax: +1 643 745 7660Email: [email protected] Web site: http://www.renoufbooks.com
Bernan Associates4501 Forbes Blvd., Suite 200, Lanham, MD 20706-4391, USATelephone: +1 800 865 3457 Fax: +1 800 865 3450Email: [email protected] Web site: http://www.bernan.com
CZECH REPUBLICSuweco CZ, spol. S.r.o.Klecakova 347, 180 21 Prague 9, CZECH REPUBLICTelephone: +420 242 459 202 Fax: +420 242 459 203Email: [email protected] Web site: http://www.suweco.cz
FINLANDAkateeminen KirjakauppaPO Box 128 (Keskuskatu 1), 00101 Helsinki, FINLANDTelephone: +358 9 121 41 Fax: +358 9 121 4450Email: [email protected] Web site: http://www.akateeminen.com
FRANCEForm-Edit5 rue Janssen, PO Box 25, 75921 Paris CEDEX, FRANCETelephone: +33 1 42 01 49 49 Fax: +33 1 42 01 90 90Email: [email protected] Web site: http://www.formedit.fr
Lavoisier SAS14 rue de Provigny, 94236 Cachan CEDEX, FRANCETelephone: +33 1 47 40 67 00 Fax: +33 1 47 40 67 02Email: [email protected] Web site: http://www.lavoisier.fr
L’Appel du livre99 rue de Charonne, 75011 Paris, FRANCETelephone: +33 1 43 07 50 80 Fax: +33 1 43 07 50 80Email: [email protected] Web site: http://www.appeldulivre.fr
GERMANYGoethe Buchhandlung Teubig GmbHSchweitzer FachinformationenWillstätterstrasse 15, 40549 Düsseldorf, GERMANYTelephone: +49 (0) 211 49 8740 Fax: +49 (0) 211 49 87428Email: [email protected] Web site: http://www.goethebuch.de
HUNGARYLibrotade Ltd., Book ImportPF 126, 1656 Budapest, HUNGARYTelephone: +36 1 257 7777 Fax: +36 1 257 7472Email: [email protected] Web site: http://www.librotade.hu

INDIAAllied Publishers1st Floor, Dubash House, 15, J.N. Heredi Marg, Ballard Estate, Mumbai 400001, INDIATelephone: +91 22 2261 7926/27 Fax: +91 22 2261 7928Email: [email protected] Web site: http://www.alliedpublishers.com
Bookwell3/79 Nirankari, Delhi 110009, INDIATelephone: +91 11 2760 1283/4536Email: [email protected] Web site: http://www.bookwellindia.com
ITALYLibreria Scientifica “AEIOU”Via Vincenzo Maria Coronelli 6, 20146 Milan, ITALYTelephone: +39 02 48 95 45 52 Fax: +39 02 48 95 45 48Email: [email protected] Web site: http://www.libreriaaeiou.eu
JAPANMaruzen Co., Ltd.1-9-18 Kaigan, Minato-ku, Tokyo 105-0022, JAPANTelephone: +81 3 6367 6047 Fax: +81 3 6367 6160Email: [email protected] Web site: http://maruzen.co.jp
NETHERLANDSMartinus Nijhoff InternationalKoraalrood 50, Postbus 1853, 2700 CZ Zoetermeer, NETHERLANDSTelephone: +31 793 684 400 Fax: +31 793 615 698Email: [email protected] Web site: http://www.nijhoff.nl
Swets Information Services Ltd.PO Box 26, 2300 AA LeidenDellaertweg 9b, 2316 WZ Leiden, NETHERLANDSTelephone: +31 88 4679 387 Fax: +31 88 4679 388Email: [email protected] Web site: http://www.swets.com
SLOVENIACankarjeva Zalozba ddKopitarjeva 2, 1515 Ljubljana, SLOVENIATelephone: +386 1 432 31 44 Fax: +386 1 230 14 35Email: [email protected] Web site: http://www.mladinska.com/cankarjeva_zalozba
SPAINDiaz de Santos, S.A.Librerias Bookshop Departamento de pedidosCalle Albasanz 2, esquina Hermanos Garcia Noblejas 21, 28037 Madrid, SPAINTelephone: +34 917 43 48 90 Fax: +34 917 43 4023 Email: [email protected] Web site: http://www.diazdesantos.es
UNITED KINGDOMThe Stationery Office Ltd. (TSO)PO Box 29, Norwich, Norfolk, NR3 1PD, UNITED KINGDOMTelephone: +44 870 600 5552Email (orders): [email protected] (enquiries): [email protected] Web site: http://www.tso.co.uk
UNITED STATES OF AMERICABernan Associates4501 Forbes Blvd., Suite 200, Lanham, MD 20706-4391, USATelephone: +1 800 865 3457 Fax: +1 800 865 3450Email: [email protected] Web site: http://www.bernan.com
Renouf Publishing Co. Ltd.812 Proctor Avenue, Ogdensburg, NY 13669, USATelephone: +1 888 551 7470 Fax: +1 888 551 7471Email: [email protected] Web site: http://www.renoufbooks.com
United Nations300 East 42nd Street, IN-919J, New York, NY 1001, USATelephone: +1 212 963 8302 Fax: 1 212 963 3489Email: [email protected] Web site: http://www.unp.un.org
Orders for both priced and unpriced publications may be addressed directly to:IAEA Publishing Section, Marketing and Sales Unit, International Atomic Energy AgencyVienna International Centre, PO Box 100, 1400 Vienna, AustriaTelephone: +43 1 2600 22529 or 22488 • Fax: +43 1 2600 29302Email: [email protected] • Web site: http://www.iaea.org/books


14-0
2111

IAEA SAFETY STANDARDS AND RELATED PUBLICATIONS
IAEA SAFETY STANDARDS
Under the terms of Article III of its Statute, the IAEA is authorized to establish or adopt standards of safety for protection of health and minimization of danger to life and property, and to provide for the application of these standards.
The publications by means of which the IAEA establishes standards are issued in the IAEA Safety Standards Series. This series covers nuclear safety, radiation safety, transport safety and waste safety. The publication categories in the series are Safety Fundamentals, Safety Requirements and Safety Guides.
Information on the IAEA’s safety standards programme is available on the IAEA Internet site
http://www-ns.iaea.org/standards/
The site provides the texts in English of published and draft safety standards. The texts of safety standards issued in Arabic, Chinese, French, Russian and Spanish, the IAEA Safety Glossary and a status report for safety standards under development are also available. For further information, please contact the IAEA at: Vienna International Centre, PO Box 100, 1400 Vienna, Austria.
All users of IAEA safety standards are invited to inform the IAEA of experience in their use (e.g. as a basis for national regulations, for safety reviews and for training courses) for the purpose of ensuring that they continue to meet users’ needs. Information may be provided via the IAEA Internet site or by post, as above, or by email to Offi [email protected].
RELATED PUBLICATIONS
The IAEA provides for the application of the standards and, under the terms of Articles III and VIII.C of its Statute, makes available and fosters the exchange of information relating to peaceful nuclear activities and serves as an intermediary among its Member States for this purpose.
Reports on safety in nuclear activities are issued as Safety Reports, which provide practical examples and detailed methods that can be used in support of the safety standards.
Other safety related IAEA publications are issued as Emergency Preparedness and Response publications, Radiological Assessment Reports, the International Nuclear Safety Group’s INSAG Reports, Technical Reports and TECDOCs. The IAEA also issues reports on radiological accidents, training manuals and practical manuals, and other special safety related publications.
Security related publications are issued in the IAEA Nuclear Security Series.The IAEA Nuclear Energy Series comprises informational publications to encourage
and assist research on, and the development and practical application of, nuclear energy for peaceful purposes. It includes reports and guides on the status of and advances in technology, and on experience, good practices and practical examples in the areas of nuclear power, the nuclear fuel cycle, radioactive waste management and decommissioning.
RELATED PUBLICATIONS
www.iaea.org/books
GENERIC MODELS FOR USE IN ASSESSING THE IMPACT OF DISCHARGES OF RADIOACTIVE SUBSTANCES TO THE ENVIRONMENTSafety Reports Series No. 19 STI/PUB/1103 (216 pp.; 2001)ISBN 92–0–100501–6 Price: €51.00
SEDIMENT DISTRIBUTION COEFFICIENTS AND CONCENTRATION FACTORS FOR BIOTA IN THE MARINE ENVIRONMENTTechnical Reports Series No. 422STI/DOC/010/422 (95 pp.; 2004)ISBN 92–0–114403–2 Price: €19.00
HANDBOOK OF PARAMETER VALUES FOR THE PREDICTION OF RADIONUCLIDE TRANSFER IN TERRESTRIAL AND FRESHWATER ENVIRONMENTSTechnical Reports Series No. 472STI/DOC/010/472 (194 pp.; 2010)ISBN 978–92–0–113009–9 Price: €45.00
14-02111_PUBDOC479_cover.indd 4-6 2014-08-26 09:08:57

Technical Reports SeriEs No. 479
INTERNATIONAL ATOMIC ENERGY AGENCYVIENNA
ISBN 978–92–0–100714–8ISSN 0074–1914
There is a well developed system of radiological protection of humans which has been implicitly providing protection to the environment for most exposure scenarios. A complementary systematic framework for radiological protection of the environment, specifically considering exposure of wildlife, only began to evolve over the past decade and is now incorporated in the recommendations of the International Commission on Radiological Protection and is taken into account in IAEA safety standards. For many years, the IAEA has supported efforts to develop models for radiological assessments for members of the public, and for flora and fauna. The most common approach to estimate radionuclide transfer to wildlife is to use a ‘concentration ratio’ to predict the activity concentration of a radionuclide in the whole organism from the activity concentration in the soil, sediment, water or air. This handbook provides generic transfer parameters in the form of concentration ratio values for use in assessment of ionizing radiation exposure to wildlife as a consequence of the presence of radionuclides in the environment.
H a n d b o o k o f P a r a m e t e r V a l u e s
f o r t h e P r e d i c t i o n o f R a d i o n u c l i d e T r a n s f e r
t o W i l d l i f e
Handbook of Param
eter Values for the Prediction of Radionuclide Transfer to Wildlife
technical repor
tS series no. 479
14-02111_PUBDOC479_cover.indd 1-3 2014-08-26 09:08:57