International Agreement Report - nrc.gov · Traditional agreements between the Nuclear Regulatory...
43
NUREG/IA-0420 International Agreement Report Analysis with TRACE Code of Rosa Test 1.2: Small LOCA in the Hot-Leg with HPI and Accumulator Actuation Prepared by: J.L. Munoz-Cobo, A. Romero, S. Chiva Instituto de Ingeniería Energética Universitat Politècnica de Valencia Camí de Vera s/n 46022 Valencia, Spain A. Calvo, NRC Project Manager Division of Systems Analysis Office of Nuclear Regulatory Research U.S. Nuclear Regulatory Commission Washington, DC 20555-0001 Manuscript Completed: Decmeber 2012 Date Published: April 2013 Prepared as part of The Agreement on Research Participation and Technical Exchange Under the Thermal-Hydraulic Code Applications and Maintenance Program (CAMP) Published by U.S. Nuclear Regulatory Commission
Transcript of International Agreement Report - nrc.gov · Traditional agreements between the Nuclear Regulatory...

NUREG/IA-0420
International
Agreement Report
Analysis with TRACE Code of Rosa Test 1.2: Small LOCA in the Hot-Leg with HPI and Accumulator Actuation
Prepared by: J.L. Munoz-Cobo, A. Romero, S. Chiva Instituto de Ingeniería Energética Universitat Politècnica de Valencia Camí de Vera s/n 46022 Valencia, Spain A. Calvo, NRC Project Manager Division of Systems Analysis Office of Nuclear Regulatory Research U.S. Nuclear Regulatory Commission Washington, DC 20555-0001
Manuscript Completed: Decmeber 2012 Date Published: April 2013 Prepared as part of The Agreement on Research Participation and Technical Exchange Under the Thermal-Hydraulic Code Applications and Maintenance Program (CAMP) Published by U.S. Nuclear Regulatory Commission

NRC Reference Material
As of November 1999, you may electronically access NUREG-series publications and other NRC records at NRC’s Public Electronic Reading Room at http://www.nrc.gov/reading-rm.html. Publicly released records include, to name a few, NUREG-series publications; Federal Register notices; applicant, licensee, and vendor documents and correspondence; NRC correspondence and internal memoranda; bulletins and information notices; inspection and investigative reports; licensee event reports; and Commission papers and their attachments.
NRC publications in the NUREG series, NRC regulations, and Title 10, “Energy,” in the Code of Federal Regulations may also be purchased from one of these two sources. 1. The Superintendent of Documents
U.S. Government Printing Office Mail Stop SSOP Washington, DC 20402–0001 Internet: bookstore.gpo.gov Telephone: 202-512-1800 Fax: 202-512-2250
2. The National Technical Information Service Springfield, VA 22161–0002 www.ntis.gov 1–800–553–6847 or, locally, 703–605–6000
A single copy of each NRC draft report for comment is available free, to the extent of supply, upon written request as follows: Address: U.S. Nuclear Regulatory Commission
Office of Administration Publications Branch Washington, DC 20555-0001
E-mail: [email protected] Facsimile: 301–415–2289
Some publications in the NUREG series that are posted at NRC’s Web site address http://www.nrc.gov/reading-rm/doc-collections/nuregs are updated periodically and may differ from the last printed version. Although references to material found on a Web site bear the date the material was accessed, the material available on the date cited may subsequently be removed from the site.
Non-NRC Reference Material
Documents available from public and special technical libraries include all open literature items, such as books, journal articles, transactions, Federal Register notices, Federal and State legislation, and congressional reports. Such documents as theses, dissertations, foreign reports and translations, and non-NRC conference proceedings may be purchased from their sponsoring organization.
Copies of industry codes and standards used in a substantive manner in the NRC regulatory process are maintained at—
The NRC Technical Library Two White Flint North 11545 Rockville Pike Rockville, MD 20852–2738
These standards are available in the library for reference use by the public. Codes and standards are usually copyrighted and may be purchased from the originating organization or, if they are American National Standards, from—
American National Standards Institute 11 West 42nd Street New York, NY 10036–8002 www.ansi.org 212–642–4900
AVAILABILITY OF REFERENCE MATERIALS IN NRC PUBLICATIONS
Legally binding regulatory requirements are stated only in laws; NRC regulations; licenses, including technical specifications; or orders, not in NUREG-series publications. The views expressed in contractor-prepared publications in this series are not necessarily those of the NRC. The NUREG series comprises (1) technical and administrative reports and books prepared by the staff (NUREG-XXXX) or agency contractors (NUREG/CR-XXXX), (2) proceedings of conferences (NUREG/CP-XXXX), (3) reports resulting from international agreements (NUREG/IA-XXXX), (4) brochures (NUREG/BR-XXXX), and (5) compilations of legal decisions and orders of the Commission and Atomic and Safety Licensing Boards and of Directors’ decisions under Section 2.206 of NRC’s regulations (NUREG-0750). DISCLAIMER: This report was prepared under an international cooperative agreement for the exchange of technical information. Neither the U.S. Government nor any agency thereof, nor any employee, makes any warranty, expressed or implied, or assumes any legal liability or responsibility for any third party’s use, or the results of such use, of any information, apparatus, product or process disclosed in this publication, or represents that its use by such third party would not infringe privately owned rights.

NUREG/IA-0420
International
Agreement Report
Analysis with TRACE Code of Rosa Test 1.2: Small LOCA in the Hot-Leg with HPI and Accumulator Actuation
Prepared by: J.L. Munoz-Cobo, A. Romero, S. Chiva Instituto de Ingeniería Energética Universitat Politècnica de Valencia Camí de Vera s/n 46022 Valencia, Spain A. Calvo, NRC Project Manager Division of Systems Analysis Office of Nuclear Regulatory Research U.S. Nuclear Regulatory Commission Washington, DC 20555-0001
Manuscript Completed: Decmeber 2012 Date Published: April 2013 Prepared as part of The Agreement on Research Participation and Technical Exchange Under the Thermal-Hydraulic Code Applications and Maintenance Program (CAMP) Published by U.S. Nuclear Regulatory Commission


iii
ABSTRACT The goal of this report is to explain the main results obtained in the simulations performed with the consolidated code TRACE for the OCDE stratification test ROSA 1.2. The transient was produced by a small break in the hot leg of the loop B of the LSTF facility in Japan. In the experiment, the small break was simulated by a small diameter fissure located at the bottom of the hot-leg. The goal of this report is to analyze the capabilities of the TRACE code to cope with cases where thermal stratifications in the cold and hot legs take place. For this transient is very important the ability of TRACE to predict correctly the fluid regime in the hot leg. At the beginning of the transient the fluid discharged through the bottom of the hot leg is at liquid state and the mass flow rate discharged through the break is very high, and as a consequence the pressure drop very fast during the first seconds of the transient until the beginning of the HPI injection. This behaviour is predicted very well by TRACE code. Later, the flow at the hot leg becomes two-phase with low void fraction, and the mass flow rate discharged through the break is still high because the TRACE off-take model considers the fact that at the bottom of the hot leg we have liquid. Finally, the flow in the hot leg becomes biphasic with high void fraction and we discharge mainly steam through the break. In this test, the contraction of the fluid vein during the steam discharge has an important influence on the depressurization rate during the steam regime. The injection of the HPI in the cold leg produces a significant thermal stratification in the cold leg that attains the value of 100 ºC, but the TRACE code predicts well the average temperature in the cold leg.

v
FOREWORD Extensive knowledge and techniques have been produced and made available in the field of thermal-hydraulic responses during reactor transients and accidents, and major system computer codes have achieved a high degree of maturity through extensive qualification, assessment and validation processes. Best-estimate analysis methods are increasingly used in licensing, replacing the traditional conservative approaches. Such methods include an assessment of the uncertainty of their results that must be taken into account when the safety acceptance criteria for the licensing analysis are verified. Traditional agreements between the Nuclear Regulatory Commission of the United States of America (USNRC) and the Consejo de Seguridad Nuclear of Spain (CSN) in the area of nuclear safety research have given access to CSN to the NRC-developed best estimate thermalhydraulic codes RELAP5, TRAC-P, TRAC-B, and currently TRACE. These complex tools, suitable state-of-the-art application of current two-phase flow fluid mechanics techniques to light water nuclear power plants, allow a realistic representation and simulation of thermalhydraulic phenomena at normal and incidental operation of NPP. Owe to the huge required resources, qualification of these codes have been performed through international cooperation programs. USNRC CAMP program (Code Applications and Maintenance Program) represents the international framework for verification and validation of NRC TH codes, allowing to:
• Share experience on code errors and inadequacies, cooperating in resolution of deficiencies and maintaining a single, internationally recognized code version.
• Share user experience on code scaling, applicability, and uncertainty studies. • Share a well documented code assessment data base. • Share experience on full scale power plant safety-related analyses performed with codes
(analyses of operating reactors, advanced light water reactors, transients, risk-dominant sequences, and accident management and operator procedures-related studies).
• Maintain and improve user expertise and guidelines for code applications. Since 1984, when the first LOFT agreement was settled down, CSN has been promoting coordinated joint efforts with Spanish organizations, such as UNESA (the association of Spanish electric energy industry) as well as universities and engineering companies, in the aim of assimilating, applying, improving and helping the international community in the validation of these TH simulation codes1, within different periods of the associated national programs (e.g., CAMP-España). As a result of these actions, there is currently in Spain a good collection of productive plant models as well as a good selection of national experts in the application of TH simulation tools, with adequate TH knowledge and suitable experience on their use. Many experimental facilities have contributed to the today’s availability of a large thermal-hydraulic database (both separated and integral effect tests). However there is continued need for additional experimental work and code development and verification, in areas where no emphasis have been made along the past. On the basis of the SESAR/FAP2 reports “Nuclear Safety Research in OECD Countries:Major Facilities and Programmes at Risk” (SESAR/FAP, 2001) and its 2007 updated version “Support Facilities for Existing and Advanced Reactors (SFEAR) NEA/CSNI/R(2007)6”, CSNI is promoting since 2001 several collaborative international actions in the area of experimental TH research. These reports presented some findings and recommendations to the CSNI, to sustain an adequate level of research, identifying a number of experimental facilities and programmes of potential interest for present or future international collaboration within the safety community during the coming decade. CSN, as Spanish representative in CSNI, is involved in some of these research activities, helping in this international support of facilities and in the establishment of a large network of international
1 It’s worth to note the emphasis made in the application to actual NPP incidents. 2 SESAR/FAP is the Senior Group of Experts on Nuclear Safety Research Facilities and Programmes of NEA Committee on the Safety of Nuclear Installations (CSNI).

vi
collaborations. In the TH framework, most of these actions are either covering not enough investigated safety issues and phenomena (e.g., boron dilution, low power and shutdown conditions), or enlarging code validation and qualification data bases incorporating new information (e.g., multi-dimensional aspects, non-condensable gas effects). In particular, CSN is currently participating in the PKL and ROSA programmes. The PKL is an important integral test facility operated by of AREVA-NP in Erlangen (Germany), and designed to investigate thermal-hydraulic response of a four-loop Siemens designed PWR. Experiments performed during the PKL/OECD program have been focused on the issues:
• Boron dilution events after small-break loss of coolant accidents. • Loss of residual heat removal during mid-loop operation (both with closed and open reactor
coolant system. ROSA/LSTF of Japan Atomic Energy Research Institute (JAERI) is an integral test facility designed to simulate a 1100 MWe four-loop Westinghouse-type PWR, by two loops at full-height and 1/48 volumetric scaling to better simulate thermal-hydraulic responses in large-scale components. The ROSA/OECD project has investigated issues in thermal-hydraulics analyses relevant to water reactor safety, focusing on the verification of models and simulation methods for complex phenomena that can occur during reactor transients and accidents such as:
• Temperature stratification and coolant mixing during ECCS coolant injection • Water hammer-like phenomena • ATWS • Natural circulation with super-heated steam • Primary cooling through SG depressurization • Pressure vessel upper-head and bottom break LOCA
This overall CSN involvement in different international TH programmes has outlined the scope of the new period of CAMP-España activities focused on:
• Analysis, simulation and investigation of specific safety aspects of PKL/OECD and ROSA/OECD experiments.
• Analysis of applicability and/or extension of the results and knowledge acquired in these projects to the safety, operation or availability of the Spanish nuclear power plants.
Both objectives are carried out by simulating experiments and plant application with the last available versions of NRC TH codes (RELAP5 and TRACE). A CAMP in-kind contribution is aimed as end result of both types of studies. Development of these activities, technically and financially supported by CSN, is being carried out by 5 different national research groups (Technical Universities of Madrid, Valencia and Cataluña). On the whole, CSN is seeking to assure and to maintain the capability of the national groups with experience in the thermal hydraulics analysis of accidents of the Spanish nuclear power plants.
________________________________
Francisco Fernández Moreno, Commissioner Consejo de Seguridad Nuclear (CSN)

vii
CONTENTS
Page ABSTRACT .................................................................................................................................. iii FOREWORD ................................................................................................................................ v FIGURES .................................................................................................................................... viii TABLES ...................................................................................................................................... viii EXECUTIVE SUMMARY ............................................................................................................. ix ACKNOWLEDGEMENTS ............................................................................................................ xi ABBREVIATIONS ....................................................................................................................... xiii 1. INTRODUCTION ................................................................................................................. 1-1 2. INITIAL AND BOUNDARY CONDITIONS .......................................................................... 2-1
2.1 Description of the LSTF facility ...................................................................................... 2-1 2.2 Stationary initial conditions for ROSA 1.2 test and results of TRACE code .................... 2-2 2.3 Test conditions and set points ....................................................................................... 2-3
3. TEST RESULTS AND COMPARISON WITH TRACE ......................................................... 3-1
3.1 Beginning of the transient .............................................................................................. 3-1 3.2 Evolution of the transient after the injection of the ECCS system: thermal
stratification effects in the cold leg ................................................................................ 3-2 3.3 Long term evolution of the transient after the injection of the HPIS +
Accumulator: Effect on the liquid level, void fraction of the primary loop, and mass flow rate through the break ................................................................................. 3-3
4. CONCLUSIONS .................................................................................................................. 4-1 5. REFERENCES ................................................................................................................... 5-1

viii
FIGURES Page
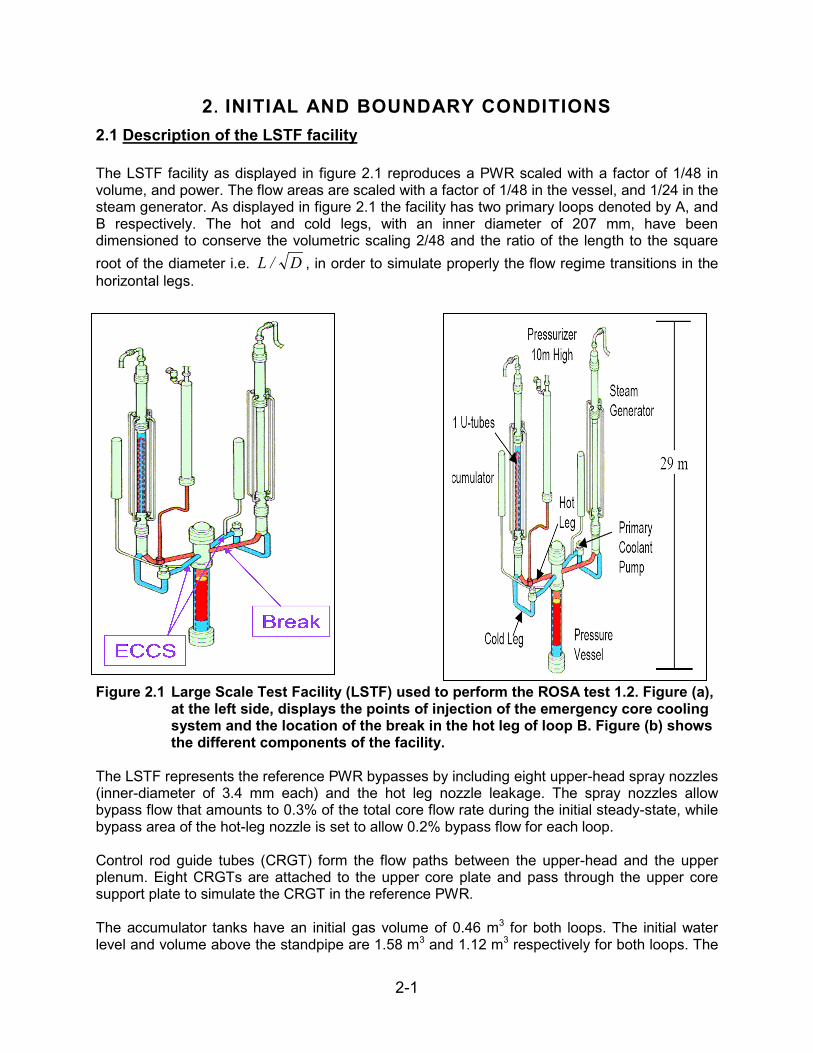
2.1 Large Scale Test Facility (LSTF) used to perform the ROSA test 1.2. Figure (a), at the left side, displays the points of injection of the emergency core cooling system and the location of the break in the hot leg of loop B. Figure (b) shows the different components of the facility .............................................................................. 2-1
2.2 Decay Power versus time at the LSTF facility for test case ROSA 1.2 .............................. 2-4 2.3 Pump rotation speed in radians/s implemented in the TRACE code to simulate
the coast down .................................................................................................................. 2-5 3.1 Time evolution of the pressure for the Test 1.2 in red colour and prediction of
TRACE in black ................................................................................................................. 3-5 3.2 Experimental (continuous red line) and computed (black line) mass flow rates
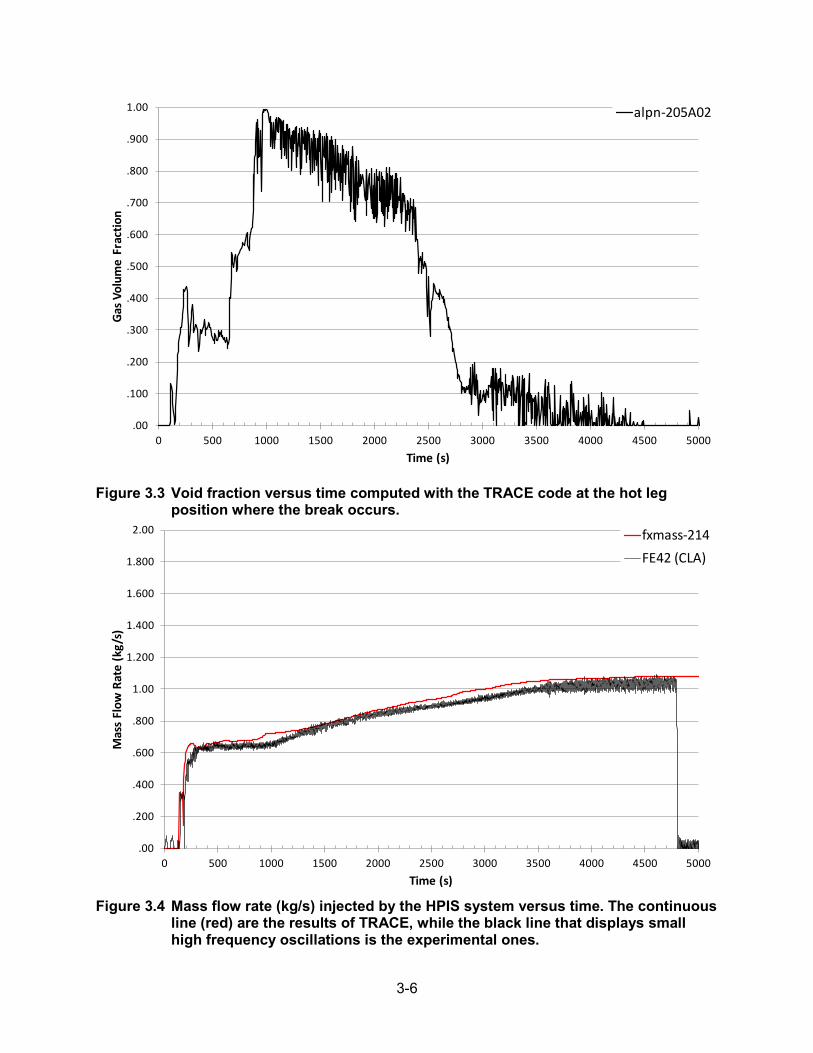
versus time through the hot leg break ............................................................................... 3-5 3.3 Void fraction versus time computed with the TRACE code at the hot leg position
where the break occurs ..................................................................................................... 3-6 3.4 Mass flow rate (kg/s) injected by the HPIS system versus time. The continuous
line (red) are the results of TRACE, while the black line that displays small high frequency oscillations are the experimental ones .............................................................. 3-6
3.5 Experimental and computed with TRACE (continuous black line) mass flow rates through the loop A. The measures denoted by FE2 and FE3 where performed in the pump seal ............................................................................................... 3-7
3.6 Experimental and computed with TRACE (continuous black line) mass flow rates through the loop B. The measures denoted by FE5 and FE6 where performed in the pump seal ............................................................................................... 3-7
3.7 Experimental (red) and computed with TRACE (black) secondary pressure versus time ....................................................................................................................... 3-8
3.8. Experimental and calculated with TRACE mass flow rates through the safety and relief valves ................................................................................................................ 3-8
3.9 Temperature evolution of the liquid phase in the cold leg at the section where the injection takes place. The black curve is the experimental one, and the green the computed with the TRACE code ....................................................................... 3-9
3.10 Temperatures from the thermocouple located in the upper and lower part of the pipe of the pump seal (green and red curves), and prediction of the TRACE code (black) ...................................................................................................................... 3-9
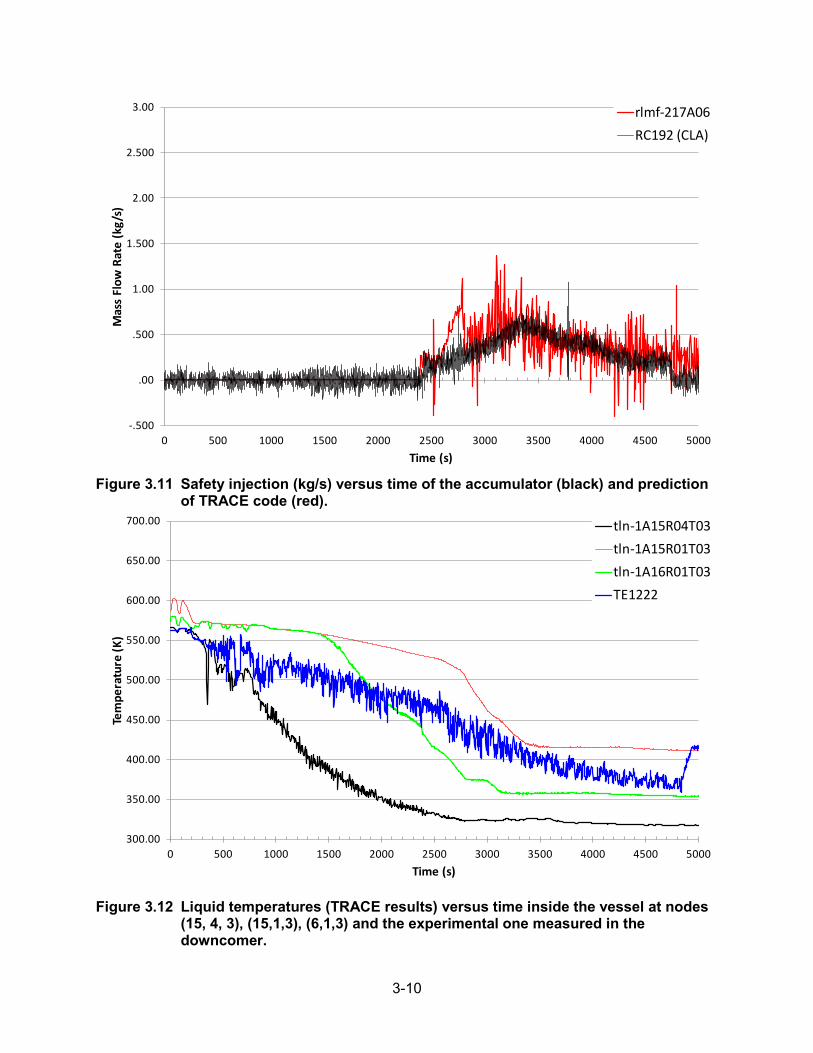
3.11 Safety injection (kg/s) versus time of the accumulator (black) and prediction of TRACE code (red)........................................................................................................... 3-10
3.12 Liquid temperatures (TRACE results) versus time inside the vessel at nodes (15, 4, 3), (15,1,3), (6,1,3) and the experimental ones measured in the downcomer ..................................................................................................................... 3-10
TABLES Page
2.1 Comparison of measured and calculated ROSA stationary initial conditions ..................... 2-2 2.2 Mass flow rates versus the pressure for the HPIS system pumps ..................................... 2-3 2.3 Operational set points and conditions for test ROSA 1.2 .................................................. 2-4 3.1 Experimental and TRACE sequence of events for test 1.2 ................................................ 3-4

ix
EXECUTIVE SUMMARY This report presents the main results obtained with the NRC consolidated code TRACE for the simulation of the OCDE stratification test ROSA 1.2 with a model of the LSTF test facility.
The LSTF facility represents a PWR reactor scaled 1/48 in volume and power. The facility has two loops, A and B, with one steam generators per loop, one coolant pump per loop and one pressurizer located in loop A. The emergency core cooling system (ECCS) is formed by the accumulator tanks and the high pressure injection system (HPIS). The amount of water injected by the ECCS system depends on pressure. Both systems i.e. the HPIS and the accumulators actuate when the primary pressure drops below specified pressure set points. In test ROSA 1.2 a single failure is assumed for the HPIS of the reference PWR, and the mass flow rate injected into the cold legs of both loops was one half of the scaled one. The ratio of injected water in the A and B loops was 1:1.
The objective of this assessment is to improve the available LSTF TRACE model, and to compare code predictions with facility experimental data obtained during the 1.2 test in order to be able to asses the code capability to predict complex transients with thermal stratification.
A reference steady state situation was first obtained with the TRACE code using the same initial boundary condition of the LSTF facility for this experiment. Some improvement in the nodalization of the plant model has been performed in order to account the LSTF plant specifications.
The transient was produced by a small break in the hot leg of the loop B of the LSTF facility. In the experiment the small break was simulated by a small diameter flash type break orifice located at the bottom of the hot-leg. One of the goals of this report is to analyze the capabilities of the TRACE code to cope with cases where thermal stratifications in the cold and hot legs take place. For this transient is very important the ability of TRACE to predict correctly the fluid regime in the hot leg. At the beginning of the transient the fluid discharged through the bottom of the hot leg is at liquid state and the mass flow rate discharged through the break is very high, and as a consequence the primary pressure drops very fast during the first seconds of the transient until the beginning of the HPIS injection. This behaviour is predicted very well by TRACE code. Later, the flow at the hot leg becomes biphasic with low void fraction, and the mass flow rate discharged through the break is still high because the TRACE off-take model considers the fact that at the bottom of the hot leg we have liquid. Finally the flow in the hot leg becomes biphasic with high void fraction and steam is mainly discharged through the break. In this test the contraction of the fluid vein during the steam discharge has an important influence on the depressurization rate during the steam regime. A contraction factor of 0.6 has been used only during the steam regime.
The injection of the HPI in the cold leg produces a significant thermal stratification in this pipe that attains the value of 100 ºC. The TRACE code predicts well the average temperature in the cold leg especially in the loop seal. However some of the complex 3D thermal stratification phenomena that take place in the cold leg during the HPIS injection cannot be reproduced with a 1D model as the one used to represent the cold leg in the TRACE code. As a consequence the liquid temperature predicted by TRACE in the downcomer that match well the experimental data during the first 900 seconds, starts to separate from the experimental one at this time.
The evolution with time of the rest of variables as pressure in the primary system, mass flow rate through the break, pressure in the secondary, and mass flow rate through the primary are all them well predicted by the TRACE code along all the transient.


xi
ACKNOWLEDGEMENTS The thermal-hydraulic and nuclear engineering group of the UPV is indebted to the Management Board of the ROSA project and to the people of the Thermal-Hydraulics Safety Research Group. of JAEA. The CSN financed this work, and help to develop this report we are indebted to Miguel Sanchez Perea that reviews the manuscript. Also we are indebted to Cesar Queral that provides a model of the LSTF facility for the TRACE code and many interesting suggestion on improvement of the model.


xiii
ABBREVIATIONS CSN Spanish Nuclear Regulatory Commission
CRGT Control Rod Guide Tubes
ECCS Emergency Core Cooling System
HPIS High Pressure Injection System
LOCA Loss of coolant accident
LSTF Large Scale Test Facility
OECD Organization for Economic Cooperation and Development
PH High-Pressure Injection Pump
PJ Charging Pump
PRZ Pressurizer
PTS Pressurized Thermal Shock
PWR Pressurized Power Reactor
ROSA Rig of Safety Assessment
SG Steam Generator
SRV Safety and Relief Valves
UNESA Spanish Electricity Producers Association
TRACE TRAC/RELAP Advanced Computational Engine


1-1
1. INTRODUCTION
The present work was performed as a contribution to the OECD international collaborative research project ROSA. The Spanish contribution was coordinated by the Spanish Nuclear Regulatory Commission (CSN). A consortium formed by the CSN and several Spanish Technical Universities developed the Spanish participation in the project that was coordinated by the CSN and a steering committee. The analysis of the experiment ROSA 1.2 with the TRACE code was assigned to the “thermal-hydraulics and nuclear engineering group” of the Polytechnic University of Valencia. This test was performed in the nuclear safety research centre of the Japan Atomic Energy Agency in the large scale test facility (LSTF) on May 17, 2007 [1, 2]. The Test ROSA 1.2 consists in 1% small break LOCA in the hot leg B of the LSTF facility, the orifice has a hydraulic diameter of 10.1 mm, and is located in the bottom of the pipe. The orifice is connected to the blow-down system through a pipe of higher hydraulic diameter [3, 4]. The actuation of the high pressure injection system (HPIS) is activated automatically with a delay of 12 seconds when the pressure falls below 12.27 MPa. The accumulator injection is activated when the pressure falls below 4.51 MPa. The cold water injected into the cold legs by the ECCS system mixes with the hot primary coolant and stratifies in the pipe flowing toward the downcomer of the pressure vessel. Because the injected water is colder does not mix completely with the fluid of the cold leg and accumulates in the bottom of the pipe forming a cold layer that moves toward the downcomer, however the upper part contains fluid at higher temperature that is normally in form of steam when the transient progress. This steam partially condenses on the lower boundary layer interface, and some local pressure variations can occur that can cause unstable flow oscillations that in turn promote thermal mixing. Such multidimensional and non-equilibrium flow phenomena are of concern for pressurized thermal shock (PTS) [5, 6]. The goal of test series 1 was to obtain the multidimensional temperature distribution in the cold legs and the vessel downcomer during the ECCS injection for verification of computer codes and models. In test 1.2 the break was located in the bottom of the hot leg B, in such a way that the break does not disturb the stratification in the cold leg. During this transient, the HPIS actuates from practically the beginning of the transient, and later at 2537 seconds when the pressure falls below 4.51 MPA starts the accumulator injection. The goal of this work is to compare the experimental results with the predictions of the TRACE code and to analyze the set of phenomena that take place at the primary and secondary loops. Special emphasis is devoted to the comparison between the code results and the experimental data. The work has been organized as follows: Section 2 is devoted to study the facility model and the boundary conditions. Section 3 studies the transient sequence and compares the TRACE results for the main physical magnitudes with the experimental data. Finally, Section four summarizes the main conclusions obtained in this report.

2-1
2. INITIAL AND BOUNDARY CONDITIONS 2.1 Description of the LSTF facility The LSTF facility as displayed in figure 2.1 reproduces a PWR scaled with a factor of 1/48 in volume, and power. The flow areas are scaled with a factor of 1/48 in the vessel, and 1/24 in the steam generator. As displayed in figure 2.1 the facility has two primary loops denoted by A, and B respectively. The hot and cold legs, with an inner diameter of 207 mm, have been dimensioned to conserve the volumetric scaling 2/48 and the ratio of the length to the square root of the diameter i.e. D/L , in order to simulate properly the flow regime transitions in the horizontal legs.
Figure 2.1 Large Scale Test Facility (LSTF) used to perform the ROSA test 1.2. Figure (a),
at the left side, displays the points of injection of the emergency core cooling system and the location of the break in the hot leg of loop B. Figure (b) shows the different components of the facility.
The LSTF represents the reference PWR bypasses by including eight upper-head spray nozzles (inner-diameter of 3.4 mm each) and the hot leg nozzle leakage. The spray nozzles allow bypass flow that amounts to 0.3% of the total core flow rate during the initial steady-state, while bypass area of the hot-leg nozzle is set to allow 0.2% bypass flow for each loop. Control rod guide tubes (CRGT) form the flow paths between the upper-head and the upper plenum. Eight CRGTs are attached to the upper core plate and pass through the upper core support plate to simulate the CRGT in the reference PWR. The accumulator tanks have an initial gas volume of 0.46 m3 for both loops. The initial water level and volume above the standpipe are 1.58 m3 and 1.12 m3 respectively for both loops. The

2-2
volume of the accumulator injection lines with and without PRZ are 0.2 and 0.14 m3 respectively. 2.2 Stationary initial conditions for ROSA 1.2 test and results of TRACE code In table 2.1 the specified stationary initial conditions for test 1.2 are displayed in the third column. Also in this same table second and fourth columns show the measured conditions in loops A and B and the results of the TRACE code respectively. These initial conditions were the operating ones prior to the Test 1.2, and are practically identical to the ones used in other LOCA experiments with LSTF.
Table 2.1 Comparison of measured and calculated ROSA stationary initial conditions Items Measured A/B Specified Calculated (TRACE)
Pressure Vessel Core Power (MW) 10.1 10.0 10.0 Primary loop Hot leg fluid temperature (K)
598.0 597.2/596.9 590
Cold leg fluid temperature (K)
562.0 563.1/563.0 566
Mass flow rate kg/s/loop
24.3 25.38/25.37 23.4
Pump rotation speed (revolutions per s)
13.3 13.9/13.9 13.93
Pressurizer (PZR) Pressurizer pressure (bar)
155 155.4 160
Liquid level (m) 7.2 7.34 7.5 Steam Generator (SG) Secondary side pressure (bar)
73 73.2/73.3 71.6
Secondary side liquid level (m)
10.3 10.26/10.23 10.6
Steam mass flow rate (kg/s)
2.74 2.68/2.61 2.64
Main Feed-water flow rate (kg/s)
2.74 2.75/2.65 3
Main Feed-Water Temperature (K)
495.2 496.3/495.5 495.2
Accumulator A water temperature (K)
320.0 321.3 ---
Accumulator B water temperature (K)
320.0 321.9 ---
HPI water temp. (K) 310.0 309.8 ---

2-3
2.3 Test conditions and set points The high pressure injection system (HPIS) actuates automatically with a delay of 12 seconds when the pressure in the primary system drops below 12.97 MPa. The accumulator actuates automatically when the pressure drops below 4.51 MPa. A single failure was assumed for the HPIS system of the reference PWR, and the mass flow rate injected during the test 1.2 was one half of the scaled one. In the LSTF facility, the high-pressure injection system is operated by means of two pumps, the charging pump PJ and the high pressure injection pump PH. However, the PH pump cannot inject water at pressures higher than 10.5 MPa due to limitations in the pump head. Therefore at system pressures higher than 10.5 MPa the water is injected in the loops A and B by the pump PJ, when the system pressure drops below 10.5 MPa the water is injected in the loops by both pumps. The specified mass flow rates versus the system pressure used in test 1.2 are displayed in table 2.2. The ratio of the mass flow rates injected by the ECCS system in the loops A and B was 1:1. The main operational set points and boundary conditions are displayed in table 2.3. This table indicates that the pressurizer proportional heater is off with the reactor scram and the pressurizer backup heater (83.0 kW) is on when the pressure in the primary loop drops below 153.4 bars, and is off when the pressurizer level falls below 2.3 m. The initial core power is 10 MW. After the scram the core power follows the typical curve displayed in figure 2.2, that it is due to the disintegration of the fission products. Figure 2.3 shows the coast down curve implemented in TRACE for the primary coolant pump after reactor scram. A 1% small break LOCA in the hot leg bottom was simulated in Test 1.2; the hydraulic diameter of the break is 10.1 mm, a pipe in downward direction is connected to the blowdown system, to transport the fluid from the break.
Table 2.2 Mass flow rates versus the pressure for the HPIS system pumps
Pressure (MPa) PJ (kg/s) PH (kg/s) 0.00 1.16 1.16 0.10 1.16 1.16 0.26 1.15 1.15 2.28 1.05 1.05 5.62 0.86 0.86 8.09 0.68 0.68 9.67 0.52 0.52 10.34 0.37 0.37 10.50 0.74 0.00 11.86 0.67 0.00 12.40 0.65 0.00 14.57 0.52 0.00 17.21 0.26 0.00 20.00 0.00 0.00

2-4
Figure 2.2 Decay Power versus time at the LSTF facility for test case ROSA 1.2.
Table 2.3 Operational set points and conditions for test ROSA 1.2
EVENT CONDITION Break Time zero Reactor scram signal 12.97 MPa. Initiation of core power decay curve simulation
With reactor scram
Initiation of primary coolant pump coast-down With reactor scram Turbine throttle valve closure / MSIV closure With reactor scram main feedwater termination With reactor scram Pressurizer proportional heater off With reactor scram Pressurizer backup heater on (83.0 kW) Primary pressure < 15.34 MPa Pressurizer backup heater trip (33.0 kW) Primary pressure > 15.40 MPa Pressurizer backup heater off Pressurizer level 2.3 m Safety injection (SI) signal 12.27 MPa High pressure injection SI signal + 12 s Accumulator injection 4.51 MPa Pressurizer relief valve on/off 16.20 / 16.07 MPa Pressurizer safety valve on/off 17.26 / 17.06 MPa Steam generator relief valve on / off 8.03 MPa / 7.82 MPa Steam generator safety valve on / off 8.68 MPa / 7.69 MPa
0,000E+00
200E+04
400E+04
600E+04
800E+04
1,000E+04
0 500 1000 1500 2000 2500 3000 3500 4000 4500 5000
Pow
er (W
)
Time (s)
MI17

2-5
Figure 2.3 Pump rotation speed in radians/s implemented in the TRACE code to simulate
the coast down.
-25.0
.0
25.0
50.0
75.0
100.0
125.0
150.0
175.0
0 100 200 300 400 500 600 700
Pum
p Ro
tatio
n Sp
eed
(rps
)
Time (s)
MI1(PCA)


3-1
3. TEST RESULTS AND COMPARISON WITH TRACE This section is devoted to review the main experimental results and to discuss the results obtained with the TRACE code. 3.1 Beginning of the transient As indicated in section 2.2 the initial conditions for Test 1.2 prior to the pipe break were the steady state ones displayed in table 2.1, as well as the steady state conditions obtained with the TRACE code for this same case. The hot leg break orifice opens at time 0.0 s. The chronology of the major events observed during the ROSA 1.2 experiments is displayed in table 3.1, where also is shown in the last column the chronology of the major events computed with the TRACE code for this same experiment. Prediction of the TRACE code for the reactor scram signal occurs 12 seconds before that in the test, although apparently and according to figure 3.1 the pressure evolution predicted by the TRACE code is practically the same than the experimental. However, the depressurization rate is very high at the beginning of the transient and slight differences in the depressurization rate can change the time of the reactor scram signal a few seconds. The time for the safety injection signal, i.e. when the pressure drops below 12.27 MPa, is well predicted by TRACE that gives a result of 72 seconds that compares very well with the 77 seconds for the experiment. The main physical variable that explains the depressurization rate is the mass flow rate through the hot leg break, this mass flow is mainly single-phase liquid, at the beginning of the transient and change from single-phase to biphasic mixture at about 100 seconds. The mass flow rate trough the break is very well predicted by the TRACE code in this first stage as it is displayed in figure 3.2. It is observed in this figure that there are small differences between the experimental and computed mass flow rates through the break at the beginning of the transient during the first depressurization step, and at about 900 seconds during the second depressurization step when the break flow changes from biphasic to single phase steam. After this time, the flow through the hot leg is a biphasic mixture with high void fraction and for practical effects can be considered as pure steam transporting some drops of water. The off-take model of the TRACE code has been used, assuming that the break is located in the bottom of the pipe; the predictions of the TRACE code for the discharged mass flow rate are very good during the single-phase and biphasic flow regimes. However, when the flow changes to single-phase steam, the mass flow rate through the break is higher than the predicted one, and the pressure drops more than expected. This situation is corrected by taking into account in the single phase steam regime the effective area contraction coefficient, produced by the contraction of the fluid vein when discharging though an orifice or crack of small hydraulic diameter. A coefficient of 0.6, being a standard value given by many authors, has been considered in this calculation. TRACE predictions about the change of flow regime can be considered pretty goods. According to the experimental results, the flow regime in the hot leg changes from single phase liquid to two-phase mixture at about 100 seconds, and from two-phase mixture to biphasic with high void fraction at approximately 900 seconds. Figure 3.3 displays the results obtained with TRACE for the void fraction in the hot leg, near the point where the break is located. This figure shows that at 100 seconds the flow is single phase liquid and at this time starts to change to biphasic mixture: This change is very fast and at time t=200 seconds the void fraction is 0.3. Then, at time t=900 seconds the void fraction rises again very fast and attains a very high value close to 0.95, and then at time t=1500 s starts to decrease continuously due to the injection of the ECC system that refills the primary system with water.

3-2
The second variable that has a strong influence on the collapsed liquid levels in the reactor vessel and in the hot and cold legs, is the mass flow rate injected by the high pressure injection system (HPIS) during the first part of the transient. Figure 3.4 displays the experimental and computed by TRACE, mass flow rates injected by the HPI system during the entire transient; both curves practically match along the entire transient. Another important magnitude is the mass flow rate circulating through the loops A and B. Figures 3.5 and 3.6 display the mass flow rates circulating through the loops A and B, and measured in the seal-pump. Two measures were performed with conventional (differential pressure) flow meters in each loop. At the beginning of the transient the mass flow rates increase suddenly, due to the increase in the pump rotation speed immediately after the break. After that, the mass flow rates decrease due to the pump coast down and the loss of coolant fluid through the break. Mass flow rates in the seal loop of both loops practically stops at about 450 seconds as shown in figures 3.5 and 3.6. These facts are very well predicted by the TRACE code that reproduces this sequence of events very well. At time 52 seconds close the main steam isolation valve (MSIV) and the pressure in the secondary start to increase until the opening set point for the safety and relief valves is reached. Once these valves open, the pressure start to decrease until the set point for closing is reached. A set of cycles for opening and closing takes place according with the pressure evolution as it is displayed in figure 3.7. The TRACE code reproduces very well the rising in the secondary pressure that follows the closing of the MSIV valve and the cycling of the safety and relief valves. Figure 3.8 displays the mass flow rate through the safety and relief valves; we notice that the experimental values of the mass flow rate though the SR valves show a small mass flow rate although it should be zero when the valves are closed. The TRACE prediction of the mass flow rates though the break are close to the experimental values, however it exists an small delay in time between the TRACE predictions and the measured ones. The feed-water mass flow rate in the steam generators A and B is 2.8 kg/s per SG and stops at 55 second after the reactor scram signal and the closing of the main steam line valve. 3.2 Evolution of the transient after the injection of the ECCS system: thermal
stratification effects in the cold leg The HPIS injection in the cold legs starts at time 92 seconds (87 seconds in TRACE code). The temperature of the water injected by the HPIS is 310 K that is much colder than in the primary circuit. This cold water mixes partially in the cold leg with the water at higher temperature that remains inside the cold leg and with the steam (if any) coming from the SG and a thermal stratification takes place in the experiment due to the non perfect mixing. Due to its higher density, injected cold water goes to the bottom part of the cold leg, and then moves mainly toward the downcomer. Figure 3.9 displays the evolution with time of the temperature inside the cold leg, at the section where HPIS flow is injected. This figure shows that the liquid temperature at the beginning of the transient remains constant until the safety injection starts, then remains constant for a while because the amount of injected water is small, but at about 500 seconds the pressure has dropped enough. As consequence of it the safety injection supplies more water to the cold leg and the liquid temperature start to drop with a set of oscillations as detected by the thermocouples located below the ECCS system. The TRACE code also predicts this behaviour and the set of oscillations, but the oscillatory behaviour in the liquid temperature start earlier in time in the TRACE prediction as can be noticed in figure 3.9. At time 250 second the water level in the downcomer drops below the cold leg, because the

3-3
mass flow rate through the pump seal is small; some of the water injected by the HPIS system can move toward the seal-pump, especially when the cold leg mass flow rate becomes very low. This phenomenon takes place at time 500 seconds, when the mass flow rate in the cold leg is very small and receives cold water from the HPIS system, which moves to the bottom of the pipe. At this time, most of the cold water injected by the HPIS moves toward the downcomer and the rest toward the pump seal. The thermal stratification effect is obviously 3D and cannot be predicted with the 1D PIPE component of TRACE used to simulate this experiment. Therefore some differences between the temperatures calculated with TRACE and the experimental ones, are expected beyond the time t=1000 seconds, as it is noticed in figure 3.9. In figure 3.10 the temperatures in the upper and lower parts of the pipe of the pump seal are displayed, as well as the TRACE calculations located between both curves due to the 1D character of TRACE calculations in this pipe. At the beginning of the safety injection the TRACE calculation is closer to the upper temperature, this is due to the fact that at the beginning of the transient the cold leg is full of fluid at an uniform temperature of 562 K. When the transient starts the saturation temperature Tsat decreases due to the pressure drop but the fluid in the cold leg is full with subcooled fluid with a temperature close to 562 K, and the fluid in the seal of the pump comes mainly from the steam generator. Only when the mass flow rate through the cold leg becomes smaller some colder fluid from the HPIS starts to move to the bottom of the pump seal at time 500 s. At time 1000 s, the pump seal starts to be refilled fundamentally with cold water from the HPIS system and the temperature differences between the thermocouples located in the lower and upper part of the pump seal becomes higher. TRACE predictions are clearly located between both curves as displayed in figure 3.10. According to the experimental data a liquid level is formed in the cold legs. The prediction of TRACE code with the 1D model for the cold leg, shows only liquid level in the pump seal but not in the pipe that connects the pump seal with the downcomer. 3.3 Long term evolution of the transient after the injection of the HPIS +
Accumulator: Effect on the liquid level, void fraction of the primary loop, and mass flow rate through the break
This section describes the long term evolution of the different magnitudes due to the safety injection produced by the HPIS plus the accumulator. The accumulator injection starts to inject cold water at time 2400 seconds. Figure 3.11 displays the mass flow rate injected by the accumulator (black curve) and the results of the TRACE code (red curve). The prediction of the TRACE code is pretty good. Figure 3.3 shows that the accumulator injection diminishes the void fraction in the hot leg from 0.7 before the injection at time 2350, to 0.1 at time 4000 seconds. As a consequence of it the break mass flow rate increases and attains a maximum at 3100 seconds. This behaviour is well predicted by the TRACE code that slightly over-predicts the mass flow rate through the break as it is displayed in figure 3.2. The reduction in the pressure of the primary system in the long term due to the reduction with time of the decay power, the loss of enthalpy through the break, and the injection of water with very low enthalpy by the safety system are displayed in figure 3.1. The effect of the accumulator injection that starts at 2400 seconds is to contribute to the pressure reduction, this reduction is a little bigger in the TRACE prediction that in the experiment. Secondary pressure diminishes in the long term due to several factors. First heat transfer from

3-4
primary to secondary side is smaller in time, because core power is lower and primary fluid is colder due to safety injection flow and the loss of pressure in the primary system. Pressure reduction rate with time is well predicted by TRACE that matches the same slope from 1000 to 3000 seconds than in the experiment (see figure 3.7). At short term between t=0 and 900 seconds the temperature computed by TRACE in the downcomer (black line or bottom line) matches the experimental one. However beyond this time, the temperatures computed by TRACE in the downcomer drop faster than the experimental ones and approach the temperatures of the safety injection in the long term, as it is displayed in figure 3.12. Figure 3.12 also displays the evolution of the temperatures at the core exit and inside the core.
Table 3.1 Experimental and TRACE sequence of events for test 1.2 Event Time in Test 1.2 (s) Time computed with TRACE
Hot leg break 0.0 0.0 Reactor Scram Signal (12.97 MPa) 49.0 37.0
Closing of the main steam line 52.0 37.0 Feedwater stop 55.0 45.0
Closing of the main steam isolation valve A/B
72.0/74.0
Safety injection signal (12.27 MPa) 77.0 72.0 Starting time of the high pressure
injection 92.0 85.0
Stop of the primary coolant pumps A/B 303/303 285/285 Starting time of the accumulator
injection (4.51MPa) 2537 2338
Closing of the accumulator injection A/B 4696/4697 4950

3-5
Figure 3.1 Time evolution of the pressure for the Test 1.2 in red colour and prediction of
TRACE in black.
Figure 3.2 Experimental (continuous red line) and computed (black line) mass flow rates
versus time through the hot leg break.
0,000E+00
200E+04
400E+04
600E+04
800E+04
1,000E+04
1,200E+04
1,400E+04
1,600E+04
1,800E+04
2,000E+04
0 500 1000 1500 2000 2500 3000 3500 4000 4500 5000
Pres
sure
(Pa)
Time (s)
sv6PE13 (Pressurizer)
-2.00
-1.00
.00
1.00
2.00
3.00
4.00
5.00
6.00
7.00
8.00
0 500 1000 1500 2000 2500 3000 3500 4000 4500 5000
Mas
s Fl
ow R
ate
(kg/
s)
Time (s)
bxmass-2520RC194
3-6
Figure 3.3 Void fraction versus time computed with the TRACE code at the hot leg
position where the break occurs.
Figure 3.4 Mass flow rate (kg/s) injected by the HPIS system versus time. The continuous
line (red) are the results of TRACE, while the black line that displays small high frequency oscillations is the experimental ones.
.00
.100
.200
.300
.400
.500
.600
.700
.800
.900
1.00
0 500 1000 1500 2000 2500 3000 3500 4000 4500 5000
Gas V
olum
e Fr
actio
n
Time (s)
alpn-205A02
.00
.200
.400
.600
.800
1.00
1.200
1.400
1.600
1.800
2.00
0 500 1000 1500 2000 2500 3000 3500 4000 4500 5000
Mas
s Fl
ow R
ate
(kg/
s)
Time (s)
fxmass-214FE42 (CLA)

3-7
Figure 3.5 Experimental and computed with TRACE (continuous black line) mass flow
rates through the loop A. The measures denoted by FE2 and FE3 where performed in the pump seal.
Figure 3.6 Experimental and computed with TRACE (continuous black line) mass flow
rates through the loop B. The measures denoted by FE5 and FE6 where performed in the pump seal.
-5.00
.00
5.00
10.00
15.00
20.00
25.00
30.00
35.00
40.00
45.00
50.00
0 500 1000 1500 2000 2500 3000 3500 4000 4500 5000
Mas
s Fl
ow R
ate
(kg/
s)
Time (s)
rmvm-15A02FE2 (High)FE3 (Low)
-5.00
.00
5.00
10.00
15.00
20.00
25.00
30.00
35.00
40.00
45.00
50.00
0 500 1000 1500 2000 2500 3000 3500 4000 4500 5000
Mas
s Fl
ow R
ate
(kg/
s)
Time (s)
rmvm-25A02FE5 (High)FE6 (Low)

3-8
Figure 3.7 Experimental (red) and computed with TRACE (black) secondary pressure
versus time.
Figure 3.8 Experimental and calculated with TRACE mass flow rates through the safety
and relief valves
650E+04
675E+04
700E+04
725E+04
750E+04
775E+04
800E+04
0 500 1000 1500 2000 2500 3000 3500 4000 4500 5000
Pres
sure
(Pa)
Time (s)
pn-51A12PE19 (SGA)
.00
.500
1.00
1.500
2.00
2.500
3.00
0 500 1000 1500 2000 2500 3000 3500 4000 4500 5000
Mas
s Fl
ow R
ate
(kg/
s)
Time (s)
bxmass-174FE19 (SGA)

3-9
Figure 3.9 Temperature evolution of the liquid phase in the cold leg at the section where
the injection takes place. The black curve is the experimental one, and the green the computed with the TRACE code.
Figure 3.10 Temperatures from the thermocouple located in the upper and lower part of
the pipe of the pump seal (green and red curves), and prediction of the TRACE code (black).
300.00
350.00
400.00
450.00
500.00
550.00
600.00
0 500 1000 1500 2000 2500 3000 3500 4000 4500 5000
Tem
pera
ture
(K)
Time (s)
tln-16A02TE1174
300.00
350.00
400.00
450.00
500.00
550.00
600.00
0 500 1000 1500 2000 2500 3000 3500 4000 4500 5000
Tem
pera
ture
(K)
Time (s)
tln-13A12TE1184TE1188
3-10
Figure 3.11 Safety injection (kg/s) versus time of the accumulator (black) and prediction
of TRACE code (red).
Figure 3.12 Liquid temperatures (TRACE results) versus time inside the vessel at nodes
(15, 4, 3), (15,1,3), (6,1,3) and the experimental one measured in the downcomer.
-.500
.00
.500
1.00
1.500
2.00
2.500
3.00
0 500 1000 1500 2000 2500 3000 3500 4000 4500 5000
Mas
s Fl
ow R
ate
(kg/
s)
Time (s)
rlmf-217A06RC192 (CLA)
300.00
350.00
400.00
450.00
500.00
550.00
600.00
650.00
700.00
0 500 1000 1500 2000 2500 3000 3500 4000 4500 5000
Tem
pera
ture
(K)
Time (s)
tln-1A15R04T03tln-1A15R01T03tln-1A16R01T03TE1222

4-1
4. CONCLUSIONS
This report analyzes with TRACE code ROSA test 1.2. This experiment corresponds to a small break at the bottom of the hot-leg of the loop B. The reference steady state situation was first obtained with the TRACE code using the same initial boundary condition of the LSTF facility for this experiment. Some improvement in the nodalization of the plant model has been performed in order to consider some LSTF specifications. The TRACE results are close to the experimental ones at steady state. For this transient is very important the ability of TRACE to predict correctly the fluid regime in the hot leg. At the beginning of the transient the fluid is discharged through the break located at the bottom of the hot leg, this fluid is at liquid state and as a consequence the mass flow rate discharged through the break is very high, and the pressure drop very fast during the first seconds of the transient until the beginning of the HPI injection. This behaviour is predicted very well by TRACE code. Later, the flow at the hot leg becomes biphasic with low void fraction, and the mass flow rate discharged through the break is still high because the TRACE off-take model considers the fact that at the bottom of the hot leg we have liquid. Finally the flow in the hot leg becomes biphasic with high void fraction and we discharge mainly steam through the break. In this test the contraction of the fluid vein during the steam discharge has an important influence on the depressurization rate during the steam regime. A contraction factor of 0.6 has been considered only during the steam regime to take on account this fact. The TRACE code predicts very well the change of regime from biphasic to practically single-phase steam that takes place between time 900 seconds and 1000 seconds, as it is displayed in figures 3.2 and 3.3 of this report. The injection of the HPIS in the cold leg produces a significant thermal stratification in this pipe that attains the value of 100 ºC. TRACE code predicts well the average temperature in the cold leg especially in the loop seal. However, some of the complex 3D thermal stratification phenomena that take place in the cold leg during the HPIS injection cannot be reproduced with a 1D model as the one used to represent the cold leg in the TRACE code. As a consequence the liquid temperatures predicted by TRACE in the downcomer that match well the experimental data during the first 900 seconds start to separate from the experimental ones at this point in time. The evolution with time of the rest of variables as pressure in the primary system, mass flow rate through the break, pressure in the secondary, and mass flow rate through the primary are all them well predicted by the TRACE code through all the transient. The pressure in the secondary is well predicted, for instance the maximum pressure attained in the secondary and the cycling of the safety and relief valves are well predicted by the TRACE code, also is well predicted by TRACE the depressurization rate in the secondary as it is displayed in figure 3.7. The mass flow rates through the safety and relief valves are a little bit smaller about 0.25 kg/s than in the experiment, but figure 3.8 shows that when the safety and relief valves are closed the experimental values have a small mass flow rate through the valves, equal to 0.25 kg/s. So the 2.5 kg/s predicted by TRACE for the mass flow rate through the SR valves seems to be correct. The opening and closing times of the SR valves are a little bit displaced with respect to the experimental ones


5-1
5. REFERENCES
1. Thermal-hydraulic Safety Research Group, “Quick-loop Data Report of OECD/NEA ROSA project test 1-2”, Japan Atomic Energy Agency (2007). 2. Thermal-Hydraulic Safety Research Group, “Final Data Report of OECD/NEA ROSA Project Test 1-2 (1% hot leg break LOC experiment with HPI; SB-HL-17 in JAEA), Nuclear Safety Research Centre, Japan Atomic Energy Agency, July 3 (2008). 3. The ROSA-V Group, “ROSA-V Large Scale Test Facility (LSTF) System Description for the Third and Fourth Simulated Fuel Assemblies”, JAERI-Tech 2003-037, Japan Atomic Energy Agency (2007). 4. Thermal-Hydraulic Safety Research Group, “Final Data Report of ROSA/LSTF Test 6-1, Japan Atomic Energy Agency, December 1 (2006) 5. Reyes, J.N., “Flow stagnation and thermal stratification in single and two phase natural circulation loops”, IAEA-TECDOC-1474, Appendix-12 (2005) 6. Lele, A.L., Gupta, S.K., Kushawaha, H.S., Venkat, R., “Modelling of thermal and flow stratification for reactor pressure vessel pressurized thermal shock”. Nuclear Engineering and Design, Vol 212, pp 75-84 (2002).


UN
ITE
D S
TAT
ES
N
UC
LE
AR
RE
GU
LA
TO
RY
CO
MM
ISS
ION
WA
SH
ING
TO
N, D
C 20555-0001
--------------------O
FF
ICIA
L BU
SIN
ES
S

NU
REG
/IA-0420
Analysis with TR
ACE C
ode of Rosa Test 1.2: Sm
all LOC
A in the H
ot-Leg with H
PI and Accumulator Actuation
April 2013