Internal Migration in Mexico - Repositorio UANLeprints.uanl.mx/8781/1/Internal Migration in...
24
Internal Migration in Mexico in the year 2000 Rodrigo Pimienta Lastra Marta Vera Bolaños Michael Shea Elena M. Gutiérrez C. Abstract: This study, based on the Census sample of 2000, sought to identify permanent internal migratory flows: people settled in a geographical entity different from that in which they were born. The aim was to establish the volume of migration and the characteristics of the localities (birth and residence) and, at the same time, provide interpretations of these phenomena within some established theoretical frameworks. Methodologically, the principal flows of migration between states of the Republic were established and correlated with the size of the localities to which migrants are attracted. It was found that, the age groups and genders of migrants are reinterpreted, as are their choice of destinations, to give a picture of internal migration different from that suggested in general models, especially those originating in the first world. The role of women in migration in Mexico seems particularly important. A new interpretation of the migration of children is suggested. Resumen: Este estudio, basado en la muestra censal del 2000, identifica los flujos migratorios internos permanentes: personas asentadas en un lugar distinto al de su nacimiento. El objetivo es establecer el volumen de la migración y una característica importante de las localidades de origen y destino: su tamaño. Al mismo tiempo se busca interpretar este fenómeno dentro de algunos marcos teóricos establecidos. Metodológicamente, los flujos principales entre los estados de la República fueron establecidos y correlacionados con el tamaño de las localidades a las cuales los migrantes llegaron. Se encontró que, los grupos de edad y géneros de los migrantes junto con sus elecciones de destino fueron reinterpretados para proporcionar una visión de la migración interna diferente de lo que se sugiere en los modelos generales, especialmente los que vienen del primer mundo. El papel de la Profesor Investigador de la Universidad Autónoma Metropolitana: [email protected] Profesora investigadora de la Universidad Autónoma del Estado de México: [email protected] Profesor Investigador de la Universidad Autónoma Metropolitana: [email protected] Profesora Investigadora de la Universidad Autónoma Metropolitana: [email protected]
Transcript of Internal Migration in Mexico - Repositorio UANLeprints.uanl.mx/8781/1/Internal Migration in...

Internal Migration in Mexico in the year 2000
Rodrigo Pimienta Lastra
Marta Vera Bolaños
Michael Shea
Elena M. Gutiérrez C.
Abstract:
This study, based on the Census sample of 2000, sought to identify permanent internal migratory flows: people settled in a geographical entity different from that in which they were born. The aim
was to establish the volume of migration and the characteristics of the localities (birth and
residence) and, at the same time, provide interpretations of these phenomena within some
established theoretical frameworks. Methodologically, the principal flows of migration between states of the Republic were established and correlated with the size of the localities to which
migrants are attracted. It was found that, the age groups and genders of migrants are reinterpreted,
as are their choice of destinations, to give a picture of internal migration different from that suggested in general models, especially those originating in the first world. The role of women in
migration in Mexico seems particularly important. A new interpretation of the migration of children
is suggested.
Resumen:
Este estudio, basado en la muestra censal del 2000, identifica los flujos migratorios internos permanentes: personas asentadas en un lugar distinto al de su nacimiento. El objetivo es establecer
el volumen de la migración y una característica importante de las localidades de origen y destino: su
tamaño. Al mismo tiempo se busca interpretar este fenómeno dentro de algunos marcos teóricos establecidos. Metodológicamente, los flujos principales entre los estados de la República fueron
establecidos y correlacionados con el tamaño de las localidades a las cuales los migrantes llegaron.
Se encontró que, los grupos de edad y géneros de los migrantes junto con sus elecciones de destino
fueron reinterpretados para proporcionar una visión de la migración interna diferente de lo que se sugiere en los modelos generales, especialmente los que vienen del primer mundo. El papel de la
Profesor Investigador de la Universidad Autónoma Metropolitana: [email protected]
Profesora investigadora de la Universidad Autónoma del Estado de México: [email protected]
Profesor Investigador de la Universidad Autónoma Metropolitana: [email protected]
Profesora Investigadora de la Universidad Autónoma Metropolitana: [email protected]

mujer en la migración en México parece particularmente importante. En adición, se sugiere una
nueva interpretación de la migración de los niños.
Key words/ Palabras clave: Internal migration Mexico, mexican demography, geographical mobility, migration by sex,
migration by size of locality / Migración interna en México, demografía mexicana, movilidad geográfica, migración por sexo, migración por tamaño de localidad.
Introduction
At a time when Mexico was witnessing a concentration of population in its cities, several
other phenomena were contributing to the transformation of Mexican society. Three factors
were changing the dynamics of the country’s demography: a considerable increase in the
size of the population, a simultaneous acceleration in the speed of this increase and an
important degree of geographical mobility.
With regards to the first factor: between 1940 and 2000, Mexico’s population
increased 4.96 times, going from 19,653,552 to 97,483,412. This increase was accompanied
by a change in population density, particularly in certain regions of the country (for
example Mexico City and Veracruz but not Sinaloa or Durango) and this resulted in
environmental and social pressure in these areas. After the political crisis of the first thirty
years of the century, the postrevolutionary political system managed to establish a certain
degree of stability which became the basis of the economic growth of the country between
1940 and 1981. If this period of time is divided into intervals which correspond to the
taking of censuses, it can be observed that the population grew an average of 1.8%
annually. If this had become the median growth rate, the population would have doubled in
38.3 years. However, an acceleration began in the following two decades which presented
annual growth rates of 2.89% and 3.3% respectively. If maintained, the first would have
doubled the population in 24 years and the second in 21 years. In fact, the highest rate
(3.4%) was reached between 1970 and 1980. This would have doubled the population in
only 20.3 years.
In 1982 the economic growth which had characterized the country since the Second
World War stalled. The population, however, did not stop growing although it did slow

down a little. The median annual growth rate between 1980 and 1990 fell to 2.16% which
meant that the population grew more slowly: it would have taken 32 years to double.
Between 1990 and 2000 it continued to slow down, falling to an annual rate of 1.83%,
which would have led to its doubling in 37.8 years. Nevertheless, although the rate of
growth was falling, a factor known as demographic inertia was in operation: there was, at
this period, a relatively high concentration of women of child-bearing age and this resulted
in a continuous growth of population.
The third factor mentioned above was geographical mobility. This can alter the
rhythm of growth of a population within a geographical area. Changes in the spatial
distribution of Mexico’s population have taken place through a constant increase in internal
migration. While in 1940 10.6% (2,081,000 people) of the population had emigrated from
their birth state to live elsewhere, between 1960 and 1990 the number had passed from
12.5% (4,365,000 people) to 17.2% (13 976 000 people). By the year 2000 it had reached
19.2% (18.752 million people).This figure remains practically the same in relative terms in
the year 2010 at 19.3% (21.722 million migrants). This means that approximately 1 in 5
Mexicans live in a state of the federation different from the one they were born in.
During the 1970s important population movements took place which were linked to
the growth of the cities, the job market and the increase in the infrastructure of
communication. In these years 4 great metropolitan zones were the demographic poles of
attraction: Mexico City, Guadalajara, Monterrey and Puebla. This tendency has been
evident throughout the recent history of Mexico. In 1940 only 20% of the population lived
in places with 15,000 or more inhabitants. The increase in this percentage was continuous
throughout the last century: by 1960 the proportion was 36.6%, by 1970 44.9%, by 1990
57.4% and by 2000 61% (the authors’ estimations based on data from INEGI, 1992, 2002).
The pattern of human settlement became polarized in such a way that a large
number of places held a smaller number of people while some zones concentrated a very
large population. Perhaps it would be a good idea to clarify this point. It happened that,
from one census to the next, places with larger populations (100,000 or more inhabitants)

increased in number, while places with less than 100,000 inhabitants became more common
without the number of their inhabitants having increased. Their populations may, in fact,
have fallen.
If we take into account the above, in the year 1980 there were 125,000 localities
with fewer than 15,000 inhabitants and these made up 46.8% of the population of the
country (32,242,146 people). At the same time, there were 300 places with 15,000 or more
inhabitants and these accounted for 53.2% of the population (36,604,687 people). These
proportions had changed by the year 2000 when, although the number of districts with
fewer than 15,000 inhabitants increased to 198,856, the percentage of people living in them
fell to 39.1% (38,064,204). On the other hand, those districts having 15,000 or more
inhabitants not only increased their number to 513 but also increased their share of the
population of the country to 60.9% (38,064,204 people) (INEGI, 1984, 2002).
A problem which has been emerging since the middle of the last century and is now
accelerating is the territorial distribution of the migrating groups. The aim of this article is
to analyze the directions of the permanent flows of internal migration in Mexico, using data
obtained during the General Census of Population and Dwellings (2000) carried out by the
Institute National of Estadística, Geografía and Informatica (INEGI). These movements
may be analyzed from several theoretical points of view. There are the classical analysts
such as Ravenstein (1885) and Fairchild (1930). There are the analysts from middle of the
last century such as Petersen (1958), Germani (1968), Lee (1966), Todaro (1969) y Muñoz
y Oliveira (1982). Finally, there are such contemporary authors as Simmons (1991) y
Lacomba (2001).
If a theoretical framework for the present study were to be sought, it might be found
in the work of Ravenstein who mentions that most migrants (and especially women) move
only a short distance from their place of origin. This is the case of Mexico State and the
Federal District. When they travel a long distance, it is to some great commercial or
industrial center. This is the case of Baja California. However, parameters and data change
over time. For example, more women than men now migrate and they do not restrict
themselves to short distances.
Other interpretations are possible. An author such as Germani emphasizes the
importance of ease of communication between place of origin and place of migration in his
analysis of expulsion and attraction. The economic interpretation of the neoclassic writers,
on the other hand, emphasizes the importance of the supply and demand of labour when
explaining geographical differences.
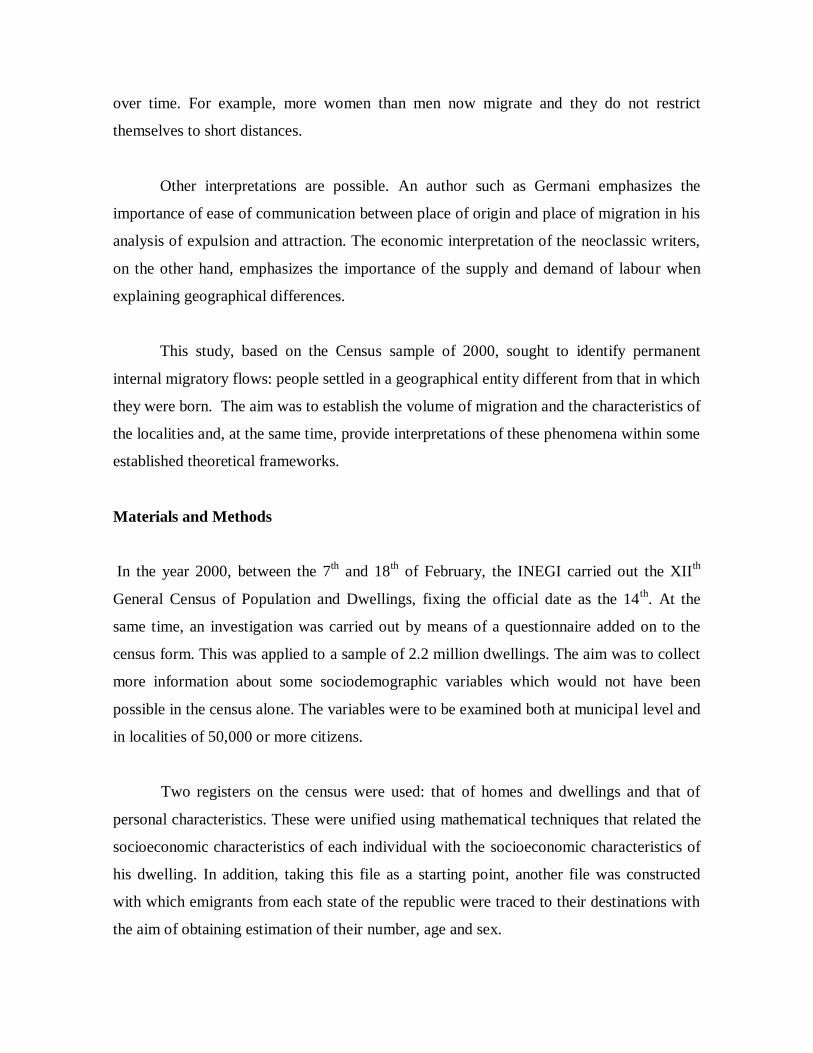
This study, based on the Census sample of 2000, sought to identify permanent
internal migratory flows: people settled in a geographical entity different from that in which
they were born. The aim was to establish the volume of migration and the characteristics of
the localities and, at the same time, provide interpretations of these phenomena within some
established theoretical frameworks.
Materials and Methods
In the year 2000, between the 7th
and 18th
of February, the INEGI carried out the XIIth
General Census of Population and Dwellings, fixing the official date as the 14th
. At the
same time, an investigation was carried out by means of a questionnaire added on to the
census form. This was applied to a sample of 2.2 million dwellings. The aim was to collect
more information about some sociodemographic variables which would not have been
possible in the census alone. The variables were to be examined both at municipal level and
in localities of 50,000 or more citizens.
Two registers on the census were used: that of homes and dwellings and that of
personal characteristics. These were unified using mathematical techniques that related the
socioeconomic characteristics of each individual with the socioeconomic characteristics of
his dwelling. In addition, taking this file as a starting point, another file was constructed
with which emigrants from each state of the republic were traced to their destinations with
the aim of obtaining estimation of their number, age and sex.

Two of the most important variables in migration processes are age and sex because
they have a direct impact both on those regions which act as magnets and those which
emigrants tend to ignore. They affect not only the structure of the populations but also a
number of other important factors such as the demand for certain kinds of services. Age
distribution confronts both donating and receiving societies with problems which vary with
the age of the migrating individuals. Examples are the demand for food, living
accommodation, education, health and jobs. To sum up, the most diverse phenomena vary
with age: economic, social, cultural, physiological and psychological factors (c.f.
Bourgeois-Pichat, 1976).
Results
1. Analysis of the migratory flows between the states of the republic
With the aim of identifying the states which provide most interstate emigrants and those
states which receive them, both the place of birth of the emigrant and place of residence of
the immigrant were identified (see Graphs 1 and 2). In the year 2000, the Federal District
(Mexico City) accounted for 26.4% (4.7 million people) emigrants, followed by Veracruz
with 7.6% (1.3 million). Both may be considered zones of very high emigration.

The other states fall into four clearly defined groups. a) Those of high emigration:
Michoacán (5.2%), Puebla (5%) and Oaxaca (4.8%) with a total of 2 699 851 people
(15.2% of this population). b) Those of moderately high emigration: Jalisco (4.3%),
Mexico State (4.1%), Guanajuato (3.9%), Guerrero (3.7%), Hidalgo (3.4%), San Luis
Potosi (3.3%) and Zacatecas (3%) with a total of 4 558 863 people (25.6% of this
population). c) Those of moderate emigration: Sinaloa (2.7%), Durango (2.7%), Coahuila
(2.5%), Tamaulipas (2.2%) and Chiapas (2%) with a total of 2 115 540 people (11.9%). d)
Those of low emigration: all the rest with a total of 2 365 291 people (13.3%).
Source: Authors’ own calculation based on date from the census sample of the XIIth General Census of Population and Dwellings.
Graph 1
Birth State of emigrant
32,778
34,178
80,229
87,870
119,999
124,852
148,062
179,497
183,957
202,924
206,519
225,185
231,532
232,412
275,297
347,514
382,580
436,034
473,600
475,812
541,069
591,793
595,286
653,604
692,838
721,921
762,352
860,773
906,221
932,857
1,350,757
4,700,906
0 500,0
00
1,000
,000
1,500
,000
2,000
,000
2,500
,000
3,000
,000
3,500
,000
4,000
,000
4,500
,000
5,000
,000
Baja California Sur
QR
Col
Camp
Ags
BC
Mor
Qro
Tlax
Chih
Nay
Son
NL
Tab
Yuc
Chis
Tams
Coah
Dgo
Sin
Zac
SLP
Hgo
Gro
Gto
Méx
Jal
Oax
Pue
Mich
Ver
DF
Emigrant total
Graph 2
State of residence of migrant
109,021
118,557
132,980
134,731
142,293
146,822
147,062
152,177
166,750
173,456
179,372
188,772
202,356
227,588
284,239
288,698
299,909
313,245
336,546
355,593
377,466
438,363
440,438
477,460
555,087
644,465
664,063
836,601
851,029
1,116,929
1,889,729
5,399,411
0 1,000,000 2,000,000 3,000,000 4,000,000 5,000,000 6,000,000
Yuc
Chis
BCS
Zac
Tlax
Camp
Col
Nay
Dgo
Gro
Tab
Ags
Oax
SLP
Hgo
Qro
Sin
Coah
Mich
Son
Gto
Mor
Pue
QR
Chih
Ver
Tams
Jal
NL
BC
DF
Méx
Immigrant total
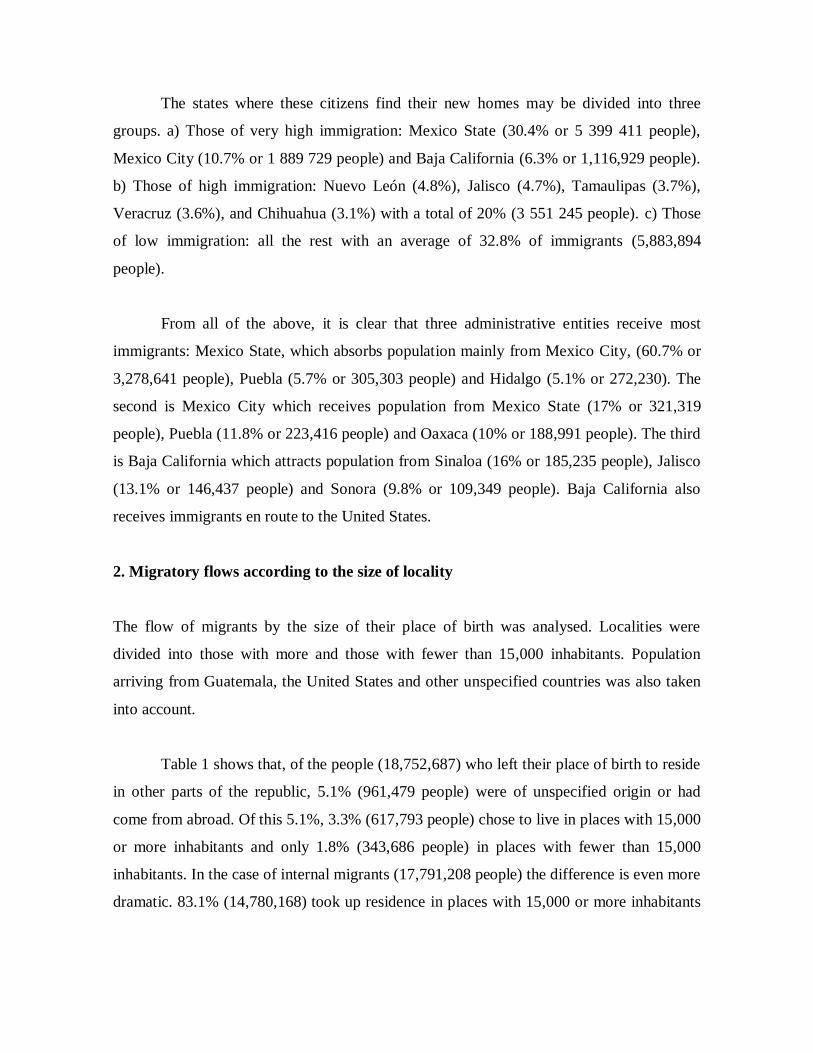
The states where these citizens find their new homes may be divided into three
groups. a) Those of very high immigration: Mexico State (30.4% or 5 399 411 people),
Mexico City (10.7% or 1 889 729 people) and Baja California (6.3% or 1,116,929 people).
b) Those of high immigration: Nuevo León (4.8%), Jalisco (4.7%), Tamaulipas (3.7%),
Veracruz (3.6%), and Chihuahua (3.1%) with a total of 20% (3 551 245 people). c) Those
of low immigration: all the rest with an average of 32.8% of immigrants (5,883,894
people).
From all of the above, it is clear that three administrative entities receive most
immigrants: Mexico State, which absorbs population mainly from Mexico City, (60.7% or
3,278,641 people), Puebla (5.7% or 305,303 people) and Hidalgo (5.1% or 272,230). The
second is Mexico City which receives population from Mexico State (17% or 321,319
people), Puebla (11.8% or 223,416 people) and Oaxaca (10% or 188,991 people). The third
is Baja California which attracts population from Sinaloa (16% or 185,235 people), Jalisco
(13.1% or 146,437 people) and Sonora (9.8% or 109,349 people). Baja California also
receives immigrants en route to the United States.
2. Migratory flows according to the size of locality
The flow of migrants by the size of their place of birth was analysed. Localities were
divided into those with more and those with fewer than 15,000 inhabitants. Population
arriving from Guatemala, the United States and other unspecified countries was also taken
into account.
Table 1 shows that, of the people (18,752,687) who left their place of birth to reside
in other parts of the republic, 5.1% (961,479 people) were of unspecified origin or had
come from abroad. Of this 5.1%, 3.3% (617,793 people) chose to live in places with 15,000
or more inhabitants and only 1.8% (343,686 people) in places with fewer than 15,000
inhabitants. In the case of internal migrants (17,791,208 people) the difference is even more
dramatic. 83.1% (14,780,168) took up residence in places with 15,000 or more inhabitants

while only 16.9% (3,011,040) chose those with fewer than 15,000. Larger places are
evidently more attractive.
Migrants from the places of very high or high emigration, mentioned earlier, also
preferred destinations with larger populations. 89.3% (4,196,009) of those from Mexico
City chose entities with 15,000 or more inhabitants, only 10.7% (504,897) chose the
smaller places. Of those who emigrated from Veracruz, 83.3% (1,125,496) chose localities
of 15,000 or more as their destination and only 16.7% chose smaller places. This pattern is
repeated in places of high migration such as Michoacán with 82.1% (766,043 people),
Puebla 83.4% (755,912) and Oaxaca 82.1% (706,322) with migrants choosing localities of
more than 15,000 people. It is repeated again in the localities identified as of moderately
high, moderate and low emigration. From 70% to 85.5% of emigrants from these places
chose the larger destinations.

Table 1. Flows of migrants by size of locality at state level
On arriving at their new place of residence in the states with very high immigration
the newcomers choose to live in localities with higher populations: 92.7% (5,003,890
people) of those from Mexico State, 99.1% (1,872,690 people) of those form Mexico City
and 84.2% (940,564 people) from Baja California did so. The proportions were similar in
the states with high migration: Nuevo León (92.5%), Jalisco (81.9%), Tamaulipas (81.7%)
and Chihuahua (90.6%). However, of those from Veracruz, also in this category, only
Place of Place of Birth 15000 or More Fewer than Total Residence 15000 or More Fewer than Total
inhabitants 15000 inhabitants 15000 Aguascalientes 89643 30356 119999 Aguascalientes 163891 24881 188772 Baja California 91835 33017 124852 Baja California 940564 176365 1116929 Baja California Sur 26441 6337 32778 Baja California Sur 96545 36435 132980 Campeche 71446 16424 87870 Campeche 83292 63530 146822 Coahuila 372605 63429 436034 Coahuila 284703 28542 313245 Colima 56139 24090 80229 Colima 110550 36512 147062 Chiapas 259908 87606 347514 Chiapas 79816 38741 118557 Chihuahua 153238 49686 202924 Chihuahua 503009 52078 555087 Distrito Federal 4196009 504897 4700906 Distrito Federal 1872690 17039 1889729 Durango 389689 83911 473600 Durango 105577 61173 166750 Guanajuato 587625 105213 692838 Guanajuato 298668 78798 377466 Guerrero 493754 159850 653604 Guerrero 109919 63537 173456 Hidalgo 500582 94704 595286 Hidalgo 130770 153469 284239 Jalisco 587116 175236 762352 Jalisco 685012 151589 836601 México 568058 153863 721921 México 5003890 395521 5399411 Michoacán 766043 166814 932857 Michoacán 215084 121462 336546 Morelos 114435 33627 148062 Morelos 309789 128574 438363 Nayarit 168764 37755 206519 Nayarit 65923 86254 152177 Nuevo León 192343 39189 231532 Nuevo León 787384 63645 851029 Oaxaca 706322 154451 860773 Oaxaca 93052 109304 202356 Puebla 755912 150309 906221 Puebla 314754 125684 440438 Queretaro 132397 47100 179497 Queretaro 238393 50305 288698 Quintana Roo 24272 9906 34178 Quintana Roo 394310 83150 477460 San Luis Potosí 500490 91303 591793 San Luis Potosí 158343 69245 227588 Sinaloa 396856 78956 475812 Sinaloa 166690 133219 299909 Sonora 168481 56704 225185 Sonora 277800 77793 355593 Tabasco 172196 60216 232412 Tabasco 111200 68172 179372 Tamaulipas 286891 95689 382580 Tamaulipas 568919 95144 664063 Tlaxcala 157165 26792 183957 Tlaxcala 72851 69442 142293 Veracruz 1125496 225261 1350757 Veracruz 382997 261468 644465 Yucatán 218045 57252 275297 Yucatán 96082 12939 109021 Zacatecas 449972 91097 541069 Zacatecas 57701 77030 134731 Total internal mig. 14780168 3011040 17791208 Total 14780168 3011040 17791208 0 Guatemala 6866 22290 29156 USA 247660 110739 358399 Otro País 118375 13777 132152 No especificado 244892 196880 441772
Total 15397961 3354726 18752687 Source: Authors’ own calculations based on the census sample of the XIIth General Census of Population and
Dwellings.
N.B. The census total of internal migrants is 17 220 424 which is an overestimation of the sample of
approximately 3.3%.
Emigrants from the state to localities of: Immigrants to the state to localities of:

59.4% (382,997 people) settled in communities with higher populations, 40.6% (261,468
people) chose those with fewer than 15,000 inhabitants.
It is perhaps important to point out that, among the states of low immigration, the
inhabitants of Hidalgo (54%), Oaxaca (54%), Nayarit (56.7%) and Zacatecas (57.2%)
prefer to settle in the smaller communities.
When the net balance of migration is calculated, taking into account the size of the
locality and the total net balance of migration (see Tables 2 and 3) it can be noted that two
different groups have been formed: one has a positive total net balance and the other has a
negative total net balance. The states in the first group include Tamaulipas, Jalisco and
Aguascalientes. Their net balance of migrants in places of less than 15,000 inhabitants is
negative but it is positive in those of more than 15,000. The second group includes
Tlaxcala, Tabasco and Nayarit. Here the situation is reversed with a positive balance for the
smaller localities and a negative one for the larger ones.
The first group – that with a positive net balance – can be divided into four
categories.1
a) Mexico State is a place of very high attraction. It has the largest net
positive balance (4,677,490). In fact, both the larger and the smaller
administrative units show positive balances. However, the larger places
received 4,435,832 people which is eighteen times the number received
by places with fewer than 15,000 inhabitants (241,658 people).
1 Using the same multivariate statistical method (cluster analysis) the following categories can be identified):
1) very highly attractive (Mexico-State); highly attractive (Baja California & Nuevo León); moderately
attractive (Q. Roo, Chihuahua, Morelos and Tamaulipas); low attraction (Sonora, Querétaro, Baja
California Sur, Jalisco, Aguascalientes, Colima and Campeche). 2) Very highly expulsive (Mexico City);
highly expulsive (Veracruz, Oaxaca and Michoacán); moderately expulsive (Guerrero, Puebla, Zacatecas, San Luis Potosí, Guanajuato, Hidalgo and Durango). Low expulsion: Chiapas, Sinaloa, Yucatán, Coahuila,
Nayarit, Tabasco, Tlaxcala.

b) Highly attractive were two administrative entities in the north of the
country: Baja California and Nuevo León. Their net migratory balances
were 992,077 and 619,497 respectively. These states also present positive
balances in both the larger and smaller localities. Nevertheless, the
difference between the two is striking: the larger localities received 6
times as many as the smaller ones in Baja California and 24 times as
many Nuevo León.
c) In the case of the states which were moderately attractive, Quintana Roo,
Chihuahua and Morelos, the imbalance between migrations to the larger
and the smaller localities was 5, 10 and 2 times respectively. The
situation of Tamaulipas is different. The migration to the larger localities
has a positive net balance (282,028 people) while the smaller
communities have a negative net balance (-545 people).
d) Among the states of low attraction, there are considerable differences in
the way the larger and smaller localities are affected by migration. In
Sonora, the larger entities are formed by 5.2 times as many people as the
smaller. In Querétaro, the proportion is 33.1 times, in Colima 4.4 times
and in Baja California Sur only 2.4 times. Both Jalisco (-23,647 people)
and Aguascalientes (-5,475 people) show a large loss of population in the
smaller localities. In Campeche, on the other hand this situation is
reversed: 4 times as many people prefer the smaller localities to the larger
ones.

Table 2. Net balance of migration by size Graph 3. Net balance migration in the total
of locality population
The second group consists of those states with a negative net migratory balance.
Mexico City may be categorised as very highly expulsive (-2,811,177 people). Both larger
and smaller entities have net negative balances. This is followed by those categorised as
highly expulsive - Veracruz, Oaxaca and Michoacán –although the first of these shows
positive net balance in the smaller localities.
In the states characterized as moderately expulsive –Guerrero, Puebla, Zacatecas,
San Luis Potosí, Guanajuato and Durango- migrants prefer the larger localities by wide
margin: 4, 18, 28, 15, 11 and 12 times more respectively. Only in Hidalgo do migrants
State 15000 or More Fewer than Total INMIGRANTES AL ESTADO
inhabitants 15000 Frequency Distrito Federal -2323319 -487858 -2811177 Ags 0 Veracruz -742499 36207 -706292 BC 1521 Oaxaca -613270 -45147 -658417 BCS 380 Michoacán -550959 -45352 -596311 Camp 492 Guerrero -383835 -96313 -480148 Coah 1004 Puebla -441158 -24625 -465783 Col 770 Zacatecas -392271 -14067 -406338 Chis 1862 San Luis Potosí -342147 -22058 -364205 Chih 2316 Guanajuato -288957 -26415 -315372 DF 48522 Hidalgo -369812 58765 -311047 Dgo 789 Durango -284112 -22738 -306850 Gto 2633 Chiapas -180092 -48865 -228957 Hgo 3170 Sinaloa -230166 54263 -175903 Jal 3091 Yucatán -121963 -44313 -166276 Méx 27742 Coahuila -87902 -34887 -122789 Mich 19768 Nayarit -102841 48499 -54342 Mor 15723 Tabasco -60996 7956 -53040 Nay 1116 Tlaxcala -84314 42650 -41664 NL 3702 Campeche 11846 47106 58952 Oax 20850 Colima 54411 12422 66833 Pue 8132 Aguascalientes 74248 -5475 68773 Qro 199 Jalisco 97896 -23647 74249 QR 566 Baja California S. 70104 30098 100202 SLP 993 Queretaro 105996 3205 109201 Sin 1414 Sonora 109319 21089 130408 Son 761 Tamaulipas 282028 -545 281483 Tab 130 Morelos 195354 94947 290301 Tams 680 Chihuahua 349771 2392 352163 Tlax 1197 Quintana Roo 370038 73244 443282 Ver 11225 Nuevo León 595041 24456 619497 Baja California 848729 143348 992077 Yuc 425 México 4435832 241658 4677490 Zac 671
USA 9696
Source: Authors’ own calculation based on date from the census sample of the XIIth General Census of
Population and Dwellings.
Net balance migration on localities of:
Distrito Federal Veracruz
Oaxaca Michoacán
Guerrero Puebla
Zacatecas San Luis Potosí
Guanajuato Hidalgo
Durango Chiapas Sinaloa
Yucatán Coahuila
Nayarit Tabasco Tlaxcala
Campeche Colima Aguascalientes Jalisco Baja California S. Queretaro Sonora
Tamaulipas Morelos Chihuahua Quintana Roo
Nuevo León Baja California
México
-4000 -2000 0 2000 4000 6000 Thousands

prefer the smaller places. Moreover, the larger localities, not only show a negative balance
but this balance is one of the largest (-369,812 people).
Within the group of states characterised as of low expulsion, two kinds of
relationship between the two sizes of locality may be distinguished. In the first group, the
net balances are negative in both the larger and the smaller localities. This is the case in
Chiapas, Yucatan and Coahuila where the larger localities are three times more favoured:
3.7, 2.8 and 2.5 times respectively. In the second group, the larger localities have a negative
balance and the smaller ones a positive balance. This is the case of Sinaloa, Nayarit,
Tabasco and Tlaxcala which can almost be considered as places in equilibrium, because,
although their net balances are negative, they are smallest in the whole Republic.
Structure of migrant population by age and sex
Most of this population is of working age. In the year 2000 the proportion of internal
migrants between the ages of 15 and 54 was 68.3% (see Graph 4). Their average age was
32.9 years for males and 33.7 years for females. In the case of the larger localities the
average ages were 34 for men and 35 for women. In the smaller localities these averages
were considerable lower: 30.6 for men and 30.2 for women. This last case is the only one in
which the average age of males is (slightly) higher than that of the females. In general, the
men are younger. However, although the average age of migrant men and women shows
little difference, the difference between them and the non-migratory population is
considerable: males average 25.7 years and females 26.6 years.
The age structure of a population is affected by migration. A population ages if the
young people leave, because proportionally more older people will remain. On the other
hand, the opposite will happen if the population receives or can retain younger people. The
median age has been used to find a value which lies at the centre of the distribution of the
age data.
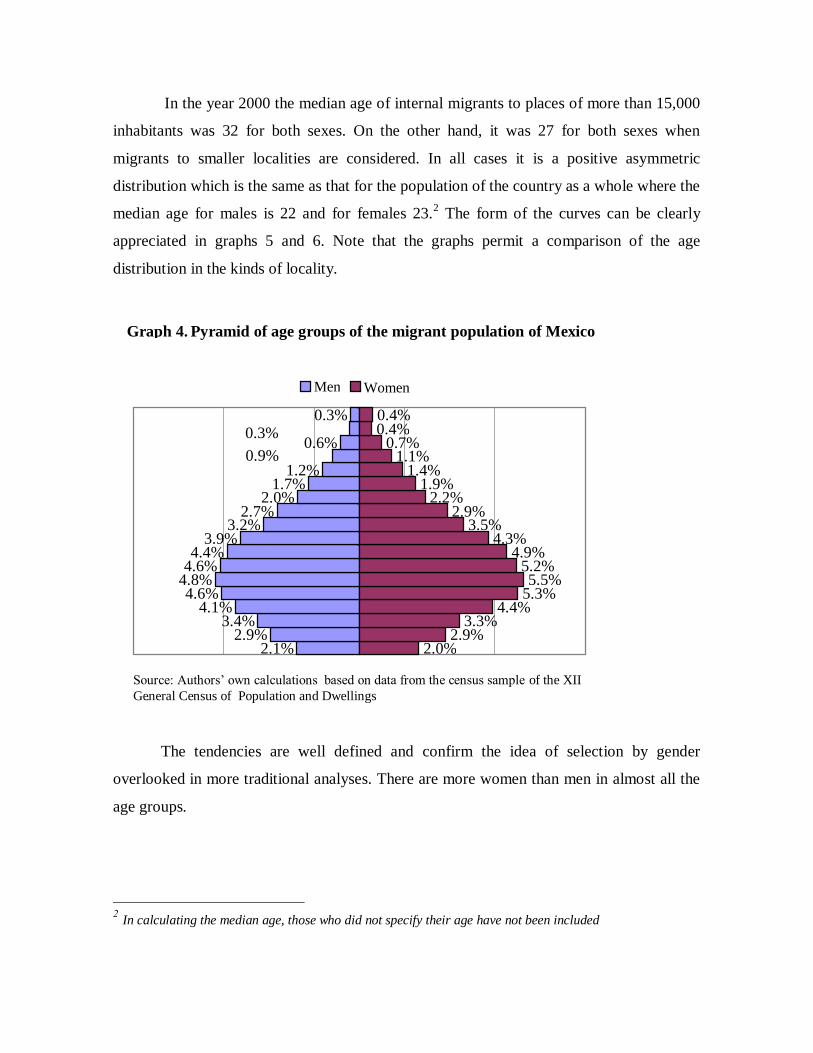
In the year 2000 the median age of internal migrants to places of more than 15,000
inhabitants was 32 for both sexes. On the other hand, it was 27 for both sexes when
migrants to smaller localities are considered. In all cases it is a positive asymmetric
distribution which is the same as that for the population of the country as a whole where the
median age for males is 22 and for females 23.2 The form of the curves can be clearly
appreciated in graphs 5 and 6. Note that the graphs permit a comparison of the age
distribution in the kinds of locality.
The tendencies are well defined and confirm the idea of selection by gender
overlooked in more traditional analyses. There are more women than men in almost all the
age groups.
2 In calculating the median age, those who did not specify their age have not been included
Source: Authors’ own calculations based on data from the census sample of the XII
General Census of Population and Dwellings .
Pyramid of age groups of the migrant population of Mexico
2.0% 2.9%
3.3% 4.4%
5.3% 5.5%
5.2% 4.9%
4.3% 3.5%
2.9% 2.2%
1.9% 1.4%
1.1% 0.7%
0.4% 0.4%
2.1% 2.9%
3.4% 4.1%
4.6% 4.8% 4.6% 4.4%
3.9% 3.2%
2.7% 2.0%
1.7% 1.2%
0.9% 0.6%
0.3% 0.3%
Men Women
Graph 4.

Taking the internal migrants as a whole, 47.9% were males and 52.1% were females
(see Graph 7). Only among those under 15 was the ratio of males/females greater than 100.
Among those between the ages of 15 and 54, for every 90 males who migrate there were
100 females. This is the ratio for migrants to the larger populations. For migrants to
populations of fewer than 15,000 the balance is weighted even more towards women: for
every 100 women there are only 87 men.
Graph 5. Total number of migrants by Graph 6. Total number of migrants by
group in localities of 15,000 or more group in localities of fewer than
inhabitants 15,000 inhabitants
Source: Authors own calculation based on date from the census sample of the XIIth General Census of
Population and Dwellings
: .
0 - 4 10 - 14 20 - 24 30 - 34 40 - 44 50 - 54 60 - 64 70 - 74 80 - 84
0 100000 200000 300000 400000 500000 600000 700000 800000 900000
Age Groups
Men Women
0 - 4 10 - 14 20 - 24 30 - 34 40 - 44 50 - 54 60 - 64 70 - 74 80 - 84
0 20000 40000 60000 80000
100000 120000 140000 160000
Age Groups
Men Women

Graph 7. Percentage of the population of Mexico who are internal migrants by sex
It can also be observed that the pattern of migration by size of locality, in the
youngest age groups, does not correspond to that observed in the studies carried out by first
world researchers (and which they have tried to make general). The generally accepted
model of migrant behaviour according to age group may be taken to be that established by
Rogers (1978) and used by Pimienta (2002):
The regularities observed in the pattern of migration are not surprising:
young adults show the highest rates of migration because they are less
attached to their communities. Their children are, normally, not at school.
They are not usually proprietors but rather they rent the place where they
live and losing seniority in their workplace is not yet an important factor in
their lives. Given that children migrate as part of the family unit, their
pattern of migration is the same as that of their parents. Consequently given
that very small children have younger parents, their geographical mobility is
greater than that of adolescents. Finally, the small peak in the age profile
between 62 and 65 years represents migration after retirement.
: Source: Authors own calculations based on data from the census
sample of the XII General Census of Population ad Dwellings .
47.9
52.1
45 46 47 48 49 50 51 52 53
Men Women

This implies that the migration of small children would be higher in the earlier than
in the later years of childhood. However, such a pattern is not reflected in the present data.
In both the larger and the smaller destinations the curve grows from left to right, just the
opposite of what the above quotation would predict.
Possible interpretations which may be given to this situation (which is most obvious
in localities with 15,000 or more inhabitants) are the following: first, that this represents
permanent migration, were the children migrate with the whole family during the first years
of life; second, one or both parents migrate without small children as a family survival
strategy leaving the care of the children to one of the parents, the grandparents or some
other relative or friend; third, some children in the last stage of childhood (perhaps 12
years or more) may migrate by themselves with the aim of helping their parents to support
the family economically (Pimienta 2010, Becerra 2007, Pimienta 2001).The highest point
of the curve of migrants of both sexes to localities of 15,000 or more occurs between the
ages of 25 and 29; afterwards, it descends gently because the large number of migrants of
both sexes in movement continues until the 40-44 year age group.
In the smaller localities, the curve of migration is different from that just described.
Both the general tendency and actual level of migration differs depending on the gender of
the migrant in those of less than 54.
In the early years of life, from the 0-4 age group to the 10-14 age group, more males
than females migrate. Moreover, the proportion of both sexes is greater than that of the
same age groups seen in the larger localities. It is probable that these small children migrate
with their mothers. It seems possible that these women migrate without their husband or
partner given the difference in the level of migration between the two sexes: women
outnumber men by a wide margin in the age range of 15 to 49 years.

The curve which refers to women increases to reach its highest point in the 25-29
age group. The difference between this and the curve for the men- which reaches its highest
point in the 10-14 age group- could hardly be more marked. From this age group, the
number of migrating males decreases slowly until the 20-24 year age group is reached
when there is a levelling off to form a plateau which continues to the 35-39 age group.
Afterwards the curve descends continuously through the age groups to meet that of the
women after the age of 50.
The shape of the curve for adults at the age of retirement does not reflect Rogers’
general pattern either; there is no slight peak between the ages of 62 and 65.
Discussion
The analysis of migration, like most social phenomena, can be carried out from various
points of view. This study has a quantitative perspective and also seeks to clarify factors
such as age group gender and size of locality.
It may be interesting to examine here some specific cases. Mexico City and
Veracruz have the largest number of emigrants, followed by Michoacán, Puebla and
Oaxaca. Zones which act as magnets for immigrants are Mexico State, Mexico City and
Baja California. The appearance of the capital in both lists needs to be explained. An
intense exchange of migrants exists between Mexico City and its large neighbour Mexico
State. This is not only because of geography but also because of the great economic
importance of both. In addition a large number of the administrative districts of Mexico
State are effectively integrated into the metropolis which is Mexico City. If the information
about migration from these states is crossed with the information from the National Council
for the evaluation of social policy (CONEVAL), Baja California and the Federal District
show little social underdevelopment while Mexico State is almost on the same level. These
are factors of attraction for migrants which may be decisive in explaining this phenomenon
(CONEVAL, 2001). To this, it would be to necessary to add that the Federal District and
Mexico State are the two most important centres of manufacturing industry in the Republic,

producing 17.28% and 15.42% respectively of the national production at prices of the year
2000.
Baja California is a state with low emigration and high immigration. This may seem
paradoxical because it´s industrial production is very modest and it occupies ninth place
among the states of the Republic in its contribution to the National GNP with a
participation of only 3.99%. However, two factors make Baja California attractive: first its
frontier with the USA which makes it a staging post on the route to the north and all that
this implies; second, the industry of “maquila” has a great demand for labour.
At the other extreme from these states are those which attract fewer migrants and
have less emigration such as Chiapas and Yucatan in the first case and Quintana Roo and
Baja California Sur in the second. Indexes of underdevelopment go from very high, in the
case of Chiapas, to medium in Yucatan and Quintana Roo and low in Baja California.
These states contribute less than 1% of GNP, although Quintana Roo has a modest
participation in the restaurant and hotel sector where it occupies eighth position with
3.51%. These states hold little attraction for internal migrants.
Having said all this, perhaps it would be wise to qualify the information. Chiapas,
Yucatan and Quintana Roo form part of what has been called “the south-east region” to
which Campeche, Guerrero, Oaxaca, Puebla, Tabasco and Veracruz should be added. These
states have a very interesting exchange of internal migrants both between themselves and
within the region generally (Pimienta, 2006: 409-435). There is also the case of Quintana
Roo, a state which attracts migrants but only 2.7% which puts the state in ninth place.
Taking the country as a whole, it can be seen that, in the year 2000, 1 in 5 Mexicans
lived in a state different from that in which he/she was born. Of these, slightly more than
half (52.1%) were women. This divergence is maintained throughout the migrants’ working
years: of those aged between 15 and 54, 36% were women compared to 32.3% men. It thus
becomes necessary to examine more closely the structure of the migrant population. In
Graph 4, the unequal percentages of the two sexes in each quinquennial age group may be
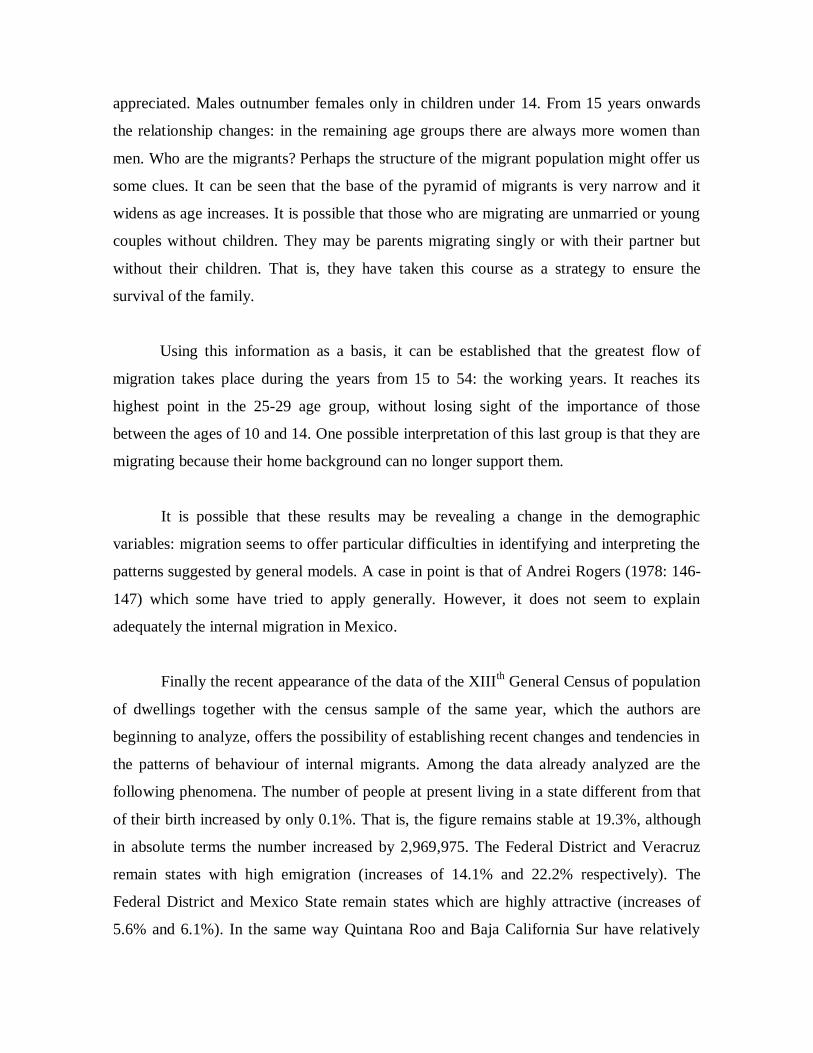
appreciated. Males outnumber females only in children under 14. From 15 years onwards
the relationship changes: in the remaining age groups there are always more women than
men. Who are the migrants? Perhaps the structure of the migrant population might offer us
some clues. It can be seen that the base of the pyramid of migrants is very narrow and it
widens as age increases. It is possible that those who are migrating are unmarried or young
couples without children. They may be parents migrating singly or with their partner but
without their children. That is, they have taken this course as a strategy to ensure the
survival of the family.
Using this information as a basis, it can be established that the greatest flow of
migration takes place during the years from 15 to 54: the working years. It reaches its
highest point in the 25-29 age group, without losing sight of the importance of those
between the ages of 10 and 14. One possible interpretation of this last group is that they are
migrating because their home background can no longer support them.
It is possible that these results may be revealing a change in the demographic
variables: migration seems to offer particular difficulties in identifying and interpreting the
patterns suggested by general models. A case in point is that of Andrei Rogers (1978: 146-
147) which some have tried to apply generally. However, it does not seem to explain
adequately the internal migration in Mexico.
Finally the recent appearance of the data of the XIIIth General Census of population
of dwellings together with the census sample of the same year, which the authors are
beginning to analyze, offers the possibility of establishing recent changes and tendencies in
the patterns of behaviour of internal migrants. Among the data already analyzed are the
following phenomena. The number of people at present living in a state different from that
of their birth increased by only 0.1%. That is, the figure remains stable at 19.3%, although
in absolute terms the number increased by 2,969,975. The Federal District and Veracruz
remain states with high emigration (increases of 14.1% and 22.2% respectively). The
Federal District and Mexico State remain states which are highly attractive (increases of
5.6% and 6.1%). In the same way Quintana Roo and Baja California Sur have relatively

little emigration while Chiapas and Yucatan have relatively little immigration. Migratory
movements by size of locality present the following tendencies: 1) localities of 15 000
habitants or more show an increase of 13.2%; 2) those of fewer than 15 000 habitants show
an increase of 33.6%; 3) the migratory profiles by size of locality present important
changes from those in the census of 2000,.
REFERENCES
Bourgeois-Pichat, Jean, 1976, “Consecuencias económicas y sociales de las tendencias
demográficas en Europa hasta el año 2000 y en fechas posteriores”, in: Boletín de
Población de Naciones Unidas num. 8
Becerra Pedraza Itzel, Vázquez García V., Zapata Martelo E., 2007, “Género, etnia y edad
en el trabajo agrícola infantil. Estudio de caso, Sinaloa, México”, in Revista de Estudios de
Género. La Ventana, noviembre, año/vol. 3, num. 026, Guadalajara, México.
CONAPO, 1994, Evolución de las Ciudades de México, México.
CONEVAL, 2010, Indicadores, índice y grado de rezago social, según entidad federativa,
2001, 2005 y 2010. México.
INEGI, 1984, X Censo General de Población y Vivienda, México.
-------- 1992, XI Censo General de Población y Vivienda, México.
-------- 2002, XII Censo General de Población y Vivienda, México.
-------- 2002, Base de datos de la muestra censal del Censo General de Población y
Vivienda, 2000, XII Censo General de Población y Vivienda, México.

-------- 2006, Sistema de Cuentas Nacionales de México. Producto Interno Bruto por
Entidad Federativa, México.
-------- 2011, Base de datos de la muestra censal del Censo General de Población y
Vivienda, 2010, XIII Censo General de Población y Vivienda, México.
Fairchild, Henry Pratt, 1930, Inmigration; a World Movement and its American
Significance. Macmillan Revised Edition. New York.
Germani, Gino, 1968, Sociología de la Modernización. Ed. Paidos, Buenos Aires,
Argentina.
Lacomba, Joan, 2001, “Teoría Prácticas de la Inmigración. De los Modelos Explicativos a
los Relativos y Proyectos Migratorios”, en: Scripta Nova, Revista Electrónica de
Geografía y Ciencias Sociales, Universidad de Barcelona. Nº 94 (11)
Lee, Everett, 1966, A Theory of Migration. Demography No. 1, pp. 47-57. New York,
USA.
Muñoz, Humberto y Orlandina de Oliveira, 1982, “Migraciones Internas en América
Latina: Exposición y Crítica de Algunos Análisis”. En Migración y Desarrollo:
Consideraciones Teóricas, Serie Población, Informe de Investigación. CLACSO; Buenos
Aires, Argentina.
Petersen, W , 1958, “A General Tipology of Migration”. In American Sociological Review,
Vol. 23, Núm. 2. pp. 256-265. USA.

Pimienta Lastra Rodrigo, 2010, “Migración Interna Infantil, sus Características
Sociodemográficas en el Contexto de los Derechos Humanos de los Niños”, en Las
Ciencias Sociales y la Humanidades Hoy. Departamento de Política y Cultura de División
de Ciencias Sociales y Humanidades de la UAM-Xochimilco, México, D. F.
------- 2006, La dinámica migratoria de la Región Sur Sureste en localidades de menos de
15 mil habitantes, Universidad Autónoma Metropolitana-X y Plaza y Valdés, México.
409-435
------- 2001, “Migración Interna Infantil en México”, en Sociológica, División de Ciencias
Sociales y Humanidades de la UAM-A, México, D. F. 121-146
------- 2002, Análisis demográfico de la migración interna en México: 1930-1990,
Universidad Autónoma Metropolitana- Xochimilco y Plaza y Valdés, México.
Ravenstein, E. G, 1885, “The Laws of Migration”. In Journal of the Royal Statistical
Society, Vol. LII. London.
Rogers, Andrei and others, May, 1978, “Model Migration Schedules and Their
Applications”, in Migration and Settlement: Selected Essays, Laxenburg, Austria: Andrei
Rogers Editor.
Simmons, Alan, 1991, “Explicando la Migración: La Teoría en la Encrucijada”. En
Estudios Demográficos y Urbanos, Vol. 6 Núm. 1. El Colegio de México, México.
Todaro, Michael P., 1969, “A Model of Labor Migration and Urban Unemployment”. In
American Economics Review, Num. 69, pp. 183-193. USA
Lacomba, Joan, 2001, “Teoría Prácticas de la Inmigración. De los Modelos Explicativos a
los Relativos y Proyectos Migratorios”, en: Scripta Nova, Revista Electrónica de
Geografía y Ciencias Sociales, Universidad de Barcelona. Nº 94 (11)