INTERNAL MEDICINE - ACHS · Australasian Clinical Indicator Report . 2009–2016 . 18th Edition ....
28
INTERNAL MEDICINE VERSION 6.1 Retrospective data in full ACIR 2009 - 2016
Transcript of INTERNAL MEDICINE - ACHS · Australasian Clinical Indicator Report . 2009–2016 . 18th Edition ....
INTERNAL MEDICINE
VERSION 6.1 Retrospective data in full
ACIR 2009 - 2016
Australasian Clinical Indicator Report 2009–2016
18th Edition
Internal Medicine, version 6.1
Clinical Indicators
Acknowledgements:
The Australian Council on Healthcare
Standards
Health Services Research Group
University of Newcastle
Australasian Clinical Indicator Report 2009–2016 © ACHS. This work is copyright. Requests and inquiries concerning reproduction and rights should be addressed to [email protected]
Contents
Internal Medicine, version 6.1 1
Cardiovascular disease ........................................................................................................................... 1 1.1 CHF - prescribed ACEI / A2RA (H) 1 1.2 CHF - prescribed beta blocker (H) 2 1.3 CHF and AF - prescribed warfarin (H) 3 1.4 CHF - chronic disease management referral including physical rehabilitation (H) 4 1.5 PTCA - vessels where primary success achieved (H) 5
Endocrine disease ................................................................................................................................... 6 2.1 Hospitalised patients with severe hypoglycaemia less than 2.8 mmol/L (L) 6
Acute stroke management ...................................................................................................................... 7 3.1 Acute stroke - documentation of swallowing screen conducted within 24 hours prior to food or fluid intake (H) 7 3.2 Acute stroke - documented physiotherapy assessment within 48 hours of presentation (H) 8 3.3 Acute stroke - plan for ongoing community care provided to patient / family (H) 9 3.4 Acute stroke - documented treatment in a stroke unit during hospital stay (H) 10
Care of the elderly .................................................................................................................................. 11 4.1 Medical patients 65 years or older - cognition assessment using validated tool (H) 11 4.2 Geriatric patients - documented assessment of physical function (H) 13 4.3 Documentation of delirium plan (H) 14 4.4 Documentation of follow-up plan after discharge (H) 14
Respiratory disease ............................................................................................................................... 15 5.1 COPD - chronic disease management service referral (H) 15 5.2 Acute asthma – assessment of severity documented on admission (H) 16 5.3 Acute asthma - appropriate discharge plan documented (H) 17
Gastrointestinal disease ........................................................................................................................ 18 6.1 Haematemesis / melaena with blood transfusion - gastroscopy within 24 hours (H) 18 6.2 Haematemesis / melaena with blood transfusion & subsequent death (L) 19
Oncology ................................................................................................................................................ 20 7.1 Time to administration of antibiotics for patients admitted with febrile neutropenia (H) 20
Characteristics of contributing HCOs .................................................................................................. 21 Summary of Results 24
Australasian Clinical Indicator Report 2009–2016 Page 1 © ACHS. This work is copyright. Requests and inquiries concerning reproduction and rights should be addressed to [email protected]
Internal Medicine, version 6.1 Cardiovascular disease
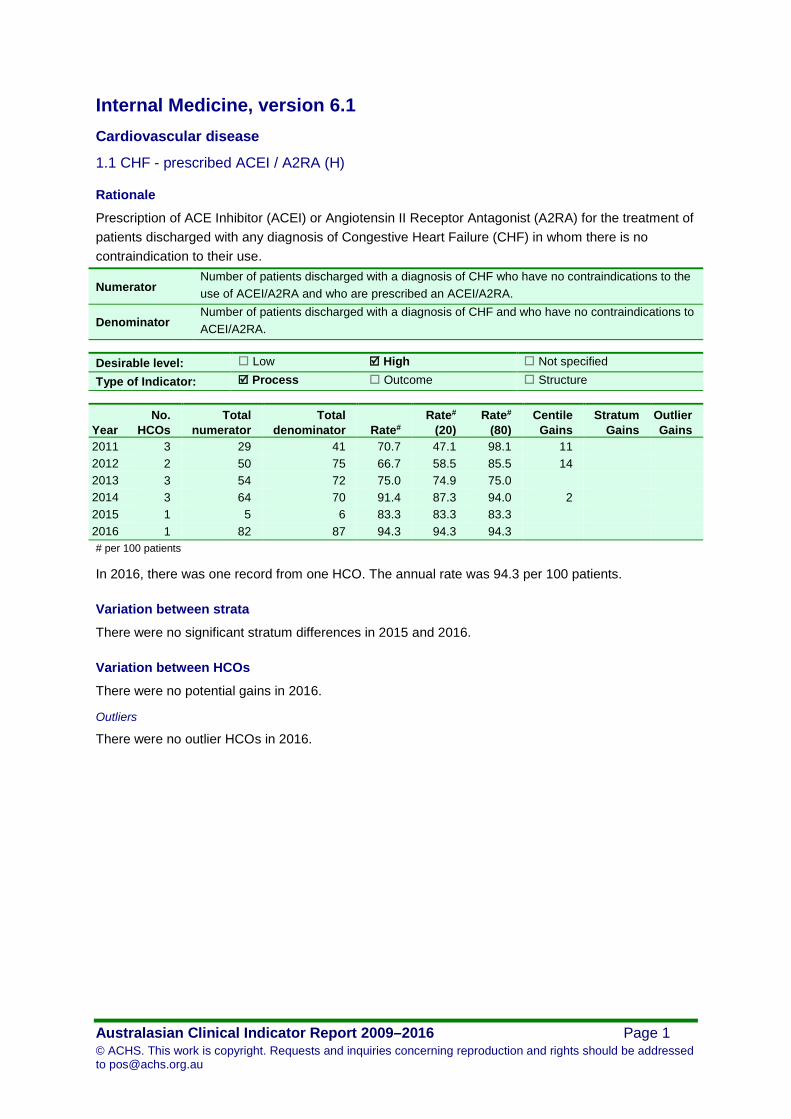
1.1 CHF - prescribed ACEI / A2RA (H)
Rationale
Prescription of ACE Inhibitor (ACEI) or Angiotensin II Receptor Antagonist (A2RA) for the treatment of patients discharged with any diagnosis of Congestive Heart Failure (CHF) in whom there is no contraindication to their use.
Numerator Number of patients discharged with a diagnosis of CHF who have no contraindications to the use of ACEI/A2RA and who are prescribed an ACEI/A2RA.
Denominator Number of patients discharged with a diagnosis of CHF and who have no contraindications to ACEI/A2RA.
Desirable level: Low High Not specified
Type of Indicator: Process Outcome Structure
Year No.
HCOs Total
numerator Total
denominator Rate# Rate#
(20) Rate#
(80) Centile
Gains Stratum
Gains Outlier Gains
2011 3 29 41 70.7 47.1 98.1 11 2012 2 50 75 66.7 58.5 85.5 14 2013 3 54 72 75.0 74.9 75.0 2014 3 64 70 91.4 87.3 94.0 2 2015 1 5 6 83.3 83.3 83.3 2016 1 82 87 94.3 94.3 94.3 # per 100 patients
In 2016, there was one record from one HCO. The annual rate was 94.3 per 100 patients.
Variation between strata
There were no significant stratum differences in 2015 and 2016.
Variation between HCOs
There were no potential gains in 2016.
Outliers
There were no outlier HCOs in 2016.
Internal Medicine, version 6
Australasian Clinical Indicator Report 2009–2016 Page 2 © ACHS. This work is copyright. Requests and inquiries concerning reproduction and rights should be addressed to [email protected]
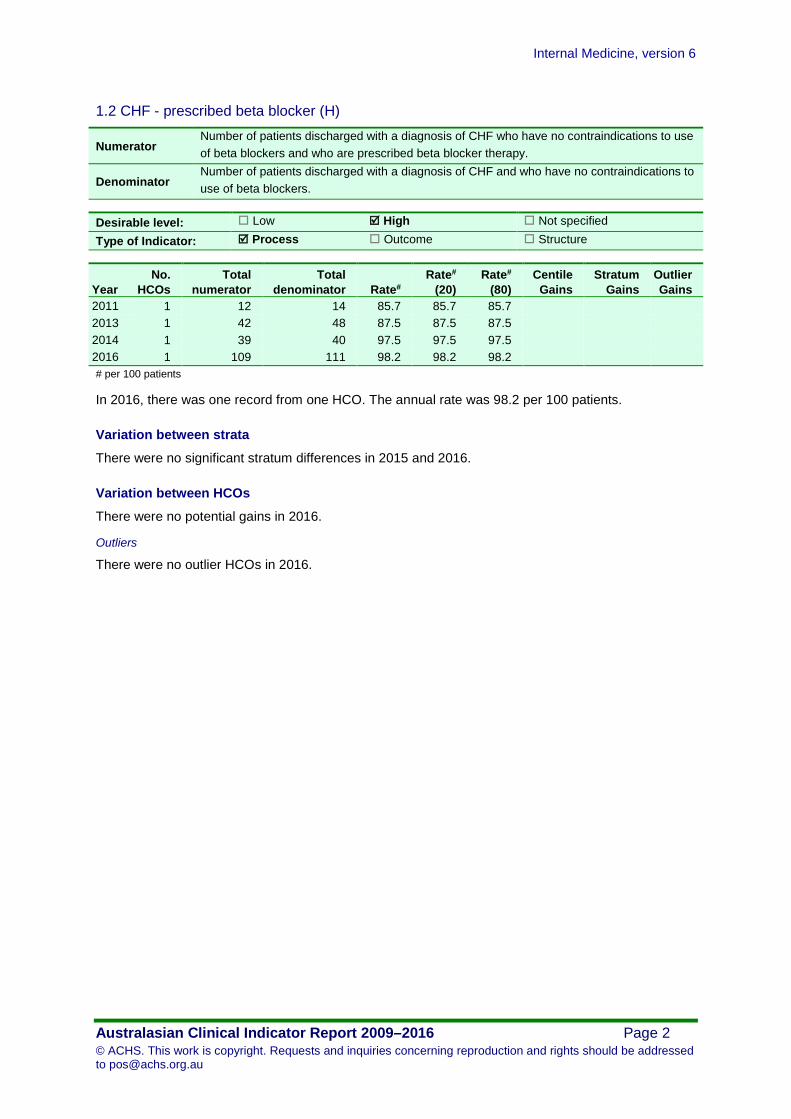
1.2 CHF - prescribed beta blocker (H)
Numerator Number of patients discharged with a diagnosis of CHF who have no contraindications to use of beta blockers and who are prescribed beta blocker therapy.
Denominator Number of patients discharged with a diagnosis of CHF and who have no contraindications to use of beta blockers.
Desirable level: Low High Not specified
Type of Indicator: Process Outcome Structure
Year No.
HCOs Total
numerator Total
denominator Rate# Rate#
(20) Rate#
(80) Centile
Gains Stratum
Gains Outlier Gains
2011 1 12 14 85.7 85.7 85.7 2013 1 42 48 87.5 87.5 87.5 2014 1 39 40 97.5 97.5 97.5 2016 1 109 111 98.2 98.2 98.2 # per 100 patients
In 2016, there was one record from one HCO. The annual rate was 98.2 per 100 patients.
Variation between strata
There were no significant stratum differences in 2015 and 2016.
Variation between HCOs
There were no potential gains in 2016.
Outliers
There were no outlier HCOs in 2016.

Internal Medicine, version 6
Australasian Clinical Indicator Report 2009–2016 Page 3 © ACHS. This work is copyright. Requests and inquiries concerning reproduction and rights should be addressed to [email protected]
1.3 CHF and AF - prescribed warfarin (H)
Numerator Number of patients discharged with a diagnosis of CHF and atrial fibrillation who have no contraindications to the use of warfarin, who are prescribed warfarin.
Denominator Number of patients discharged with a diagnosis of CHF and atrial fibrillation who have no contraindications to the use of warfarin.
Desirable level: Low High Not specified
Type of Indicator: Process Outcome Structure
Year No.
HCOs Total
numerator Total
denominator Rate# Rate#
(20) Rate#
(80) Centile
Gains Stratum
Gains Outlier Gains
2011 1 10 10 100 100 100 2013 1 24 29 82.8 82.8 82.8 2014 1 29 29 100 100 100 2016 1 20 20 100 100 100 # per 100 patients
In 2016, there was one record from one HCO. The annual rate was 100 per 100 patients.
Variation between strata
There were no significant stratum differences in 2015 and 2016.
Variation between HCOs
There were no potential gains in 2016.
Outliers
There were no outlier HCOs in 2016.

Internal Medicine, version 6
Australasian Clinical Indicator Report 2009–2016 Page 4 © ACHS. This work is copyright. Requests and inquiries concerning reproduction and rights should be addressed to [email protected]
1.4 CHF - chronic disease management referral including physical rehabilitation (H)
Numerator Number of patients discharged with any diagnosis of CHF who are referred for a chronic disease management service that includes physical rehabilitation.
Denominator Number of patients discharged with any diagnosis of CHF.
Desirable level: Low High Not specified
Type of Indicator: Process Outcome Structure
Year No.
HCOs Total
numerator Total
denominator Rate# Rate#
(20) Rate#
(80) Centile
Gains Stratum
Gains Outlier Gains
2011 1 12 12 100 100 100 2013 2 20 81 24.7 13.2 36.4 9 2016 1 11 52 21.2 21.2 21.2 # per 100 patients
In 2016, there was one record from one HCO. The annual rate was 21.2 per 100 patients.
Variation between strata
There were no significant stratum differences in 2015 and 2016.
Variation between HCOs
There were no potential gains in 2016.
Outliers
There were no outlier HCOs in 2016.
Internal Medicine, version 6
Australasian Clinical Indicator Report 2009–2016 Page 5 © ACHS. This work is copyright. Requests and inquiries concerning reproduction and rights should be addressed to [email protected]
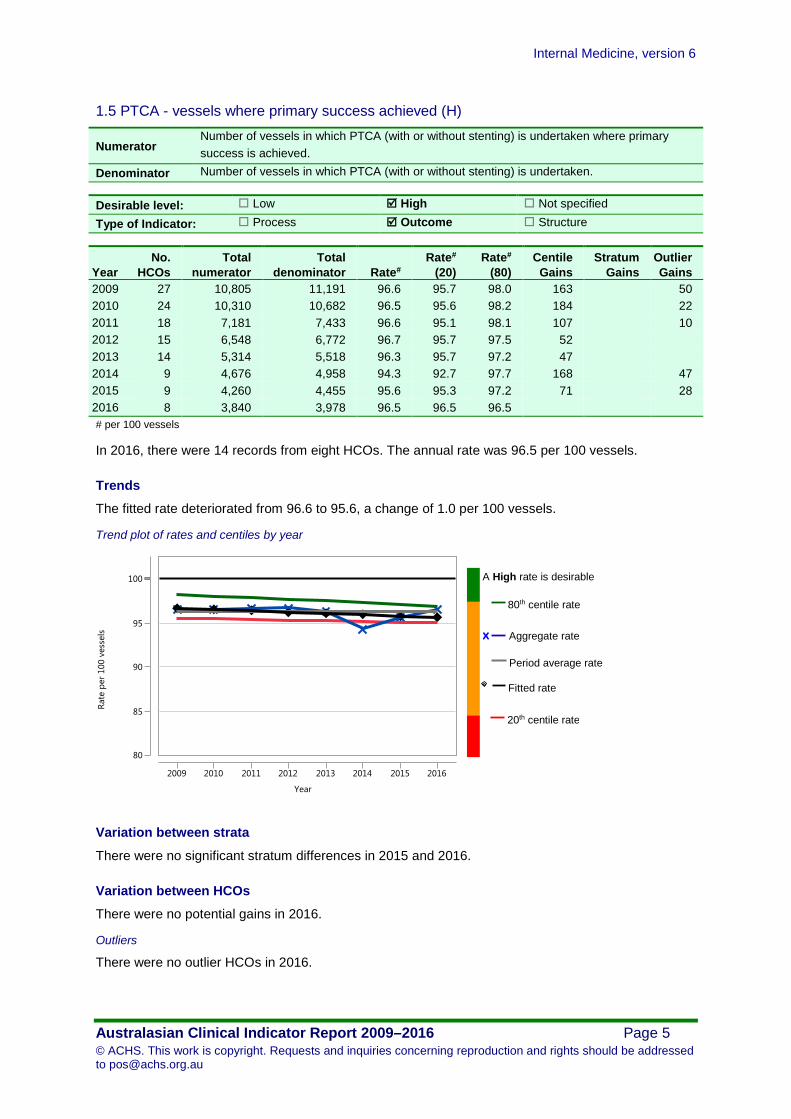
1.5 PTCA - vessels where primary success achieved (H)
Numerator Number of vessels in which PTCA (with or without stenting) is undertaken where primary success is achieved.
Denominator Number of vessels in which PTCA (with or without stenting) is undertaken.
Desirable level: Low High Not specified
Type of Indicator: Process Outcome Structure
Year No.
HCOs Total
numerator Total
denominator Rate# Rate#
(20) Rate#
(80) Centile
Gains Stratum
Gains Outlier Gains
2009 27 10,805 11,191 96.6 95.7 98.0 163 50 2010 24 10,310 10,682 96.5 95.6 98.2 184 22 2011 18 7,181 7,433 96.6 95.1 98.1 107 10 2012 15 6,548 6,772 96.7 95.7 97.5 52 2013 14 5,314 5,518 96.3 95.7 97.2 47 2014 9 4,676 4,958 94.3 92.7 97.7 168 47 2015 9 4,260 4,455 95.6 95.3 97.2 71 28 2016 8 3,840 3,978 96.5 96.5 96.5 # per 100 vessels
In 2016, there were 14 records from eight HCOs. The annual rate was 96.5 per 100 vessels.
Trends
The fitted rate deteriorated from 96.6 to 95.6, a change of 1.0 per 100 vessels.
Trend plot of rates and centiles by year
Variation between strata
There were no significant stratum differences in 2015 and 2016.
Variation between HCOs
There were no potential gains in 2016.
Outliers
There were no outlier HCOs in 2016.
80
85
90
95
100
Rate
per
100
ves
sels
2009 2010 2011 2012 2013 2014 2015 2016
Year
Fitted rate
20th centile rate
80th centile rate
Aggregate rate x
A High rate is desirable
Period average rate

Internal Medicine, version 6
Australasian Clinical Indicator Report 2009–2016 Page 6 © ACHS. This work is copyright. Requests and inquiries concerning reproduction and rights should be addressed to [email protected]
Endocrine disease
2.1 Hospitalised patients with severe hypoglycaemia less than 2.8 mmol/L (L)
Rationale
Inappropriate management of diabetic patients creates the risk of severe hypoglycaemia, where the blood glucose level falls below 2.8 mmol/L.
Numerator Number of insulin treated diabetic inpatients with a recorded blood glucose level less than 2.8 mmol/L.
Denominator Number of insulin treated diabetic inpatients.
Desirable level: Low High Not specified
Type of Indicator: Process Outcome Structure
Year No.
HCOs Total
numerator Total
denominator Rate# Rate#
(20) Rate#
(80) Centile
Gains Stratum
Gains Outlier Gains
2015 1 3 92 3.26 3.26 3.26 2016 2 58 214 27.1 4.72 68.7 48 31 # per 100 patients
In 2016, there were two records from two HCOs. The annual rate was 27.1 per 100 patients.
Variation between strata
There were no significant stratum differences in 2015 and 2016.
Variation between HCOs
In 2016, the potential gains totalled 48 fewer insulin treated diabetic inpatients with a recorded blood glucose level less than 2.8 mmol/L, corresponding to a reduction by approximately four fifths.
Outliers
In 2016, there was one outlier record from one HCO whose combined excess was 31 more insulin treated diabetic inpatients with a recorded blood glucose level less than 2.8 mmol/L. The outlier HCO rate was 70.3 per 100 patients.
Internal Medicine, version 6
Australasian Clinical Indicator Report 2009–2016 Page 7 © ACHS. This work is copyright. Requests and inquiries concerning reproduction and rights should be addressed to [email protected]
Acute stroke management
3.1 Acute stroke - documentation of swallowing screen conducted within 24 hours prior to food or fluid intake (H)
Rationale
Stroke is a common condition that is resource intensive. Appropriate and timely assessment makes an important contribution to patient management. The incidence of dysphagia is common in acute stroke and is associated with an increased risk of complications, such as aspiration pneumonia, dehydration and malnutrition. Prompt screening, accurate assessment of function and early management are therefore needed to prevent these complications and promote recovery of functional swallow.
Numerator Number of inpatients with a primary diagnosis of acute stroke with documented evidence of a swallowing screen conducted within 24 hours prior to food or fluid intake.
Denominator Number of inpatients separated from hospital with a primary diagnosis of acute stroke.
Desirable level: Low High Not specified
Type of Indicator: Process Outcome Structure
Year No.
HCOs Total
numerator Total
denominator Rate# Rate#
(20) Rate#
(80) Centile
Gains Stratum
Gains Outlier Gains
2015 10 654 893 73.2 59.5 86.5 119 33 2016 8 733 1,075 68.2 63.2 74.0 62 # per 100 inpatients
In 2016, there were 12 records from eight HCOs. The annual rate was 68.2 per 100 inpatients.
Variation between strata
There were no significant stratum differences in 2015 and 2016.
Variation between HCOs
In 2016, the potential gains totalled 62 more inpatients with acute stroke who have timely swallowing screen.
Outliers
There were no outlier HCOs in 2016.
Internal Medicine, version 6
Australasian Clinical Indicator Report 2009–2016 Page 8 © ACHS. This work is copyright. Requests and inquiries concerning reproduction and rights should be addressed to [email protected]
3.2 Acute stroke - documented physiotherapy assessment within 48 hours of presentation (H)
Numerator Number of inpatients with a primary diagnosis of acute stroke with documented physiotherapy assessment within 48 hours of presentation to hospital.
Denominator Number of inpatients separated from hospital with a primary diagnosis of acute stroke.
Desirable level: Low High Not specified
Type of Indicator: Process Outcome Structure
Year No.
HCOs Total
numerator Total
denominator Rate# Rate#
(20) Rate#
(80) Centile
Gains Stratum
Gains Outlier Gains
2010 6 170 234 72.6 70.3 72.7 2011 10 441 557 79.2 71.6 83.9 26 2012 10 633 738 85.8 79.9 91.0 39 2013 13 717 923 77.7 61.2 91.2 124 39 2014 9 561 654 85.8 78.9 88.7 19 2015 9 637 739 86.2 83.9 88.7 19 7 2016 8 744 1,090 68.3 59.3 88.6 221 37 # per 100 inpatients
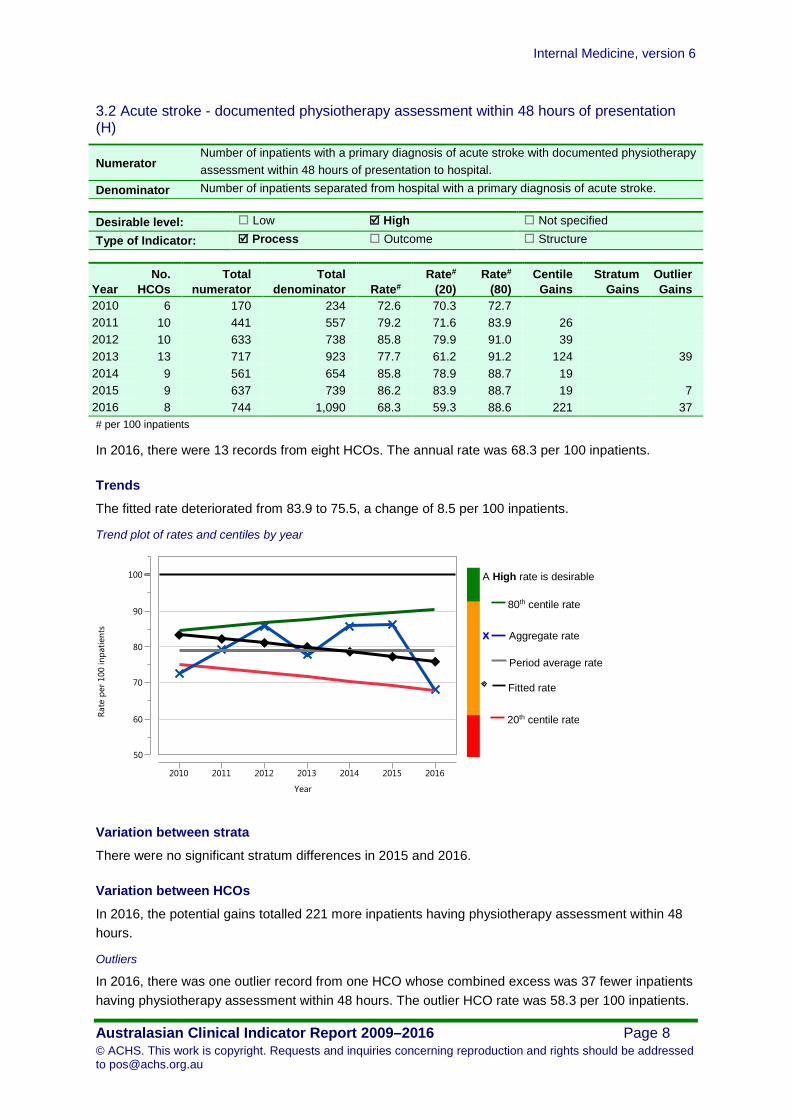
In 2016, there were 13 records from eight HCOs. The annual rate was 68.3 per 100 inpatients.
Trends
The fitted rate deteriorated from 83.9 to 75.5, a change of 8.5 per 100 inpatients.
Trend plot of rates and centiles by year
Variation between strata
There were no significant stratum differences in 2015 and 2016.
Variation between HCOs
In 2016, the potential gains totalled 221 more inpatients having physiotherapy assessment within 48 hours.
Outliers
In 2016, there was one outlier record from one HCO whose combined excess was 37 fewer inpatients having physiotherapy assessment within 48 hours. The outlier HCO rate was 58.3 per 100 inpatients.
50
60
70
80
90
100
Rate
per
100
inpa
tient
s
2010 2011 2012 2013 2014 2015 2016
Year
Fitted rate
20th centile rate
80th centile rate
Aggregate rate x
A High rate is desirable
Period average rate
Internal Medicine, version 6
Australasian Clinical Indicator Report 2009–2016 Page 9 © ACHS. This work is copyright. Requests and inquiries concerning reproduction and rights should be addressed to [email protected]
3.3 Acute stroke - plan for ongoing community care provided to patient / family (H)
Numerator Number of inpatients with a primary diagnosis of acute stroke with evidence that a documented plan for their ongoing care in the community was developed and provided to the patient/family prior to discharge.
Denominator Number of inpatients discharged to a private residence from hospital with a primary diagnosis of acute stroke.
Desirable level: Low High Not specified
Type of Indicator: Process Outcome Structure
Year No.
HCOs Total
numerator Total
denominator Rate# Rate#
(20) Rate#
(80) Centile
Gains Stratum
Gains Outlier Gains
2010 4 71 106 67.0 55.1 83.5 18 2011 7 367 522 70.3 72.8 80.8 55 2012 8 336 463 72.6 62.5 90.8 84 2013 9 278 426 65.3 62.3 83.1 76 47 2014 8 206 359 57.4 20.2 82.5 90 47 2015 9 399 468 85.3 73.0 95.9 50 2016 9 874 1,030 84.9 79.4 91.9 73 19 # per 100 inpatients
In 2016, there were 14 records from nine HCOs. The annual rate was 84.9 per 100 inpatients.
Variation between strata
There were no significant stratum differences in 2015 and 2016.
Variation between HCOs
In 2016, the potential gains totalled 73 more inpatients with evidence of a documented plan prior to discharge.
Outliers
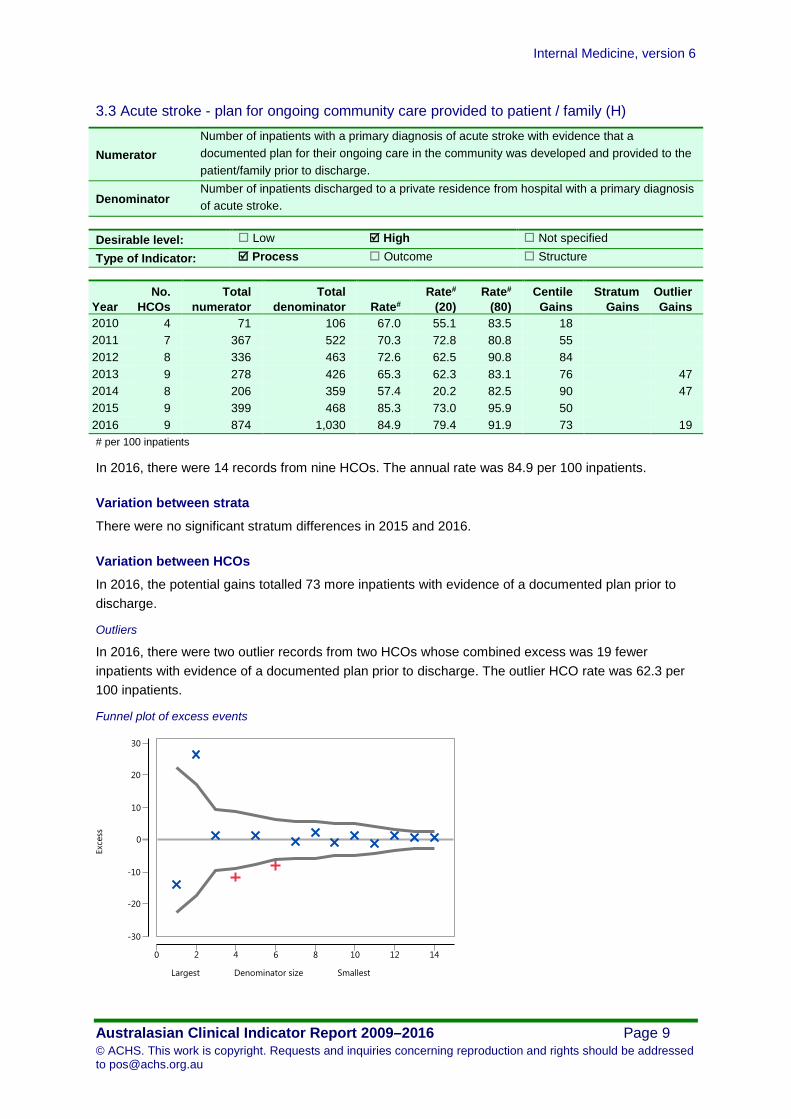
In 2016, there were two outlier records from two HCOs whose combined excess was 19 fewer inpatients with evidence of a documented plan prior to discharge. The outlier HCO rate was 62.3 per 100 inpatients.
Funnel plot of excess events
-30
-20
-10
0
10
20
30
Exce
ss
0 2 4 6 8 10 12 14
Largest Denominator size Smallest
Internal Medicine, version 6
Australasian Clinical Indicator Report 2009–2016 Page 10 © ACHS. This work is copyright. Requests and inquiries concerning reproduction and rights should be addressed to [email protected]
3.4 Acute stroke - documented treatment in a stroke unit during hospital stay (H)
Numerator Number of inpatients with a primary diagnosis of acute stroke that have documented treatment in a stroke unit at any time during their hospital stay.
Denominator Number of inpatients separated from hospital with a primary diagnosis of acute stroke.
Desirable level: Low High Not specified
Type of Indicator: Process Outcome Structure
Year No.
HCOs Total
numerator Total
denominator Rate# Rate#
(20) Rate#
(80) Centile
Gains Stratum
Gains Outlier Gains
2010 3 106 122 86.9 75.9 91.7 6 2011 10 637 967 65.9 46.0 95.4 286 60 2012 8 762 983 77.5 62.3 97.8 199 53 2013 11 552 854 64.6 34.1 97.9 284 134 2014 8 655 778 84.2 70.4 93.8 74 22 2015 10 954 1,176 81.1 72.7 89.1 94 40 2016 8 1,064 1,332 79.9 63.6 85.9 81 39 # per 100 inpatients
In 2016, there were 12 records from eight HCOs. The annual rate was 79.9 per 100 inpatients.
Variation between strata
There were no significant stratum differences in 2015 and 2016.
Variation between HCOs
In 2016, the potential gains totalled 81 more inpatients that have documented treatment in a stroke unit.
Outliers
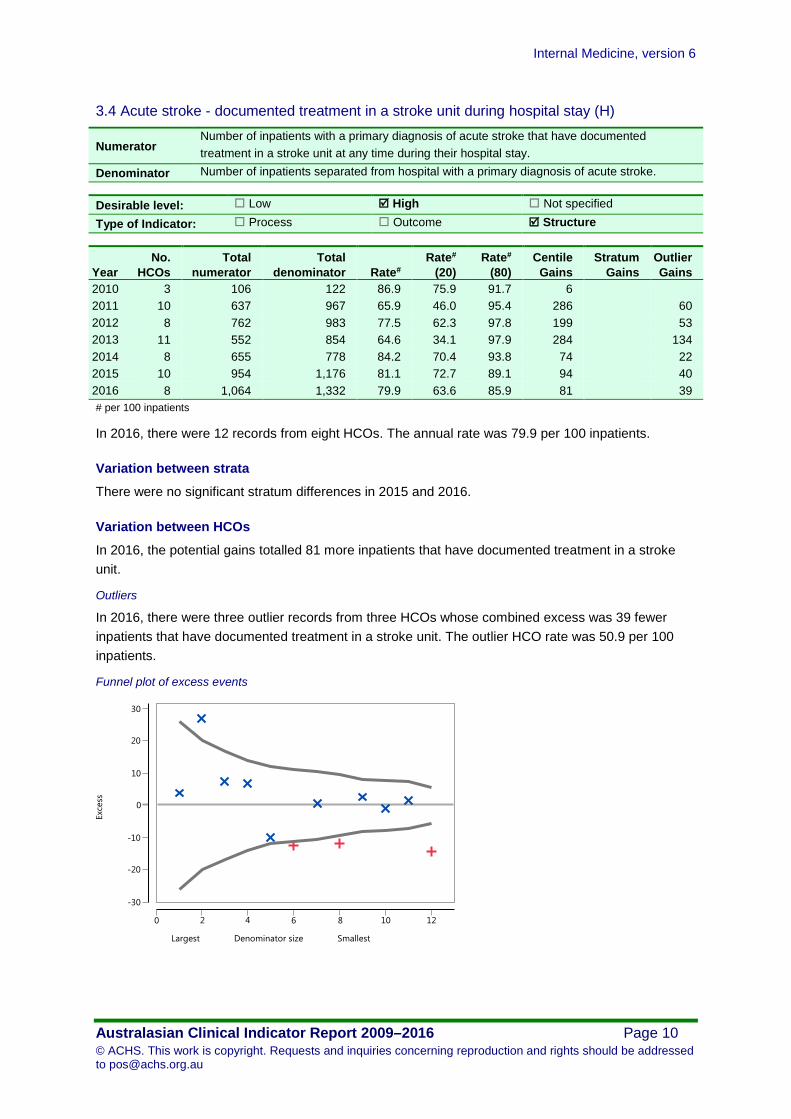
In 2016, there were three outlier records from three HCOs whose combined excess was 39 fewer inpatients that have documented treatment in a stroke unit. The outlier HCO rate was 50.9 per 100 inpatients.
Funnel plot of excess events
-30
-20
-10
0
10
20
30
Exce
ss
0 2 4 6 8 10 12
Largest Denominator size Smallest

Internal Medicine, version 6
Australasian Clinical Indicator Report 2009–2016 Page 11 © ACHS. This work is copyright. Requests and inquiries concerning reproduction and rights should be addressed to [email protected]
Care of the elderly
4.1 Medical patients 65 years or older - cognition assessment using validated tool (H)
Rationale
Screening acutely hospitalised older patients' cognitive status is important for predicting functional outcomes after admission and discharge. Impaired cognitive performance on admission was associated with limited recovery both for routine tasks (eg. basic ADL such as eating and bathing) and tasks that required higher-order cognitive processing (eg. ADL such as managing money and using the telephone). Cognitive screening increases the likelihood of detecting delirium, where early intervention and treatment may reduce the severity and duration of delirium.
Numerator Number of medical patients 65 years or older who have had their cognition assessed using a validated tool such as the MMSE.
Denominator Number of patients 65 years or older.
Desirable level: Low High Not specified
Type of Indicator: Process Outcome Structure
Year No.
HCOs Total
numerator Total
denominator Rate# Rate#
(20) Rate#
(80) Centile
Gains Stratum
Gains Outlier Gains
2009 16 3,675 4,863 75.6 53.3 99.1 1,146 428 2010 13 3,413 4,774 71.5 62.1 91.9 976 246 2011 14 4,561 6,081 75.0 60.7 89.5 884 358 2012 12 3,223 4,815 66.9 30.5 88.6 1,043 584 2013 7 2,308 3,686 62.6 18.7 80.0 640 331 2014 5 2,492 2,998 83.1 56.1 91.0 235 219 2015 5 2,221 2,981 74.5 25.2 98.3 708 398 2016 5 2,763 3,541 78.0 35.2 99.3 752 330 # per 100 patients
In 2016, there were eight records from five HCOs. The annual rate was 78.0 per 100 patients.
Trends
The fitted rate improved from 71.4 to 75.5, a change of 4.2 per 100 patients.
Trend plot of rates and centiles by year
10
20
30
40
50
60
70
80
90
100
Rate
per
100
pat
ient
s
2009 2010 2011 2012 2013 2014 2015 2016
Year
Fitted rate
20th centile rate
80th centile rate
Aggregate rate x
A High rate is desirable
Period average rate
Internal Medicine, version 6
Australasian Clinical Indicator Report 2009–2016 Page 12 © ACHS. This work is copyright. Requests and inquiries concerning reproduction and rights should be addressed to [email protected]
Variation between strata
There were no significant stratum differences in 2015 and 2016.
Variation between HCOs
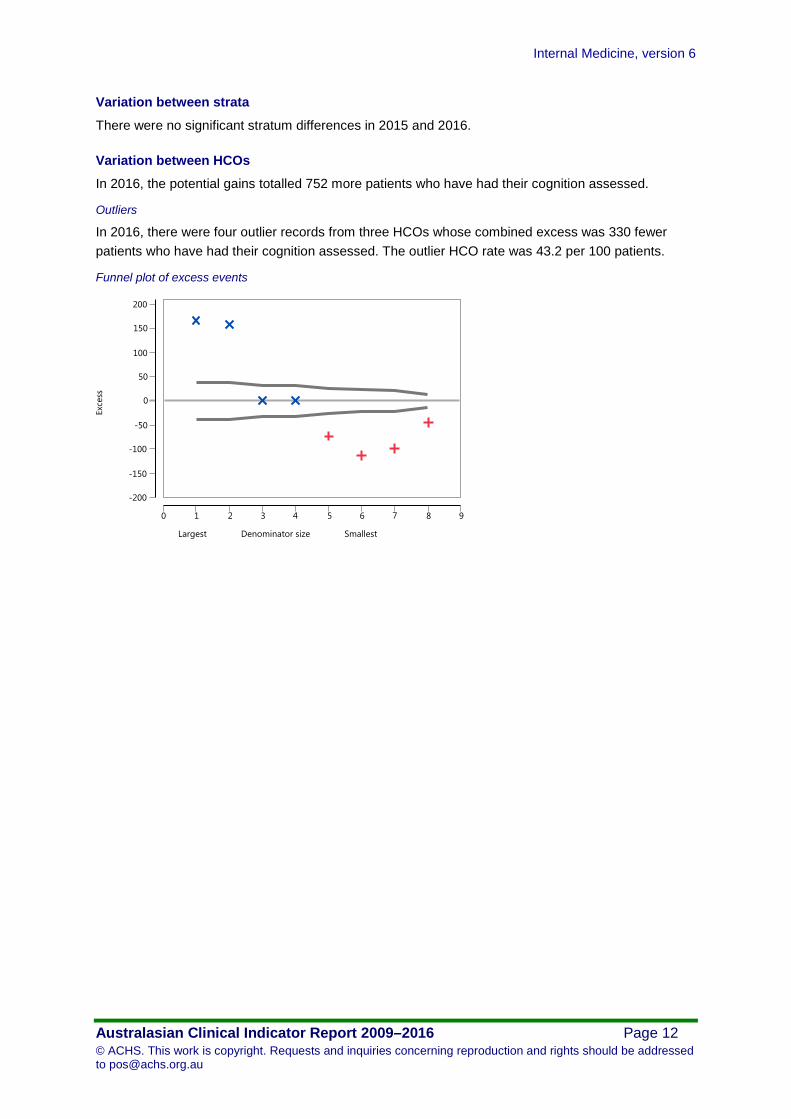
In 2016, the potential gains totalled 752 more patients who have had their cognition assessed.
Outliers
In 2016, there were four outlier records from three HCOs whose combined excess was 330 fewer patients who have had their cognition assessed. The outlier HCO rate was 43.2 per 100 patients.
Funnel plot of excess events
-200
-150
-100
-50
0
50
100
150
200
Exce
ss
0 1 2 3 4 5 6 7 8 9
Largest Denominator size Smallest

Internal Medicine, version 6
Australasian Clinical Indicator Report 2009–2016 Page 13 © ACHS. This work is copyright. Requests and inquiries concerning reproduction and rights should be addressed to [email protected]
4.2 Geriatric patients - documented assessment of physical function (H)
Numerator Number of patients admitted to a geriatric medicine or geriatric rehabilitation unit for whom there is documented objective assessment of physical function on admission, and at least once more during the inpatient stay.
Denominator Number of patients admitted to a geriatric medicine or geriatric rehabilitation unit.
Desirable level: Low High Not specified
Type of Indicator: Process Outcome Structure
Year No.
HCOs Total
numerator Total
denominator Rate# Rate#
(20) Rate#
(80) Centile
Gains Stratum
Gains Outlier Gains
2009 18 7,947 8,550 92.9 85.4 99.8 587 302 2010 14 7,916 8,358 94.7 87.1 99.9 436 191 2011 15 7,532 7,922 95.1 89.7 99.9 382 143 2012 14 6,003 6,402 93.8 88.8 99.9 390 235 2013 5 2,340 2,950 79.3 1.42 97.8 545 207 2014 4 2,768 2,981 92.9 89.0 97.6 143 29 2015 6 3,070 3,177 96.6 94.8 98.5 58 29 2016 7 4,638 4,773 97.2 95.3 100 134 96 # per 100 patients
In 2016, there were 12 records from seven HCOs. The annual rate was 97.2 per 100 patients.
Variation between strata
There were no significant stratum differences in 2015 and 2016.
Variation between HCOs
There was relatively little variation between HCOs and so the potential gains were small in 2016.
Outliers
In 2016, there was one outlier record from one HCO whose combined excess was 96 fewer patients having documented objective assessment of physical function. The outlier HCO rate was 69.0 per 100 patients.

Internal Medicine, version 6
Australasian Clinical Indicator Report 2009–2016 Page 14 © ACHS. This work is copyright. Requests and inquiries concerning reproduction and rights should be addressed to [email protected]
4.3 Documentation of delirium plan (H)
Numerator Number of patients who have documentation of a delirium plan.
Denominator Number of patients diagnosed with delirium.
Desirable level: Low High Not specified
Type of Indicator: Process Outcome Structure
Year No.
HCOs Total
numerator Total
denominator Rate# Rate#
(20) Rate#
(80) Centile
Gains Stratum
Gains Outlier Gains
2015 1 8 8 100 100 100 # per 100 patients
No data was submitted for this indicator in 2016
4.4 Documentation of follow-up plan after discharge (H)
Numerator Number of patients who have documentation of follow-up plan after discharge.
Denominator Number of patients diagnosed with delirium.
Desirable level: Low High Not specified
Type of Indicator: Process Outcome Structure
No data was submitted for this indicator in 2015 or 2016.
Internal Medicine, version 6
Australasian Clinical Indicator Report 2009–2016 Page 15 © ACHS. This work is copyright. Requests and inquiries concerning reproduction and rights should be addressed to [email protected]
Respiratory disease
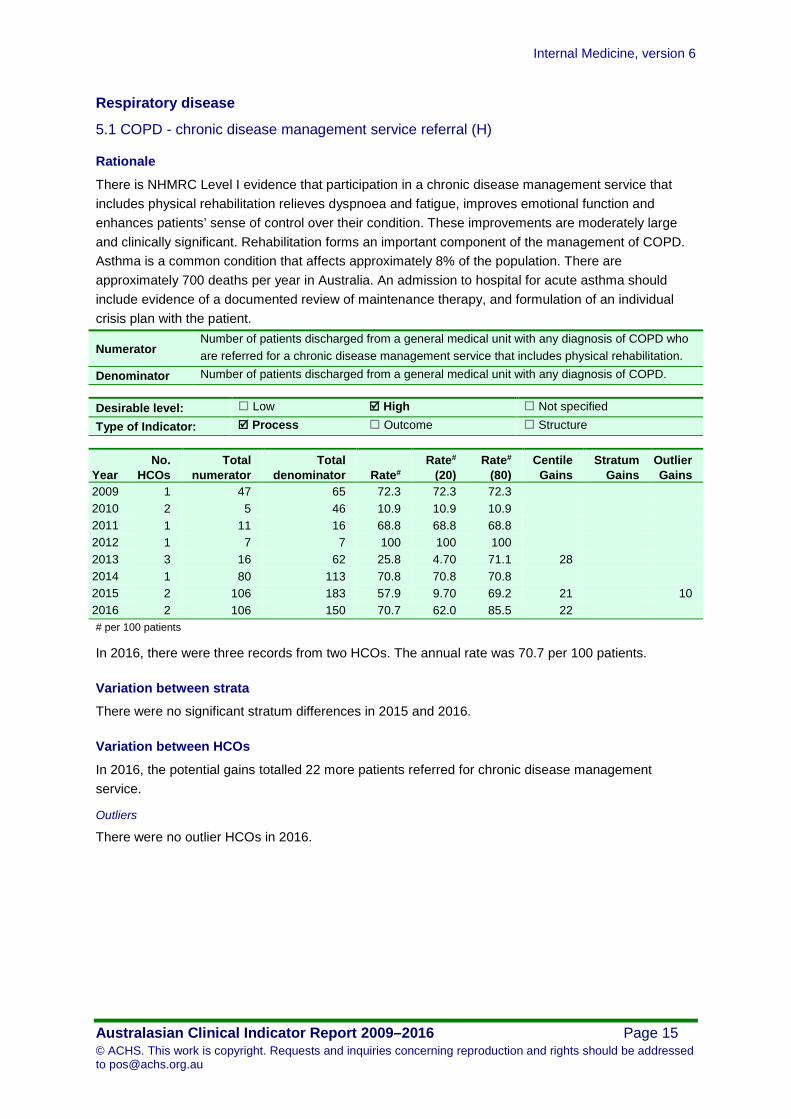
5.1 COPD - chronic disease management service referral (H)
Rationale
There is NHMRC Level I evidence that participation in a chronic disease management service that includes physical rehabilitation relieves dyspnoea and fatigue, improves emotional function and enhances patients’ sense of control over their condition. These improvements are moderately large and clinically significant. Rehabilitation forms an important component of the management of COPD. Asthma is a common condition that affects approximately 8% of the population. There are approximately 700 deaths per year in Australia. An admission to hospital for acute asthma should include evidence of a documented review of maintenance therapy, and formulation of an individual crisis plan with the patient.
Numerator Number of patients discharged from a general medical unit with any diagnosis of COPD who are referred for a chronic disease management service that includes physical rehabilitation.
Denominator Number of patients discharged from a general medical unit with any diagnosis of COPD.
Desirable level: Low High Not specified
Type of Indicator: Process Outcome Structure
Year No.
HCOs Total
numerator Total
denominator Rate# Rate#
(20) Rate#
(80) Centile
Gains Stratum
Gains Outlier Gains
2009 1 47 65 72.3 72.3 72.3 2010 2 5 46 10.9 10.9 10.9 2011 1 11 16 68.8 68.8 68.8 2012 1 7 7 100 100 100 2013 3 16 62 25.8 4.70 71.1 28 2014 1 80 113 70.8 70.8 70.8 2015 2 106 183 57.9 9.70 69.2 21 10 2016 2 106 150 70.7 62.0 85.5 22 # per 100 patients
In 2016, there were three records from two HCOs. The annual rate was 70.7 per 100 patients.
Variation between strata
There were no significant stratum differences in 2015 and 2016.
Variation between HCOs
In 2016, the potential gains totalled 22 more patients referred for chronic disease management service.
Outliers
There were no outlier HCOs in 2016.
Internal Medicine, version 6
Australasian Clinical Indicator Report 2009–2016 Page 16 © ACHS. This work is copyright. Requests and inquiries concerning reproduction and rights should be addressed to [email protected]
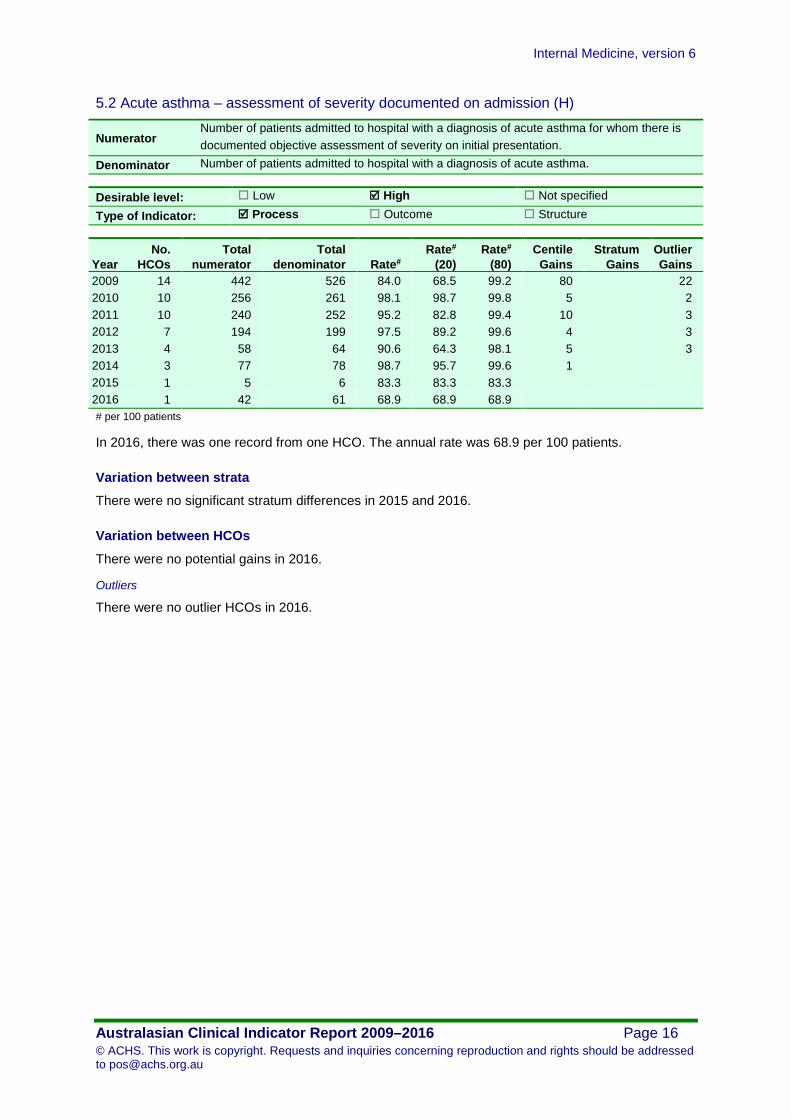
5.2 Acute asthma – assessment of severity documented on admission (H)
Numerator Number of patients admitted to hospital with a diagnosis of acute asthma for whom there is documented objective assessment of severity on initial presentation.
Denominator Number of patients admitted to hospital with a diagnosis of acute asthma.
Desirable level: Low High Not specified
Type of Indicator: Process Outcome Structure
Year No.
HCOs Total
numerator Total
denominator Rate# Rate#
(20) Rate#
(80) Centile
Gains Stratum
Gains Outlier Gains
2009 14 442 526 84.0 68.5 99.2 80 22 2010 10 256 261 98.1 98.7 99.8 5 2 2011 10 240 252 95.2 82.8 99.4 10 3 2012 7 194 199 97.5 89.2 99.6 4 3 2013 4 58 64 90.6 64.3 98.1 5 3 2014 3 77 78 98.7 95.7 99.6 1 2015 1 5 6 83.3 83.3 83.3 2016 1 42 61 68.9 68.9 68.9 # per 100 patients
In 2016, there was one record from one HCO. The annual rate was 68.9 per 100 patients.
Variation between strata
There were no significant stratum differences in 2015 and 2016.
Variation between HCOs
There were no potential gains in 2016.
Outliers
There were no outlier HCOs in 2016.
Internal Medicine, version 6
Australasian Clinical Indicator Report 2009–2016 Page 17 © ACHS. This work is copyright. Requests and inquiries concerning reproduction and rights should be addressed to [email protected]
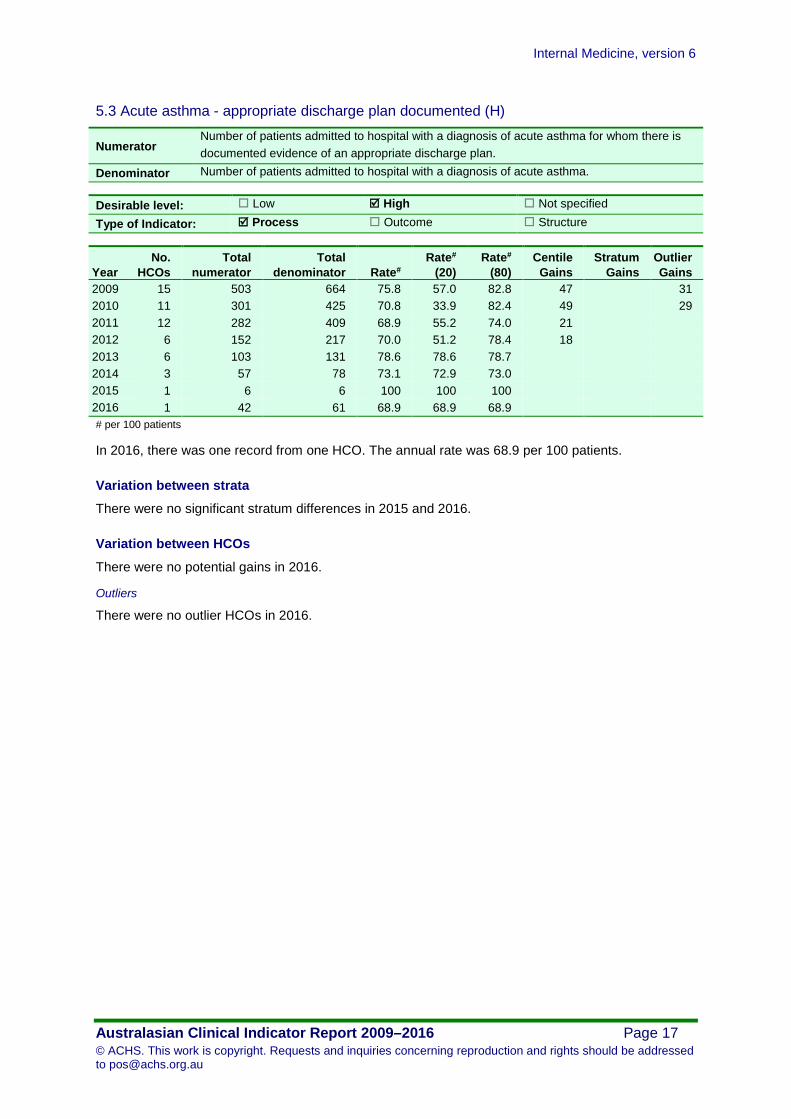
5.3 Acute asthma - appropriate discharge plan documented (H)
Numerator Number of patients admitted to hospital with a diagnosis of acute asthma for whom there is documented evidence of an appropriate discharge plan.
Denominator Number of patients admitted to hospital with a diagnosis of acute asthma.
Desirable level: Low High Not specified
Type of Indicator: Process Outcome Structure
Year No.
HCOs Total
numerator Total
denominator Rate# Rate#
(20) Rate#
(80) Centile
Gains Stratum
Gains Outlier Gains
2009 15 503 664 75.8 57.0 82.8 47 31 2010 11 301 425 70.8 33.9 82.4 49 29 2011 12 282 409 68.9 55.2 74.0 21 2012 6 152 217 70.0 51.2 78.4 18 2013 6 103 131 78.6 78.6 78.7 2014 3 57 78 73.1 72.9 73.0 2015 1 6 6 100 100 100 2016 1 42 61 68.9 68.9 68.9 # per 100 patients
In 2016, there was one record from one HCO. The annual rate was 68.9 per 100 patients.
Variation between strata
There were no significant stratum differences in 2015 and 2016.
Variation between HCOs
There were no potential gains in 2016.
Outliers
There were no outlier HCOs in 2016.
Internal Medicine, version 6
Australasian Clinical Indicator Report 2009–2016 Page 18 © ACHS. This work is copyright. Requests and inquiries concerning reproduction and rights should be addressed to [email protected]
Gastrointestinal disease
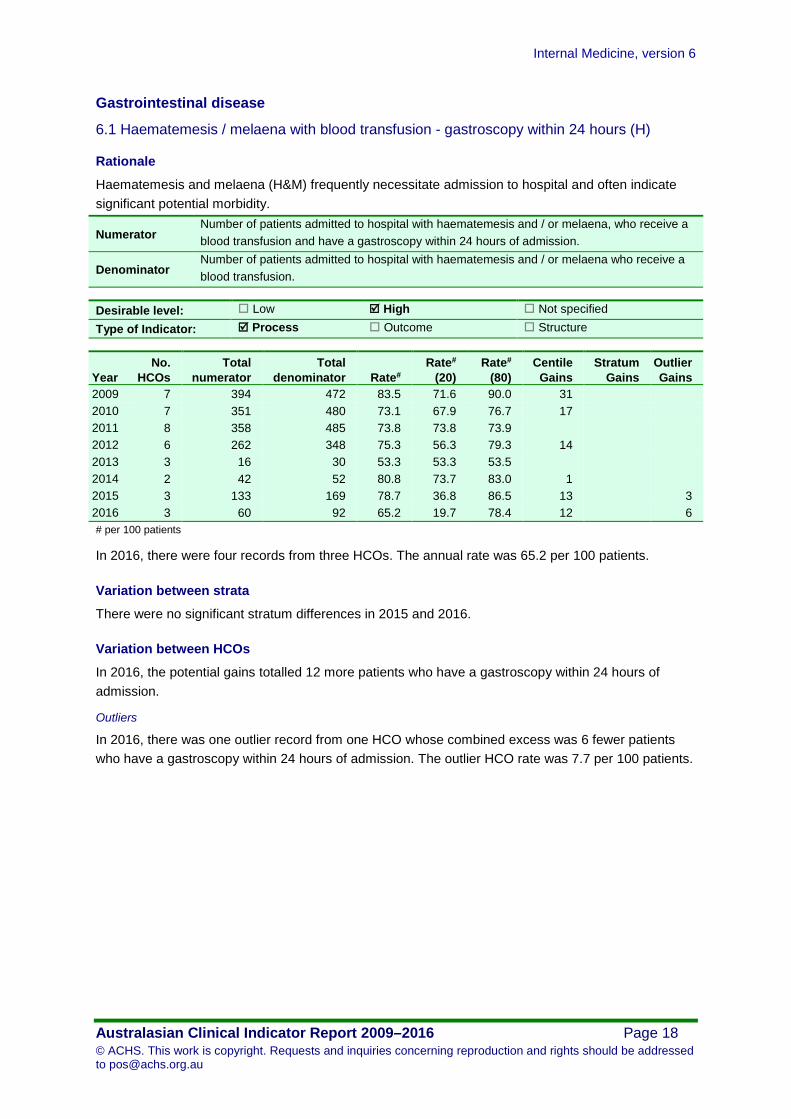
6.1 Haematemesis / melaena with blood transfusion - gastroscopy within 24 hours (H)
Rationale
Haematemesis and melaena (H&M) frequently necessitate admission to hospital and often indicate significant potential morbidity.
Numerator Number of patients admitted to hospital with haematemesis and / or melaena, who receive a blood transfusion and have a gastroscopy within 24 hours of admission.
Denominator Number of patients admitted to hospital with haematemesis and / or melaena who receive a blood transfusion.
Desirable level: Low High Not specified
Type of Indicator: Process Outcome Structure
Year No.
HCOs Total
numerator Total
denominator Rate# Rate#
(20) Rate#
(80) Centile
Gains Stratum
Gains Outlier Gains
2009 7 394 472 83.5 71.6 90.0 31 2010 7 351 480 73.1 67.9 76.7 17 2011 8 358 485 73.8 73.8 73.9 2012 6 262 348 75.3 56.3 79.3 14 2013 3 16 30 53.3 53.3 53.5 2014 2 42 52 80.8 73.7 83.0 1 2015 3 133 169 78.7 36.8 86.5 13 3 2016 3 60 92 65.2 19.7 78.4 12 6 # per 100 patients
In 2016, there were four records from three HCOs. The annual rate was 65.2 per 100 patients.
Variation between strata
There were no significant stratum differences in 2015 and 2016.
Variation between HCOs
In 2016, the potential gains totalled 12 more patients who have a gastroscopy within 24 hours of admission.
Outliers
In 2016, there was one outlier record from one HCO whose combined excess was 6 fewer patients who have a gastroscopy within 24 hours of admission. The outlier HCO rate was 7.7 per 100 patients.
Internal Medicine, version 6
Australasian Clinical Indicator Report 2009–2016 Page 19 © ACHS. This work is copyright. Requests and inquiries concerning reproduction and rights should be addressed to [email protected]
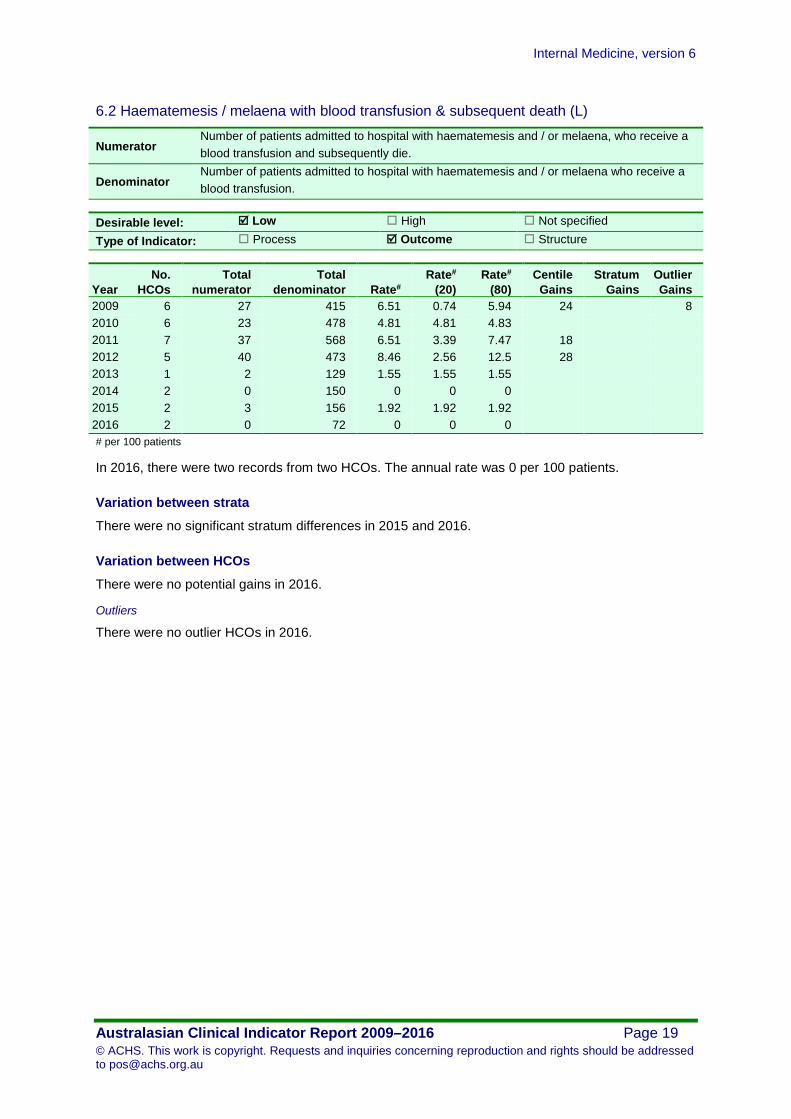
6.2 Haematemesis / melaena with blood transfusion & subsequent death (L)
Numerator Number of patients admitted to hospital with haematemesis and / or melaena, who receive a blood transfusion and subsequently die.
Denominator Number of patients admitted to hospital with haematemesis and / or melaena who receive a blood transfusion.
Desirable level: Low High Not specified
Type of Indicator: Process Outcome Structure
Year No.
HCOs Total
numerator Total
denominator Rate# Rate#
(20) Rate#
(80) Centile
Gains Stratum
Gains Outlier Gains
2009 6 27 415 6.51 0.74 5.94 24 8 2010 6 23 478 4.81 4.81 4.83 2011 7 37 568 6.51 3.39 7.47 18 2012 5 40 473 8.46 2.56 12.5 28 2013 1 2 129 1.55 1.55 1.55 2014 2 0 150 0 0 0 2015 2 3 156 1.92 1.92 1.92 2016 2 0 72 0 0 0 # per 100 patients
In 2016, there were two records from two HCOs. The annual rate was 0 per 100 patients.
Variation between strata
There were no significant stratum differences in 2015 and 2016.
Variation between HCOs
There were no potential gains in 2016.
Outliers
There were no outlier HCOs in 2016.
Internal Medicine, version 6
Australasian Clinical Indicator Report 2009–2016 Page 20 © ACHS. This work is copyright. Requests and inquiries concerning reproduction and rights should be addressed to [email protected]
Oncology
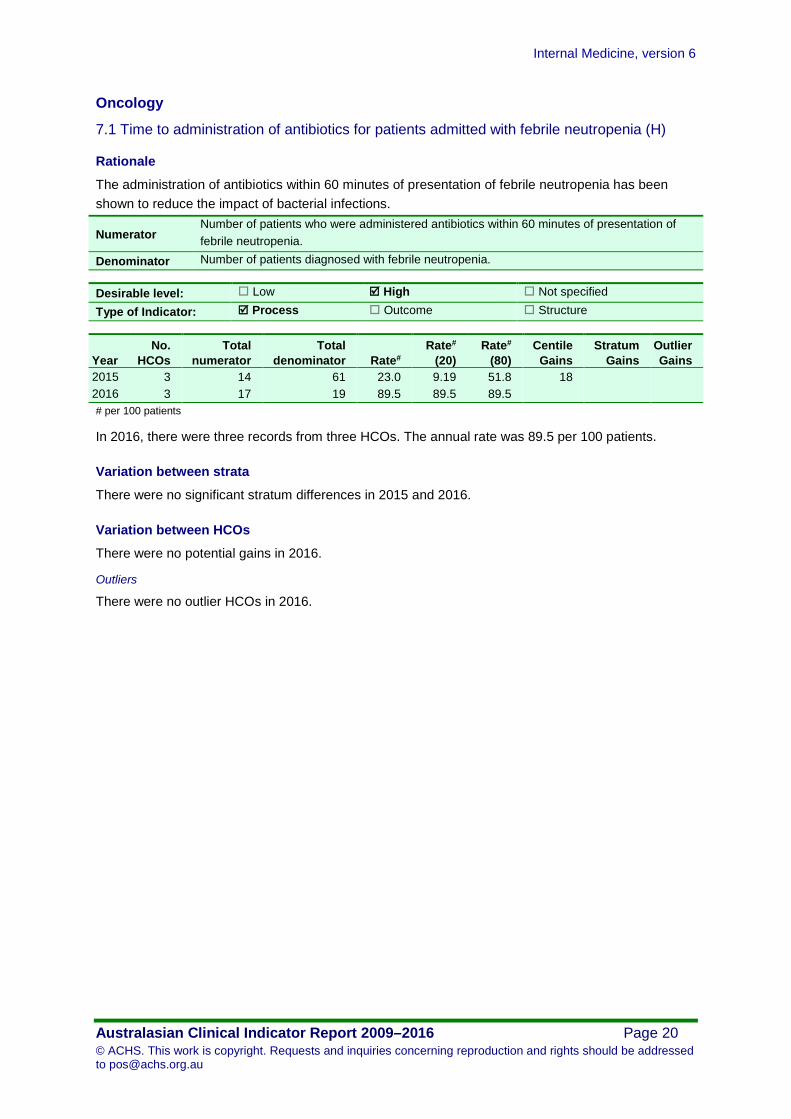
7.1 Time to administration of antibiotics for patients admitted with febrile neutropenia (H)
Rationale
The administration of antibiotics within 60 minutes of presentation of febrile neutropenia has been shown to reduce the impact of bacterial infections.
Numerator Number of patients who were administered antibiotics within 60 minutes of presentation of febrile neutropenia.
Denominator Number of patients diagnosed with febrile neutropenia.
Desirable level: Low High Not specified
Type of Indicator: Process Outcome Structure
Year No.
HCOs Total
numerator Total
denominator Rate# Rate#
(20) Rate#
(80) Centile
Gains Stratum
Gains Outlier Gains
2015 3 14 61 23.0 9.19 51.8 18 2016 3 17 19 89.5 89.5 89.5 # per 100 patients
In 2016, there were three records from three HCOs. The annual rate was 89.5 per 100 patients.
Variation between strata
There were no significant stratum differences in 2015 and 2016.
Variation between HCOs
There were no potential gains in 2016.
Outliers
There were no outlier HCOs in 2016.
Internal Medicine, version 6
Australasian Clinical Indicator Report 2009–2016 Page 21 © ACHS. This work is copyright. Requests and inquiries concerning reproduction and rights should be addressed to [email protected]
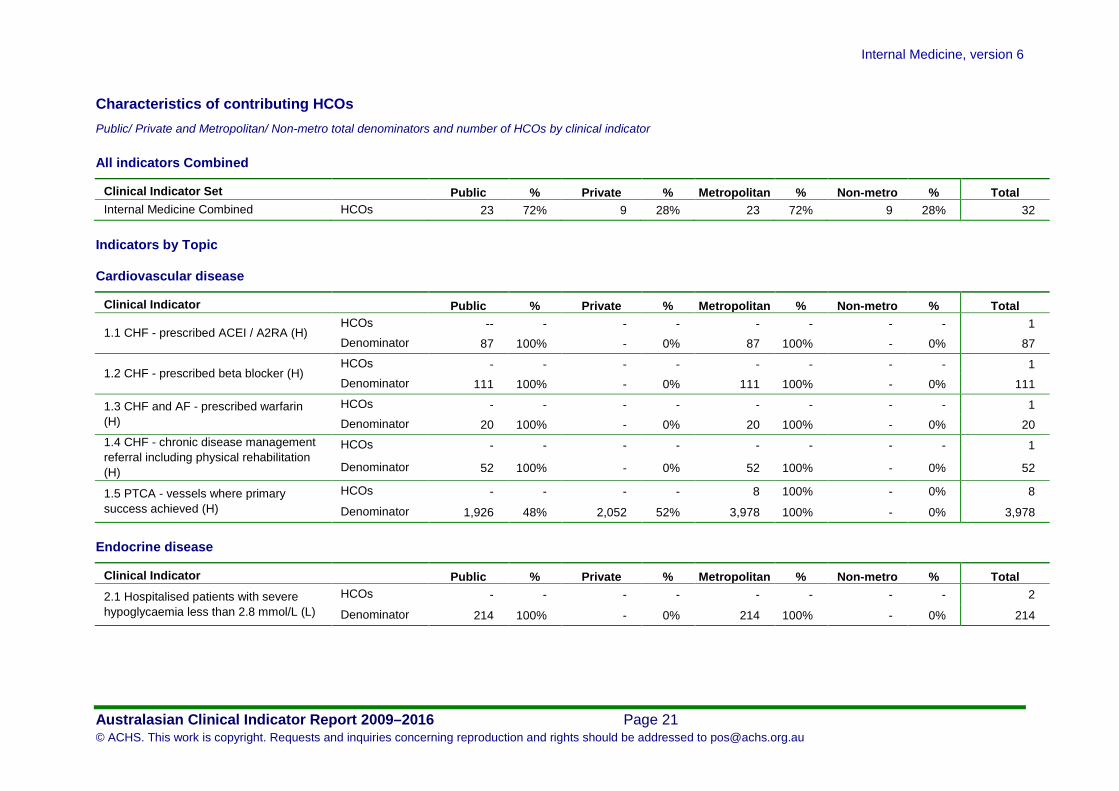
Characteristics of contributing HCOs Public/ Private and Metropolitan/ Non-metro total denominators and number of HCOs by clinical indicator
All indicators Combined
Clinical Indicator Set
Public % Private % Metropolitan % Non-metro % Total Internal Medicine Combined HCOs 23 72% 9 28% 23 72% 9 28% 32
Indicators by Topic
Cardiovascular disease
Clinical Indicator Public % Private % Metropolitan % Non-metro % Total
1.1 CHF - prescribed ACEI / A2RA (H) HCOs -- - - - - - - - 1 Denominator 87 100% - 0% 87 100% - 0% 87
1.2 CHF - prescribed beta blocker (H) HCOs - - - - - - - - 1 Denominator 111 100% - 0% 111 100% - 0% 111
1.3 CHF and AF - prescribed warfarin (H)
HCOs - - - - - - - - 1 Denominator 20 100% - 0% 20 100% - 0% 20
1.4 CHF - chronic disease management referral including physical rehabilitation (H)
HCOs - - - - - - - - 1
Denominator 52 100% - 0% 52 100% - 0% 52
1.5 PTCA - vessels where primary success achieved (H)
HCOs - - - - 8 100% - 0% 8
Denominator 1,926 48% 2,052 52% 3,978 100% - 0% 3,978
Endocrine disease
Clinical Indicator Public % Private % Metropolitan % Non-metro % Total 2.1 Hospitalised patients with severe hypoglycaemia less than 2.8 mmol/L (L)
HCOs - - - - - - - - 2
Denominator 214 100% - 0% 214 100% - 0% 214

Internal Medicine, version 6
Australasian Clinical Indicator Report 2009–2016 Page 22 © ACHS. This work is copyright. Requests and inquiries concerning reproduction and rights should be addressed to [email protected]
Acute stroke management
Clinical Indicator Public % Private % Metropolitan % Non-metro % Total 3.1 Acute stroke - documentation of swallowing screen conducted within 24 hours prior to food or fluid intake (H)
HCOs - - - - - - - - 8
Denominator 911 85% 164 15% 781 73% 294 27% 1,075
3.2 Acute stroke - documented physiotherapy assessment within 48 hours of presentation (H)
HCOs - - - - - - - - 8
Denominator 926 85% 164 15% 781 72% 309 28% 1,090
3.3 Acute stroke - plan for ongoing community care provided to patient / family (H)
HCOs - - - - - - - - 9
Denominator 927 90% 103 10% 875 85% 155 15% 1,030
3.4 Acute stroke - documented treatment in a stroke unit during hospital stay (H)
HCOs - - - - - - - - 8
Denominator 1,168 88% 164 12% 1,128 85% 204 15% 1,332
Care of the elderly
Clinical Indicator Public % Private % Metropolitan % Non-metro % Total 4.1 Medical patients 65 years or older - cognition assessment using validated tool (H)
HCOs - - - - - - - - 5
Denominator 3,541 100% - 0% 3,541 100% - 0% 3,541
4.2 Geriatric patients - documented assessment of physical function (H)
HCOs - - - - - - - - 7
Denominator 3,527 74% 1,246 26% 4,773 100% - 0% 4,773
Respiratory disease
Clinical Indicator Public % Private % Metropolitan % Non-metro % Total 5.1 COPD - chronic disease management service referral (H)
HCOs - - - - - - - - 2 Denominator 150 100% - 0% 48 32% 102 68% 150
5.2 Acute asthma - assessment of severity documented on admission (H)
HCOs - - - - - - - - 1 Denominator 61 100% - 0% 61 100% - 0% 61
5.3 Acute asthma - appropriate discharge plan documented (H)
HCOs - - - - - - - - 1
Denominator 61 100% - 0% 61 100% - 0% 61
Internal Medicine, version 6
Australasian Clinical Indicator Report 2009–2016 Page 23 © ACHS. This work is copyright. Requests and inquiries concerning reproduction and rights should be addressed to [email protected]
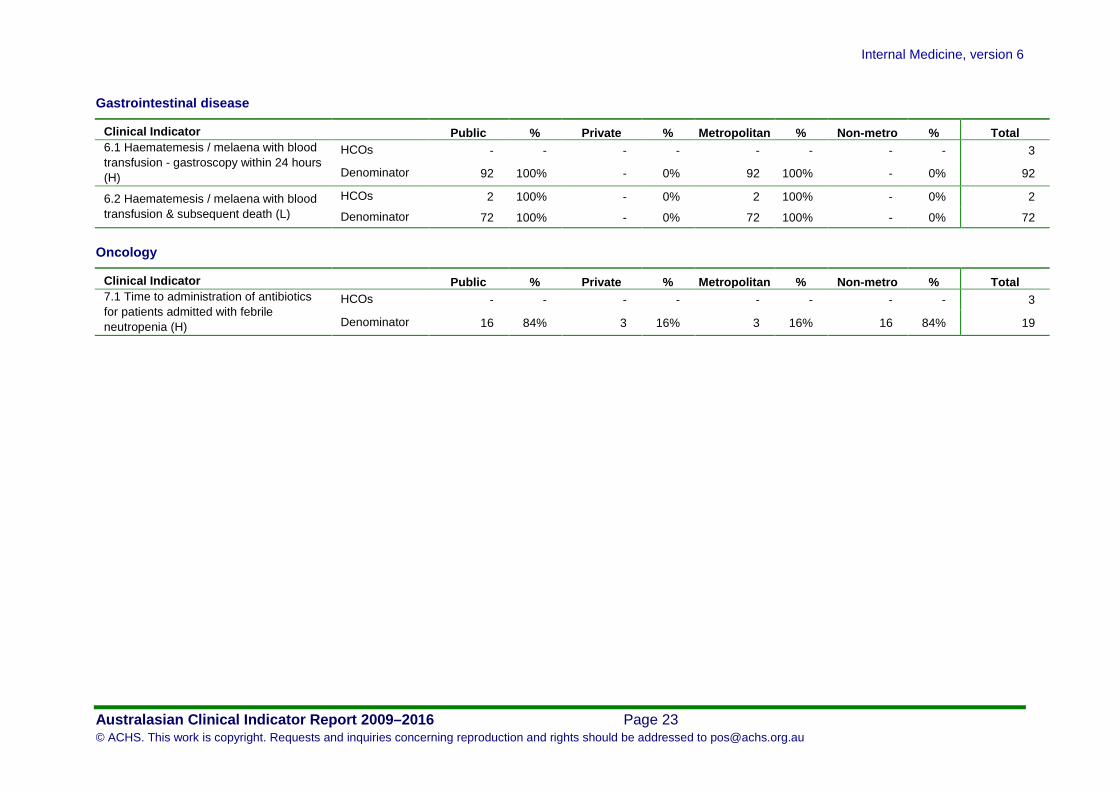
Gastrointestinal disease
Clinical Indicator Public % Private % Metropolitan % Non-metro % Total 6.1 Haematemesis / melaena with blood transfusion - gastroscopy within 24 hours (H)
HCOs - - - - - - - - 3
Denominator 92 100% - 0% 92 100% - 0% 92
6.2 Haematemesis / melaena with blood transfusion & subsequent death (L)
HCOs 2 100% - 0% 2 100% - 0% 2
Denominator 72 100% - 0% 72 100% - 0% 72
Oncology
Clinical Indicator Public % Private % Metropolitan % Non-metro % Total 7.1 Time to administration of antibiotics for patients admitted with febrile neutropenia (H)
HCOs - - - - - - - - 3
Denominator 16 84% 3 16% 3 16% 16 84% 19
Internal Medicine, version 6
Australasian Clinical Indicator Report 2009–2016 Page 24 © ACHS. This work is copyright. Requests and inquiries concerning reproduction and rights should be addressed to [email protected]
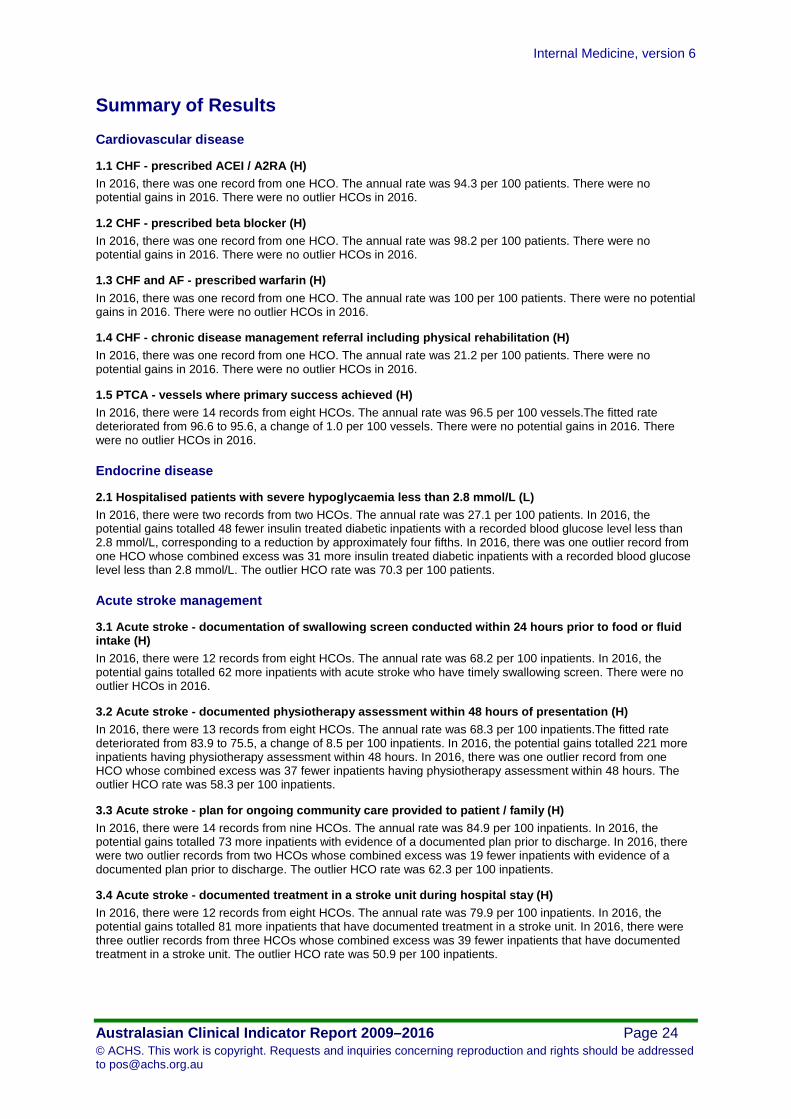
Summary of Results Cardiovascular disease
1.1 CHF - prescribed ACEI / A2RA (H) In 2016, there was one record from one HCO. The annual rate was 94.3 per 100 patients. There were no potential gains in 2016. There were no outlier HCOs in 2016.
1.2 CHF - prescribed beta blocker (H) In 2016, there was one record from one HCO. The annual rate was 98.2 per 100 patients. There were no potential gains in 2016. There were no outlier HCOs in 2016.
1.3 CHF and AF - prescribed warfarin (H) In 2016, there was one record from one HCO. The annual rate was 100 per 100 patients. There were no potential gains in 2016. There were no outlier HCOs in 2016.
1.4 CHF - chronic disease management referral including physical rehabilitation (H) In 2016, there was one record from one HCO. The annual rate was 21.2 per 100 patients. There were no potential gains in 2016. There were no outlier HCOs in 2016.
1.5 PTCA - vessels where primary success achieved (H) In 2016, there were 14 records from eight HCOs. The annual rate was 96.5 per 100 vessels.The fitted rate deteriorated from 96.6 to 95.6, a change of 1.0 per 100 vessels. There were no potential gains in 2016. There were no outlier HCOs in 2016.
Endocrine disease
2.1 Hospitalised patients with severe hypoglycaemia less than 2.8 mmol/L (L) In 2016, there were two records from two HCOs. The annual rate was 27.1 per 100 patients. In 2016, the potential gains totalled 48 fewer insulin treated diabetic inpatients with a recorded blood glucose level less than 2.8 mmol/L, corresponding to a reduction by approximately four fifths. In 2016, there was one outlier record from one HCO whose combined excess was 31 more insulin treated diabetic inpatients with a recorded blood glucose level less than 2.8 mmol/L. The outlier HCO rate was 70.3 per 100 patients.
Acute stroke management
3.1 Acute stroke - documentation of swallowing screen conducted within 24 hours prior to food or fluid intake (H) In 2016, there were 12 records from eight HCOs. The annual rate was 68.2 per 100 inpatients. In 2016, the potential gains totalled 62 more inpatients with acute stroke who have timely swallowing screen. There were no outlier HCOs in 2016.
3.2 Acute stroke - documented physiotherapy assessment within 48 hours of presentation (H) In 2016, there were 13 records from eight HCOs. The annual rate was 68.3 per 100 inpatients.The fitted rate deteriorated from 83.9 to 75.5, a change of 8.5 per 100 inpatients. In 2016, the potential gains totalled 221 more inpatients having physiotherapy assessment within 48 hours. In 2016, there was one outlier record from one HCO whose combined excess was 37 fewer inpatients having physiotherapy assessment within 48 hours. The outlier HCO rate was 58.3 per 100 inpatients.
3.3 Acute stroke - plan for ongoing community care provided to patient / family (H) In 2016, there were 14 records from nine HCOs. The annual rate was 84.9 per 100 inpatients. In 2016, the potential gains totalled 73 more inpatients with evidence of a documented plan prior to discharge. In 2016, there were two outlier records from two HCOs whose combined excess was 19 fewer inpatients with evidence of a documented plan prior to discharge. The outlier HCO rate was 62.3 per 100 inpatients.
3.4 Acute stroke - documented treatment in a stroke unit during hospital stay (H) In 2016, there were 12 records from eight HCOs. The annual rate was 79.9 per 100 inpatients. In 2016, the potential gains totalled 81 more inpatients that have documented treatment in a stroke unit. In 2016, there were three outlier records from three HCOs whose combined excess was 39 fewer inpatients that have documented treatment in a stroke unit. The outlier HCO rate was 50.9 per 100 inpatients.
Internal Medicine, version 6
Australasian Clinical Indicator Report 2009–2016 Page 25 © ACHS. This work is copyright. Requests and inquiries concerning reproduction and rights should be addressed to [email protected]
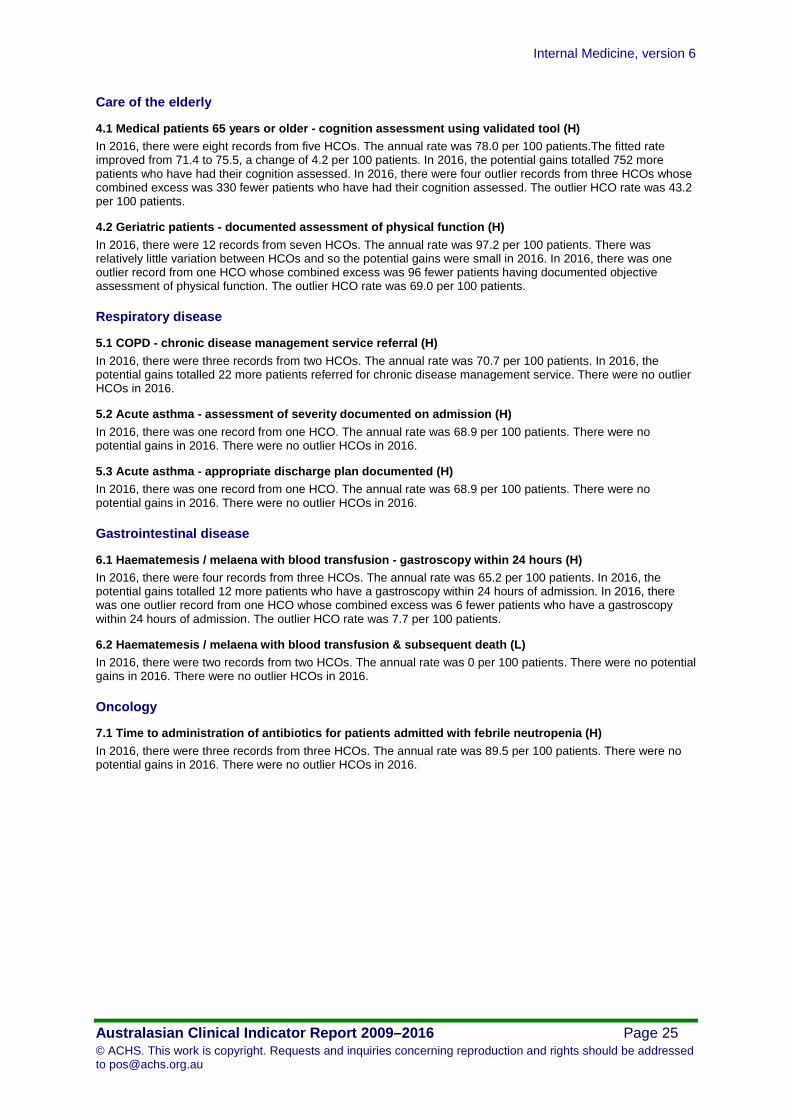
Care of the elderly
4.1 Medical patients 65 years or older - cognition assessment using validated tool (H) In 2016, there were eight records from five HCOs. The annual rate was 78.0 per 100 patients.The fitted rate improved from 71.4 to 75.5, a change of 4.2 per 100 patients. In 2016, the potential gains totalled 752 more patients who have had their cognition assessed. In 2016, there were four outlier records from three HCOs whose combined excess was 330 fewer patients who have had their cognition assessed. The outlier HCO rate was 43.2 per 100 patients.
4.2 Geriatric patients - documented assessment of physical function (H) In 2016, there were 12 records from seven HCOs. The annual rate was 97.2 per 100 patients. There was relatively little variation between HCOs and so the potential gains were small in 2016. In 2016, there was one outlier record from one HCO whose combined excess was 96 fewer patients having documented objective assessment of physical function. The outlier HCO rate was 69.0 per 100 patients.
Respiratory disease
5.1 COPD - chronic disease management service referral (H) In 2016, there were three records from two HCOs. The annual rate was 70.7 per 100 patients. In 2016, the potential gains totalled 22 more patients referred for chronic disease management service. There were no outlier HCOs in 2016.
5.2 Acute asthma - assessment of severity documented on admission (H) In 2016, there was one record from one HCO. The annual rate was 68.9 per 100 patients. There were no potential gains in 2016. There were no outlier HCOs in 2016.
5.3 Acute asthma - appropriate discharge plan documented (H) In 2016, there was one record from one HCO. The annual rate was 68.9 per 100 patients. There were no potential gains in 2016. There were no outlier HCOs in 2016.
Gastrointestinal disease
6.1 Haematemesis / melaena with blood transfusion - gastroscopy within 24 hours (H) In 2016, there were four records from three HCOs. The annual rate was 65.2 per 100 patients. In 2016, the potential gains totalled 12 more patients who have a gastroscopy within 24 hours of admission. In 2016, there was one outlier record from one HCO whose combined excess was 6 fewer patients who have a gastroscopy within 24 hours of admission. The outlier HCO rate was 7.7 per 100 patients.
6.2 Haematemesis / melaena with blood transfusion & subsequent death (L) In 2016, there were two records from two HCOs. The annual rate was 0 per 100 patients. There were no potential gains in 2016. There were no outlier HCOs in 2016.
Oncology
7.1 Time to administration of antibiotics for patients admitted with febrile neutropenia (H) In 2016, there were three records from three HCOs. The annual rate was 89.5 per 100 patients. There were no potential gains in 2016. There were no outlier HCOs in 2016.