INTERNAL CREDIT RISK RATING MODEL By Badar-e … CREDIT … · INTERNAL CREDIT RISK RATING MODEL By...
53
INTERNAL CREDIT RISK RATING MODEL By Badar-e-Munir A thesis submitted in partial fulfillment of the requirements for the degree of B.S Actuarial Science & Risk Management Karachi University 2007 Approved by Prof Dr Asim Jaml Chairperson of Supervisory Committee Date: 16-2-07
Transcript of INTERNAL CREDIT RISK RATING MODEL By Badar-e … CREDIT … · INTERNAL CREDIT RISK RATING MODEL By...

INTERNAL CREDIT RISK RATING
MODEL
By
Badar-e-Munir
A thesis submitted in partial fulfillment of
the requirements for the degree of
B.S Actuarial Science & Risk
Management
Karachi University
2007
Approved by Prof Dr Asim Jaml Chairperson of Supervisory Committee
Date: 16-2-07

UNIVERSITY OF KARACHI
ABSTRACT
INTERNAL CREDIT RISK RATING SYSTEM
By Badar-e-Munir
Department of Actuarial Science and Risk Management
The Internal Ratings Based (IRB) approach for capital determination is one of
the cornerstones in the proposed revision of the Basel Committee rules for bank
regulation. This paper discusses two of the primary motivating influences on the
recent development of internal credit scoring models for bank, i.e., the important
implications of Basel 2’s proposed capital requirements on credit assets and the
enormous amounts and rates of defaults. The development of internal credit risk
rating system by more prominent credit scoring techniques, Z-Score along with
qualitative technique, are reviewed. Finally, both models are assessed with respect
to default probabilities. Altman Z-Score model for Asian emerging market
obligations is used to contrast estimates across model specifications. Determine
the credit rating for blue chip companies like OGDC, PTCL, PSO and HUBCO
with their sector analysis. Credit risk rating model is designed by qualitative and
quantitative analysis; well same weights are applied for both the analysis in the
model.
TABLE OF CONTENTS
Acknowledgments...............................................................................................................ii Glossary.…………..……………………………….………………………….iii Chapter 1 Introduction……………………………………………………………........01 Introduction to Internal Rating Systems……………………………….........03 Chapter 2 Credit Assesment Models…………………...……………………………...05 Heuristic Models………………………....…………………………….06 Qualitative System………………………...…………………………....06 Hybrid Form…………………………………………………………..07 Chapter 3 Credit Scorings Models…………………………………………………....09 Traditional Ration Analysis…….………………………………………10 Discriminant Analysis .......……………………………………………..11 Variable Selection….…………………………………………………..13 Chapter 4 The Z Score Model….…………………………...………………………...15 A Furture Revision Adapting the Model for Emerging Market… …..….18 Chapter 5 Validation of Internal Risk Rating……………… ...……………………....21 Transition Matrix………………………………...…………… …..…..22 The Credit Portfolio and Other Credit Condition……………… ….….24 Results………………………………………………………….…………......26 Conclution…………………………………………………………...……….27 Appendix………………………………………………………………...…...29 References………………………………………………………………...….45

ii
ACKNOWLEDGMENTS
It is my pleasure to acknowledge the guidance and support of my thesis
supervisors: Mr. Prof. Dr. Asim jamal for her endless patience, encouragement,
insight and guidance and Mr. Prof. Dr. Asim jamal for giving me an opportunity
and inspiring me to succeed.
I would also like to acknowledge to Mr. Prof. Dr. Ghulam Hussain and Mr. Anil
Kanwar.
My deepest gratitude goes to all of my friends and family for their moral support,
understanding and help which allowed me to stay focused and maintains a good
quality of life during this process.

iii
GLOSSARY
Basel II Basel II Capital Accord
IRRS Internal Risk Rating System
CAR Capital Adequacy Ratio
IRB Advanced Internal Ratings Based Approach for
CR Credit risk
OR Obligor Rating
FR Facility Rating
EDP Exposure Default Probability
LGD Loss Given Default
M Maturity
PD Probability of Default
RWA Risk Weighted Assets
RAROC Risk Adjusted Return of Capital
EC Economic Capital
VaR Value at Risk
CVaR Credit Value at Risk

iv
DM Default Mode
UL Unexpected Loss
EL Expected Loss
EAD Exposure at Default
EDF Exposure Default Frequency
RR Risk Rating
UGD Usage Given Default


2
C h a p t e r 1
INTRODUCTION
In this chapter I explore the traditional and prevalent approach to credit risk
assessment the ―internal risk rating‖ system. Most internal risk rating systems are
based on both quantitative and qualitative evaluation. The final decision is based
on many different attributes, but usually it is not based on using a formal model
those knows how to weight all the attributes in some optimal way. In essence, the
internal risk rating systems are based on general considerations and on
experience, and not on mathematical modeling. They cannot, therefore, be
regarded as precise tools. Their usage clearly relies on the judgment of the rating
evaluators.
Internal rating systems are usually applied to non-financial corporations, as
special approaches are employed for banks and other financial institutions.
Companies and instruments are classified into discrete rating categories that
correspond to the expected loss, which represent the combined estimate of the
likelihood of the company failing to pay its obligations and the subsequent loss in
the event of default.
In the first section I show how an internal risk rating systems of a bank can be
organised in order to rate creditors systematically. Ratings generally apply to
obligors and loan for which underwriting and structuring require judgment. They
are produced for business and institutional loans and counterparties on the
derivatives transactions, not for consumer’s loan. Credit decisions for small
lending exposures are primary based on credit scoring techniques while the rating
system we propose in this chapter is based on the extensive experience of the
commercial bank, other bank may have some what different systems, but most
are similar in nature. In the following three sections, the detail of the rating
process and other considerations are described.

3
We suggest adopting a two tier rating system. First, an obligor rating that can be
easily mapped to a default probability bucket, a facility rating that determines the
loss parameters in case of default, such as (i) ―Loss Given Default‖ (LGD), which
depends on the seniority of the facility in the quality of the guarantees and
collateral, and (ii) ―Usage Given Default‖, (UGD) for loan commitments, which
depends on the nature of the commitment and the rating history of the borrower.
The main problem faced by banks is obtaining information about companies that
have not issued traded debt instrument. The data about these companies are of
unproven quality and are therefore less reliable, and it can be a challenge to
extract the minimum required information in order to improve the allocation of
credit.
The credit analyst in a bank or a rating agency must take into consideration many
attributes of a firm: financial as well as managerial, quantitative as well as
qualitative. The analysts must ascertain the financial health of the firm, and
determine if earnings and cash flows are sufficient to cover the debt obligations.
The analysts would also want to analyze the quality of the assets of the firm and
the liquidity position of the firm. The analysts should also be concerned by the
quality of the management and try to discover any unfavorable aspects of the
borrower’s management.
In addition the analysts must take into account the features in the industry to
which the potential client belongs, and the status of the client with in its industry
the effects of macro-economics events on the firm and its industry should also be
considered, as well as the country risk of the borrower. Combined industry and
country factors can be assisted to calculate the correlation between assets for the
purpose of calculating portfolio effects.
The environment of the borrower that the credit analysts must assess in order to
determine the credit worthiness of the borrower and, thus, the interest spread
that the bank should charge. A major consideration in providing the loan is the
existence of the collateral, or otherwise of a loan guarantor, and the quality of the
guarantee. The issue of guarantee is especially important to banks providing loans
to small and medium-sized companies that cannot offer sufficient collateral.

4
When the objective is to allocate economic capital, monitor loans, and establish
loan reserves, the point-in-time approach is more appropriate. The credit horizon
of these decisions is usually one year, and the rating decision is based on the
borrower’s current and most likely future outlook over the credit horizon. Point-
in-time rating is more responsive to change in the status of the obligor, and
therefore more appropriate to monitor a credit. At the same time, point-in-time
ratings are supposed to be updated frequently to stay current. This approach is
also consistent with the use of rating as an input to a credit portfolio model, such
as Credit Metrics based on the credit migration methodology. Credit risk models
required specifying the credit horizon, usually one year; an each rating is mapped
to a default probability bucket.
INTRODUCTION TO INTERNAL RATING SYSTEMS
We begin by looking more closely at an internal risk rating system (IRRS). A
typical IRRS will assign both an obligor rating to each borrower (or group of
borrowers), and a facility rating to each available facility. A risk rating (RR) is
design to depict the risk of loss in a credit facility1. A robust risk rating system
should offer a carefully designed, structured, and documented series of steps for
the assessment of each rating.
The goal is to generate accurate and consistent risk rating, yet also to allow
professional judgment to significantly influence a rating whenever appropriate.
The expected loss (EL) is the product of an exposure (say US$100) multiplied by
the probability of default (PD) (say 2%) of an obligor (or borrower) and loss
given default (LGD) (say 50%), in any specific credit facility in this example, the
EL is US$100*0.02*0.50=US$ 1. A typical risk rating methodology initially
assigns an obligor rating that identifies the expected PD by that borrower (or
group) in repaying its obligations in the normal course of business. Risk ratings
quantify the quality of individual facilities, credits, and portfolios. If RR is

5
accurately and consistently applied, then they provide a common understanding
of risk.
Levels and allow for active portfolio management. An IRRS also provides the
initial basis for capital charges used in the various pricing models. It can also
assist in establishing loan reserves. The IRRS can be used to rate credit risks in
most of the major corporate and commercial sectors, but it is unlikely to cover all
business sectors.2
This paper primarily discusses a model developed by the author over 30 years
ago, the so-called Z-Score model, and its relevance to these recent developments.
In doing so, we will provide some updated material on the Z-Score model’s tests
and applications over time as well as some modifications for greater applicability.
The major theme of this paper is that the assignment of appropriate default
probabilities on corporate credit assets is a three-step process involving from the
development of:
(1) Credit scoring models,
(2) Capital market risk equivalents - - usually bond ratings, and
(3) Assignment of PD3 and possibly LGDs on the credit portfolio.
Our emphasis will be on step 1 and how the Z-Score model, (Altman, 1968), has
become the prototype model for one of the three primary structures for
determining PDs
________________________________
1The risk of loss is a very general notion since it can be described in several distinct dimensions. For example, it in
relation to the expected loss dimension, the unexpected loss (economic capital) dimension. 2A typical IRRS generally excludes banks, agriculture, public finance and other identified groups.
3Some might argue that a statistical methodology can combine steps (1) and (2) where the output from (1)
automatically provides estimates of PD. This is one of the reasons that many “modelers” of late and major consulting
firms prefer the logit-regression approach, rather than the discriminant model that this author prefers.

6
C h a p t e r 2
CREDIT ASSESMENT MODELS
A best-practice approach to segmentation and defined the data requirements for
credit assessment in each segment. Besides the creation of a complete, high-
quality data set, the method selected for processing data and generating credit
assessments has an especially significant effect on the quality of a rating system.
This chapter begins with a presentation of the credit assessment models
commonly used in the market, with attention to the general way in which they
function and to their application in practice. This presentation is not meant to
imply that all of the models presented can be considered best-practice
approaches.
In addition to these ―pure models‖, we frequently encounter combinations of
heuristic methods and the other two model types in practice. The models as well
as the corresponding hybrid forms are described in the sections below. The
models described here are primarily used to rate borrowers. In principle,
however, the architectures described can also be used to generate transaction
ratings.
7
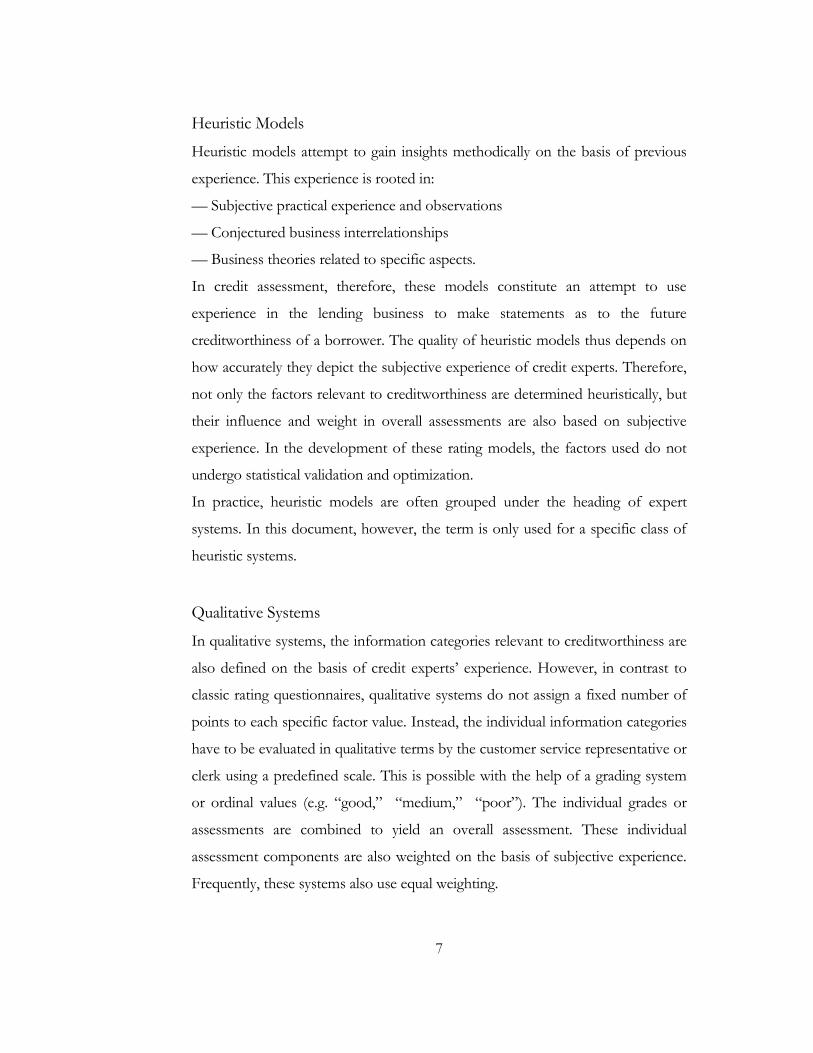
Heuristic Models
Heuristic models attempt to gain insights methodically on the basis of previous
experience. This experience is rooted in:
— Subjective practical experience and observations
— Conjectured business interrelationships
— Business theories related to specific aspects.
In credit assessment, therefore, these models constitute an attempt to use
experience in the lending business to make statements as to the future
creditworthiness of a borrower. The quality of heuristic models thus depends on
how accurately they depict the subjective experience of credit experts. Therefore,
not only the factors relevant to creditworthiness are determined heuristically, but
their influence and weight in overall assessments are also based on subjective
experience. In the development of these rating models, the factors used do not
undergo statistical validation and optimization.
In practice, heuristic models are often grouped under the heading of expert
systems. In this document, however, the term is only used for a specific class of
heuristic systems.
Qualitative Systems
In qualitative systems, the information categories relevant to creditworthiness are
also defined on the basis of credit experts’ experience. However, in contrast to
classic rating questionnaires, qualitative systems do not assign a fixed number of
points to each specific factor value. Instead, the individual information categories
have to be evaluated in qualitative terms by the customer service representative or
clerk using a predefined scale. This is possible with the help of a grading system
or ordinal values (e.g. ―good,‖ ―medium,‖ ―poor‖). The individual grades or
assessments are combined to yield an overall assessment. These individual
assessment components are also weighted on the basis of subjective experience.
Frequently, these systems also use equal weighting.

8
In order to ensure that all of the users have the same understanding of
assessments in individual areas, a qualitative system must be accompanied by a
user’s manual. Such manuals contain verbal descriptions for each information
category relevant to creditworthiness and for each category in the rating scale in
order to explain the requirements a borrower has to fulfill in order to receive a
certain rating.
In practice, credit institutions have used these procedures frequently, especially in
the corporate customer segment.
Hybrid Forms
In practice, the models described in the previous sections are only rarely used in
their pure forms. Rather, heuristic models are generally combined with one of the
two other model types (statistical models or causal models). This approach can

9
generally be seen as favorable, as the various approaches complement each other
well. For example, the advantages of statistical and causal models lie in their
objectivity and generally higher classification performance in comparison to
heuristic models. However, statistical and causal models can only process a
limited number of creditworthiness factors. Without the inclusion of credit
experts knowledge in the form of heuristic modules, important information on
the borrower’s creditworthiness would be lost in individual cases. In addition, not
all statistical models are capable of processing qualitative information directly (as
is the case with discriminant analysis, for example), or they require a large amount
of data in order to function properly (e.g. logistic regression); these data are
frequently unavailable in banks. In order to obtain a complete picture of the
borrower’s creditworthiness in such cases, it thus makes sense to assess
qualitative data using a supplementary heuristic model.
This heuristic component also involves credit experts more heavily in the rating
process than in the case of automated credit assessment using a statistical or
causal model, meaning that combining models will also serve to increase user
acceptance.
In the sections below, three different architectures for the combination of these
model types are presented.

10
C h a p t e r 3
CREDIT SCORING MODELS
Almost all of the statistical credit scoring models that are in use today are
variations on a similar theme. They involve the combination of a set of
quantifiable financial indicators of firm performance with, perhaps, a small
number of additional variables that attempt to capture some qualitative elements
of the credit process. While this paper will concentrate on the quantitative
measures, mainly financial ratios and capital market values, one should not
underestimate the importance of qualitative measures in the process.4 Starting in
the 1980’s, some sophisticated practitioners, and certainly many academicians,
had been moving toward the possible elimination of ratio analysis as an analytical
technique in assessing firm performance. Theorists have downgraded arbitrary
rules of thumb (such as company ratio comparisons) widely used by practitioners.
Since attacks on the relevance on ratio analysis emanate from many esteemed
members of the scholarly world, does this mean that ratio analysis is limited to
the world of ―nuts and bolts?‖ Or, has the significance of such an approach been
unattractively garbed and therefore unfairly handicapped? Can we bridge the gap,
rather than sever the link, between traditional ratio analysis and the more rigorous
statistical techniques that have become popular among academicians? Along with
our primary interest, credit risk assessment and financial distress prediction, we
are also concerned with an assessment of ratio analysis as an analytical technique.
________________________________
4Practitioners have reported that these so-called qualitative elements, that involve judgment on the part of the risk
officer, can provide as much as 30-50% of the explanatory power of the scoring model.

11
Traditional Ratio Analysis
The detection of company operating and financial difficulties is a subject which
has been particularly amenable to analysis with financial ratios. Prior to the
development of quantitative measures of company performance, agencies had
been established to supply a qualitative type of information assessing the credit-
worthiness of particular merchants. Formal aggregate studies concerned with
portents of business failure were evident in the 1930’s, (see Altman [1968] for
several references). Classic works in the area of ratio analysis and bankruptcy
classification were performed by Beaver [1967, 1968]. His univariate analysis of a
number of bankruptcy predictors set the stage for the multivariate attempts, by
this author and others, which followed. Beaver found that a number of indicators
could discriminate between matched samples of failed and non failed firms for as
long as five years prior to failure. However, he questioned the use of multivariate
analysis, although a discussant recommended attempting this procedure. The Z-
Score model, developed by this author at the same time (1966) that Beaver was
working on his own thesis, did just that. A subsequent study by Deakin [1972]
utilized the same 14 variables that Beaver analyzed, but he applied them within a
series of multivariate discriminant models.
The aforementioned studies imply a definite potential of ratios as predictors of
bankruptcy. In general, ratios measuring profitability, liquidity, and solvency
seemed to prevail as the most significant indicators. The order of their
importance is not clear since almost every study cited a different ratio as being the
most effective indication of impending problems. Although these works
established certain important generalizations regarding the performance and
trends of particular measurements, the adaptation of the results for assessing
bankruptcy potential of firms, both theoretically and practically, is questionable.
In almost every case, the methodology was essentially univariate in nature and
emphasis was placed on individual signals of impending problems. Ratio analysis
presented in this fashion is susceptible to faulty interpretation and is potentially
confusing. For instance, a firm with a poor profitability and/or solvency record

12
may be regarded as a potential bankrupt. However, because of its above average
liquidity, the situation may not be considered serious. The potential ambiguity as
to the relative performance of several firms is clearly evident. The crux of the
shortcomings inherent in any univariate analysis lies therein. An appropriate
extension of the previously cited studies, therefore, is to build upon their findings
and to combine several measures into a meaningful predictive model. In so doing,
the highlights of ratio analysis as an analytical technique will be emphasized rather
than minimized. The questions are:
(1) Which ratios are most important in detecting credit risk problems?
(2) What weights should be attached to those selected ratios, and
(3) How should the weights is objectively established.
Discriminant Analysis
After careful consideration of the nature of the problem and of the purpose of
this analysis, we chose multiple discriminant analysis (MDA) as the appropriate
statistical technique. Although not as popular as regression analysis, MDA had
been utilized in a variety of disciplines since its first application in 1930’s. During
those earlier years, MDA was used mainly in the biological and behavioral
sciences. After the late 1960’s, this technique became increasingly popular in the
practical business world as well as in academia (see Altman, Avery, Eisenbeis and
Sinkey, [1981]). MDA is a statistical technique used to classify an observation into
one of several a priori groupings dependent upon the observation’s individual
characteristics. It is used primarily to classify/or make predictions in problems
where the dependent variable appears in qualitative from, for example, male or
female, bankrupt or non bankrupt therefore, the first step is to establish explicit
group classifications. The number of original groups can be two or more. Some
analysts refer to discriminant analysis as ―multiple‖ only when the number of
groups exceeds two. After the groups are established, data are collected for the
objects in the groups; MDA in its most simple form attempt to derive a linear

13
combination of these characteristics that ―best‖ discriminates between the
groups. If a particular object, for instance, a corporation, has characteristics
(financial ratios) that can be quantified for all of the companies in the analysis, the
MDA determines a set of discriminant coefficients.
When these coefficients are applied to the actual ratios, a basis for classification
into one of the mutually exclusive groupings exists. The MDA technique has the
advantage of considering an entire profile of characteristics common to the
relevant firms, as well as the interaction of these properties. A univariate study, on
the other hand, can only consider the measurements used for group assignments
one at a time. Another advantage of MDA is the reduction of the analyst’s space
dimensionally, that is, from the number of different independent variables to G-1
dimension(s), where G equals the number of original a priori groups. The
distressed classification and prediction analysis is concerned with two groups,
consisting of bankrupt and non bankrupt firms. Therefore, the analysis is
transformed into its simplest form: one dimension. The discriminant function, of
the form Z = V1X1 + V2X2 + VnXn transforms the individual variable values
to a single discriminant score, or Z value, which is then used to classify the object
where:
V1, V2, . . . . Vn = discriminant coefficients, and
X1, X2, . . . . Xn = independent variables
When utilizing a comprehensive list of financial ratios in assessing a firm’s
bankruptcy potential, there is reason to believe that some of the measurements
will have a high degree of correlation or collinearity with each other. In my
opinion, this aspect is not necessarily serious in discriminant analysis and it
usually motivates careful selection of the predictive variables (ratios). It also has
the advantage of potentially yielding a model with a relatively small number of
selected measurements that convey a great deal of information. This information
might very well indicate differences among groups, but whether or not these

14
differences are significant and meaningful is a more important aspect of the
analysis.
Perhaps the primary advantage of MDA in dealing with classification problems is
the potential of analyzing the entire variable profile of the object simultaneously
rather than sequentially examining its individual characteristics. Just as linear and
integer programming have improved upon traditional techniques in capital
budgeting, the MDA approach to traditional ratio analysis has the potential to
reformulate the problem correctly. Specifically, combinations of ratios can be
analyzed together in order to remove possible ambiguities and misclassifications
observed in earlier traditional ratio studies. Critics of discriminant analysis point
out that most, if not all, financial models using this technique violates several
statistical requirements including multivariate normality and independence of the
explanatory variables. While valid concerns, my experience has shown that careful
bounding of certain extreme value ratios will usually mitigate the normality
problem and tests for the models’ robustness over time will determine if the
independence violation is serious or not.
Variable Selection
After the initial groups were defined and firms selected, balance sheet and income
statement data were collected. Because of the large number of variables that are
potentially significant indicators of corporate problems, a list of 22 potentially
helpful variables (ratios) were compiled for evaluation. The variables are classified
into five standard ratio categories, including liquidity, profitability, leverage,
solvency, and activity. The ratios were chosen on the basis of their popularity in
the literature and their potential relevancy to the study, and there were a few
―new‖ ratios in this analysis. From the original list of 22 variables, five were
selected as doing the best overall job together in the prediction of corporate
bankruptcy. The contribution of the entire profile is evaluated and, since this

15
process is essentially iterative, there is no claim regarding the optimality of the
resulting discriminant function.
In order to arrive at a final profile of variables, the following procedures were
utilized: 5
(1) Observation of the statistical significance of various alternative functions,
including determination of the relative contributions of each independent
variable;
(2) Evaluation of intercorrelations among the relevant variables;
(3) Observation of the predictive accuracy of the various profiles; and
(4) Judgment of the analyst.
________________________________
5 Subsequent versions of discriminant model software include step-wise methods which self-select the variables that
either enter (forward stepwise) or are excluded (backward) from the final variable profile. Our experience with these
techniques is, while helpful, do not always result in superior classification and prediction results.

16
C h a p t e r 4
THE Z SCORE MODEL
Note that the model does not contain a constant (Y-intercept) term. This is due
to the particular software utilized and, as a result, the relevant cutoff score
between the two groups is not zero. Many statistical software programs have a
constant term which standardizes the cutoff score at zero if the sample sizes of
the two groups are equal.
X1, Working Capital/Total Asset (WC/TA)
The working capital/total assets ratio, frequently found in studies of corporate
problems, is a measure of the net liquid assets of the firm relative to the total
capitalization. Working capital is defined as the difference between current assets
and current liabilities. Liquidity and size characteristics are explicitly considered.
Ordinarily, a firm experiencing consistent operating losses will have shrinking
current assets in relation to total assets.6 Two other liquidity ratios tested were the
current ratio and the quick ratio. These were found to be less helpful and subject
to perverse trends for some failing firms. In all cases, tangible assets, not
including intangibles, are used.

17
X2, Retained Earnings/Total Assets (RE/TA)
Retained earning (RE) is the term used to describe the account that reports the
total amount of reinvested earnings and/or losses of a firm over its entire life.
The account is also referred to as earned surplus. It is conceivable that a bias
would be created by a substantial reorganization or stock dividend and
appropriate readjustments should, in the event of this happening, be made to the
accounts. This measure of cumulative profitability over time is what we referred
to earlier as a ―new‖ ratio. The age of a firm and its use of leverage are implicitly
considered in this ratio. For example, a relatively young firm will probably show a
low retained earnings/total assets (RE/TA) ratio because it has not had time to
build up its cumulative profits. Therefore, it may be argued that the young firm is
somewhat discriminated against in this analysis, and its chance of being classified
as bankrupt is relatively higher than that of another older firm, ceteris paribus. But,
this is precisely the situation in the real world. The incidence of failure is much
higher in a firm’s earlier years [40–50% of all firms that fail do so in the first five
years of their existence (Dun & Bradstreet, annual statistics)].
In addition, the RE/TA ratio measures the leverage of a firm. Those firms with
high RE, relative to TA, have financed their assets through retention of profits
and have not utilized as much debt. This ratio highlights either the use of
internally generated funds for growth (low risk capital) or OPM (other people’s
money) - higher risk capital.
________________________________
6 It is true, however, that this ratio, indeed all liquidity measures using short term assets, can be misleading in that
the ratio can be growing just when a firm is about to fail. This fact highlights the problems of univariate measures of
performance.

18
X3, Earnings before Interest and Taxes/Total Assets (EBIT/TA)
This ratio is a measure of the true productivity of the firm’s assets, independent
of any tax or leverage factors. Since a firm’s ultimate existence is based on the
earning power of its assets, this ratio appears to be particularly appropriate for
studies dealing with credit risk. Furthermore, insolvency in a bankrupt sense
occurs when the total liabilities exceed a fair valuation of the firm’s assets with
value determined by the earning power of the assets.
X4, Market Value of Equity/Book Value of Total Liabilities (MVE/TL)
Equity is measured by the combined market value of all shares of stock, preferred
and common, while liabilities include both current and long term. The measure
shows how much the firm’s assets can decline in value (measured by market value
of equity plus debt) before the liabilities exceed the assets and the firm becomes
insolvent. We discussed this ―comparison‖ long before the advent of the KMV
approach (discussed below) and before Merton [1974] put these relationships into
an option-theoretic approach to value corporate risky debt. KMV used Merton’s
work to springboard into their now commonly used credit risk measure - the
Expected Default Frequency (EDF). This ratio adds a market value dimension
that most other failure studies did not consider. At a later point, we will substitute
the book value of net worth for the market value in order to derive a discriminant
function for privately held firms (Z’) and for non manufacturers (Z‖).
X5, Sales/Total Assets (S/TA)
The capital-turnover ratio is a standard financial ratio illustrating the sales
generating ability of the firm’s assets. It is one measure of management’s capacity
in dealing with competitive conditions. This final ratio is unique because it is the
least significant ratio on an individual basis and on a univariate statistical
19
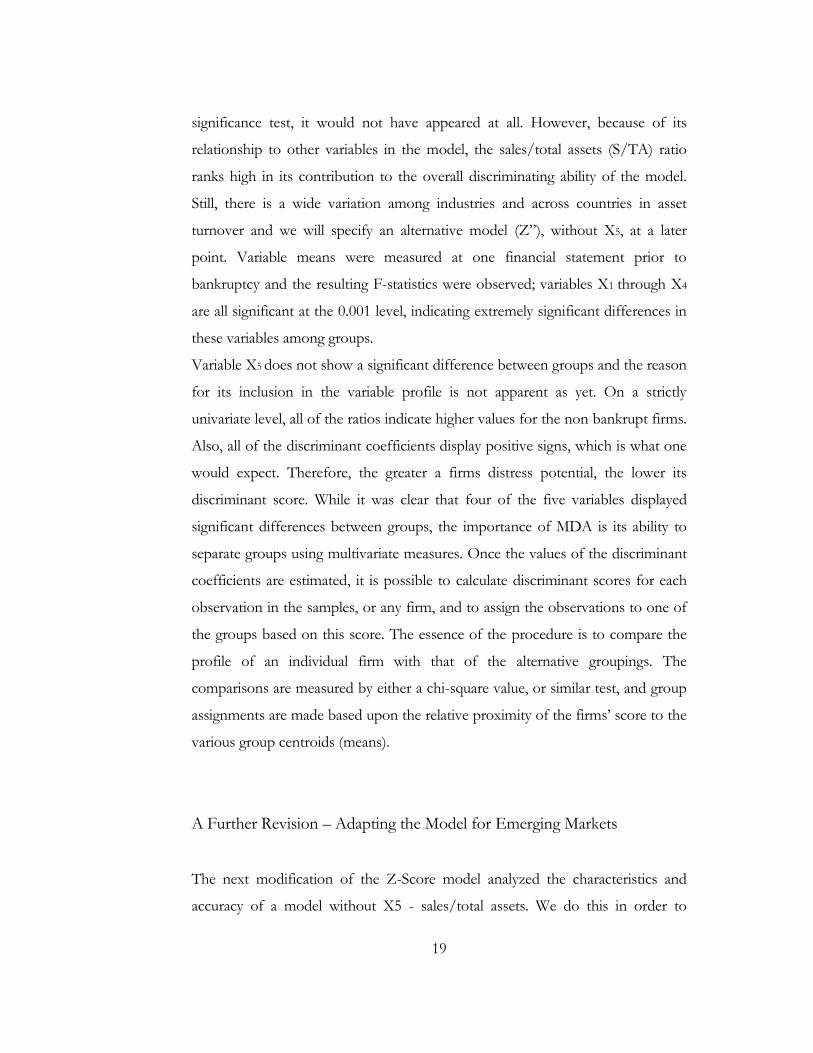
significance test, it would not have appeared at all. However, because of its
relationship to other variables in the model, the sales/total assets (S/TA) ratio
ranks high in its contribution to the overall discriminating ability of the model.
Still, there is a wide variation among industries and across countries in asset
turnover and we will specify an alternative model (Z‖), without X5, at a later
point. Variable means were measured at one financial statement prior to
bankruptcy and the resulting F-statistics were observed; variables X1 through X4
are all significant at the 0.001 level, indicating extremely significant differences in
these variables among groups.
Variable X5 does not show a significant difference between groups and the reason
for its inclusion in the variable profile is not apparent as yet. On a strictly
univariate level, all of the ratios indicate higher values for the non bankrupt firms.
Also, all of the discriminant coefficients display positive signs, which is what one
would expect. Therefore, the greater a firms distress potential, the lower its
discriminant score. While it was clear that four of the five variables displayed
significant differences between groups, the importance of MDA is its ability to
separate groups using multivariate measures. Once the values of the discriminant
coefficients are estimated, it is possible to calculate discriminant scores for each
observation in the samples, or any firm, and to assign the observations to one of
the groups based on this score. The essence of the procedure is to compare the
profile of an individual firm with that of the alternative groupings. The
comparisons are measured by either a chi-square value, or similar test, and group
assignments are made based upon the relative proximity of the firms’ score to the
various group centroids (means).
A Further Revision – Adapting the Model for Emerging Markets
The next modification of the Z-Score model analyzed the characteristics and
accuracy of a model without X5 - sales/total assets. We do this in order to

20
minimize the potential industry effect that is more likely to take place when such
an industry-sensitive variable as asset turnover is included. In addition, we have
used this model to assess the financial health have applied this enhanced Z" Score
model to emerging markets corporate, specifically Asian firms. The book value of
equity was used for X4 in this case. The classification results are identical to the
revised five-variable model (Z’Score). The new Z‖ Score model is:
Z” = 6.56 (X1) + 3.26 (X2) + 6.72 (X3) + 1.05 (X4)
Where Z‖-Scores below 1.10 indicate a distressed condition. All of the
coefficients for variables X1 to X4 are changed as are the group means and cutoff
scores. This particular model is also useful within an industry where the type of
financing of assets differs greatly among firms and important adjustments, like
lease capitalization, are not made. In the emerging market (EM) model, we added
a constant term of +3.25 so as to standardize the scores with a score of zero (0)
equated to a D (default) rated bond. See Panel E for the average of emerging
market rating equivalents of this newer, emerging Market (EM)-Score model.

21
Emerging Market Score
Emerging Market Rating Average EM Score
AAA
AA
A
BBB
BB
B
CCC
D
6.40
5.65
4.95
4.75
4.50
2.95
1.75
0

22
C h a p t e r 5
VALIDATION OF INTERNAL RISK RATING
The rating result generated for a specific customer can change over time. This is
due to the fact that a customer has to be re-rated regularly both before and after
the conclusion of a credit agreement due to regulatory requirements and the need
to ensure the regular and current monitoring of credit risk from a business
perspective. In line with best business practices, the requirements arising from
Basel II call for ratings to be renewed regularly (at least on an annual basis); this is
to be carried at even shorter intervals in the case of noticeably higher risk. This
information can be used to improve risk classification and to validate rating
models.
In addition to the exact assignment of default probabilities to the individual rating
classes (a process which is first performed only for a defined time horizon of 12
months), it is also possible to determine how the rating will change in the future
for longer-term credit facilities. The transition matrices specific to each rating
model indicate the probability of transition for current ratings (listed in columns)
to the various rating classes (listed in rows) during a specified time period. In
practice, time periods of one or more years are generally used for this purpose.
This section only presents the methodical fundamentals involved in determining
transition matrices. Their application, for example in risk-based pricing, is not
covered in this document.

23
The One-Year Transition Matrix
In order to calculate the transition matrix for a time horizon of one year, it is
necessary to identify the rating results for all customers rated in the existing data
set and to list these results over a 12-month period. Using this data, all observed
changes between rating classes are counted and compiled in a table. Gives an
example of such a matrix
AAA AA A BBB BB B CCC
AAA 90.81% 0.70% 0.09% 0.02% 0.03% 0.01% 0.21%
AA 8.15% 90.64% 2.27% 0.33% 0.14% 0.11% 0.23%
A 0.68% 7.79% 91.05% 5.95% 0.67% 0.24% 0.35%
BBB 0.12% 0.64% 5.52% 86.93% 7.73% 0.43% 1.30%
BB 0.09% 0.06% 0.74% 5.30% 80.53% 6.48% 2.38%
B 0.08% 0.14% 0.26% 1.17% 8.84% 83.46% 11.24%
CCC 0.04% 0.02% 0.01% 0.12% 1.00% 4.07% 64.50%
Default 0.03% 0.01% 0.06% 0.18% 1.06% 5.20% 19.79%
With regard to the time interval between consecutive customer ratings, it is
necessary define a margin of tolerance for the actual time interval between rating
results for, as the actual intervals will only rarely be exactly one year. In this
context, it is necessary to ensure that the average time interval for the rating pairs
determined matches the time horizon for which the transition matrix is defined.
At the same time, the range of time intervals around this average should not be so
large that a valid transition matrix cannot be calculated. The range of time
intervals considered valid for calculating a transition matrix should also be
consistent with the bank’s in-house guidelines for assessing whether customer re-
ratings are up to date and performed regularly.
Actual credit defaults are frequently listed as a separate class (i.e. in their own
column). This makes sense insofar as a default describes the transition of a rated
borrower to the ―defaulted loans‖ class.

24
Frequently cases will accumulate along the main diagonal of the matrix. These
cases represent borrowers which did not migrate from their original rating class
over the time horizon observed. The other borrowers form a band around the
main diagonal, which becomes less dense with increasing distance from the
diagonal. This concentration around the main diagonal correlates with the
number of existing rating classes as well as the stability of the rating procedure.
The more rating classes a model uses, the more frequently rating classes will
change and the lower the concentration along the main diagonal will be. The
same applies in the case of decreasing stability in the rating procedure. In order to
calculate transition probabilities, it is necessary to convert the absolute numbers
into percentages (row probabilities). The resulting probabilities indicate the
fraction of cases in a given class which actually remained in their original class.
The transition probabilities of each row including the default probability of each
class in the last column should add up to 100%.
Especially with a small number of observations per matrix field, the empirical
transition matrix derived in this manner will show inconsistencies. Inconsistencies
refer to situations where large steps in ratings are more probable than smaller
steps in the same direction for a given rating class, or where the probability of
ending up in a certain rating class is more probable for more remote rating classes
than for adjacent classes. In the transition matrix, inconsistencies manifest
themselves as probabilities which do not decrease monotonically as they move
away from the main diagonal of the matrix. Under the assumption that a valid
rating model is used, this is not plausible. Inconsistencies can be removed by
smoothing the transition matrix. Smoothing refers to optimizing the probabilities
of individual cells without violating the constraint that the probabilities in a row
must add up to 100%. As a rule, smoothing should only affect cell values at the
edges of the transition matrix, which are not statistically significant due to their
low absolute transition frequencies. In the process of smoothing the matrix, it is
necessary to ensure that the resulting default probabilities in the individual classes
match the default probabilities from the calibration.

25
The Credit Portfolio and Other General Condition
Counterparty-based and credit facility-based risk factors: These scenarios can be
realized with relative ease by estimating credit losses after modeling a change in
PD and/or LGD/EAD. The methods of modeling stress tests include the
following
Examples:
— Downgrading all borrowers by one rating class
— Increasing default probabilities by a certain percentage
— Increasing LGD by a certain percentage
— Increasing EAD by a certain percentage for variable credit products
(justification: customers are likely to utilize credit lines more heavily in crisis
situations, for example)
— Assumption of negative credit spread developments (e.g. parallel shifts in term
structures of interest rates) for bonds
— Modeling of input factors (e.g. balance sheet indicators)

26
The approaches listed above can also be combined with one another as desired in
order to generate stress tests of varying severity. With regard to general
conditions, examples might include stress tests for specific industries or regions.
Such tests might involve the following:
— Downgrading all borrowers in one or more crisis-affected industries
— Downgrading all borrowers in one or more crisis-affected regions
Macroeconomic risk factors include interest rates, exchange rates, etc. These
factors should undergo stress-testing especially when the bank uses them as the
basis for credit risk models which estimate PD or credit losses. If the bank uses
models, these stress tests are to be performed by adjusting the parameters and
then recalculating credit losses.
Examples include:
— Unfavorable changes (increases/decreases, depending on portfolio
composition) in the underlying interest rate by a certain number of basis
points
— Unfavorable changes (increases/decreases, depending on portfolio
composition) in crucial exchange rates by a certain percentage
If the bank uses risk models (such as credit portfolio models or credit pricing
models), it is necessary to perform stress tests which show whether the
assumptions underlying the risk models will also be fulfilled in crisis situations.
Only then will the models be able to provide the appropriate guidance in crisis
situations as well.

27
RESULTS
Internal credit risk ratings are utilised by many sophisticated banks to summarise
the risk of individual credit exposures, and are increasingly incorporated into
various banking functions, including operational applications (such as
determining loan approval requirements) and risk management and analysis
(including analysis of pricing and profitability as well as internal capital allocation).
Internal ratings may also cover a much broader range of borrowers, providing
assessments of the credit quality of individuals and small-to-medium sized
companies through credit scoring, and assessment of larger non-rated borrowers
through detailed analysis. internal ratings-based approach also shares certain
similarities with credit risk models in terms of its reliance on banks’ internal credit
assessments, and in its conceptual measures of risk; as such, it could also provide
incentives for banks to further refine credit risk management techniques, paving
the way for a transition towards full credit risk models in the future.
In this thesis the credit risk rating of different companies and the assigning a risk
grade for the purpose is to check the stability, solvency and to identify the overall
level of risk associated with the capital structure, so long as the risk rating
structure and assignment procedure provide a meaningful and consistent
identification of the risk. These rating can also provide a valuable reference point
for assessing degree of the trade-off among various loan terms and characteristics
and, in particular, in determining appropriate loan pricing.

28
CONCLUSION
The internal risk rating system methodology presented in this thesis provides a
disciplined framework to be followed with appropriate guidelines. The
framework includes consideration of all the relevant risk factors in assessing the
credit quality of an obligor and the loss in the event of default for a facility. The
assessment of the PD and LGD is the critical element in the loan adjustication
process. As the economic environment changes and the fortune of the obligor
evolve, this assessment needs to be reviewed and updated in order to keep these
rating current. The rule is to be updating these ratings whenever a credit event
occurs, or a change in the risk of the obligor is perceived. In any event, at a
minimum the risk rating should be reviewed at least once a year in conjunction
with the annual review of each loan.
The new Basel Capital Accord (Basel Committee on Banking Supervision, 1999),
also referred to as Basel II, has explicitly recognised that, in the future, an internal
risk rating-based system could prove useful to banks in their calculation of the
minimum required regulatory capital. Basel II offers a menu of approaches to
measure credit risk: the standardized approach, which is an improved version of
the current 1988 Accord, and the internal rating-based (IRB) approach with two
variants, the foundation and the advanced approaches, the later applying to the
most sophisticated banks. Under the IRB approach, banks will be allowed to use
their own regulators of the bank’s internal risk rating system, and the validation of
the key risk parameters such as the PD for each rating category, the LGD and
EAD for loan commitments.
The is no single definition of what constitutes a good IRRS, Basel II has not yet
given any clear guideline on the characteristics of an IRRS eligible to the IRB
approach. But there are some common features to advanced IRRS:

29
An IRRS must have the appropriate level of granularity. The number of
grades should be such that there is not too much concentration of obligors in
one category. While more than fewer granularities are recommended, the
bank should develop a calibration methodology that allows the differentiation
in a meaningful way between the credit qualities of two consecutive grades.
An IRRS should be a two-tier rating system with an OR that estimates the
EDP and FR that represent the LGD.
An IRRS should be part of a robust information system, which tracks
historical default and loss experience. This information should be used for
periodic recalibration and back-testing of the IRRS.
An IRRS must be applied consistently throughout the bank. The requires a
well documented process as well as systematic training of the raters to avoid
inconsistencies.

30
APPENDIX
Rating Definition
A best rating is an independent option, based on a comprehensive quantitative
and qualitative evaluation, of a company’s balance sheet strength, operating
performance and business profile. Ratings are not a warranty of a company’s
ability to meet its ongoing financial obligations.
Rating Descriptor Definition
Inves
tmen
t G
rade
AAA Exceptional
Assigned to issues, where the issuer has, in our opinion, an exceptional ability to meet the term of the obligation.
AA Very Strong Assigned to issues, where the issuer has, in our opinion, a very strong ability to meet the term of the obligation.
A Strong Assigned to issues, where the issuer has, in our opinion, a strong ability to meet the term of the obligation.
BBB Adequate Assigned to issues, where the issuer has, in our opinion, an adequate ability to meet the term of the obligation; however, is more susceptible to change in economic or other conditions.
Non
-Inves
tmen
t G
rade
BB Speculative Assigned to issues, where the issuer has, in our opinion, speculative credit characteristics, generally due to moderate margin of principle and interest payment protection and vulnerability to economic changes.
B Very speculative
Assigned to issues, where the issuer has, in our opinion, very speculative credit characteristics, generally due to modest margin of principle and interest payment protection and vulnerability to economic changes.
CCC Extremely speculative
Assigned to issues, where the issuer has, in our opinion, extremely speculative credit characteristics, generally due to minimal margin of principle and interest payment protection and vulnerability to economic changes.
D In Default In default on payment of principle, interest or other terms and conditions. The rating also is utilized when bankruptcy petition, or similar action, has been filled

31
Qualitative analysis
Management Review
Management Record
Management qualification
Policies and procedure
Future Planning
Industry Comparison
Industry Behavior
Compliance
Perfect Competition
Sales Growth
Assumption
Altman emerging market Z-Score model are used to determine the credit
risk rating.
The qualitative analysis is judged on the basis of sector facts and information.
Credit rating model is assessed by qualitative and quantitative analysis. 50% weights are assigned by qualitative and 50% are assigned by quantitative analysis.

32
Data
The data have been taken from financial statement of OGDC, PSO, PTCL and
HUBCO and sector information is also taken from State Bank of Pakistan.
Financial Highlight of OGDC
Analysis of financial ratios
Leverage ratio 31.19
Debt equity ratio 31.19
Total assets/Total liabilities 420.59
Gearing ratio 0.00
Retained earnings/Total assets 0.31
Current ratio 246.45
ROE 41.73
ROS 59.45
Sales as a % of total assets 53.51
Working capital / total assets 0.35
EBIT/total assets 0.37
Market value of equity / total liabilities 3.21
Sales / total assets 0.54
Value of Z-Score (OGDC) 9.13
33
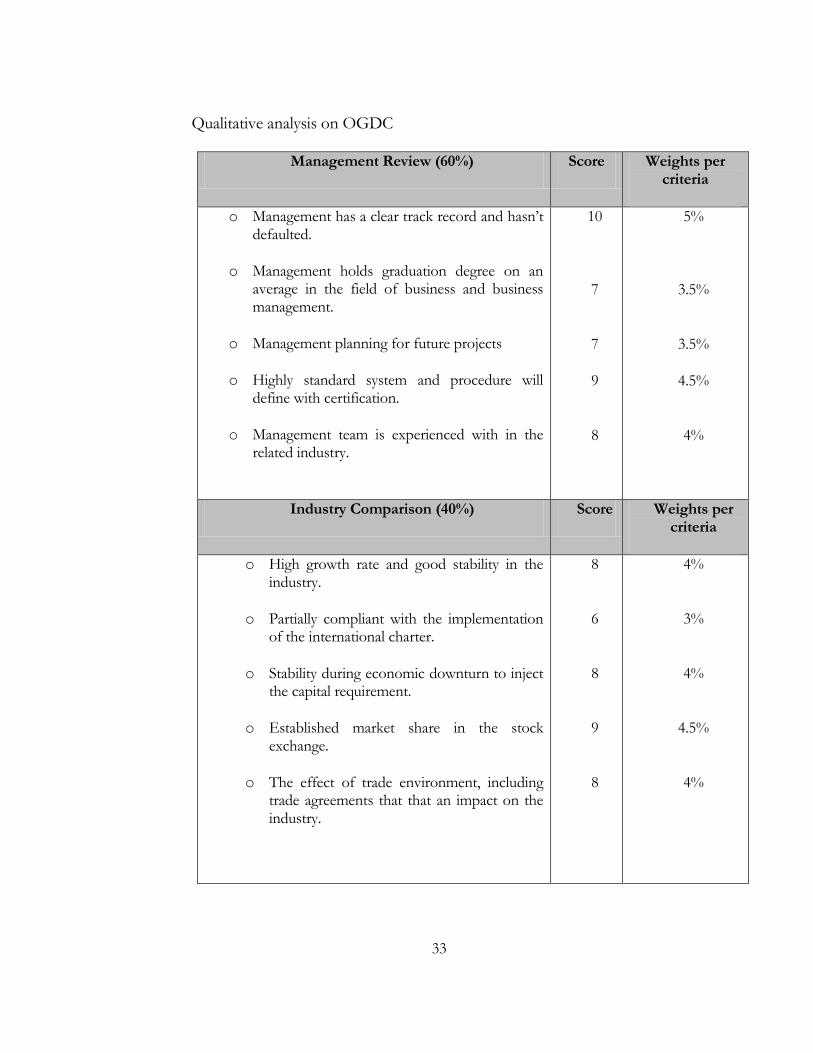
Qualitative analysis on OGDC
Management Review (60%) Score Weights per criteria
o Management has a clear track record and hasn’t defaulted.
o Management holds graduation degree on an average in the field of business and business management.
o Management planning for future projects
o Highly standard system and procedure will define with certification.
o Management team is experienced with in the related industry.
10
7
7
9
8
5%
3.5%
3.5%
4.5%
4%
Industry Comparison (40%) Score Weights per criteria
o High growth rate and good stability in the industry.
o Partially compliant with the implementation of the international charter.
o Stability during economic downturn to inject the capital requirement.
o Established market share in the stock exchange.
o The effect of trade environment, including trade agreements that that an impact on the industry.
8
6
8
9
8
4%
3%
4%
4.5%
4%
34
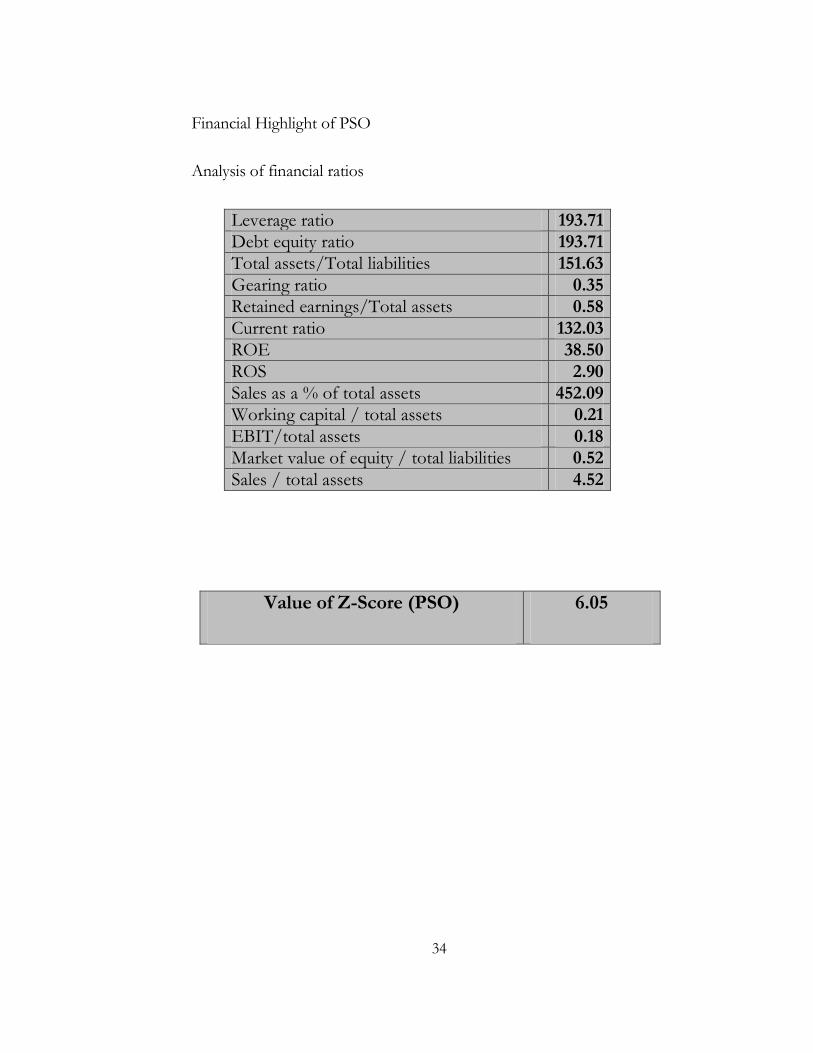
Financial Highlight of PSO
Analysis of financial ratios
Leverage ratio 193.71
Debt equity ratio 193.71
Total assets/Total liabilities 151.63
Gearing ratio 0.35
Retained earnings/Total assets 0.58
Current ratio 132.03
ROE 38.50
ROS 2.90
Sales as a % of total assets 452.09
Working capital / total assets 0.21
EBIT/total assets 0.18
Market value of equity / total liabilities 0.52
Sales / total assets 4.52
Value of Z-Score (PSO) 6.05

35
Qualitative analysis on PSO
Management Review (60%) Score Weights
o Management has a clear track record and hasn’t defaulted.
o Management holds graduation degree on an average in the field of business and business management.
o Management planning for future projects
o Highly standard system and procedure will define with certification.
o Management team is experienced with in the related industry.
9
7
8
8
7
4%
3.5%
4%
4%
3.5%
Industry Comparison (40%) Score Weights
o High growth rate and good stability in the industry.
o Partially compliant with the implementation of the international charter.
o Stability during economic downturn to inject the capital requirement.
o Established market share in the stock exchange.
o The effect of trade environment, including trade agreements that that an impact on the industry.
8
6
8
9
8
4%
3%
4%
4.5%
4%

36
Financial Highlight of HUBCO
Analysis of financial ratios
Leverage ratio 126.81
Debt equity ratio 126.81
Total assets/Total liabilities 178.86
Gearing ratio 51.38
Retained earnings/Total assets 0.54
Current ratio 367.37
ROE 22.81
ROS 32.44
Sales as a % of total assets 31.00
Working capital / total assets 0.25
EBIT/total assets 0.16
Market value of equity / total liabilities 0.79
Sales / total assets 0.31
Value of Z-Score (HUBCO) 5.26

37
Qualitative analysis on HUBCO
Management Review (60%) Score Weights
o Management has a clear track record and hasn’t defaulted.
o Management holds graduation degree on an average in the field of business and business management.
o Management planning for future projects
o Highly standard system and procedure will define with certification.
o Management team is experienced with in the related industry.
8
7
8
8
7
4%
3.5%
4%
4%
3.5%
Industry Comparison (40%) Score Weights
o High growth rate and good stability in the industry.
o Partially compliant with the implementation of the international charter.
o Stability during economic downturn to inject the capital requirement.
o Established market share in the stock exchange.
o The effect of trade environment, including trade agreements that that an impact on the industry.
8
6
8
9
8
4%
3%
4%
4.5%
4%

38
Financial Highlight of PTCL
Analysis of financial ratios
Leverage ratio 88.31
Debt equity ratio 88.31
Total assets/Total liabilities 213.24
Gearing ratio 24.97
Retained earnings/Total assets 0.36
Current ratio 342.21
ROE 24.94
ROS 30.11
Sales as a % of total assets 0.02
Working capital / total assets 0.23
EBIT/total assets 1.13
Market value of equity / total liabilities 0.44
Sales / total assets 0.02
Value of Z-Score (PTCL) 4.97

39
Qualitative analysis on PTCL
Management Review (60%) Score Weights
o Management has a clear track record and hasn’t defaulted.
o Management holds graduation degree on an average in the field of business and business management.
o Management planning for future projects
o Highly standard system and procedure will define with certification.
o Management team is experienced with in the related industry.
8
6
6
6
7
4%
3%
3%
3%
3.5%
Industry Comparison (40%) Score Weights
o High growth rate and good stability in the industry.
o Partially compliant with the implementation of the international charter.
o Stability during economic downturn to inject the capital requirement.
o Established market share in the stock exchange.
o The effect of trade environment, including trade agreements that that an impact on the industry.
7
6
7
8
7
3.5%
3%
3.5%
4%
3.5%

40
Emerging Market Score
Emerging Market Rating Average EM Score
AAA
AA
A
BBB
BB
B
CCC
D
6.40
5.65
4.95
4.75
4.50
2.95
1.75
0

41
FINAL GRADING BENCHMARCKS
QUANTITATIVE RATING RISK RATING RANGE
6.40 = 47% AAA 85-----------100
5.65 = 43% AA 75-----------84
4.95 = 38% A 65-----------74
4.75 = 33% BBB 55-----------64
4.50 = 27% BB 51-----------54
2.95 = 23% B 45-----------50
1.75 = 20% CCC 41-----------44
0 = 0%
D UPTO 40

42
COMPANY NAME FINAL CREDIT RATING
QUALITATIVE QUANTITATIVE CREDIT RATING
OGDC 40% 47% 87%
PSO 39% 43% 82%
HUBCO 38% 38% 76%
PTCL 34% 38% 72%
INTERNAL CREDIT RISK RATING

43
Sector Information
Fuel & Energy
COMPANY NAME CREDIT RATING
OGDC
PSO
HUBCO
PTCL
AAA
AA
AA
A

44
Averag
e Max Min Quartile 1 Median Quartile 3
Net Working Capital (Rs.M) 466.79 10,760.45 -4,738.63 -6.30 123.23 498.37
Current Ratio (x) 2.19 112.48 0.28 0.97 1.77 1.56
Solvency (x) 1.24 4.49 0.20 0.66 1.50 1.55
Debt Leverage (x) 2.83 25.93 0.00 0.79 2.44 3.40
Book Value (Rs.) 33.15 166.88 10.11 17.14 34.60 42.84
Revenue per Share (Rs.) 225.42 2,222.47 0.35 22.87 66.29 269.34
Gross Profit Margin (%) 27.04 87.86 0.67 8.50 38.28 41.33
Times Interest Earned (x) 112.94 6,864.85 - 2.00 5.36 11.14
Fin Charges/Total Revenue (%) 6.49 35.18 - 0.47 5.41 10.94
Fin Charges/Total Expense (%) 39.24 498.50 - 9.04 40.88 63.13
Net Profit Margin (%) 12.42 43.89 0.20 2.39 13.59 20.73
Earnings per Share (Rs.) 20.22 92.41 0.01 8.46 20.06 24.36
Dividend / Net Profit (%) 48.44 468.42 - 16.35 65.66 66.61
Dividends per Share (Rs.) 3.46 35.00 - 0.50 3.00 4.00
Return on Investment (%) 7.66 29.22 0.07 3.64 9.51 10.76
Return on Equity (%) 20.85 88.97 0.07 11.37 27.39 28.33

45
Transport & Communication
Average Max Min Quartile 1 Median Quartile 3
Net Working Capital (Rs.M) -872.56 1,966.47 -16,208.77 -182.44 21.27 69.89
Current Ratio (x) 1.37 3.73 0.47 0.94 1.01 1.59
Solvency (x) 1.29 8.20 0.15 0.67 1.14 1.36
Debt Leverage (x) 3.45 73.96 0.24 0.74 1.03 1.78
Book Value (Rs.) 15.87 32.24 0.84 11.52 13.90 22.31
Revenue per Share (Rs.) 25.94 71.55 7.23 11.34 21.80 29.05
Gross Profit Margin (%) 85.79 100.00 12.77 100.00 100.00 100.00
Times Interest Earned (x) 13.14 80.67 1.18 1.98 6.16 13.69
Fin Charges/Total Revenue (%) 4.03 19.87 0.21 1.87 2.89 4.97
Fin Charges/Total Expense (%) 8.37 58.91 0.22 2.24 5.02 10.89
Net Profit Margin (%) 15.10 36.47 0.25 3.90 13.15 24.07
Earnings per Share (Rs.) 5.47 12.13 0.71 3.39 5.22 6.90
Dividend / Net Profit (%) 26.39 200.54 - - - 49.71
Dividends per Share (Rs.) 0.62 2.40 - - - 1.25
Return on Investment (%) 7.32 17.65 0.22 2.75 8.45 10.98
Return on Equity (%) 25.67 328.66 0.75 5.80 15.50 22.20
REFERENCES

46
International Convergence of Capital Measurement and Capital Standards: BASEL COMMITTEE ON BANKING SUPERVISION (2006) by BIS: Bank of
International Settlements. BASEL COMMITTEE ON BANKING SUPERVISION (1999a), Credit Risk Modeling: Current Practices and Applications, Document No. 49, April.
Altman, E., 1968, ―Financial Ratios, Discriminant Analysis and the Prediction of Corporate Bankruptcy,‖ Journal of Finance, September, pp. 189-209. Altman, E., R. Avery, R. Eisenbeis and J. Sinkey, 1981, Applications of Discriminant Analysis in Business, Banking & Finance, JAI Press, Greenwich, CT. . Phillips Jorion By FRM hand book 3rd Edition. Saunders, A., and L. Allen, 2002, Credit Risk Measurement, Second Edition (New York) John Wiley & Sons. Working Paper Rating-Based Credit risk modeling An Empirical Analysis by Pamela Nickell, William Perraudin, Simone Varotto: May 6 2005.
Rating model and validation by the Oesterreichische Nationalbank (OeNB) in cooperation with the Financial Market Authority (FMA)
FEDERAL RESERVE BOARD OF GOVERNORS (1998), Credit Risk Models at Major U.S. Banking Institutions: Current State of the Art and Implications for Assessments of Capital Adequacy, Federal Reserve System Task Force on Internal Credit Risk Models, May. Deutsche Bundesbank, Monthly Report for Sept. 2003, Approaches to the validation of internal rating systems Duffie, D./Singleton, K. J., Credit Risk: Pricing, Measurement and Management, Princeton University Press, 2003 (Credit Risk) Altman, Edward I., and Anthony Saunders, 1997, Credit risk measurement: Developments over the last 20 years, Journal of Banking and Finance 21, 1721-1742.

47
Financial Services Authority (FSA), Report and first consultation on the implementation of the new Basel and EU Capital Adequacy Standards, Consultation Paper 189, July 2003 (Report and first consultation) Tasche, D., A traffic lights approach to PD validation, Deutsche Bundesbank, preprint (A traffic lights approach to PD validation) Hamerle/Rauhmeier/Ro‹ sch, Uses and misuses of measures for credit rating accuracy, Universita‹t Regensburg, preprint 2003 (Uses and misuses of measures for credit rating accuracy)