Internal Corrosion of Used Fuel Container
69
Michael Wu, Mehran Behazin, Jiyu Nam, Peter KeechRyan Morco Nuclear Waste Management Organization Internal Corrosion of Used Fuel Container NWMO-TR-2019-02 January 2019
Transcript of Internal Corrosion of Used Fuel Container

Michael Wu, Mehran Behazin, Jiyu Nam, Peter KeechRyan Morco
Nuclear Waste Management Organization
Internal Corrosion of Used Fuel Container
NWMO-TR-2019-02 January 2019

Nuclear Waste Management Organization 22 St. Clair Avenue East, 6th Floor Toronto, Ontario M4T 2S3 Canada Tel: 416-934-9814 Web: www.nwmo.ca

i
This report has been prepared under contract to NWMO. The report has been reviewed by NWMO, but the views and conclusions are those of the authors and do not necessarily represent those of the NWMO. All copyright and intellectual property rights belong to NWMO.
Internal Corrosion of Used Fuel Container NWMO-TR-2019-02 January 2019
Michael Wu, Mehran Behazin, Jiyu Nam, Peter Keech Nuclear Waste Management Organization

ii
Document History
Title: Internal Corrosion of Used Fuel Container
Report Number: NWMO-TR-2019-02
Revision: R000 Date: January 2019
Author Company Nuclear Waste Management Organization
Authored by: Michael Wu, Mehran Behazin, Jiyu Nam, Peter Keech
Verified by: Fraser King
Reviewed by: David S. Hall
Nuclear Waste Management Organization
Reviewed by: Paul Gierszewski
Accepted by: Derek Wilson
Revision Summary
Revision Number Date Description of Changes/Improvements
R000 2019-01 Initial issue

iii
ABSTRACT Title: Internal Corrosion of Used Fuel Container Report No.: NWMO-TR-2019-02 Author(s): Michael Wu, Mehran Behazin, Jiyu Nam, Peter Keech Company: Nuclear Waste Management Organization Date: January 2019 Abstract The NWMO’s new reference design of used fuel container, the Mark II, has an outer copper coating and an inner carbon steel vessel. This report provides an overview of potential internal corrosion processes for the carbon steel vessel. The focus is to identify potential corrosion processes, to evaluate the risk of each corrosion mode affecting the container lifetime and performance, and to identify any knowledge gaps that require further investigation. This study differs from previous external corrosion studies in that it puts emphasis on the unique internal conditions of a post-closure used fuel container, such as finite oxidants, high radiation dose, high pressure, closed environment, and exposed welding region. This study has highlighted the main findings from previous literatures on each corrosion mode. Conservative corrosion calculations were carried out based on NWMO’s reference design. These calculations have defined the scale of certain corrosion scenarios and provided suggestions for further experimental tests. The assessment was conducted based on a series of hypothetical closure scenarios including whether to backfill the container with inert gas during encapsulation, in order to evaluate the impact of the inerting procedure on the container lifetime. In summary, this scoping study evaluated risks of different corrosion modes as listed below.
Possibility of perforation due to each corrosion mode
Screening results
General corrosion Negligible risk
Pitting corrosion Negligible risk
Crevice corrosion Negligible risk
SCC including weld corrosion cracking Negligible risk
Hydrogen induced cracking Further information required
Radiation embrittlement Negligible risk

iv
TABLE OF CONTENTS
Page
ABSTRACT ............................................................................................................................... iii
1. INTRODUCTION ................................................................................................. 7
1.1 BACKGROUND................................................................................................... 7 1.2 SCOPE OF WORK & REPORT DIRECTION ...................................................... 9
2. METHODOLOGY TO ASSESS INTERNAL CORROSION OF CONTAINER .... 11
2.1 GENERAL OVERVIEW OF INTERNAL CORROSION PROCESSES ............... 11 2.2 OVERVIEW OF RADIOLYSIS EFFECTS .......................................................... 14
3. RESULTS: ASSESSMENTS OF INTERNAL CORROSION ............................. 16
3.1 GENERAL CORROSION .................................................................................. 16 3.1.1 Oxygen and water .............................................................................................. 16 3.1.2 Iodine ................................................................................................................. 18 3.2 LOCALIZED CORROSION ............................................................................... 19 3.2.1 Pitting corrosion ................................................................................................. 19 3.2.2 Crevice corrosion ............................................................................................... 22 3.3 INFLUENCE OF NITRIC ACID .......................................................................... 24 3.4 STRESS CORROSION CRACKING .................................................................. 26 3.4.1 SCC induced by nitric acid ................................................................................. 26 3.4.2 Stress on interior UFC and welding region ......................................................... 27 3.5 HYDROGEN EFFECT ....................................................................................... 29 3.6 RADIATION EMBRITTLEMENT ........................................................................ 30 3.6.1 Literature on radiation embrittlement .................................................................. 30 3.6.2 Neutron fluence on interior UFC ......................................................................... 35
4. ONGOING AND FUTURE INVESTIGATION ..................................................... 38
5. CONCLUSIONS ................................................................................................ 39
ACKNOWLEDGEMENTS ......................................................................................................... 40
REFERENCES ......................................................................................................................... 41
APPENDIX A ............................................................................................................................ 51
REFERENCES OF APPENDIX ................................................................................................ 66

v
LIST OF TABLES Page
Table 1. Estimated general corrosion depth in Mark II UFC* ..................................................... 17 Table 2. Estimated pitting corrosion depth in Mark II UFC ......................................................... 21 Table 3. Local tensile stresses on interior UFC under external loading ..................................... 28 Table 4. Total neutron fluence on UFC at burnup of 320 MWh/kgU .......................................... 36 Table 5. Comparison with literature results ............................................................................... 36 Table 6. UFC net internal volume .............................................................................................. 52 Table 7: Total surface area susceptible to general corrosion..................................................... 53 Table 8: Oxygen gas content in Mark II UFC ............................................................................. 53 Table 9: Water vapour content .................................................................................................. 54 Table 10: Maximum amount of water that can be trapped in fuel elements ............................... 54 Table 11. Primary alpha-n neutron source intensity for CANDU UO2 fuel at burnup of 320
MWh/kgU, (Tait et al. 2000) ............................................................................................... 58 Table 12. Primary spontaneous fission neutron source intensity for CANDU UO2 fuel at burnup
of 320 MWh/kgU, (Tait et al. 2000) .................................................................................... 59 Table 13. Total neutron spectrum at burnup of 320 MWh/kgU (Tait et al. 2000) ........................ 59 Table 14. Total neutron release rate per unit mass at burnup of 320 MWh/kgU ........................ 60 Table 15. Total neutron release rate per bundle at burnup of 320 mwh/kgu .............................. 60 Table 16. Total neutron release rate per UFC at burnup of 320 MWh/kgU ................................ 61 Table 17: Nominal dose rates in air calculated for 4L-12 UFC at 220 MWh/kgU (unit: Gy/h) ..... 62 Table 18: Dose rates calculated at a high burnup of 320 MWh/kgU (unit: Gy/h) ........................ 63 Table 19. Maximum quantity of oxidants trapped in a Mark II UFC at time of closure ................ 64 Table 20. Trapped gases and internal pressure in a Mark II UFC (220 MW h/kgU) ................... 64 Table 21. Trapped gases and internal pressure in a Mark II UFC (320 MW h/kgU) ................... 65
LIST OF FIGURES
Page Figure 1. Conceptual drawing of the NWMO Mark II container for the disposal of used CANDU
fuel ...................................................................................................................................... 7 Figure 2. Flowchart diagram for evaluating the influence of corrosion events on the performance
of internal container. .......................................................................................................... 12 Figure 3. Relationship between the pitting factor and the mean corrosion depth for carbon steel
exposed to various environmental conditions (Féron et al. 2008, JNC 2000b). .................. 21 Figure 4. Conceptual drawing of the Mark II design of UFC with the highlighting areas which
may serve as crevice former.............................................................................................. 23 Figure 5. Calculated DRs at the internal surface of the Canadian UFC (Mark II) and the
predicted radiolytically produced HNO3 concentration from the primary •OH production over fuel age. ............................................................................................................................ 25
Figure 6. Residual stress measurement locations in cross section of the sample weld. The total depth H=9.28 mm, and highest tensile stress is at 3H/4. ................................................... 28
Figure 7. Change in 0.2% offset yield stress of A302B and A212B pressure vessel steels as a function of fast neutron fluence (Heinisch 1991) ................................................................ 31
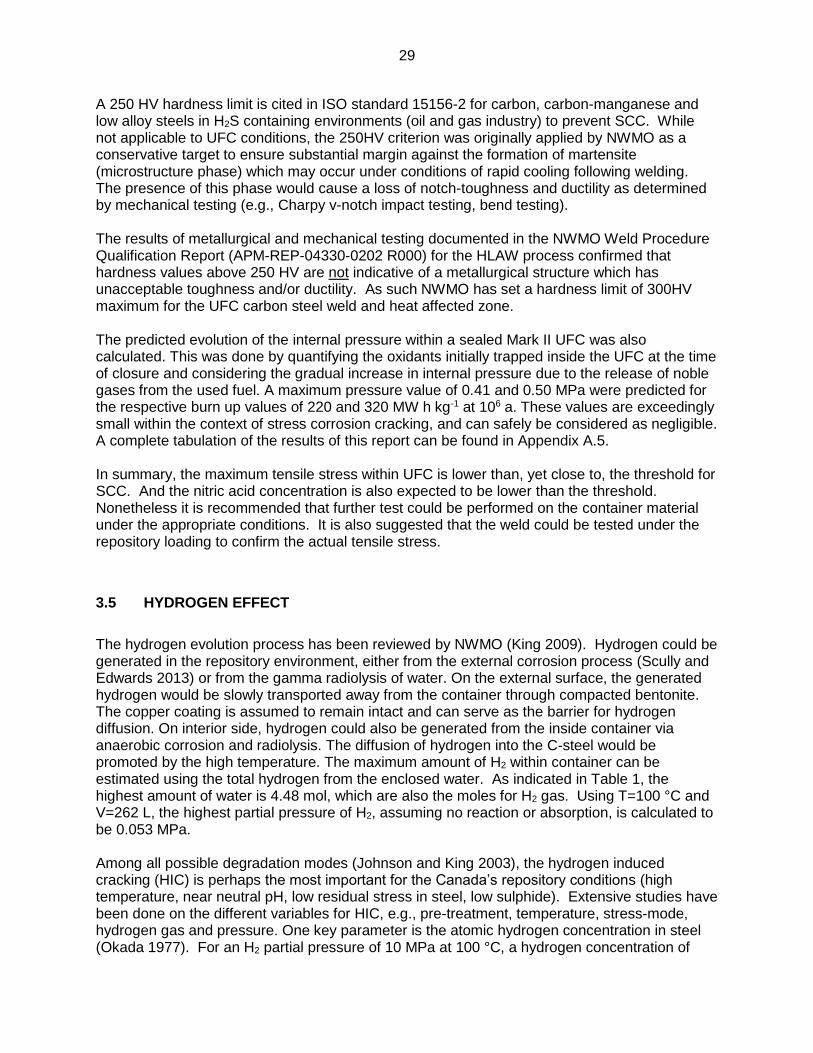
Figure 8. Change in 0.2% offset yield stress of A302B and A212B pressure vessel steels as a function of dpa (Heinisch 1991) ......................................................................................... 32
Figure 9. The Charpy V-notch impact test results of the miniature Charpy specimens unirradiated and irradiated with various neutron fluences and fluxes (Dohi et al. 1999) ..... 33

vi
Figure 10. Comparison of the increase in Charpy transition temperature estimated from the miniature Charpy specimen with literature data as a function of fast neutron dpa (Dohi et al. 1999) ................................................................................................................................. 33
Figure 11. Fluence dependence of yield stress and activation area for 14 MeV neutron irradiated iron (Aono et al. 1988). ...................................................................................................... 34
Figure 12. The relation between the increase of the yield stress and the neutron fluence in wider fluence region (Kinoshita et al. 1986). ............................................................................... 34
Figure 13. Evolution of neutron radiation for CANDU Fuel at 320 MWh/kgU burnup. ................ 35

7
1. INTRODUCTION
1.1 BACKGROUND
Canada’s long-term plan for the safe management of its used nuclear fuel is the Adaptive Phased Management (APM) process, recommended by Nuclear Waste Management Organization (NWMO) in 2005 and selected by Government of Canada in 2007 (NWMO 2012). Used fuel will be safely and securely contained and isolated from environment and people in a deep geological repository (DGR) in a suitable rock formation using a multiple-barrier system. In the conceptual design (Garisto 2017), the repository would be located at least 500 meters underground in a stable crystalline or sedimentary rock formation. Used nuclear fuel bundles discharged from CANDU reactors and interim storages would be sealed in strong and robust containers. The containers would be placed in excavated tunnels or boreholes and surrounded by compacted bentonite clay. When placement of waste containers is complete, and after a suitable monitoring period, the repository will be sealed. One key barrier in the isolation system is the used fuel container (UFC). The UFC consists of an inner vessel of carbon steel (SA516 Gr.70) which provides the structural strength to withstand repository loads, and an outer layer of copper which functions as a corrosion barrier. The reference container, referred to internally as the Mark II or CV-HH-4L-12 (Figure 1), departs from the previous reference by utilizing a pressure vessel grade pipe as shell material, an integral copper coating as corrosion barrier, and hemi-spherical heads. The carbon steel (C-steel) vessel provides a waste loading of 48 CANDU fuel bundles. In contrast, the Mark I design is a two-part copper-steel design that would hold 288 CANDU fuel bundles and would require custom equipment to manufacture. Mark II has the advantages of a manageable size/weight which is suitable for CANDU fuel bundles, an adjustable copper thickness determined by the corrosion allowance, standard industry materials for ease of availability, and structural improvements.
Figure 1. Conceptual drawing of the NWMO Mark II container for the disposal of used CANDU fuel

8
In the current design, the nominal C-steel wall thickness is 41 mm and the nominal C-steel head thickness is 25 mm. C-Steel has been studied as a candidate material for nuclear waste canister for over 30 years since initial consideration by Commission of the European Communities in 1980 (Marsh et al. 1983). C-steel is adopted or considered as container material in a number of countries including Switzerland (Johnson and King 2003), France (ANDRA 2005), Belgium (Wickham 2008), Japan (JNC 2000a), Germany (Closs and Papp 1998), and the United Kingdom (Marsh et al. 1986). Sweden has also considered using C-steel inserts for its Advanced Cold Process Container (Blackwood et al. 1994). C-steel is a good candidate because of low susceptibility to localized corrosion, good manufacturability, relatively low cost, and ability to create a reducing environment in repository. Studies through NWMO have provided a thorough review of the corrosion behaviours of C-steel under repository conditions (King 2007, 2009, King 2010, King and Kolar 2009, King and Kolar 2012); however, most efforts have gone to the simulation of anaerobic corrosion behaviour of C-steel containers emplaced in sedimentary rock formations. Within these studies, the maximum corrosion depth during service life has been estimated based on uniform and pitting corrosion rate (King 2007) for a range of container lifetimes, and the most recent simulations also includes the evolution of steel corrosion products (King and Kolar 2012). The particular degradation processes including stress corrosion cracking (SCC) and hydrogen effect have also been evaluated (King 2009, King 2010). As indicated above, the corrosion behaviour of C-steel under disposal conditions has been extensively studied, especially on the exterior surface in contact with the open repository environment. On the other hand, only a small number of studies have discussed the corrosion of interior surface. The conditions and corrosion scenarios on the interior surface are different from those on the exterior surface in several aspects:
Permanently limited oxidizing species. After the UFC is sealed, the enclosed species are limited to the residual gases including oxygen and water vapour. In principle, the radiolysis of humid air/water can produce small quantities of reactive species such as H2O2 and NOx (discussed below). While most of the oxidizing species can be eliminated by replacing the air with an inert gas at encapsulation, this study investigates the need for that processing step.
Possible enclosed water from defective fuel bundles. In extreme cases when the fuel cladding fails before encapsulation, additional residual water can be brought into the UFC. In the case of cladding failure during disposal lifetime, the fuel elements could potentially release fission gases such as iodine, which is a possible oxidizing agent.
A closed system that prevents residual water from escaping. For the open system that is the exterior surface, moisture that is originally present in the sealing materials could be driven outwards, away from the container by the heat generated from radioactivity of the used fuel. This could create a relatively dry zone in the nearest regions of container during the high-temperature period, which could inhibit corrosion for a period of time. Within the container, the enclosed residual water vapour would stay in contact with C-steel surface and undergo radiolysis.
Much stronger radiation fields. Regarding exterior processes, the UFC acts as a radiation shield; this would completely stop the alpha/beta radiations, and largely reduce the gamma/neutron radiation doses. The peak dose rate on the exterior surface is between 0.047 mGy/h to 5 Gy/h depending on fuel types and UFC designs (King et al. 2001, Anttila 1996, Closs and Papp 1998, JNC 2000b, Medri et al. 2012, Morco et al. 2017a). In contrast, the internal dose rate is anticipated as high as 100 Gy/h in the early

9
stage (according to the MicroShield calculation for gamma dose rates in Appendix A.4). As a result, the radiolysis effect and the subsequent corrosion process would be enhanced.
Welding/crevice regions. The geometry inside the container is more complicated than the outer copper coating, with respect to welds. From the corrosion perspective, welding regions are potentially subject to SCC, and crevice regions the crevice corrosion.
Therefore, the corrosion scenarios are different between the interior and exterior container. For example, the finite oxidants in the closed system bound the long-term corrosion by mass balance; however, higher dose rates may incur additional radiolysis related corrosion and radiation embrittlement. As indicated above, one mitigation method for internal corrosion is to replace the internal ambient gases with an inert gas backfill at encapsulation. This method is referred to as inerting procedure in this report, and the related operations have been developed previously by OPG dry storage facility (OPG 2011) and POSIVA (Kukkola 2002). The inerting procedure would minimize the quantities of oxidants for C-steel (e.g., oxygen and water) and reduce the production of radiolytically produced oxidants (e.g., hydrogen peroxide, nitrogen oxides and nitric acid). Considering the large surface area of C-steel including the inner vessel and fuel basket, there would be sufficient iron to consume the residual oxygen to create a stable reducing environment. Thus the internal corrosion has been previously concluded to be insignificant after inerting procedures in OPG reports (McMurry et al. 2003) and the Sixth Case Study by NWMO (Garisto 2017). An early SKB report concludes that the uniform corrosion caused by water inside container is of no importance, although the uncertainty arises concerning the quantity of water that could be introduced into container (SKB 1999). Finland also plans to replace the canister atmosphere with helium or argon to avoid the risk of internal corrosion and nitric acid formation (Miller and Marcos 2007, Raiko 2012). Nonetheless, it is judicious to evaluate to what extent the inerting procedure will reduce the corrosion damage, and whether this procedure is critical in determining the container lifetime. Even applied with the inerting procedure, the possibility still cannot be ruled out that residual air and water could be present in container. Also, some water could be brought into the container through defective fuel pencil tubes. Thus one uncertainty of internal corrosion is the quantity of water that could be enclosed at encapsulation. For example, in the presence of air and water, the radiolysis process could form nitric acid which would increase the risk of SCC. The production of nitric acid has been calculated based on different dose rates and humidity in container (Marsh 1990, Henshaw et al. 1990, Henshaw 1994). Based on these studies, the quantity of nitric acid formed by gas radiolysis is calculated to ~160 g, with 50 g of water trapped in a fuel pin and brought into the canister (SKB 1999). To date, few theoretical analyses or experimental data collection have been carried out by NWMO to evaluate the possible corrosion scenarios of interior container in the presence of humid air/water, namely general/localized corrosion, SCC, radiation embrittlement, welding region corrosion and hydrogen induced cracking. An investigation is also required for the influence of inerting procedure based on quantified analysis.
1.2 SCOPE OF WORK & REPORT DIRECTION
This report is to provide an overview of the internal corrosion processes and a screening-level assessment of the interior UFC, based on the new reference design of NWMO. The potential

10
internal corrosion modes are examined including general corrosion, pitting/crevice corrosion, SCC induced by radiolytic nitric acid, welding region corrosion, radiation embrittlement, and hydrogen effect. Microbiologically influenced corrosion is not included due to the severe conditions inside UFC. For the purposes of this report, the external copper coating is assumed to remain intact in the timeframe of study, thus the internal corrosion processes are separated from the external ones. We evaluate the risk of each process and point out relevant knowledge gaps in determining the impact of certain corrosion modes. Each of the mentioned processes is analyzed from one or more of the following aspects: thermodynamic probability, kinetics, conditions required for propagation, and corresponding mitigation methods. These processes are organized in their sequence of occurring using a flowchart diagram showing their causal relationship. The analyses are conducted based on past literatures and theoretical calculations. The following specific calculations have been carried out to estimate the accumulated corrosion and radiation damage:
The internal dose rate is calculated using verified software (MicroShield v9.05).
The material loss due to general corrosion damage is calculated based on the finite oxidants (oxygen, water and radiolysis species) enclosed in UFC, using a simple mass balance approach.
The extent of localized corrosion (pitting/crevice) is estimated using empirical pitting factors.
The radiation embrittlement is estimated based on the accumulated gamma/neutron fluence.
To evaluate the probability of stress cracking corrosion, the concentrations of potential cracking initiators (nitrate for C-steel) are calculated, and the tensile stress in structures is compared with the threshold values.
These calculations are based on a series of worst-case scenario assumptions, thus the calculated results can be used as an upper limit in corrosion damage estimation. For example, the highest burnup (320 MWh/kgU) is used to achieve the highest radiation dose. There is a concern as to whether the inerting procedure is critical in determining the corrosion lifetime of UFC, i.e., whether the UFC will persist through the expected lifetime without inerting. To help resolve this issue, we conducted the assessment by considering a range of potential internal conditions to represent different sealing procedures, e.g., humidity and temperature. The following scenarios are considered in this report:
UFC closed at 25 °C and 100% humidity.
UFC closed at 65 °C and 100% humidity.
UFC closed at 65 °C and 100% humidity, and 18 pencil tubes (1% of total) filled with water1.
UFC evacuated using vacuum drying and replaced with argon, and 18 pencil tubes (1% of total) filled with water.
1 The assumption is the free volume between fuel pellets and sheath is filled with water

11
Note that the assumption of 1% defective elements is conservative compared with the observed fuel defect rate of 0.1%, and the assumption of filling with liquid water is conservative due to the fuel temperature during dry storage and transport. Following an assembly of the literature review and theoretical calculations, conclusions are provided for the risk evaluation of each corrosion mode. For the processes that involve high uncertainties based on current knowledge, further investigations are suggested to improve the credibility and completeness of the overall assessment.
2. METHODOLOGY TO ASSESS INTERNAL CORROSION OF CONTAINER
2.1 GENERAL OVERVIEW OF INTERNAL CORROSION PROCESSES
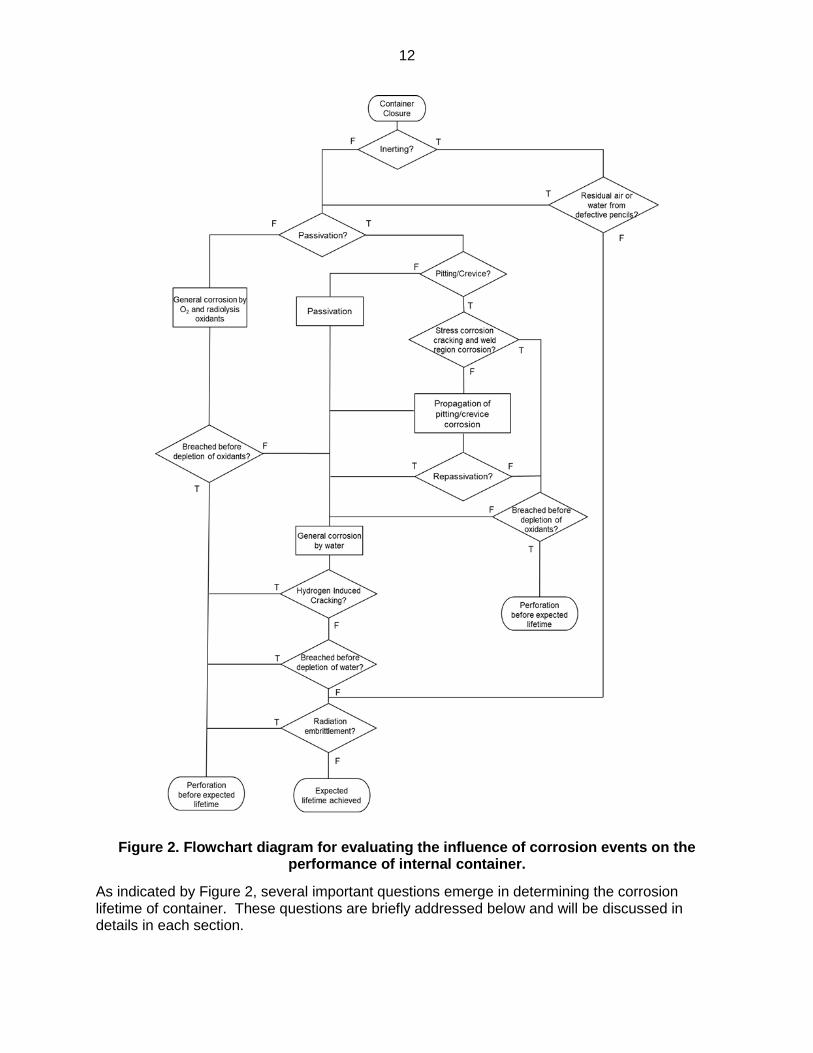
In this report, the possible evolution processes within the UFC are structured in a causal-relation system expressed by a flowchart diagram (Figure 2), which takes into account general corrosion, pitting/crevice corrosion, stress corrosion cracking, welding region corrosion, radiation embrittlement, and hydrogen effects. These processes are generally organized according to their chronological sequence of occurring, similar to the approach adopted by JNC (JNC 2000b). We can evaluate the influence of various corrosion modes on internal container by assessing the occurrence/non-occurrence of branches in the diagram. As indicated, Figure 2 is arranged according to the evolution of internal environment. Generally, the highest concentration of oxidizing species occurs during the initial stage after encapsulation. The most aggressive modes of corrosion (e.g., localized corrosion and SCC) are likely to occur during this period. The long-term period is subject to little corrosion damage after the depletion of oxidants inside container; although, some characteristics of internal conditions may continuously induce material degradation. For example, the long-term exposure to the high radiation field from used fuel could lead to point defect/dislocation resulting in reduced ductility and embrittlement. Hydrogen could also be produced inside the UFC either from the anaerobic corrosion process or from the gamma radiolysis of water. Some hydrogen would be absorbed by the container material and diffuse through the C-steel wall. The diffusion of hydrogen into the C-steel would be promoted by the high internal temperature. Thus, the possibility of hydrogen-induced cracking should be evaluated.
12
Figure 2. Flowchart diagram for evaluating the influence of corrosion events on the performance of internal container.
As indicated by Figure 2, several important questions emerge in determining the corrosion lifetime of container. These questions are briefly addressed below and will be discussed in details in each section.

13
Will the internal container be filled with inert gas before encapsulation?
Whether or not to apply the inerting procedure generates two branches in the diagram. If the internal condition remains ambient at encapsulation, a range of corrosion processes due to the enclosed oxidants would occur. If most of the air/moisture is evacuated from the container, the only possible dominant degradation process would become radiation embrittlement. In case of defective pencil tubes, water could still be present even applied with inerting procedure. The enclosed water will drive the anaerobic corrosion of C-steel.
Will the C-steel be in a passive state?
The answer would depend on the internal condition as will be discussed in Section 3.2 of localized corrosion. This generates two branches in the diagram and in the absence of a passive film, the material would undergo uniform corrosion. The general corrosion depth can be estimated by a simple mass balance approach using the amount of enclosed oxygen/water. In the initial stage after encapsulation, the predominant cathodic reaction would be oxygen reduction. After the oxygen is depleted, the cathodic reaction would switch to water reduction; the combination of these two corrosion methods allow for a determination of total corrosion depth, and whether or not a breach is possible. If a passive state prevails, the corrosion rate would be determined by passive current density, but such a system may be susceptible to localized processes. Thus, it follows:
Will localized corrosion occur?
When passivation is considered, the localized corrosion depth can be estimated using empirical pitting factors; in this manner additional safety margins are considered vs. the general corrosion allowance. If these processes would not breach the corrosion allowance of C-steel when all oxidizing species are depleted, then the question follows:
Will stress corrosion cracking occur?
SCC is the result of a combination of a susceptible material, exposure to a corrosive environment, and tensile stresses above a threshold. In general, C-steel is considered to be susceptible to SCC, but much less so than materials such as stainless steel. In addition, from the point of view of corrosion resistance there are a number of possible unfavorable conditions including nitrate, iodine and high-temperature water based on conventional tarnish rupture mechanisms. Tensile stress on the UFC interior is necessary for the risk of SCC but is not expected for the Mark II UFC design. If SCC is nonetheless presumed to be a breakdown mechanism for a material, it follows:
Will the welding regions be susceptible to enhanced corrosion, especially SCC?
In general, welded regions of a structure can be especially susceptible to cracking due to the tensile stress in the absence of post-weld stress relief. Even with the post-treatment, it is possible that the applied load in repository could impart tensile stress in the region of weld although further justification is required. If the SCC is unlikely to occur at welding regions until oxidizing species are exhausted, the damaged film would eventually be repassivated. Then the reducing conditions are expected to restore, and the following question must be considered:

14
Will hydrogen-induced cracking occur?
As indicated in the beginning of section, hydrogen is generated internally it could diffuse through the container wall. This would introduce the possibility of cracking and blister formation. If there is no such cracking due to the absorption of hydrogen, only the following question remains:
Will radiation embrittlement occur?
The material integrity may be influenced by the long-term exposure to high-energy neutron/gamma radiation. Lower energy alpha/beta radiation will be absorbed by the used fuel cladding and do not present corrosion risk (Medri 2016). The radiation could lead to point defect/dislocation in the material resulting in reduced ductility and embrittlement. As indicated in Figure 2, answering the questions in series allows for a determination of the risk of all possible breakdown mechanisms, as a result of internal corrosion processes.
2.2 OVERVIEW OF RADIOLYSIS EFFECTS
The main effect of radiation is through radiolysis of humid air and aqueous solution that are present close to metal surface. Another effect of radiation is embrittlement, which is discussed in Section 3.6. An estimate for the safe dose rate on the container exterior is 2.3 Gy/h (Morco et al. 2017, King and Watson 2010), which is expected to cause negligible or even beneficial effect on the container lifetime by creating a sterile environment and thereby reducing the possibility of formation of biofilms and microbial activity. However, the initial peak dose rate inside the containers is calculated to be on the order of 100 Gy/h (Appendix A.4). Therefore, whether radiolysis effects can result in a relatively high concentration of oxidants/acid must be evaluated. High dose rate radiolysis can produce various aggressive species, which can alter the redox conditions and both the bulk and localized pH (Spinks and Woods 1990). A wide range of water radiolysis species can be produced depending on the composition of moist air or solution. For example, in pure water the decomposition products include oxidizing radicals (e.g. ●OH) and molecules (e.g. H2O2, O2), as well as reducing radical and molecular species (e.g. H2, ●H, eaq
–). In moist air, nitrogen oxides (NOx) and consequently nitric acid are possible products; similarly reduced nitrogen species (i.e. ammonia, ●NH-containing radicals) can be produced, and these can subsequently act as reductants or oxidants (Yakabuskie et al. 2011). In a closed system without a reactive interface, the radiolysis oxidants and reductants can build up to an equilibrium concentration at which there is no net production or consumption of the radiolytically produced species. For gamma radiation (predominant in UFC condition), the steady-state concentration of each species will be reached rapidly, usually less than a few hours, and the steady-state concentrations are dependent on dose rate. The calculation for pure water radiolysis shows that the steady-state concentrations of major molecular oxidants are in the order of 10–8 mol/L at a dose rate of 5 Gy/h (Christensen and Sunder 2000). This concentration increases to 10–7 – 10–6 mol/L under a higher dose rate 900 Gy/h (Pastina and LaVerne 2001)while at a very high dose rate of 9000 Gy/h, the molecular oxidant H2O2 is calculated to be 10–6-10–4 mol/L depending on conditions (pH, aerated/de-aerated) (Joseph et al. 2008). Modelling results suggested a linear relationship for the steady-state H2O2 concentration as a function of the square-root of gamma dose rate reported by Ershov and Gordeev (2008).

15
The primary yields of the radiolytically produced species in the early stage of ionization process are expressed by G-values (number of molecules formed per 100 eV of radiation energy absorbed). Owing to charge balance considerations, equivalent amounts of oxidizing and reducing species, or positively and negatively charged species are generated through radiolysis. Notably, some fraction of these species will immediately undergo recombination, which will lower the amount of oxidizing species available for corrosion processes. The radiolysis of water vapour is subject to a higher diffusion rate and a lower recombination fraction comparing to the aqueous radiolysis. However, within a first calculation, all the oxidizing species generated by radiolysis are unrealistically assumed to affect corrosion. For this purpose, the overall G-value has been selected as 2.13 (liquid water) and 4.25 (water vapour) such that all the oxidizing species are included (Marsh et al. 1989, Spinks and Woods 1990), assuming all the species can accept two electrons per particle when oxidizing Fe (e.g. H2O2). Assuming the dose rate is uniform within the UFC and the medium remains a layer of liquid water on interior surface, the generation and migration of oxidants through this water layer thickness are expressed by the following diffusion equation. 𝑑𝐶
𝑑𝑡= 𝐷
𝑑2𝐶
𝑑𝑥2+
𝐺 ∙ 𝜌 ∙ 𝐷𝑅
𝐴𝑣 (1)
where 𝐶 is the concentration of oxidants, t is the irradiation time, 𝑥 the distance from interior surface, 𝐷 the diffusion coefficient, 𝐺 the G-value of oxidants, 𝜌 the density of medium, 𝐷𝑅 the
dose rate and 𝐴𝑣 the Avogadro’s constant. Given the dose rate value (varying with fuel burnup and age) and certain boundary conditions (such as 𝐶0=0), the oxidant flux and corrosion rate can be calculated. A sample calculation for nitric acid formation is shown in Section 3.3. For the gaseous phase, the dominant mass transport mechanism would be advection caused by the temperature gradients inside the vapour-filled container as indicated in a report for NDA (Burt et al. 2013). As the radiolysis and corrosion reactions continue, the gaseous phase would be replenished from the aqueous phase and eventually would consume all liquid water. For the bounding estimation of the total corrosion damage, a simple mass balance approach is used because the trapped air and water are finite. Again, to allow for the bounding condition, it is assumed that radiolysis causes the oxygen and water to dissociate completely and that all oxygen elements react with the CS container materials to produce Fe(II) oxides (Boyle 2012). This is not based on the expected corrosion pathways, but rather it is the corrosion route with the highest possible atom economy. Thus, the results are considered the upper limit of corrosion damage. The calculating details are in Section 3.1.
16
3. RESULTS: ASSESSMENTS OF INTERNAL CORROSION
The following section follows the logic behind Figure 2, through a systematic assessment of all identified internal corrosion processes.
3.1 GENERAL CORROSION
3.1.1 Oxygen and water During the first hundred years after disposal, the interior temperature of the containers is expected to be 100-200 °C (McMurry et al. 2003, Renström 1997, Ruiping Guo 2015). Temperature measurements of used fuel in concrete storage containers suggest a more realistic interior temperature to be less than 120 °C (Frost et al. 1994). The gas mixture of oxygen, water vapour and radiolysis products would be the driving force for uniform internal corrosion. The corrosion of C-steel in the presence of air and high RH would take place by physically adsorbing water in the molecular form or chemically forming metal-hydroxyl bonds (Leygraf 1995). At RH<20%, the metal-hydroxyl film would actually be quite protective, resulting in negligible corrosion rates. At RH~40%, an additional highly immobile water layer would adsorb on the top. The RH of ~65% is necessary for the formation of multiple water layers and also the onset of fast atmospheric corrosion for most metals. At RH>65%, the liquid film behaves in a manner similar to bulk water. In case of the trapped liquid water, the inner UFC would maintain a constant water vapour pressure and the gaseous water would be replenished from the liquid water as it is consumed in the vapour phase reactions. And eventually, the RH would drop to a negligible level as the water content is exhausted. The C-steel surface would tend to react with available oxygen and form oxides at a relatively rapid rate. King (2007) has reviewed the studies of atmospheric corrosion on C-steel at ambient temperature. The reported rates vary from ~10 µm/year in urban/rural environments to ~100 µm/year in marine locations (ASM 1987, Behrens 1990). However, it should be noted that an outdoor atmospheric conditions are different from the anticipated inner-UFC environment, especially in temperature and the daily wet-dry cycles. In a test by the Belgian nuclear waste disposal program, the corrosion rate was measured at ~150 µm/year in a humid clay atmosphere at 170 °C (Debruyn 1990) and 0.02-2 µm/year in a similar condition but on heat-treated and welded specimens (Debruyn et al. 1991). The wide range of results may be partially due to the pre-treatment of specimen as well as the humidity control. Nonetheless, these rates are measured with an unlimited supply of oxygen and vapour, whereas the quantity of oxidizing species would be finite within an intact container. The corresponding corrosion damage should therefore consider the limited supply of oxidizing species. The maximum corrosion damage due to humid air and its radiolysis products is estimated using a simple mass balance approach as indicated above. Several assumptions have been made to achieve the worst-case scenario results. A conservative surface area is used including only the inner vessel and the used fuel basket, which both are made of C-steel. Surface areas of other internal modules (e.g. basket locator and lifting plate) are excluded to both simplify the calculation and for conservatism. The surface of fuel bundle cladding made of Zircaloy is also excluded from the internal corrosion estimate. The reason is that during in-reactor irradiation and interim storage, the bundle surface would grow a relatively thick surface oxide, ZrO2, which would be passive and make further oxidation of underlying Zr extremely slow (Shoesmith and Zagidulin 2010). Another assumption is that all the trapped oxygen and water are consumed
17
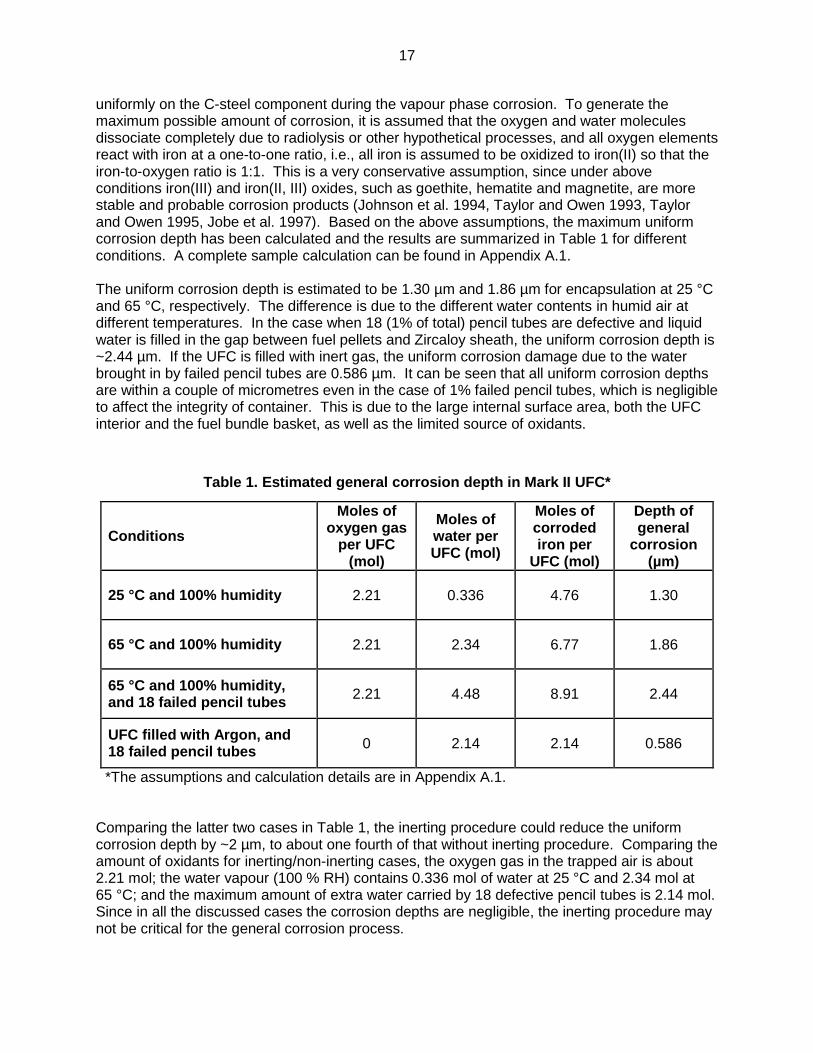
uniformly on the C-steel component during the vapour phase corrosion. To generate the maximum possible amount of corrosion, it is assumed that the oxygen and water molecules dissociate completely due to radiolysis or other hypothetical processes, and all oxygen elements react with iron at a one-to-one ratio, i.e., all iron is assumed to be oxidized to iron(II) so that the iron-to-oxygen ratio is 1:1. This is a very conservative assumption, since under above conditions iron(III) and iron(II, III) oxides, such as goethite, hematite and magnetite, are more stable and probable corrosion products (Johnson et al. 1994, Taylor and Owen 1993, Taylor and Owen 1995, Jobe et al. 1997). Based on the above assumptions, the maximum uniform corrosion depth has been calculated and the results are summarized in Table 1 for different conditions. A complete sample calculation can be found in Appendix A.1. The uniform corrosion depth is estimated to be 1.30 µm and 1.86 µm for encapsulation at 25 °C and 65 °C, respectively. The difference is due to the different water contents in humid air at different temperatures. In the case when 18 (1% of total) pencil tubes are defective and liquid water is filled in the gap between fuel pellets and Zircaloy sheath, the uniform corrosion depth is ~2.44 µm. If the UFC is filled with inert gas, the uniform corrosion damage due to the water brought in by failed pencil tubes are 0.586 µm. It can be seen that all uniform corrosion depths are within a couple of micrometres even in the case of 1% failed pencil tubes, which is negligible to affect the integrity of container. This is due to the large internal surface area, both the UFC interior and the fuel bundle basket, as well as the limited source of oxidants.
Table 1. Estimated general corrosion depth in Mark II UFC*
Conditions
Moles of oxygen gas
per UFC (mol)
Moles of water per UFC (mol)
Moles of corroded iron per
UFC (mol)
Depth of general
corrosion (µm)
25 °C and 100% humidity 2.21 0.336 4.76 1.30
65 °C and 100% humidity 2.21 2.34 6.77 1.86
65 °C and 100% humidity, and 18 failed pencil tubes
2.21 4.48 8.91 2.44
UFC filled with Argon, and 18 failed pencil tubes
0 2.14 2.14 0.586
*The assumptions and calculation details are in Appendix A.1. Comparing the latter two cases in Table 1, the inerting procedure could reduce the uniform corrosion depth by ~2 µm, to about one fourth of that without inerting procedure. Comparing the amount of oxidants for inerting/non-inerting cases, the oxygen gas in the trapped air is about 2.21 mol; the water vapour (100 % RH) contains 0.336 mol of water at 25 °C and 2.34 mol at 65 °C; and the maximum amount of extra water carried by 18 defective pencil tubes is 2.14 mol. Since in all the discussed cases the corrosion depths are negligible, the inerting procedure may not be critical for the general corrosion process.

18
The duration of corrosion due to trapped oxygen and water can thus be estimated using the maximum corrosion depth calculated above and the literature values for the corrosion rate. The reported rates range from 0.02 to 150 µm/year as discussed above. Even using the highest total corrosion depth, 2.44 µm, and the lowest reported corrosion rate, the reaction would be finished within 122 years. However, this estimate is overly simplistic and not a realistic evaluation. The corrosion rate is expected to increase significantly, by a factor of 10-20 times, under high irradiation fields (Smart et al. 2008). In addition, the interior temperature within the time period is ~120 °C as indicated in the beginning of this section, which favors the uniform vapour-phase corrosion. Therefore, a more plausible but nonetheless conservative estimate of the corrosion rate is ≥ 1 μm/year. Thus, the duration of corrosion due to trapped water and oxygen would be less than 3 years, after which C-steel would have removed all of the enclosed oxidants and the conditions in the UFC would become reducing. One uncertainty is the quantity of enclosed water in pencil tubes. In the most extreme hypothetical case, where all (1776) pencil tubes within a UFC are defective and the gaps between fuel pellets and sheath are filled with liquid water (~4 kg water in total), the uniform corrosion rate would increase to ~60 µm. Therefore, the extra water could play a part in promoting uniform corrosion, although the estimated corrosion depth is still too small to create significant C-steel degradation. Similar conclusion was drawn in page 74-75 of SKB report TR-99-07 (SKB 1999), and the water inclusion was thought unimportant as long as it remains in vapour phase. In conclusion, the risk for the general corrosion due to oxygen and water to perforate the container is low.
3.1.2 Iodine Iodine is one of the fission gases generated within the fuel matrix, and released into the gap between the fuel and the cladding during reactor operation (Johnson and Tait 1997, McMurry et al. 2003). As the fission gases continue to accumulate in the post-closure period, a high inner-clad pressure may be developed and the Zircaloy cladding may fail due to defects and creep. Then the iodine would be released to the container interior and participate in chemical/radiolysis reactions. There are some uncertainties concerning the quantities of iodine release. The fractional release of iodine from CANDU fuel has been reported to be 0.1-10% (Johnson and Shoesmith 1988). The key factors on iodine release are burnup and maximum linear power density (Barner et al. 1993a, Koizumi et al. 1991). A detailed review of the experimental and modelling efforts on fission gas release can be found in (SKB 1999). An upper bound of the iodine gas concentration within the UFC is estimated here. The conservative assumptions include (a) the highest burnup of 320 MWh/kgU; (b) none of the iodine is absorbed by the CANLUB coating inside the cladding; (c) a mean 1% fractional gas release (SKB 1999, Barner et al. 1993b, Koizumi et al. 1991) ; and (d) 1% of defective cladding. Based on the radionuclide inventory data for CANDU used fuel (Tait et al. 2000), the maximum amount of iodine released within UFC is pessimistically estimated to be 4×10⁻⁵ mol, and the corresponding uniform corrosion depth is 1.1×10⁻⁵ µm using the following reaction. 𝐼2 + 𝐹𝑒 → 𝐹𝑒𝐼2 (2)
In a more realistic estimation, the value would be much lower due to the absorption by the CANLUB coating and other structure material. For example, a previous estimation shows that the partial pressure of iodine would be <10–17 MPa for PWR fuel (Walle et al. 2001). Such a small quantity of iodine would result in negligible corrosion damage.

19
In conclusion, the risk for the general corrosion due to the enclosed species to perforate the container is low.
3.2 LOCALIZED CORROSION
In terms of corrosion, metals are categorized into corrosion allowance and corrosion resistance metals. The corrosion allowance metals will corrode rather than passivate in the presence of oxidants. In contrast, the corrosion resistant metals will undergo passivation, while they are subject to localized corrosion when the protective passive film breaks down locally. Although C-steel falls into the corrosion allowance category, the localized corrosion is still possible under certain environment (i.e., temperature, pH and chemical species). Firstly, it has been observed that when exposed to an oxygenated environment, C-steel could be subject to localized corrosion (Marsh and Taylor 1988). In case of interior UFC, the oxygenated environment could be fulfilled by the trapped oxygen and the oxidizing products of water radiolysis during the initial period. Secondly, the localized corrosion also requires liquid-phase water. This could potentially come from the condensed water film at high RH (>40 %) as discussed at the beginning of Section 3.1, as well as the liquid water brought in by defective pencil tubes. The condensed water film could form in two time periods: either the initial period after encapsulation at a high RH, or the period after UFC cools down. However, the general corrosion would consume the trapped oxygen and water before the temperature drops, as discussed in Section 3.1. Hence, the time frame for localized corrosion is likely to be within the first three years, when both the oxygenated environment and the high RH could be fulfilled. One inhibiting factor is that the enclosed water content is a rather dilute solution, which is not anticipated to contain a large amount of species to initiate localized corrosion, such as chloride. However, the possibility cannot be ruled out. For example, it has been observed that crevice corrosion can occur in air-saturated distilled water (Hilbert 2006). In addition, there exists some uncertainty over the amount of available oxidants/water and the degree of non-uniform corrosion. Therefore, it is judicious to evaluate the impact of localized corrosion on the inner container over the expected service life, especially in the first five years after encapsulation.
3.2.1 Pitting corrosion In an early study (Marsh and Taylor 1988), the authors measured the pitting depths of C-steel in 0.1 M NaHCO3 + 0.028 M NaCl solution (pH=8.4) at 90 °C. Potentiostatic control was used so that the pitting propagation was not limited by the cathodic reaction. A great number of pits were observed after 10,000 h at –200 mV(SCE) with the maximum penetration depth of 3.4 mm. The propagation rate was observed to decrease with time perhaps due to a highly protective passive film. Very similar results were obtained using a more dilute solution (0.01 M NaHCO3 + 0.0028 M NaCl). The reason was that the local concentration within pit remained high despite of a lower bulk concentration. The preliminary modelling results concluded that the concentration of Cl– within the localized corrosion site could be five orders of magnitude higher than that in the bulk solution (Sharland and Tasker 1988). The long term immersion test with no applied potential (Marsh and Taylor 1988) revealed two important features:
No pitting corrosion was observed when access to oxygen is limited, e.g., in argon-purged solutions or bentonite backfilling.
20
In a severe test in seawater, γ-irradiation could induce localized corrosion, whereas no pitting corrosion was observed in unirradiated condition.
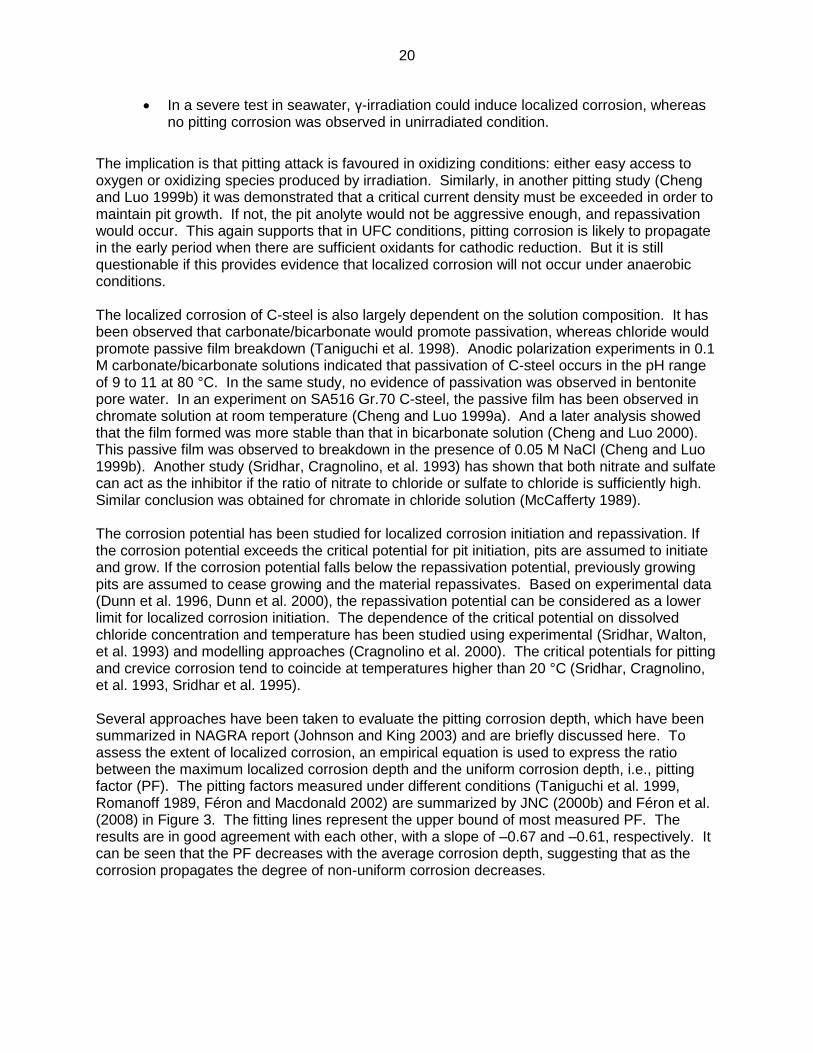
The implication is that pitting attack is favoured in oxidizing conditions: either easy access to oxygen or oxidizing species produced by irradiation. Similarly, in another pitting study (Cheng and Luo 1999b) it was demonstrated that a critical current density must be exceeded in order to maintain pit growth. If not, the pit anolyte would not be aggressive enough, and repassivation would occur. This again supports that in UFC conditions, pitting corrosion is likely to propagate in the early period when there are sufficient oxidants for cathodic reduction. But it is still questionable if this provides evidence that localized corrosion will not occur under anaerobic conditions. The localized corrosion of C-steel is also largely dependent on the solution composition. It has been observed that carbonate/bicarbonate would promote passivation, whereas chloride would promote passive film breakdown (Taniguchi et al. 1998). Anodic polarization experiments in 0.1 M carbonate/bicarbonate solutions indicated that passivation of C-steel occurs in the pH range of 9 to 11 at 80 °C. In the same study, no evidence of passivation was observed in bentonite pore water. In an experiment on SA516 Gr.70 C-steel, the passive film has been observed in chromate solution at room temperature (Cheng and Luo 1999a). And a later analysis showed that the film formed was more stable than that in bicarbonate solution (Cheng and Luo 2000). This passive film was observed to breakdown in the presence of 0.05 M NaCl (Cheng and Luo 1999b). Another study (Sridhar, Cragnolino, et al. 1993) has shown that both nitrate and sulfate can act as the inhibitor if the ratio of nitrate to chloride or sulfate to chloride is sufficiently high. Similar conclusion was obtained for chromate in chloride solution (McCafferty 1989). The corrosion potential has been studied for localized corrosion initiation and repassivation. If the corrosion potential exceeds the critical potential for pit initiation, pits are assumed to initiate and grow. If the corrosion potential falls below the repassivation potential, previously growing pits are assumed to cease growing and the material repassivates. Based on experimental data (Dunn et al. 1996, Dunn et al. 2000), the repassivation potential can be considered as a lower limit for localized corrosion initiation. The dependence of the critical potential on dissolved chloride concentration and temperature has been studied using experimental (Sridhar, Walton, et al. 1993) and modelling approaches (Cragnolino et al. 2000). The critical potentials for pitting and crevice corrosion tend to coincide at temperatures higher than 20 °C (Sridhar, Cragnolino, et al. 1993, Sridhar et al. 1995). Several approaches have been taken to evaluate the pitting corrosion depth, which have been summarized in NAGRA report (Johnson and King 2003) and are briefly discussed here. To assess the extent of localized corrosion, an empirical equation is used to express the ratio between the maximum localized corrosion depth and the uniform corrosion depth, i.e., pitting factor (PF). The pitting factors measured under different conditions (Taniguchi et al. 1999, Romanoff 1989, Féron and Macdonald 2002) are summarized by JNC (2000b) and Féron et al. (2008) in Figure 3. The fitting lines represent the upper bound of most measured PF. The results are in good agreement with each other, with a slope of –0.67 and –0.61, respectively. It can be seen that the PF decreases with the average corrosion depth, suggesting that as the corrosion propagates the degree of non-uniform corrosion decreases.

21
Figure 3. Relationship between the pitting factor and the mean corrosion depth for carbon steel exposed to various environmental conditions (Féron et al. 2008, JNC 2000b).
Using the fitting equation P=4.64x–0.67 for the envelope curve, an estimation of maximum pitting corrosion depth can be made, summarized in Table 2.
Table 2. Estimated pitting corrosion depth in Mark II UFC
Conditions Depth of general
corrosion (µm)
Maximum Pitting Factor
Maximum depth of pitting
corrosion (µm)
25 °C and 100% humidity 1.30 398 517
65 °C and 100% humidity 1.86 313 582
65 °C and 100% humidity, and 18 failed pencil tubes
2.44 261 637
UFC filled with Argon, and 18 failed pencil tubes
0.586 679 398
Among the four encapsulation conditions, the upper limit of localized corrosion depth is estimated to be ~0.6 mm. Since the PF is measured in environments which are more severe (high carbonate/chloride) than that of the internal UFC, the calculation results are considered conservative. In a European nuclear waste program, Féron et al. (2008) have investigated the pitting effect on non-alloy steel exposed for 8 months at 80 °C in compacted and saturated clay. The general corrosion depth was measured to 5 µm. The maximum pitting depth is calculated to 808 µm based on the empirical equation, while the measured value was only ~50 µm. Therefore, the actual pitting depth was well under the envelope of the empirically PF curve. One inhibiting factor for the pitting propagation is the oxide deposit formed outside the pit. In an electrochemical study on the pitting corrosion rate on C-steel (Cáceres et al. 2009), the iron oxide deposit was demonstrated to reduce the pitting corrosion rate. The proposed mechanism

22
was that the oxide layer blocked the cathodic surface and limited the oxygen reduction current. On the other hand, the under-deposit corrosion may also occur in case of thick oxide layers, which is not expected for this study. Nevertheless, even using the highly conservative estimation for pitting corrosion (~0.6 mm), the impact on the container integrity is thought to be negligible.
3.2.2 Crevice corrosion Crevice corrosion is a type of localized attack that is more commonly encountered than pitting in industrial structures. The mechanism of crevice corrosion is very similar to pitting corrosion. It occurs within a crevice former where the access of working fluid from the environment is limited. The water film covered area outside the crevice becomes the electrochemical cathode, and the water filled area inside the crevice the anode. The possible oxidants are trapped oxygen and water radiolysis species. Examples of crevice formers are gaps of a few micrometres, contact areas between parts, and spaces filled with deposits. The limited mass transport due to the crevice geometry leads to the development of gradient in oxidant concentration and pH, low at the anode (inside the crevice) and high at the cathode (outside the crevice which is also called bold surface). Once the generated condition is sufficient for the initiation of attack, the crevice starts to propagate. The propagation largely depends on sustaining the damaging condition. The electrolyte in a crevice is thought to be a concentrated metal salt solution of low pH. The pH inside the crevice may be as low as 1-2 in a neutral bulk solution. There is by no means certain that the kinetic processes governing the rate of propagation will keep the same as measured in the short term experiments. It is quite feasible that the IR resistance drop in a deep crevice will become so great that the conditions will come to favour the retardation of the crevice corrosion rather than continued propagation. Also the corrosion current can be limited by the presence of solid ferrous hydroxide at the corrosion site, which will restrict the diffusion and migration of both corrosion products and aggressive species. Therefore, a decreasing penetrating rate is usually observed as the corrosion proceeds. The termination of crevice corrosion occurs when the damaging electrochemical condition is no longer fulfilled. For example, if the rapid corrosion process widens the mouth of crevice, the local condition becomes unsustainable and the crevice corrosion stops. In another case, oxidizing species may decrease into a lower level so that the cathodic current is unlikely to be maintained. It could also be possible that the water content is consumed in corrosion and crevice corrosion is unable to initiate/propagate without condensed water. The contact region between components within UFC could be a crevice former. The crevice corrosion between the inner modules (e.g., bundle basket and locator) is less important in affecting the service life. The key area concerning the container integrity is the contact area between the lower assembly and the hemi head, as highlighted in Figure 4. As discussed in section 3.1, uniform internal corrosion of a container is not a concern due to limited quantities of gas and liquid in the sealed container that could participate in this corrosion. However, gamma-radiolysis of humid air produces NOx and HNO3 and these species could accelerate the formation and condensation of water droplets on small surface areas to cause localized corrosion, or in crevices (which might have surface roughness features that act as preferential condensation sites). The chemical environment in acidic condensed water, coupled with the presence of radiolytic water decomposition species could be aggressive. If water droplets condense within the crevice between the head and the lower assembly of the UFC or in the stressed regions near the welds, the corrosion in these areas could lead to a localized build-up of corrosion products (oxide deposits and H2 gas) or stress corrosion phenomena. The result of such corrosion, over time, could lead to penetration and localized failure of the integrity of the

23
UFC. The possibility of crevice corrosion of C-steel was assessed by Wu et.al. (2017) performing corrosion tests of the weld regions under irradiated conditions. Within the weld region of a UFC there will be two different corrosion environments associated with the crevice at the weld and the adjoining boldly exposed metal surfaces, Figure 4. This work explored the possibility of galvanically coupled corrosion between the crevice and bold C-steel surfaces in the presence of gamma-radiation. A range of gas, solution and surface analysis techniques were used to determine the extent of corrosion and the influence of gamma-irradiation. The combination of these analyses as a function of corrosion exposure or irradiation time indicated that the crevice region remains intact and that deposition of corrosion products within the crevice region does not occur. The crevice surface showed minimal corrosion under all studied conditions, exhibiting inverse crevice corrosion behavior. The coupling current measured between a crevice and a bold electrode in an electrochemical cell was also negative, i.e., the opposite direction to that seen in normal crevice corrosion. Therefore, the accelerated crevice corrosion is not anticipated to occur for a welded C-steel container under studied conditions.
Figure 4. Conceptual drawing of the Mark II design of UFC with the highlighting areas which may serve as crevice former.

24
Although the overall mechanism is thought to be understood, no literature can give exact answer about the likelihood, timing, damage extent, and rate of attack. In the case of the NWMO Mark II UFC design, the inner UFC condition disfavours the crevice corrosion due to the limitation of reactive species, supporting electrolyte and condensed water. And the general corrosion could consume the reactive species to further reduce concentration of oxidants. However, it is judicious to study the crevice corrosion in the worst-case scenario. Conventional crevice corrosion produces significant dissolution of metal from within the crevice. This corrosion product is generally precipitated outside the crevice, and such a process will not produce destabilizing forces on the weld. However, if corrosion product precipitation processes, e.g., gamma-radiolysis induced iron oxyhydroxide colloidal formation reported by Yakabuskie et al. (2011), can be initiated within the crevice, and if possible, can lead to the accumulation of corrosion products within the crevice, unfavourable forces may result in additional weld stress from inside the container. This possibility can be evaluated using corrosion tests and strain measurements. In addition, another uncertainty concerns the degree of non-uniform corrosion on the circumference of crevice region. Therefore, further experiment is required before any conclusion can be made on the evaluation of crevice corrosion in UFC.
3.3 INFLUENCE OF NITRIC ACID
As mentioned previously the current UFC design consists of an inner vessel made of C-steel for structural strength and an outer Cu coating as an external corrosion barrier. Compared to the previous design, the C-steel vessel thickness is reduced considerably from 10 to 4.6 cm, and the 25-mm-thick outer copper shell is replaced with a 3 mm thick integrally applied copper coating. The local environment (liquid water, water vapour, and humid air) and both internal and external metal components of UFC will be exposed to the ionizing radiation (particularly γ-radiation) emitted by the decay of radionuclides in the used fuel. The radiation energy absorbed by the metal UFC components will be dissipated mainly as heat but it could also induce ionization and decomposition of water and gas phase molecules to yield redox active species. For example, γ-irradiation of water droplets would produce oxidants such as H2O2, while humid-air radiolysis would produce NOx and HNO3 (g) that can dissolve in the water droplets. The produced nitric acid could react with C-steel metal or oxide to form nitrates and cause different types of corrosion. The formation of nitric acid and surface-adsorbed nitrate was one contributing factor to oxygen gas consumption, based on the generally observed disappearance of oxygen from air-sealed Pu storage containers (Lloyd et al. 1998). Another evidence of radiolytic nitric acid is the observation of Cu2NO3(OH)3 as one of the corrosion products on copper (Reed et al. 1990, Shoesmith and King 1999, Turnbull et al. 2017). Therefore, it is important that the maximum amount of radiolytically-produced nitric acid is first calculated to evaluate both internal and external corrosion of UFC. The maximum quantity of nitric acid produced within a sealed UFC has been estimated using a humid-air radiolysis model (HARM) (Morco et al. 2017a), where the decrease in the dose rate over time and how it would affect HNO3 rate production and accumulated concentration have also been taken into account. The model is primarily based on the absorption of radiation energy by the three main components of air (N2, O2, and H2O) results in the formation of a range of primary products that include electronically excited and ionized molecules, ions and free radicals. Detailed kinetic analysis of the modelling results suggests that the precursors for HNO3(g) production are •OH(g) and NO2(g), where NO2(g) is a secondary product of the γ-radiolysis of air. The production rate of [HNO3(aq)]t in a water droplet is determined by the deposition rate of HNO3(g) formed by humid-air radiolysis onto the water droplet surface. This

25
deposition rate increases with [HNO3(g)]t. The maximum [HNO3(g)]t can be achieved when the removal rate of HNO3(g) by the gas-phase chemical reactions of HNO3(g) is negligible. The rate equation for [HNO3(g)]t when the deposition rate becomes significant can then be approximated as:
𝑑[𝐻𝑁𝑂3 (𝑔)]𝑡
𝑑𝑡≈
𝑉𝑔
𝑉𝑎𝑞𝑓𝑁𝑂2−𝑂𝐻 . 10−6. 𝑔𝑂𝐻(𝑔). 𝐷𝑅 . 𝜌𝑤 (3)
Assuming DR and relative humidity (RH) change at much slower rates than [HNO3(aq)]t:
[𝐻𝑁𝑂3 (𝑎𝑞)]𝑡 ≈𝑉𝑔
𝑉𝑎𝑞𝑓𝑁𝑂2−𝑂𝐻 . 10−6. 𝑔𝑂𝐻(𝑔). 𝐷𝑅 . 𝜌𝑤 . 𝑡 (4)
Thus, at a given DR, RH, and T, [HNO3(aq)]t in a water droplet will increase proportionally with the ratio of the gas to water droplet volumes. Internal UFC surface γ-radiation DRs as a function of storage time were estimated for a base case involving used fuel with a burnup of 220 MWh kgU-1 using Microshield v9.05 and appropriate fluence to DR conversion factors (Medri 2017). Because the software is not designed to model non-homogeneities in the shielding materials, the source was represented as a single cylinder of used fuel (UO2) encapsulated in a layer of Zircaloy (modelled as zirconium) and the UFC was modelled as a layer of C-steel. Figure 5 shows the accumulated concentration of HNO3 as a function of fuel age with a burn up of 220 MWh KgU-1.
Figure 5. Calculated DRs at the internal surface of the Canadian UFC (Mark II) and the predicted radiolytically produced HNO3 concentration from the primary •OH production
over fuel age.
Considering that SCC of C-steel in nitrate is typically a film rupture-anodic dissolution mechanism which needs relatively aerobic conditions, the most susceptible period of SCC would be within 1 year. The threshold of nitrate concentration to initiate SCC of C-steel is measured to ~1 mM (Beavers et al. 1987), i.e., a total of 0.262 mol within Mark II UFC. Since the measurement was performed in aqueous solution, this threshold can by no means apply to the gaseous case. Nonetheless, the calculation of nitric acid evolution is carried out only for comparison and qualitative purposes. In the extreme case assuming no nitric acid consumption, it takes 20 years to reach 1mM based on HARM calculations, Figure 5. However, the C-steel container would undergo corrosion and consume the oxidants and it is likely that a

26
great portion of nitric acid would react with the container resulting in a much lower nitric acid concentration. Other modelling studies (SKB 1999, Henshaw 1994) also suggest that as the water and oxygen would be rapidly consumed by corrosion, the internal condition would not be suitable for nitric acid production. A method has been developed to calculate the nitric acid production in gaseous environment of the Advanced Cold Process Canister for SKB (Marsh 1990, Henshaw et al. 1990, Henshaw 1994). The model includes two hundred radiolysis reactions in a moist air system with different fractions of inert gas. If the canister is fill with a gas mixture containing 95% inert gas and 5% residual air, the quantity of nitric acid would reach the maximum level of 4 g in the 12th year and rapidly decompose to NO2 after 15 years (Henshaw 1994). The modelling results have been “benchmarked” by the experimental measurements (Jones 1959). In a JNC report (Naito et al. 1999), the steady-state concentration of radiolysis nitrogen species is calculated to ~0.0002 mol/L in a worst-case scenario when groundwater is in direct contact with the vitrified waste.
3.4 STRESS CORROSION CRACKING
SCC needs both an aggressive environment and a suitable tensile stress. The absence of either requirement would not initiate SCC. Possible processes include (a) the electrochemical dissolution of metal at the base of crack acting as anode in contact with metal elsewhere acting as cathode; (b) progressive cracking of a brittle oxide film; (c) weakening of metal bonds by adsorption of specific anions (Uhlig and Cook 1969). SCC is commonly present in the transition ranges between the active and the passive, or the passive and the transpassive potential, thus was observed at high-temperature in the presence of either hydrogen or oxygen. SKB studies (SKB 1999, Werme and Lilja 2010) suggest that SCC is highly improbable to lead to penetrating cracks in container due to the low nitrate after inerting and the small affected areas of tensile stresses on the cast insert. In a NAGRA report (Johnson and King 2003), The SCC of mild steel as an exterior material appears to be unlikely under Swiss repository condition by conventional tarnish rupture mechanisms. Reasons included: the pH is anticipated to be out of the required range; the cyclic loading is absent for the container in repository; and the corrosion potential may be below the necessary potential under anaerobic conditions for high-pH SCC. A detailed review for SCC on C-steel in sedimentary environment has been done by King (2010). Due to the unique internal condition of UFC, this section will mainly discuss the probability of SCC initiated by nitric acid, with emphasis on the welding regions where the stresses are expected to be relatively high.
3.4.1 SCC induced by nitric acid It is known that C-steel is susceptible to SCC in high-temperature solutions containing nitrogen species, such as nitrate (Uhlig and Sava 1963, Long and Uhlig 1965, Dikii et al. 1972). A slow strain rate test has shown that SCC does not initiate in a boiling potassium nitrate solution with a concentration of 1 mM (Beavers et al. 1987). Although the aqueous solution tests may not represent the internal UFC conditions well, aqueous water may be present when the internal humidity is high with some uncertainties concerning the quantities of nitric acid dissolved in liquid water.
27
The vapour form of nitric acid could also induced SCC. In an early study by SKB assessing the then design of steel liner for the Advanced Cold Process Canister, the authors performed an accelerated SCC test for C-steel in nitric acid vapour and also did some radiolysis modelling (Blackwood et al. 1995). A conservative threshold for the onset of SCC was estimated to be >1 vpm (4.46×10⁻⁸ mol/L) of nitric acid vapour. It is noticed that the conditions in this study are different from those in the NWMO case. The material used in the test was a plain 0.16% C-steel in the water quenched (from 920 °C) condition. In a review of this study (Bowyer 1999), it was suggested that the water quenching procedure would largely reduce the ductility if without tempering, thus make the sample more susceptible to SCC. Moreover, the dynamic strain in the accelerated SCC test may favour the cracking initiation, in contrast to the static load for UFC conditions. And as discussed below, the stress level within UFC is also far below the yield stress. In regard to the radiolysis modelling by Blackwood et al. (1995), a later SKB report (SKB 1999) claimed that nitric acid would be unstable under less humid conditions and decomposes to NO2. And the water and oxygen would be rapidly consumed by corrosion thus the internal condition is not suitable for nitric acid production. In conclusion, the risk of nitric acid reaching the SCC threshold is low, and a reasonable timeframe for nitric acid production is <5 years. Although the possibility of nitric-acid-induced SCC is low, some more refined work is suggested to investigate the nitric acid evolution and the SCC initiation inside container.
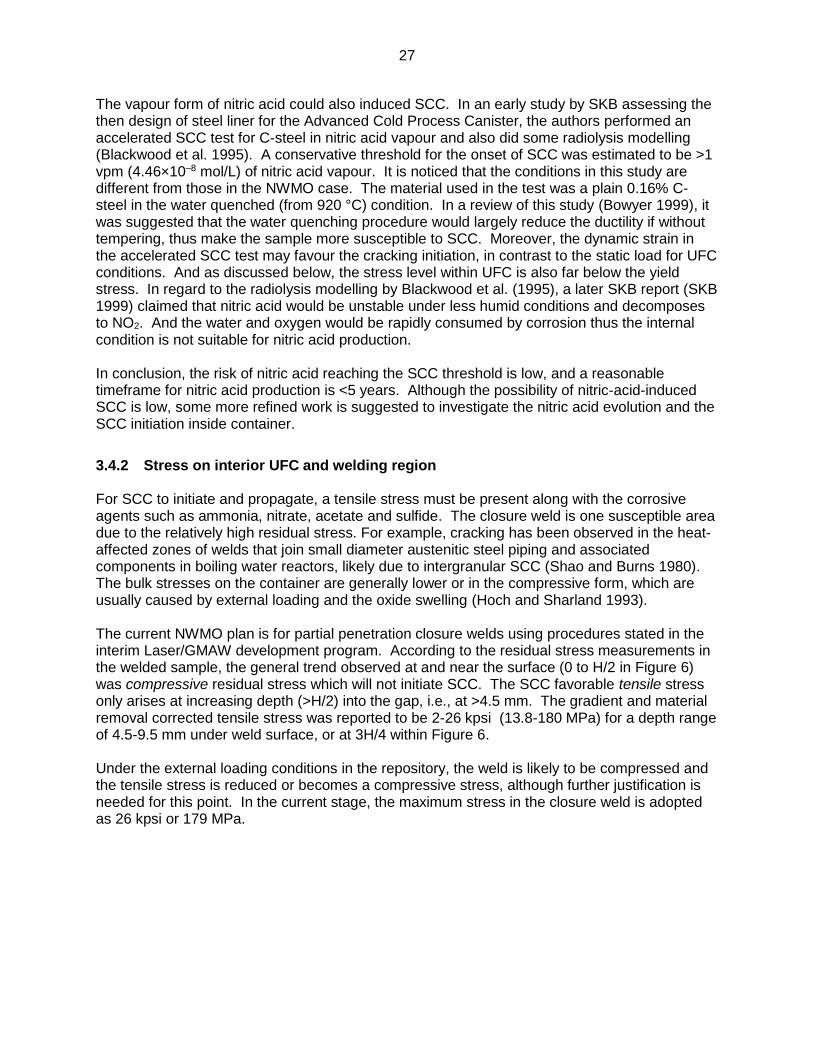
3.4.2 Stress on interior UFC and welding region For SCC to initiate and propagate, a tensile stress must be present along with the corrosive agents such as ammonia, nitrate, acetate and sulfide. The closure weld is one susceptible area due to the relatively high residual stress. For example, cracking has been observed in the heat-affected zones of welds that join small diameter austenitic steel piping and associated components in boiling water reactors, likely due to intergranular SCC (Shao and Burns 1980). The bulk stresses on the container are generally lower or in the compressive form, which are usually caused by external loading and the oxide swelling (Hoch and Sharland 1993). The current NWMO plan is for partial penetration closure welds using procedures stated in the interim Laser/GMAW development program. According to the residual stress measurements in the welded sample, the general trend observed at and near the surface (0 to H/2 in Figure 6) was compressive residual stress which will not initiate SCC. The SCC favorable tensile stress only arises at increasing depth (>H/2) into the gap, i.e., at >4.5 mm. The gradient and material removal corrected tensile stress was reported to be 2-26 kpsi (13.8-180 MPa) for a depth range of 4.5-9.5 mm under weld surface, or at 3H/4 within Figure 6. Under the external loading conditions in the repository, the weld is likely to be compressed and the tensile stress is reduced or becomes a compressive stress, although further justification is needed for this point. In the current stage, the maximum stress in the closure weld is adopted as 26 kpsi or 179 MPa.

28
Figure 6. Residual stress measurement locations in cross section of the sample weld. The total depth H=9.28 mm, and highest tensile stress is at 3H/4.
The tensile stress on the interior container under external loading is also analyzed for Mark I and Mark II (4L-12) designs as listed in Table 3. The external loading is expected to be 15 MPa in 6000 years. Generally, the tensile stresses on Mark I are higher than those on Mark II due to the flat lid design and the bolt joining. For both designs, the tensile stresses are found to be highly localized, appearing mostly on and near the lid. And the highest value was found at the joining region between lid and vessel, 152 MPa in the case of the Mark II design. This value is about half of the yield stress of the C-steel used in the design, 275 MPa.
Table 3. Local tensile stresses on interior UFC under external loading
NWMO design Under 15 MPa external pressure
Nominal (MPa) Maximum (MPa)
Mark I 65 265
Mark II 15 152
The threshold stress for SCC under the inner UFC condition (i.e., nitric acid vapour, high radiation) is not clear, but some literature in other conditions are listed here. In a report by the Commission of the European Communities (Haijtink 1985), C-steel was tested using a cantilever loading in high carbonate solutions at 90 °C. The threshold stress was found to be ~600 MPa which is well in excess of the steel yield stress (~300 MPa). However, in the same study, tests with specimens after quenching treatment to simulate the seal weld heat-affected regions had a threshold stress of only 200 MPa. In a following test on specimens with improved heat treatment, the threshold stresses for the weld metal and heat-affected zone were both estimated to 600 MPa (Parkins 1985). This implies that the subsequent tempering could largely reduce the susceptibility of SCC.
29
A 250 HV hardness limit is cited in ISO standard 15156-2 for carbon, carbon-manganese and low alloy steels in H2S containing environments (oil and gas industry) to prevent SCC. While not applicable to UFC conditions, the 250HV criterion was originally applied by NWMO as a conservative target to ensure substantial margin against the formation of martensite (microstructure phase) which may occur under conditions of rapid cooling following welding. The presence of this phase would cause a loss of notch-toughness and ductility as determined by mechanical testing (e.g., Charpy v-notch impact testing, bend testing). The results of metallurgical and mechanical testing documented in the NWMO Weld Procedure Qualification Report (APM-REP-04330-0202 R000) for the HLAW process confirmed that hardness values above 250 HV are not indicative of a metallurgical structure which has unacceptable toughness and/or ductility. As such NWMO has set a hardness limit of 300HV maximum for the UFC carbon steel weld and heat affected zone. The predicted evolution of the internal pressure within a sealed Mark II UFC was also calculated. This was done by quantifying the oxidants initially trapped inside the UFC at the time of closure and considering the gradual increase in internal pressure due to the release of noble gases from the used fuel. A maximum pressure value of 0.41 and 0.50 MPa were predicted for the respective burn up values of 220 and 320 MW h kg-1 at 106 a. These values are exceedingly small within the context of stress corrosion cracking, and can safely be considered as negligible. A complete tabulation of the results of this report can be found in Appendix A.5. In summary, the maximum tensile stress within UFC is lower than, yet close to, the threshold for SCC. And the nitric acid concentration is also expected to be lower than the threshold. Nonetheless it is recommended that further test could be performed on the container material under the appropriate conditions. It is also suggested that the weld could be tested under the repository loading to confirm the actual tensile stress.
3.5 HYDROGEN EFFECT
The hydrogen evolution process has been reviewed by NWMO (King 2009). Hydrogen could be generated in the repository environment, either from the external corrosion process (Scully and Edwards 2013) or from the gamma radiolysis of water. On the external surface, the generated hydrogen would be slowly transported away from the container through compacted bentonite. The copper coating is assumed to remain intact and can serve as the barrier for hydrogen diffusion. On interior side, hydrogen could also be generated from the inside container via anaerobic corrosion and radiolysis. The diffusion of hydrogen into the C-steel would be promoted by the high temperature. The maximum amount of H2 within container can be estimated using the total hydrogen from the enclosed water. As indicated in Table 1, the highest amount of water is 4.48 mol, which are also the moles for H2 gas. Using T=100 °C and V=262 L, the highest partial pressure of H2, assuming no reaction or absorption, is calculated to be 0.053 MPa. Among all possible degradation modes (Johnson and King 2003), the hydrogen induced cracking (HIC) is perhaps the most important for the Canada’s repository conditions (high temperature, near neutral pH, low residual stress in steel, low sulphide). Extensive studies have been done on the different variables for HIC, e.g., pre-treatment, temperature, stress-mode, hydrogen gas and pressure. One key parameter is the atomic hydrogen concentration in steel (Okada 1977). For an H2 partial pressure of 10 MPa at 100 °C, a hydrogen concentration of

30
0.065 µg/g has been estimated (JNC 2000b). In the same study, the total hydrogen, including the immobilized/trapped H within steel matrix, is reported to be <0.1 µg/g. For a relatively low-strength steel used in NWMO’s design (yield stress ~275 MPa), the critical hydrogen concentration is expected to be >10 µg/g according to (JNC 2000b). Welds are also susceptible to hydrogen embrittlement due to the presence of the formation of susceptible microstructure and residual stress. In a test on the tensile properties and fracture toughness of welded C-steel in the presence of 6.9 MPa H2, the heat-affect zone was noticed to be less-resistant to cracking comparing with base metal and weld fusion zone (Somerday 2007). The partial pressure of H2 inside the container (0.053 MPa) is several orders of magnitude below the amount required to cause significant degradation of the container material. King (2009) has concluded that the probability of hydrogen-related damage is considered low and can be further reduced through appropriate selection of material and design of container and closure weld. In conclusion, the possibility of hydrogen induced cracking is low. Further investigation can focus on demonstrating that the weld region remains a non-issue for HIC.
3.6 RADIATION EMBRITTLEMENT
In the UFC, the high radiation from used fuel bundles will interact with the metal container. A detailed mechanism of radiation embrittlement can be found elsewhere (Vo and Yue 2012). Briefly, the atom displacement effect by high-energy irradiation may introduce vacancy and interstitial atom to the original lattice. The production of cavities within the lattice leads to swelling. And the impurity atoms disturb the lattice structure resulting in appreciable loss of ductility and radiation-induced embrittlement. The total damage is attributed to a combined effect of neutron and gamma induced displacement (Steele 1966). Although the fraction of damage due to gamma radiation is significant at the initial time of disposal (Farrell et al. 1994), the intensity of gamma decays rapidly in the first hundreds of years. According to the calculation in SKB report (Guinan 2001), a great part of the accumulated damage on canisters at 100,000 years is caused by neutron radiation. Neutron contributes about 84% of the radiation damage on the iron surface, and 98.8% on the iron/copper interface. The remaining fraction of damage is from gamma radiation emitted by fuel bundles and secondary gamma doses induced by neutrons. Despite the different types of fuel and designs of container for CANDU used fuel, these conclusions can be used for a screening-level calculation considering the similarity in the radiation spectrum shape. Therefore, a primary effort in this study goes into neutron radiation effect.
3.6.1 Literature on radiation embrittlement A worldwide effort has gone into the tensile tests to analyze the radiation-induced property change. The dependence of microstructure evolution and reduced ductility on neutron irradiation dose has been studied in details for nuclear related materials. The studies under high neutron fluences, 0.1-100 dpa or 1020-1023 n/cm2, are designated for nuclear reactor materials (Zinkle et al. 1993, Rybin et al. 1998, Kohno et al. 1999, Meslin et al. 2010), thus are out of the scope for this report. Only the experiments under low-dose neutron radiation, <10–2 dpa or <1018 n/cm2, are briefly reviewed here. The embrittlement has been quantified through (a) the yield stress increase and (b) the shift in ductile-brittle transition temperature (Odette and Lucas 2001, Brissonneau et al. 2004). These

31
parameters are usually measured as a function of neutron fluence (n/cm2). However, the variation in spectra is quite extreme for neutron radiation, from thermal neutrons (0.025 eV) to fast neutrons (>1 MeV), thus the use of neutron fluence without the knowledge of the spectral distribution can only partially describe the accumulated radiation damage. A unit, dpa (displacement per atom), is thus developed to take into account the neutron fluence, the spectral shape and some measure of the response of the material. It is a spectrum-sensitive index for radiation exposure, which can also be deemed as a measurement of potential to create point defects during radiation damage. This unit has been developed so that the comparison between various irradiation experiments could be made. A series of fast neutron (>1 MeV) irradiation tests have been performed at RTNS-II and OWR, USA. For pressure vessel steels (A302B and A212B) test at room temperature, an initiation of offset yield stress change was observed at > 10–5 dpa, or neutron fluence > 1016 n/cm2, as illustrated in Figure 7 and Figure 8 (Heinisch 1991). And for stainless steel (AISI 316) at 90 °C, a similar onset valve of 10–4 dpa for measurable damage was obtained (Heinisch et al. 1986). In another study, the yield stress was reported to change with a fluence 3.9×10¹⁶ n/cm2 (Murty 1999) which is also in line with the results by Heinisch.
Figure 7. Change in 0.2% offset yield stress of A302B and A212B pressure vessel steels as a function of fast neutron fluence (Heinisch 1991)
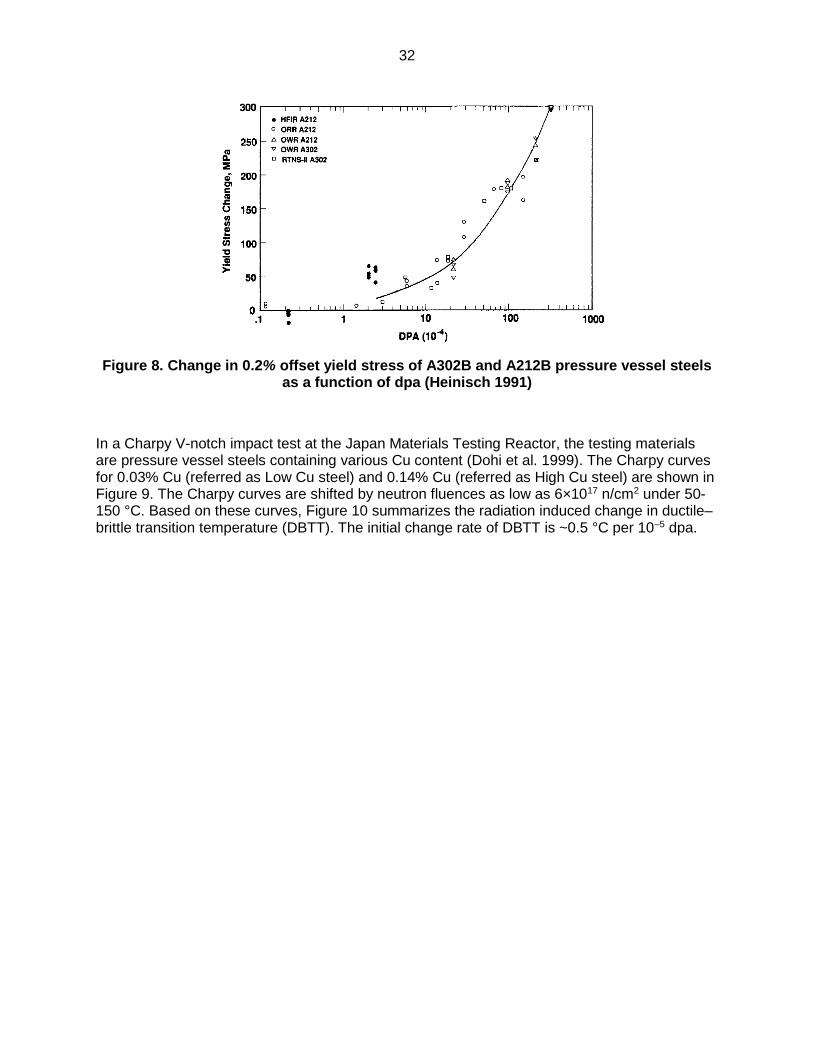
32
Figure 8. Change in 0.2% offset yield stress of A302B and A212B pressure vessel steels as a function of dpa (Heinisch 1991)
In a Charpy V-notch impact test at the Japan Materials Testing Reactor, the testing materials are pressure vessel steels containing various Cu content (Dohi et al. 1999). The Charpy curves for 0.03% Cu (referred as Low Cu steel) and 0.14% Cu (referred as High Cu steel) are shown in Figure 9. The Charpy curves are shifted by neutron fluences as low as 6×10¹⁷ n/cm2 under 50-150 °C. Based on these curves, Figure 10 summarizes the radiation induced change in ductile–brittle transition temperature (DBTT). The initial change rate of DBTT is ~0.5 °C per 10–5 dpa.

33
Figure 9. The Charpy V-notch impact test results of the miniature Charpy specimens unirradiated and irradiated with various neutron fluences and fluxes (Dohi et al. 1999)
Figure 10. Comparison of the increase in Charpy transition temperature estimated from
the miniature Charpy specimen with literature data as a function of fast neutron dpa (Dohi et al. 1999)

34
For high-purity iron single crystal irradiated with 14 MeV neutrons at room temperature to 60 °C, the fluence dependence of the yield stress is plotted in Figure 11. The irradiation hardening (evaluated from the stress level at 0.2% tensile strain) was found to increase rapidly by 10 MPa above a fluence of 4×10¹⁵ n/cm2 at 60 °C (Aono et al. 1988). For comparison, the initial hardening of polycrystalline iron was observed to occur with a neutron fluence > 1017 n/cm2 at room temperature (Kinoshita et al. 1986).
Figure 11. Fluence dependence of yield stress and activation area for 14 MeV neutron
irradiated iron (Aono et al. 1988).
For the stainless steel test, the change of yield stress as a function of fluence is plotted in Figure 12 (Kinoshita et al. 1986). Two sample (JFMS and JPCA) were tested. The sample JFMS (symbol: empty circles) with Cr(9.8%) and Ni(0.9%) shows that hardening effect starts from 5×10¹⁶ n/cm2 under 14 MeV neutron irradiation, or ~10–4 dpa. The sample JPCA (empty squares) with 15.3%Cr and 15.8%Ni exhibits softening in the low fluence region.
Figure 12. The relation between the increase of the yield stress and the neutron fluence
in wider fluence region (Kinoshita et al. 1986).

35
In summary, the neutron fluence threshold of detectable change is conservatively 1016 n/cm2 or 10–5 dpa. Similarly, in an SKB report (SKB 1999) page 80 it has been concluded that a neutron fluence less than 1017 n/cm2 would cause insignificant change in mechanical properties, based on studies by Porter (1960).
3.6.2 Neutron fluence on interior UFC The primary neutron sources for CANDU fuel bundles are tabulated in Appendix A.3 and categorized as spontaneous fission of radioisotopes and alpha-n neutron. These sources include actinides, fission products, and light element impurities within used fuel. The total activity of all radioactive sources in used fuel bundles falls as the source ages despite the trend of individual isotopes, as shown in Figure 13.
Figure 13. Evolution of neutron radiation for CANDU Fuel at 320 MWh/kgU burnup.
The neutron fluence on the interior surface of UFC can be calculated as a function of disposal time, Table 4, assuming the minimum cooling time before the starting point of DGR is 10 years for conservative estimation. The screening-level calculation of neutron flux/fluence assumes no self-shielding effect from the fuel matrix, the cladding, the basket and the gas in between. The model assumes that radiation comes from a point source representing all the fuel bundles within the container. Based on these approximations, this model is very conservative and the calculation results can be considered an upper limit for the radiation anticipated for UFC. The values at the highest burnup (320 MWh/kgU) are used in the calculation for a worst-scenario prediction.

36
Table 4. Total neutron fluence on UFC at burnup of 320 MWh/kgU
Neutron fluence
10 Years
50 Years
100 Years
200 Years
500 Years
1000 Years
104 Years
105 Years
106 Years
n/cm2 0 9.0E+
11 1.3E+
12 1.7E+
12 2.6E+
12 4.0E+
12 2.5E+
13 1.2E+
14 4.2E+
14
dpa 0 1.3E-
09 1.9E-
09 2.5E-
09 4.0E-
09 6.05E
-09 3.8E-
08 1.9E-
07 6.2E-
07
Emean 2.34 2.38 2.41 2.41 2.40 2.39 2.38 2.34 2.35
For comparison, the literature results of the radiation fluence on UFC are summarized in Table 5. The study of the embrittlement of C-steel waste storage tanks at Savannah River Site (South Carolina, USA) estimated the highest level of radiation damage to be less than 10–6 dpa for 100 years. And the effect of irradiation damage on bulk property values was considered negligible (Caskey et al. 1993). In the case of Swedish nuclear waste, the maximum damage for iron at 100,000 years is estimated on the order of 10–7 dpa, which is at least one order of magnitude less than the value required to cause measurable changes (Guinan 2001). The study by CEA calculated the radiation damage to be the order of 10–7 dpa after 300 years (Brissonneau et al. 2004). An SKB report (Sandberg and Korzhavyi 2009) followed the CEA model and reported a value of damage similar to that by Guinan. An IAEA report discussed a threshold beyond which the radiation effect becomes significant for stainless steels. And the suggested threshold (10 dpa) is 6-7 orders of magnitude higher than the anticipated damage in the case of waste storage (IAEA 2002). The calculation result in this study is in a good agreement with literatures, especially the long-term results. For 100,000 years, the accumulated damage is calculated to be 1.86×10⁻⁷ dpa in this study, consistent with 9.5×10⁻⁷ dpa in SKB report (Guinan 2001) considering the much higher burnup of PWR fuel (1200 vs. 320 MWh/kgU for CANDU fuel) and other uncertainties. The short-term calculation in this study may not reflect the total damage, since it only takes into account the neutron contribution, whereas gamma radiation is dominant (~80%) during the first hundred years. Therefore, the short-term neutron results are expected to be around one order of magnitude lower than the total radiation damage.
Table 5. Comparison with literature results
Organization and Country
Reactor type and burnup
Time (year)
Total radiation damage (dpa)
SRS, USA (Caskey et al. 1993)
Mixed high-level waste
100 10-11 – 10-7
SKB, Sweden (Guinan 2001)
PWR (1200 MWh/kgU)
100,000 9.5 × 10⁻⁷
BWR (~1000 MWh/kgU)
100,000 7.3 × 10⁻⁷
CEA, France (Brissonneau et al. 2004)
PWR (800 MWh/kgU)
300 ~10-7

37
The upper limit for the neutron damage on container during 106 years is calculated to 4×10¹⁴ n/cm2 or 6×10⁻⁷ dpa for Mark II. This value is at least 1-2 orders of magnitude lower than the threshold of detectable property change, and 6-7 orders of magnitude lower than threshold of significant radiation embrittlement. Integrating the experimental results in literature and the calculation based on NWMO’s design, we are able to conclude that the mechanical property change of the container material (e.g., reduced ductility, yield stress, hardening/embrittlement) due to spent fuel radiation accumulated during the service life will be negligible.

38
4. ONGOING AND FUTURE INVESTIGATION
The following experimental/modelling investigations are either currently underway or recommended for future work.
Extensive experimental tests have been carried out regarding crevice corrosion within the gap between steel vessel and hemispheric heads. In these experiments the welded sample (a fraction of the circumference) was placed in gamma radiation source at different temperatures. The crevice region was wetted with droplet containing appropriate electrolyte. The corrosion degradation can be observed from the cross section of the crevice (SEM/EDX). The corrosion products can be analyzed using ex-situ techniques (XPS, Raman, FIB, TEM etc.). Results of this work have been published. (D. Guo 2018). Electrochemical experiments of aqueous crevice corrosion were also performed in presence and absence of radiation.
To measure the strain, an accelerated corrosion test is recommended. The crevice sample can be wetted by appropriate electrolyte (e.g. containing NO3
–) and applied with an anodic potential to promote the corrosion process. Strain gauges can be placed on suspicious parts to monitor the stress distribution, especially the regions around welds.
To clarify the evolution of internal humidity and the radiolysis effect within UFC, a series of radiation experiments are currently underway. Since the humidity is dependent on several factors including radiolysis process, corrosion reaction and water droplet formation, the test of each process are performed within a work package of radiation experiments.
The radiation effect differs largely in vapour phase and in aqueous phase. Thus the water droplet formation needs to be monitored at different level of humidity under radiation. Experimental parameters include temperature, initial humidity, air composition (N2, O2, CO2 and Ar), C-steel surface geometry (wedge, flat), and surface roughness can be studied. The gas composition will be analyzed for NOx, H2, O2 and CO2 using gas chromatography. This test will provide insight on the internal environment evolution.
In regard to the possible effects of hydrogen (especially hydrogen induced cracking), a literature research program is suggested to review the diffusion process of hydrogen through copper. The validation of the weld metallurgy is also suggested to eliminate the possibility of HIC in the weld region. If copper can perform as a barrier to hydrogen under the appropriate pressure, the only source of hydrogen for inner steel vessel would be the internal radiolysis H2 which has been proved to be insufficient to cause notable damage. There is an ongoing program determining the mechanism(s) of hydrogen entry into the metal; the rates, amounts, and efficiency of hydrogen uptake by Cu under various chemical and radiolytic conditions; the location and movement of hydrogen within the steel or Cu; and the locations, amounts and effects of recombination to form hydrogen molecules. The amount of H uptake consequent to water reduction on Cu will be determined using Devanathan-Stachurski cell methods and in situ neutron reflectometry.

39
5. CONCLUSIONS
This report provides an overview of the internal corrosion processes and a screening-level assessment of the interior UFC, based on the new reference design of NWMO. The potential internal corrosion modes are examined, including general corrosion due to trapped oxygen and water, localized corrosion including pitting and crevice formation, stress-corrosion cracking (SCC), corrosion at or near welding regions, radiation embrittlement, and possible effects of hydrogen. An emphasis is placed on the question of whether to fill UFCs with an inert gas when they are sealed closed. The assessment was conducted using a flowchart diagram showing the causal relationship of each process. The analyses were based on past literatures and theoretical calculations. The following conclusions and suggestions have been made.
The material loss due to general corrosion damage has been calculated based on the trapped oxidants (oxygen, water, radiolysis species, and iodine) and the surface area of C-steel components. The general corrosion is concluded to be negligible to affect the container integrity.
One key question concerned the formation of condensed water film on C-steel surface, since this would determine whether the most severe processes could occur, such as localized corrosion and nitric acid formation. Some uncertainty exists on the quantities of liquid water brought in by defective pencil tubes.
The possibility of pitting corrosion was evaluated to be low based on the inner-UFC environment. If occurred, the pitting corrosion depth was estimated using empirical pitting factors and was concluded to be unlikely to cause notable damage.
Crevice corrosion of C-steel was investigated in different exposure environments, in aerated and deaerated solutions, at 21 °C and 80 °C, and with and without γ-radiation present. The extent of corrosion on the bold surface of a C-steel crevice coupon was more severe at 80 °C than at 21 °C, in aerated rather than deaerated solutions, and with γ-radiation present. The crevice surface showed minimal corrosion under all studied conditions, exhibiting inverse crevice corrosion behavior. The coupling current measured between a crevice and a bold electrode in an electrochemical cell was also negative, i.e., the opposite direction to that seen in normal crevice corrosion.
The possibility of SCC induced by nitric acid is low. The susceptible time period was refined to the first few years after encapsulation (O2 supply). The maximum quantity of nitric acid produced within UFC has been estimated using a humid-air radiolysis model (HARM). In this work the decrease in the dose rate over time and its effect on HNO3 accumulated concentration have been also taken into account. It has been shown that even with sufficient humid air/water the total quantities of nitric acid would not exceed the threshold for SCC after 20 years (1 mM).
The stresses on interior container and welding region have been examined. Highly localized tensile stresses were found, although the values were below, yet close to the threshold to cause SCC. Further investigations were suggested to assess the SCC likelihood. One uncertainty was the tensile stress of welds under the repository loading, which could be solved by mechanical simulation and measurements.
The risk of hydrogen induced cracking was considered low based on literature studies and bounding calculation.

40
The radiation embrittlement effect was studied for the interior surface. The main literature results on the threshold neutron influence were highlighted. A conservative calculation for the NWMO’s case has been carried out based on CANDU fuel and reference design. It has been concluded that the effect of reduced ductility was negligible to affect the service life.
ACKNOWLEDGEMENTS
The authors thank Mr. Chris Boyle for the help in conceptual drawing of UFC, stress analysis and corrosion calculation, and Dr. Peter Maak for the helpful discussions in the welding region assessment.

41
REFERENCES
ANDRA. 2005. Dossier 2005 Argile: Architecture and Management of a Geological
Repository. ANDRA Report C.RP.ADP.04.0001. Châtenay-Malabry, France.
Anttila, M. 1996. Gamma and Neutron Dose Rates on the Outer Surface of the Nuclear Waste Disposal Canisters. Posiva Oy Report POSIVA-96-10. Helsinki, Finland.
Aono, Y., E. Kuramoto and N. Yoshida. 1988. The effect of 14 MeV neutron irradiation on the mechanical properties of high-purity iron and molybdenum single crystals. Journal of Nuclear Materials, 155–157, 1164–1168.
ASM. 1987. Corrosion of carbon steels. Metals Handbook, vol. 13, p. 509–530, American Society for Metals International Metals Park, Ohio.
Barner, J.O., M.E. Cunningham, M.D. Freshley and D.D. Lanning. 1993a. Evaluation of Fission Gas Release in High-Burnup Light Water Reactor Fuel Rods. Nuclear Technology, 102, 210–231.
Barner, J.O., M.E. Cunningham, M.D. Freshley and D.D. Lanning. 1993b. Evaluation of fission gas release in high-burnup light water reactor fuel rods. Nuclear Technology, 102, 210–231.
Beavers, J.A., N.G. Thompson and R.N. Parkins. 1987. Stress-Corrosion Cracking of Low-Strength Carbon Steels in Candidate High-Level Waste Repository Environments. Battelle Columbus Div., Nuclear Regulatory Commission Report NUREG/CR-3861. United States.
Behrens, D. 1990. Corrosion Handbook: Corrosive Agents and Their Interaction with Materials. p. 356, DECHEMA.
Blackwood, D.J., J. Henshaw, N. Platts and J.P. Hilditch. 1995. Stress Corrosion Cracking of the Advanced Cold Process Canister: Carbon Steel in Nitric Acid Vapour. Svensk Kärnbränslehantering AB Report SKB PR 96-05. Stockholm, Sweden.
Blackwood, D.J., A.R. Hoch, C.C. Naish and A. Rance. 1994. Research on Corrosion Aspects of the Advanced Cold Process Canister. Svensk Kärnbränslehantering AB Report Technical Report SKB TR-94-12. Stockholm, Sweden.
Bowyer, W.H. 1999. Design Basis for the Copper/Steel Canister: Stage Five Final Report. Swedish Nuclear Power Inspectorate Report SKI 99-28. Sweden.
Boyle, C. 2012. Used Fuel Container Internal Corrosion: Air vs. Inert Gas Environment. Nuclear Waste Management Organization Report Calculation APM-CALC-04310. Toronto, Canada.
Brissonneau, L., A. Barbu and J.L. Bocquet. 2004. Radiation effects on the long term ageing of spent fuel storage containers. RAMTRANS (Packaging, Transport, Storage, and Security of Radioactive Material), 15, 121–130.

42
Burt, D., J. Ganeshalingam and F. King. 2013. Impact of Water Carry over on the Extent of Structural Damage and Pressurisation on a Variant 2 Standardised AGR Fuel Container. NDA RWMD Report Technical Report 17697/TR/04. Harwell Oxford, UK.
Cáceres, L., T. Vargas and L. Herrera. 2009. Influence of pitting and iron oxide formation during corrosion of carbon steel in unbuffered NaCl solutions. Corrosion Science, 51, 971–978.
Caskey, G.R.J., R.L. Sindelar and J.K. Thomas. 1993. Potential for Radiation Damage to Carbon Steel Storage Tanks for High Level Radioactive Waste. Westinghouse Savannah River Co. Report WSRC-MS-93-300. Aiken, SC.
Cheng, Y.F. and J.L. Luo. 1999a. Electronic structure and pitting susceptibility of passive film on carbon steel. Electrochimica Acta, 44, 2947–2957.
Cheng, Y.F. and J.L. Luo. 1999b. Passivity and pitting of carbon steel in chromate solutions. Electrochimica Acta, 44, 4795–4804.
Cheng, Y.F. and J.L. Luo. 2000. A comparison of the pitting susceptibility and semiconducting properties of the passive films on carbon steel in chromate and bicarbonate solutions. Applied Surface Science, 167, 113–121.
Christensen, H. and S. Sunder. 2000. Current State of Knowledge of Water Radiolysis Effects on Spent Nuclear Fuel Corrosion. Nuclear Technology, 131, 102–123.
Closs, K.-D. and R. Papp. 1998. Fifteen Years of Research and Development on Direct Disposal in Germany: An Overview. Nuclear Technology, 121, 101–113.
Cragnolino, G.A., S. Mohanty, D.S. Dunn, N. Sridhar and T.M. Ahn. 2000. An approach to the assessment of high-level radioactive waste containment. I: Waste package degradation. Nuclear Engineering and Design, 201, 289–306.
Debruyn, W. 1990. Corrosion of Container Materials under Clay Repository Conditions. Atomic Energy of Canada Limited Report AECL-10121. Winnipeg, MB, Canada.
Debruyn, W., J. Dresselaers, P. Vermeiren, J. Kelchtermans and H. Tas. 1991. Corrosion of Container and Infrastructure Materials under Clay Repository Conditions. Commission of the European Communities Report EUR-13667.
Dikii, I.I., I.I. Vasilenko, S.I. Mikitishin and A.Y. Shul’te. 1972. Corrosion cracking of low-carbon steel in nitrate solutions. Soviet Materials Science, 8, 48–52.
Dohi, K. et al. 1999. Effect of neutron flux on low temperature irradiation embrittlement of reactor pressure vessel steel. Journal of Nuclear Materials, 265, 78–90.
Dunn, D.S., G.A. Cragnolino and N. Sridhar. 1996. Localized Corrosion Initiation, Propagation, and Repassivation of Corrosion Resistant High-Level Nuclear Waste Container Materials., vol. 97, NACE International Houston, TX, USA.
43
Dunn, D.S., G.A. Cragnolino and N. Sridhar. 2000. An Electrochemical Approach to Predicting Long-Term Localized Corrosion of Corrosion-Resistant High-Level Waste Container Materials. Corrosion, 56, 90–104.
Ershov, B.G. and A.V. Gordeev. 2008. A model for radiolysis of water and aqueous solutions of H2, H2O2 and O2. Radiation Physics and Chemistry, 77, 928–935.
Farrell, K., S.T. Mahmood, R.E. Stoller and L.K. Mansur. 1994. An evaluation of low temperature radiation embrittlement mechanisms in ferritic alloys. Journal of Nuclear Materials, 210, 268–281.
Féron, D., D. Crusset and J.-M. Gras. 2008. Corrosion issues in nuclear waste disposal. Journal of Nuclear Materials, 379, 16–23.
Féron, D. and D.D. Macdonald. 2002. Prediction of Long Term Corrosion Behaviour in Nuclear Waste Systems. Proceedings of an International Workshop, Cadarache, France, 2002. EFC., vol. 36, p. 91, Materials Research Society London, UK.
Frost, C.R., S.J. Naqvi and K.M. Wasywich. 1994. Current Interim Used Fuel Storage Practice in Canada. Ontario Hydro Report Nuclear Waste & Environment Services Division Report N-03710-940052. Toronto, Canada.
Garisto, F. 2017. Sixth Case Study: Features, Events and Processes. Nuclear Waste Management Organization Report Technical Report TR-2017-08. Toronto, Canada.
Guinan, M.W. 2001. Radiation Effects in Spent Nuclear Fuel Canisters. Svensk Kärnbränslehantering AB Report Technical Report SKB TR-01-32. Stockholm, Sweden.
Haijtink, B. 1985. Corrosion Behaviour of Container Materials for Geological Disposal of High-Level Waste. Commission of the European Communities Report Annual Progress Report EUR 9570.
Heinisch, H.L. 1991. Correlation of mechanical property changes in neutron-irradiated pressure vessel steels on the basis of spectral effects. Journal of Nuclear Materials, 178, 19–26.
Heinisch, H.L., S.D. Atkin and C. Martinez. 1986. Spectral effects in low-dose fission and fusion neutron irradiated metals and alloys. Journal of Nuclear Materials, 141–143, 807–815.
Henshaw, J. 1994. Modelling of Nitric Acid Production in the Advanced Cold Process Canister Due to Irradiation of Moist Air. Svensk Kärnbränslehantering AB Report Technical Report SKB-TR-94-15. Stockholm, Sweden.
Henshaw, J., A. Hoch and S.M. Sharland. 1990. Further Assessment Studies of the Advanced Cold Process Canister. AEA Decommissioning and Radwaste Report AEA-D&R-0060. United Kingdom.
Hilbert, L.R. 2006. Monitoring corrosion rates and localised corrosion in low conductivity water. Corrosion Science, 48, 3907–3923.

44
Hoch, A.R. and S.M. Sharland. 1993. Assessment Study of the Stresses Induced by Corrosion in the Advanced Cold Process Canister. Svensk Kärnbränslehantering AB Report Technical Report SKB TR 94-13. Stockholm, Sweden.
IAEA. 2002. Effects of Radiation and Environmental Factors on the Durability of Materials in Spent Fuel Storage and Disposal. International Atomic Energy Agency Report IAEA-TECDOC-1316. Vienna, Austria.
JNC. 2000a. H12: Project to Establish the Scientific and Technical Basis for HLW Disposal in Japan, Japan Nuclear Cycle Development Institute. Project Overview Report. Japan Nuclear Cycle Development Institute Report JNC-TN1410-2000-001. Japan.
JNC. 2000b. H12: Project to Establish the Scientific and Technical Basis for HLW Disposal in Japan, Supporting Report 2: Repository Design and Engineering Technology. Japan Nuclear Cycle Development Institute Report JNC-TN1410 2000-003. Japan.
Jobe, D.J., R.J. Lemire and P. Taylor. 1997. Iron Oxide Redox Chemistry and Nuclear Fuel Disposal. Atomic Energy of Canada Limited Report AECL-11667, COG-96-487-I. Pinawa, Manitoba, Canada.
Johnson, L.H. et al. 1994. The Disposal of Canada’s Nuclear Fuel Waste: The Vault Model for Postclosure Assessment. Atomic Energy of Canada Limited Report AECL-10714, COG-93-4. Pinawa, Manitoba, Canada.
Johnson, L.H. and F. King. 2003. Canister Options for the Disposal of Spent Fuel. National Cooperative for the Disposal of Radioactive Waste Report Technical Report NTR 02-11. Wettingen, Switzerland.
Johnson, L.H. and D.W. Shoesmith. 1988. Spent Fuel. Radioactive Waste Forms For The Future, p. 635–698, Elsevier Science Amsterdam, Netherlands.
Johnson, L.H. and J.C. Tait. 1997. Release of Segregated Nuclides from Spent Fuel. Svensk Kärnbränslehantering AB Report Technical Report SKB TR 97-18. Stockholm, Sweden.
Jones, A.R. 1959. Radiation-Induced Reactions in the N2-O2-H2O system. Radiation Research, 10, 655–663.
Joseph, J.M., B. Seon Choi, P. Yakabuskie and J.C. Wren. 2008. A combined experimental and model analysis on the effect of pH and O2(aq) on γ-radiolytically produced H2 and H2O2. Radiation Physics and Chemistry, 77, 1009–1020.
King, F. 2007. Overview of a Carbon Steel Container Corrosion Model for a Deep Geological Repository in Sedimentary Rock. Nuclear Waste Management Organization Report Technical Report NWMO TR-2007-01. Toronto, Canada.
King, F. 2009. Hydrogen Effects on Carbon Steel Used Fuel Containers. Nuclear Waste Management Organization Report Technical Report NWMO TR-2010-21. Toronto, Canada.
King, F. 2010. Stress Corrosion Cracking of Carbon Steel Used Fuel Containers in a Canadian Deep Geological Repository in Sedimentary Rock.

45
King, F., L. Ahonen, U. Vuorinen and L.O. Werme. 2001. Copper Corrosion under Expected Conditions in a Deep Geologic Repository. Svensk Kärnbränslehantering AB Report Technical Report SKB TR-01-23. Stockholm, Sweden.
King, F. and M. Kolar. 2009. Theory Manual for the Steel Corrosion Model Version 1.0. Nuclear Waste Management Organization Report Technical Report NWMO TR-2009-07. Toronto, Canada.
King, F. and M. Kolar. 2012. Simulation of the Anaerobic Corrosion of Carbon Steel Used Fuel Containers Using the Steel Corrosion Model Version 1.0 (SCM V1.0). Nuclear Waste Management Organization Report Technical Report NWMO TR-2012-07. Toronto, Canada.
King, F., C. Lilja, K. Pedersen, P. Pitkänen and M. Vähänen. 2010. An Update of the State-of-the-Art Report on the Corrosion of Copper under Expected Conditions in a Deep Geologic Repository. Svensk Kärnbränslehantering AB Report Technical Report SKB TR-10-67. Stockholm, Sweden.
King, F. and S. Watson. 2010. Review of the Corrosion Performance of Selected Metals as Canister Materials for UK Spent Fuel and/or HLW. Quintessa Ltd Report QRS-1384J-1. Oxfordshire, UK.
Kinoshita, T., Y. Aono, E. Kuramoto and K. Abe. 1986. The effect of 14 MeV neutron irradiation on the mechanical properties of fe and stainless steels. Journal of Nuclear Materials, 141–143, 893–898.
Kohno, Y., A. Kohyama, T. Hirose, M.L. Hamilton and M. Narui. 1999. Mechanical property changes of low activation ferritic/martensitic steels after neutron irradiation. Journal of Nuclear Materials, 271–272, 145–150.
Koizumi, S., H. Umehara and Y. Wakashima. 1991. Study on fission gas release from high burnup fuel. Fuel Performance at High Burnup for Water Reactors, p. 102–109, Studsyik Vienna, Austria.
Kukkola, T. 2002. Encapsulation Plant Description - Independent Facility. Posiva Oy Report Working Report WR 2002-03. Olkiluoto, Finland.
Leygraf, C. 1995. Atmospheric Corrosion. Corrosion Mechanisms in Theory and Practice, vol. 8, p. 421–455, Marcel Decker New York, United States.
Lloyd, J.A., P.G. Eller and L. Hyder. 1998. Literature Search on Hydrogen/Oxygen Recombination and Generation in Plutonium Storage Environments. Los Alamos National Laboratory Report Literature Search LA-UR-98-4557. Los Alamos, NM.
Long, L.M. and H.H. Uhlig. 1965. Effect of Carbon and Oxygen in Iron on Stress Corrosion Cracking in Nitrate Solution. Journal of The Electrochemical Society, 112, 964.
Marsh, G.P. et al. 1983. Corrosion assessment of metal overpacks for radioactive waste disposal - European Applied Research Reports. Nuclear Science and Technology, 5, 223.
46
Marsh, G.P. 1990. A Preliminary Assessment of the Advanced Cold Process Canister. AEA Industrial Technology Report AEA-InTec-0011. Harwell Laboratory, UK.
Marsh, G.P., I.D. Bland, K.J. Taylor, S. Sharland and P. Tasker. 1986. An Assessment of Carbon Steel Overpacks for Radioactive Waste Disposal. Commission of the European Communities Report EUR-10437. Didcot, U.K.
Marsh, G.P., A.H. Harker and K.J. Taylor. 1989. Corrosion of Carbon Steel Nuclear Waste Containers in Marine Sediment. CORROSION, 45, 579–589.
Marsh, G.P. and K.J. Taylor. 1988. An assessment of carbon steel containers for radioactive waste disposal. Corrosion Science, 28, 289–320.
McCafferty, E. 1989. Thermodynamic aspects of the crevice corrosion of iron in chromate/chloride solutions. Corrosion Science, 29, 391–401.
McMurry, J. et al. 2003. Evolution of a Canadian Deep Geologic Repository: Base Scenario. Ontario Power Generation Report 06819-REP-01200-10092-R00. Toronto, Canada.
Medri, C. 2016. Mark II Used Fuel Container Internal and External Surface Dose Rates. Nuclear Waste Management Organization Report Calculation APM-CALC-26200-0201-R000. Toronto, Canada.
Medri, C., P. Liberda and N. Hunt. 2012. IV-25 and 4L012 Used Fuel Container Shielding Scoping Estimates. Nuclear Waste Management Organization Report Calculation APM-CALC-04330. Toronto, Canada.
Meslin, E. et al. 2010. Characterization of neutron-irradiated ferritic model alloys and a RPV steel from combined APT, SANS, TEM and PAS analyses. Journal of Nuclear Materials, 406, 73–83.
Miller, B. and N. Marcos. 2007. Process Report: FEPs and Scenarios for a Spent Fuel Repository at Olkiluoto. Posiva Oy Report POSIVA 2007-12. Olkiluoto, Finland.
Morco, R.P. et al. 2017a. Modelling of radiolytic production of HNO3 relevant to corrosion of a used fuel container in deep geologic repository environments. Corrosion Engineering, Science and Technology, 52, 141–147.
Morco, R.P. et al. 2017b. Modelling of radiolytic production of HNO3 relevant to corrosion of a used fuel container in deep geologic repository environments. Corrosion Engineering, Science and Technology, 52, 141–147.
Murty, K.L. 1999. Role and significance of source hardening in radiation embrittlement of iron and ferritic steels. Journal of Nuclear Materials, 270, 115–128.
Naito, M. et al. 1999. Study of Radiation Impact on near Field Performance of Geological Disposal System. Japan Nuclear Cycle Development Institute Report JNC TN1400 99-025. Japan.
NWMO. 2012. Implementing Adaptive Phased Management 2013 to 2017. Nuclear Waste Management Organization Report APM-REP-06411-29765. Toronto, Canada.

47
Odette, G.R. and G.E. Lucas. 2001. Embrittlement of nuclear reactor pressure vessels. Journal of Materials, 53, 18–22.
Okada, H. 1977. Stress corrosion cracking and hydrogen cracking of structural steels. Stress Corrosion Cracking and Hydrogen Embrittlement of Iron Base Alloys, vol. 126, p. 124–134, NACE International Houston, Texas. doi:10.1149/1.2129122.
OPG. 2011. Dry Storage Container Vacuum Drying and Helium Backfill - Darlington Waste Management Facility. Ontario Power Generation Report 00044-OP-75810-00001-R003. Darlington, Ontario.
Parkins, R.N. 1985. Stress Corrosion Cracking Tests on Electron Beam Welded Carbon Steel Specimens in Carbonate-Bicarbonate Solution. UKAEA Atomic Energy Research Establishment Report AERE-G-3583. United Kingdom.
Pastina, B. and J.A. LaVerne. 2001. Effect of Molecular Hydrogen on Hydrogen Peroxide in Water Radiolysis. The Journal of Physical Chemistry A, 105, 9316–9322.
Porter, L.F. 1960. Radiation effects in steel. Nuclear Materials Applications, p. 147–196, ASTM Special Technical Publication.
Raiko, H. 2012. Canister Design 2012. Posiva Oy Report POSIVA 2012-13. Eurajoki, Finland.
Reed, D.T., V. Swayambunathan, B.S. Tani and R.A.V. Konynenburg. 1990. Corrosion Product Identification and Relative Rates of Corrosion of Candidate Metals in an Irradiated Air-Steam Environment. Mat. Res. Soc. Symp. Proc., vol. 176, p. 517–524, Materials Research Society United States. doi:10.1557/PROC-176-517.
Renström, P. 1997. Calculation of the Fuel Temperature in Vacuous Storage Canisters Made of Copper with Cast Steel Inserts. Svensk Kärnbränslehantering AB Report SKB PPM 97-3420-23. Stockholm, Sweden.
Romanoff, M. 1989. Underground Corrosion. Underground Corrosion. Originally issued by NBS in 1957, Reprinted by NACE Report ENT000391. Houston, Texas.
Ruiping Guo. 2015. Thermal Modelling of a Mark II Container. Report NWMO-TR-2015-06.
Rybin, V.V., I.P. Kursevich and A.N. Lapin. 1998. Effect of neutron irradiation at low temperature on the embrittlement of the reduced-activation ferritic steels. Journal of Nuclear Materials, 258–263, 1324–1328.
Sandberg, N. and P. Korzhavyi. 2009. Theoretical Study of Irradiation Induced Hardening and Embrittlement in Spent Nuclear Fuel Holders, Relevant for the Swedish Long-Term Storage. Svensk Kärnbränslehantering AB Report SKB R-09-15. Stockholm, Sweden.
Scully, J.R. and M. Edwards. 2013. Review of the NWMO Copper Corrosion Allowance. Nuclear Waste Management Organization Report Technical Report NWMO TR-2013-04. Toronto, Canada.
48
Shao, L.C. and J.J. Burns. 1980. Stress-corrosion cracking experience in piping of light water reactor power plants. Nuclear Engineering and Design, 57, 133–140.
Sharland, S.M. and P.W. Tasker. 1988. A mathematical model of crevice and pitting corrosion—I. The physical model. Corrosion Science, 28, 603–620.
Shoesmith, D.W. and F. King. 1999. The Effects of Gamma Radiation on the Corrosion of Candidate Materials for the Fabrication of Nuclear Waste Packages. Atomic Energy Canada Limited Report AECL-11999. Pinawa, Manitoba, Canada.
Shoesmith, D.W. and D. Zagidulin. 2010. The Corrosion of Zirconium Under Deep Geological Repository Conditions. Nuclear Waste Management Organization Report Technical Report TR-2010-19. Toronto, Canada.
SKB. 1999. SR 97. Processes in the Repository Evolution. Background Report to SR 97. Svensk Kärnbränslehantering AB Report Technical Report SKB TR-99-07. Stockholm, Sweden.
Smart, N.R., A.P. Rance and L.O. Werme. 2008. The effect of radiation on the anaerobic corrosion of steel. Journal of Nuclear Materials, 379, 97–104.
Somerday, B.P. 2007. Technical Reference on Hydrogen Compatibility of Materials. Carbon Steels: C-Mn Alloys (Code 1100). Sandia National Labortories Report Technical Reference code 1100. Livermore, CA.
Spinks, J.W.T. and R.J. Woods. 1990. An introduction to radiation chemistry. Third., p. 600, John Wiley & Sons, Inc. New York, United States.
Sridhar, N., G.A. Cragnolino and D.S. Dunn. 1993. Experimental Investigations of Localized Corrosion of High-Level Waste Container Materials. Center for Nuclear Waste Regulatory Analyses Report CNWRA 93-004. San Antonio, TX.
Sridhar, N., G.A. Cragnolino and D.S. Dunn. 1995. Experimental Investigations of Failure Processes of High-Level Radioactive Waste Container Materials. Center for Nuclear Waste Regulatory Analyses Report CNWRA 95-010. San Antonio, TX.
Sridhar, N., J.C. Walton, G.A. Cragnolino and P.K. Nair. 1993. Engineered Barrier Performance Assessment Codes (EBSPAC) Progress Report, October 1, 1992, through September 25, 1993. Center for Nuclear Waste Regulatory Analyses Report CNWRA 93-021. San Antonio, TX.
Steele, L.E. 1966. Radiation embrittlement of reactor pressure vessel steels. Nuclear Engineering and Design, 3, 287–298.
Tait, J.C., H. Roman and C.A. Morrison. 2000. Characteristics and Radionuclide Inventories of Used Fuel from OPG Nuclear Generating Stations. Volume 2 - Radionuclide Inventory Data. Ontario Power Generation Report OPG 06819-REP-01200-10029-R00 Vol. 2. Toronto, Canada.
49
Taniguchi, N., A. Honda and H. Ishikawa. 1998. Experimental Investigation of Passivation Behavior and Corrosion Rate of Carbon Steel in Compacted Bentonite. Mat. Res. Soc. Symp. Proc., vol. 506, Materials Research Society. doi:10.1557/PROC-506-495.
Taniguchi, N., A. Honda, M. Kawasaki and T. Tsuru. 1999. The assessment of corrosion type and corrosion rate of carbon steel in compacted bentonite. Japan Nuclear Cycle Development Institute Report JNC TN 8400 99-003. Japan.
Taylor, P. and D.G. Owen. 1993. Oxidation of Magnetite in Aerated Aqueous Media. Atomic Energy of Canada Limited Report AECL-10821, COG-93-81. Pinawa, Manitoba, Canada.
Taylor, P. and D.G. Owen. 1995. Reaction of Biotite with Aerated Aqueous Solutions: A Preliminary Report on the Effects of Temperature, PH and Biotite Composition. Atomic Energy of Canada Limited Report RC-1364, COG-I-95-022. Pinawa, Manitoba, Canada.
Turnbull, J. et al. 2017. The effects of cathodic reagent concentration and small solution volumes on the corrosion of copper in dilute nitric acid solutions. CORROSION, 74.
Uhlig, H.H. and E.W. Cook. 1969. Mechanism of Inhibiting Stress Corrosion Cracking of 18-8 Stainless Steel in MgCI2 by Acetates and Nitrates. Journal of the Electrochemical Society, 116, 173–177.
Uhlig, H.H. and J. Sava. 1963. The effect of heat treatment on stress corrosion cracking of iron and mild steel. American Society for Metals, 56, 361–376.
Vo, P. and S. Yue. 2012. Literature Review on UFC Steel Embrittlement Due to Copper Coating. Nuclear Waste Management Organization Report Technical Memorandum APM-TM-03220-29670. Toronto, Canada.
Walle, E. et al. 2001. Oxygen and iodine potentials and chemical reactions with the Zircaloy cladding material studied in view of long term storage of PWR spent fuel assemblies.
Werme, L. and C. Lilja. 2010. Fuel and Canister Process Report for the Safety Assessment SR-Site. Svensk Kärnbränslehantering AB Report Technical Report SKB TR-10-46. Stockholm, Sweden.
Wickham, S. 2008. Evolution of the Near-Field of the ONDRAF/NIRAS Repository Concept for Category B and C Wastes. ONDRAF/NIRAS Report Technical Report NIROND TR-2007-07 E. Belgium.
Wu, L. et al. 2017. Inverse Crevice Corrosion of Carbon Steel: Effect of Solution Volume to Surface Area. Journal of The Electrochemical Society, 164, C539–C553.
Yakabuskie, P.A., J.M. Joseph, C.R. Stuart and J.C. Wren. 2011. Long-Term γ-Radiolysis Kinetics of NO3− and NO2− Solutions. The Journal of Physical Chemistry A, 115, 4270–4278.

50
Zinkle, S.J., P.J. Maziasz and R.E. Stoller. 1993. Dose dependence of the microstructural evolution in neutron-irradiated austenitic stainless steel. Journal of Nuclear Materials, 206, 266–286.

51
APPENDIX A
CONTENTS
Page
A.1 GENERAL CORROSION DEPTH CALCULATION……………………………………….52 A.2 NITRIC ACID PRODUCTION………………………………………………………………..57 A.3 NEUTRON FLUENCE ON INTERIOR SURFACE OF UFC……………………………...58 A.4 GAMMA DOSE RATES INSIDE AND OUTSIDE UFC……………………………………62 A.5 INTERNAL PRESSURE EVOLUTION INSIDE A MARK II UFC…………………………64

52
GENERAL CORROSION DEPTH CALCULATION
Thus the maximum general corrosion damage due to moist air and its radiolysis products can be estimated using a simple mass balance approach. The calculation is based on the worst-case scenario assumptions:
For the calculation involving humidity, the partial pressure of water vapour is directly added on top of the atmospheric pressure of the dry air in order to be simple and conservative. The number of moles of O2 in dry air at 65 °C is assumed to be the same as that at 25 °C to be conservative.
A conservative surface area is used including only the inner vessel and the used fuel basket, which both are made of C-steel. Surface area of other internal modules (e.g. basket locator and lifting plate) is excluded.
All the trapped oxygen and water are assumed to be consumed uniformly on the C-steel component. To generate the maximum possible amount of corrosion, it is assumed that the oxygen and water molecules dissociate completely due to radiolysis or other hypothetical process, and all oxygen elements react with iron at a one-to-one ratio, i.e. all iron is assumed to be oxidized to iron(II) so that Fe:O=1:1.
𝐹𝑒 +1
2𝑂2 → 𝐹𝑒𝑂 (5)
𝐹𝑒 + 𝐻2𝑂 → 𝐹𝑒𝑂 + 𝐻2
(6)
A.1.1 Dimension calculation for Mark II 4L-12. Calculation results are after rounding.
Table 6. UFC net internal volume
Gross cavity volume 0.407 m3
Volume within middle steel vessel 0.338 m3
Length of vessel 1900 mm
Inner diameter of vessel 476.25 mm
Volume in one head 0.0343 m3
Inner diameter of hemisphere head 508 mm
Volume in two heads 0.0686 m3
Volume of modules 0.0344 m3
Mass of all supporting parts within cavity 270 kg
Mass per basket 250 kg
Mass per basket locator 10 kg
Mass per basket locator ×2 20 kg
Density of carbon steel 7850 kg/m3

53
Cavity volume in UFC containing the insert 0.374 m3
Volume of fuel bundles (37 element “long” bundle) 0.111 m3
# of bundles per container 48
Volume per bundle (Ellsworth 2005) 2.31E-03 m3
Net volume = Cavity volume in UFC containing the insert – Volume of fuel bundles
Net volume 0.263 m3
Table 7: Total surface area susceptible to general corrosion
Surface area of inner vessel 3.65 m2
Inner area of middle steel vessel 2.84 m2
Length of vessel 1900 mm
Inner diameter of vessel 476.25 mm
Inner area of one head 0.405 m2
Inner diameter of hemisphere head 508 mm
Inner area of two heads 0.811 m2
Surface area of fuel basket 22.29 m2
Area of basket outer shell (double sided) 5.83 m2
Length of basket (est.) 2072.7 mm
Diameter of basket 447.65 mm
Total area of C-steel bundle tubes 16.46 m2
# of C-steel bundle tubes 12 -
Surface area per tube 1.37 m2
Total area = Surface area of inner vessel + fuel basket
Total area 25.95 m2
A.1.2 Enclosed oxygen and water
The standard composition of dry air includes 20.95% of oxygen by volume (UIGI 2011a). The amount of trapped oxygen in container is calculated in Table 8.
Table 8: Oxygen gas content in Mark II UFC
Net Volume 0.262 m3
Oxygen volume ratio 0.2095 -
Oxygen volume 0.05489 m3
Moles of oxygen gas 2.214 mol

54
The water vapour contents in UFC at different scenarios are calculated according to (UIGI 2011b)
Table 9: Water vapour content
Temperatures (°C) Humidity Water content per
volume (g/m3)
25 100% 23.1
35 100% 39.70
45 100% 65.59
55 100% 104.52
65 100% 161.23
75 85% 238.9
In case of element (pencil tube) failure, water can enter through pinholes or other defects and fill the element. The amount of trapped water is calculated in Table 10. The dimensions listed are for unirradiated Bruce “A” bundles with plenum inserts.
Table 10: Maximum amount of water that can be trapped in fuel elements
Volume of UO2 pellets per element 54.26 cm3
Mass of UO2 per element 575.2 g
Average density of UO2 10.6 g/cm3
Sheath cavity volume 56.41 cm3
Average outside diameter 13.07 mm
Average wall thickness 0.419 mm
Length after welding 482.6 mm
Inside diameter (=13.07–0.419×2) 12.23 mm
End plug thickness 2.59 mm
Maximum volume of trapped water in one element 2.14 cm3
Maximum volume of trapped water in 18 element 38.5 cm3
A.1.3 Sample calculation
The following represents one complete corrosion calculation for the Mark II UFC sealed at 65 °C with 100% humidity. All calculation results shown are after rounding.

55
i) Internal Gas Volume Calculations
𝑁𝑒𝑡 𝑉𝑜𝑙𝑢𝑚𝑒: 𝐺𝑟𝑜𝑠𝑠 𝑐𝑎𝑣𝑖𝑡𝑦 𝑣𝑜𝑙𝑢𝑚𝑒 − 𝑉𝑜𝑙𝑢𝑚𝑒 𝑜𝑓 𝑚𝑜𝑑𝑢𝑙𝑒𝑠 − 𝑉𝑜𝑙𝑢𝑚𝑒 𝑜𝑓 𝑓𝑢𝑒𝑙 𝑏𝑢𝑛𝑑𝑙𝑒𝑠
= 0.407 𝑚3 – 0.0344 𝑚3– 0.111 𝑚3 = 0.262 𝑚3
ii) Total area for uniform corrosion
𝑇𝑜𝑡𝑎𝑙 𝑎𝑟𝑒𝑎: 𝑆𝑢𝑟𝑓𝑎𝑐𝑒 𝑎𝑟𝑒𝑎 𝑜𝑓 𝑖𝑛𝑛𝑒𝑟 𝑣𝑒𝑠𝑠𝑒𝑙 + 𝑓𝑢𝑒𝑙 𝑏𝑎𝑠𝑘𝑒𝑡
= 3.65 𝑚2 + 22.29 𝑚2 = 25.95 𝑚2
iii) Amount of Air in Container
Calculating the amount of air in container using the Ideal Gas Law:
𝑛𝑎𝑖𝑟 = 𝑃𝑉
𝑅𝑇 =
(100,000 𝑃𝑎)(0.262 𝑚3)
(8.314𝐽
𝑚𝑜𝑙𝐾) (298.15 𝐾)
= 10.57 𝑚𝑜𝑙 𝐴𝑖𝑟
iv) Amount of Oxygen in Container
Using Dalton’s Law of Partial Pressures the amount of oxygen can be calculated, assuming oxygen comprises 20.95% of air by volume:
𝑛𝑜𝑥𝑦𝑔𝑒𝑛 = 0.2095 𝑛𝑎𝑖𝑟 = 2.214 𝑚𝑜𝑙𝑒 𝑂2
The amount of oxygen gas per unit area of general corrosion is calculated as:
𝑛𝑜𝑥𝑦𝑔𝑒𝑛 𝑜𝑛 𝑢𝑛𝑖𝑡 𝑎𝑟𝑒𝑎 =𝑛𝑜𝑥𝑦𝑔𝑒𝑛
𝑆𝑖𝑛𝑛𝑒𝑟 𝑎𝑟𝑒𝑎=
2.214 𝑚𝑜𝑙 𝑂2
25.95 𝑚2= 0.08532
𝑚𝑜𝑙 𝑂2
𝑚2
The facility will be a controlled environment and therefore the environment is anticipated to be at a typical room temperature (i.e., 20 – 25 °C), near atmospheric pressure (i.e., 100 – 105 kPa), and within a comfortable humidity range (i.e., 25 – 60 %) at all times, therefore, the Mark II UFC will contain 2.0 – 2.6 mol O2 in the UFC at time of closure where the maximum corresponds to 110 kPA at 15 °C. v) Amount of Water in Container
Using Psychrometric data at standard atmosphere (~1 atm or 101.3kPa) for air at 65 °C, the amount of water per cubic metre of air at 100% humidity is 161.23 grams. This calculation applies to the scenario of 65 °C, 100% RH and no failed tubes.
𝑚𝑤𝑎𝑡𝑒𝑟 = (161.23𝑔
𝑚3) × (0.262 𝑚3) = 42.2 𝑔
𝑛𝑤𝑎𝑡𝑒𝑟 =𝑚𝑤𝑎𝑡𝑒𝑟
𝑀𝑤𝑎𝑡𝑒𝑟=
42.2 𝑔
18.02 𝑔/𝑚𝑜𝑙= 2.35 𝑚𝑜𝑙 𝑜𝑓 𝑤𝑎𝑡𝑒𝑟

56
𝑛𝑤𝑎𝑡𝑒𝑟 𝑜𝑛 𝑢𝑛𝑖𝑡 𝑎𝑟𝑒𝑎 = 𝑛𝑤𝑎𝑡𝑒𝑟
𝑆𝑖𝑛𝑛𝑒𝑟 𝑎𝑟𝑒𝑎 =
2.35 𝑚𝑜𝑙 𝐻2𝑂
25.95 𝑚2 = 0.0905
𝑚𝑜𝑙 𝐻2𝑂
𝑚2
vi) Uniform corrosion depth calculation
The amount of iron consumed at the total inner surface area is calculated from the stoichiometric ratio Fe:O = 1:1 in Equation (5) and (6).
𝑂𝑛 𝑖𝑛𝑛𝑒𝑟 𝑠𝑢𝑟𝑓𝑎𝑐𝑒 𝑎𝑟𝑒𝑎: 𝑛𝑖𝑟𝑜𝑛 = 2 × 𝑛𝑜𝑥𝑦𝑔𝑒𝑛 + 𝑛𝑤𝑎𝑡𝑒𝑟
= 2 × 0.08532 𝑚𝑜𝑙 𝑂2
𝑚2+ 0.0905
𝑚𝑜𝑙 𝐻2𝑂
𝑚2= 0.261
𝑚𝑜𝑙 𝐹𝑒
𝑚2
The depth of uniform mouth determined from the above results:
𝐷𝑒𝑝𝑡ℎ 𝑜𝑓 𝑢𝑛𝑖𝑓𝑜𝑟𝑚 𝑚𝑜𝑢𝑡ℎ: 𝑛𝑖𝑟𝑜𝑛 × 𝑀𝑀𝑖𝑟𝑜𝑛
𝐷𝑒𝑛𝑠𝑖𝑡𝑦𝑖𝑟𝑜𝑛
=0.261 𝑚𝑜𝑙/𝑚2 × 55.8 𝑔/𝑚𝑜𝑙
7850 𝑘𝑔/𝑚3 ×
1 𝑘𝑔
1000 𝑔= 1.86 𝜇𝑚

57
NITRIC ACID PRODUCTION
The maximum quantity of nitric acid produced within UFC has been estimated using a humid-air radiolysis model (HARM) where the decrease in the dose rate over time and how it affects HNO3 rate production and accumulated concentration have also been taken into account (Morco et al. 2017a). In this work, we used the dose rates for the first 500 y, where the DR decreases exponentially with time. This period is dominated mainly by the decay of the fission products in the fuel. The equations 1 and 2 were derived from the graph in Figures 1 and 2 respectively which were then combined give a new HNO3 rate (equation 3). Equation 3 was then solved by differential equation and the solution is shown in equation 5. 𝐷𝑅 ≈ 46.414 𝑒−0.021 ∙ 𝑡 (Eq. 1)
𝑑[HNO3(g)]t
𝑑𝑡≈ 2 × 10⁻¹⁰ ∙ 𝐷𝑅 + 3 × 10⁻¹¹ (Eq. 2)
𝑑[HNO3(g)]t
𝑑𝑡≈ 2 × 10⁻¹⁰ ∙ 46.414 𝑒−0.021 ∙ 𝑡 + 3 × 10⁻¹¹ (Eq. 3)
∫ 𝑑[HNO3(g)]t
𝑡
𝑡0
≈ ∫ 2 × 10⁻¹⁰ ∙ 46.414 𝑒−0.021 ∙ 𝑡 ∙ 𝑑𝑡𝑡
𝑡0
+ ∫ 3 × 10⁻¹¹ ∙ 𝑑𝑡𝑡
𝑡0
(Eq. 4)
[HNO3(g)]𝑡 ≈
2×10⁻¹⁰ ∙46.414 𝑒−0.021 ∙ 𝑡
−0.021 𝑒−0.021 ∙ 𝑡 −
2×10⁻¹⁰ ∙46.414 𝑒−0.021 ∙ 𝑡0
−0.021 𝑒−0.021 ∙ 𝑡0 + 3 × 10⁻¹¹ ∙ 𝑡 − 3 × 10⁻¹¹ ∙ 𝑡0 (Eq. 5)
The [HNO3(g)]t was later solved using MATLAB.
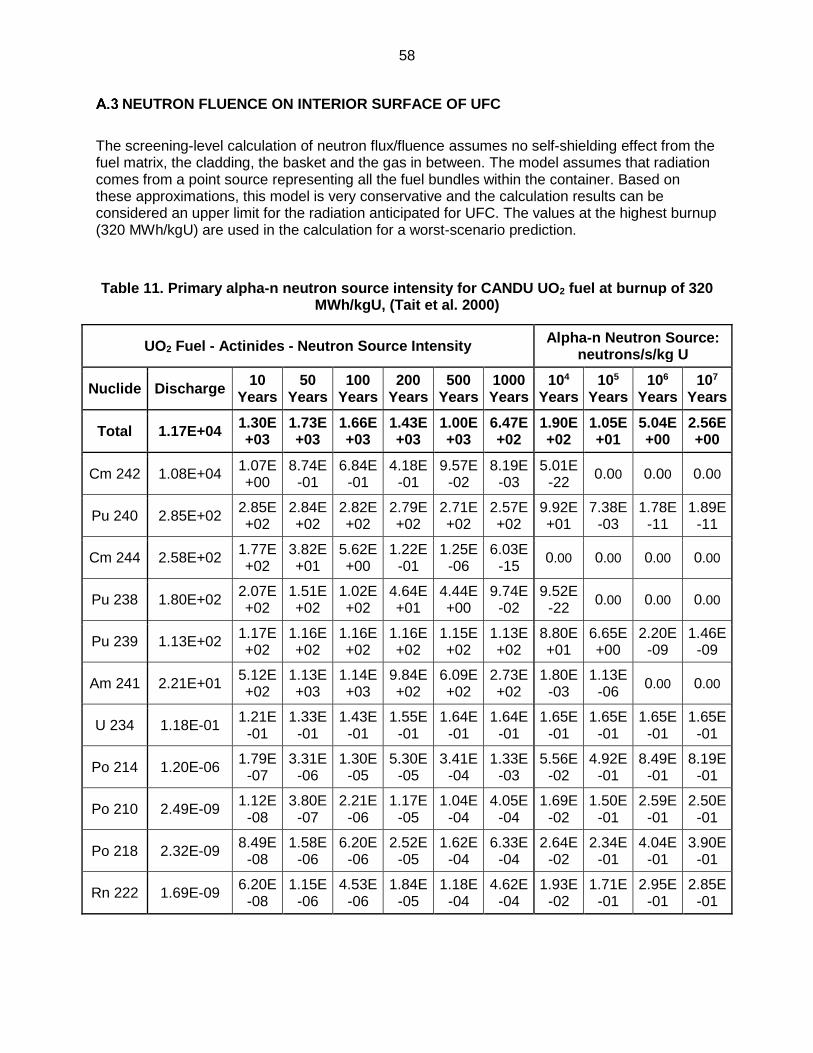
58
NEUTRON FLUENCE ON INTERIOR SURFACE OF UFC
The screening-level calculation of neutron flux/fluence assumes no self-shielding effect from the fuel matrix, the cladding, the basket and the gas in between. The model assumes that radiation comes from a point source representing all the fuel bundles within the container. Based on these approximations, this model is very conservative and the calculation results can be considered an upper limit for the radiation anticipated for UFC. The values at the highest burnup (320 MWh/kgU) are used in the calculation for a worst-scenario prediction.
Table 11. Primary alpha-n neutron source intensity for CANDU UO2 fuel at burnup of 320 MWh/kgU, (Tait et al. 2000)
UO2 Fuel - Actinides - Neutron Source Intensity Alpha-n Neutron Source:
neutrons/s/kg U
Nuclide Discharge 10
Years 50
Years 100
Years 200
Years 500
Years 1000 Years
104 Years
105 Years
106 Years
107 Years
Total 1.17E+04 1.30E+03
1.73E+03
1.66E+03
1.43E+03
1.00E+03
6.47E+02
1.90E+02
1.05E+01
5.04E+00
2.56E+00
Cm 242 1.08E+04 1.07E+00
8.74E-01
6.84E-01
4.18E-01
9.57E-02
8.19E-03
5.01E-22
0.00 0.00 0.00
Pu 240 2.85E+02 2.85E+02
2.84E+02
2.82E+02
2.79E+02
2.71E+02
2.57E+02
9.92E+01
7.38E-03
1.78E-11
1.89E-11
Cm 244 2.58E+02 1.77E+02
3.82E+01
5.62E+00
1.22E-01
1.25E-06
6.03E-15
0.00 0.00 0.00 0.00
Pu 238 1.80E+02 2.07E+02
1.51E+02
1.02E+02
4.64E+01
4.44E+00
9.74E-02
9.52E-22
0.00 0.00 0.00
Pu 239 1.13E+02 1.17E+02
1.16E+02
1.16E+02
1.16E+02
1.15E+02
1.13E+02
8.80E+01
6.65E+00
2.20E-09
1.46E-09
Am 241 2.21E+01 5.12E+02
1.13E+03
1.14E+03
9.84E+02
6.09E+02
2.73E+02
1.80E-03
1.13E-06
0.00 0.00
U 234 1.18E-01 1.21E
-01 1.33E
-01 1.43E
-01 1.55E
-01 1.64E
-01 1.64E
-01 1.65E
-01 1.65E
-01 1.65E
-01 1.65E
-01
Po 214 1.20E-06 1.79E
-07 3.31E
-06 1.30E
-05 5.30E
-05 3.41E
-04 1.33E
-03 5.56E
-02 4.92E
-01 8.49E
-01 8.19E
-01
Po 210 2.49E-09 1.12E
-08 3.80E
-07 2.21E
-06 1.17E
-05 1.04E
-04 4.05E
-04 1.69E
-02 1.50E
-01 2.59E
-01 2.50E
-01
Po 218 2.32E-09 8.49E
-08 1.58E
-06 6.20E
-06 2.52E
-05 1.62E
-04 6.33E
-04 2.64E
-02 2.34E
-01 4.04E
-01 3.90E
-01
Rn 222 1.69E-09 6.20E
-08 1.15E
-06 4.53E
-06 1.84E
-05 1.18E
-04 4.62E
-04 1.93E
-02 1.71E
-01 2.95E
-01 2.85E
-01

59
Table 12. Primary spontaneous fission neutron source intensity for CANDU UO2 fuel at burnup of 320 MWh/kgU, (Tait et al. 2000)
UO2 Fuel - Actinides - Neutron Source Intensity Alpha-n Neutron Source:
neutrons/s/kg U
Nuclide Discharge 10
Years 50
Years 100
Years 200
Years 500
Years 1000 Years
104 Years
105 Years
106 Years
107 Years
Total 9.01E+04 2.55E+04
7.40E+03
3.13E+03
2.38E+03
2.30E+03
2.20E+03
1.11E+03
3.76E+02
8.16E+01
1.32E+01
Cm 242 5.41E+04 5.32E+00
4.36E+00
3.41E+00
2.09E+00
4.78E-01
4.09E-02
2.50E-21
0.00 0.00 0.00
Cm 244 3.36E+04 2.30E+04
4.98E+03
7.34E+02
1.59E+01
1.63E-04
7.87E-13
0.00 0.00 0.00 0.00
Pu 240 1.89E+03 1.89E+03
1.89E+03
1.88E+03
1.86E+03
1.80E+03
1.71E+03
6.59E+02
4.90E-02
1.18E-10
1.26E-10
Pu 242 4.37E+02 4.37E+02
4.37E+02
4.37E+02
4.37E+02
4.37E+02
4.36E+02
4.29E+02
3.63E+02
6.84E+01
3.82E-06
U 238 1.32E+01 1.32E+01
1.32E+01
1.32E+01
1.32E+01
1.32E+01
1.32E+01
1.32E+01
1.32E+01
1.32E+01
1.32E+01
Table 13. Total neutron spectrum at burnup of 320 MWh/kgU (Tait et al. 2000)
Total Neutron Source Spectrum (neutrons/s/kg U)
Boundaries (MeV) Discharge 10 Years 50 Years 100 Years
1 14.200 - 17.300 0.000 0.000 0.000 0.000
2 12.200 - 14.200 1.185E+01 3.334E+00 9.681E-01 4.099E-01
3 10.000 - 12.200 1.029E+02 2.911E+01 8.452E+00 3.579E+00
4 8.610 - 10.000 1.597E+02 4.493E+01 1.305E+01 5.524E+00
5 7.410 - 8.610 5.085E+02 1.426E+02 4.142E+01 1.754E+01
6 6.070 - 7.410 1.542E+03 4.312E+02 1.252E+02 5.302E+01
7 4.970 - 6.070 3.003E+03 8.605E+02 2.499E+02 1.058E+02
8 3.680 - 4.970 9.434E+03 2.280E+03 7.134E+02 3.341E+02
9 3.010 - 3.680 1.080E+04 2.270E+03 8.744E+02 5.111E+02
10 2.730 - 3.010 5.501E+03 1.220E+03 5.263E+02 3.401E+02
11 2.470 - 2.730 5.803E+03 1.381E+03 5.743E+02 3.625E+02
12 2.370 - 2.470 2.372E+03 5.900E+02 2.389E+02 1.477E+02
13 2.350 - 2.370 4.730E+02 1.178E+02 4.738E+01 2.912E+01
14 2.230 - 2.350 2.683E+03 6.867E+02 2.759E+02 1.697E+02
15 1.920 - 2.230 7.609E+03 2.032E+03 7.900E+02 4.742E+02
16 1.650 - 1.920 7.034E+03 1.948E+03 7.027E+02 3.935E+02
17 1.350 - 1.650 8.707E+03 2.493E+03 8.364E+02 4.328E+02

60
18 1.000 - 1.350 1.145E+04 3.288E+03 1.034E+03 4.932E+02
19 0.821 - 1.000 5.835E+03 1.654E+03 5.024E+02 2.282E+02
20 0.743 - 0.821 2.770E+03 7.886E+02 2.360E+02 1.049E+02
21 0.608 - 0.743 4.942E+03 1.406E+03 4.168E+02 1.826E+02
22 0.498 - 0.608 4.013E+03 1.126E+03 3.326E+02 1.448E+02
23 0.369 - 0.498 4.650E+03 1.303E+03 3.828E+02 1.650E+02
24 0.297 - 0.369 2.411E+03 6.769E+02 1.989E+02 8.581E+01
25 0.183 - 0.297 1.913E+00 8.887E-01 1.211E+00 1.179E+00
26 0.111 - 0.183 1.209E+00 5.618E-01 7.657E-01 7.453E-01
27 0.0674 - 0.111 1.861E-01 8.644E-02 1.178E-01 1.147E-01
28 0.0409 - 0.0674 0.000 0.000 0.000 0.000
Total 1.018E+05 2.677E+04 9.124E+03 4.787E+03
A.3.1 Neutron radiation per unit mass
The neutron flux and average neutron energy (Eave) are listed in Table 14. These values are measured on the used fuel from OPG nuclear generating stations and the corresponding neutron source spectrum are tabulated above (Table 13). Only the data for the first 100 years after discharge are listed.
Table 14. Total neutron release rate per unit mass at burnup of 320 MWh/kgU
Source Unit Neutron release rate and the average neutron
energy
UO2 Fuel
Flux neutrons/s/kgU 1.018E+05 2.677E+04 9.124E+03 4.787E+03
Eave MeV 2.43 2.34 2.38 2.41
A.3.2 Neutron radiation per fuel bundle
The radiation emitted by one fuel bundle is calculated for the 37-element CANDU “long” bundle, the mass per bundle used in calculation is 19.7 kg U.
Table 15. Total neutron release rate per bundle at burnup of 320 mwh/kgu
Source Unit Neutron release rate and the average neutron
energy
37 element
Flux neutrons/s/bundle 2.01E+06 5.27E+05 1.80E+05 9.43E+04

61
CANDU “long” bundle
Eave MeV 2.43 2.34 2.38 2.41
A.3.3 Neutron radiation per container
The total neutron flux on the interior surface of container is calculated for Mark II (CV-HH-4L-12). The radiation flux/fluence is simplified to be uniformly deposited on the interior surface of container.
Table 16. Total neutron release rate per UFC at burnup of 320 MWh/kgU
Source Unit Neutron release rate and the average neutron
energy
MARK II 4L-12
Flux neutrons/container 9.63E+07 2.53E+07 8.63E+06 4.53E+06
Flux on interior surface
neutrons/s/cm2 2.71E+03 7.12E+02 2.43E+02 1.27E+02
A.3.4 Neutron fluence on interior container
Using the above calculated flux, the neutron fluence on the interior surface of UFC can be calculated as a function of disposal time, Table 4 in the main text, assuming the minimum cooling time before the starting point of DGR is 10 years for conservative estimation.

62
A.4 GAMMA DOSE RATES INSIDE AND OUTSIDE UFC
The following calculation is for the gamma dose rates under disposal conditions through lifetime, both inside and outside UFC. A more detailed CALC file, Gamma Dose Rate Evolution in 4L-12 UFC, is also prepared for NWMO. The calculation procedures are based on the work by Morco et al. (2017a). All calculations are geared towards the 4L-12 UFC. And the fuel bundle used in this study is 37-element CANDU “long” bundle (Garamszeghy 2012). The software, MicroShield v9.05, has been used to perform the modelling and calculation. A detailed description and validation of the MicroShield software have been done by NWMO (Medri 2012; Morco et al. 2017b). The gamma radioactivity of CANDU used fuel bundles are extracted from the study by Tait et al (2000) and Tait and Hanna (2001). The total gamma photon spectra are divided into 18 discrete energy groups with the mean energies in the range of 0.01 to 5.50 MeV. Each energy group of photons are executed separately and subsequently combined to reflect the total dose rate of gamma radiation. The nominal case is calculated for a fuel burnup of 220 MWh/kgU, in radial direction of the midplane, and in the medium of air. Two dose rates are calculated to represent the peak dose rate inside and outside the UFC: (1) fuel surface and (2) container surface exterior. The nominal dose rates are listed in Table 17 as a function of cooling time. The contact dose rate at fuel surface is generally 20 times higher than that at container surface due to the shielding by container. These values show a clear decay of intensity in the first 500 years. However, following the decay time of 500 years the dose rate remains at constant level or even increases slightly. This is due to an ingrowth of high-energy photon emitters during decay process leading to a change in the shape of photon spectra (Tait et al. 2000). Because the absorption of photons by matter (i.e., the used fuel and container) is less for high-energy photons than for the low-energy ones, the fraction of photons that can eventually penetrate the container becomes higher. The overall effect is that the final dose rate at the external surface remains a constant level or slightly increases.
Table 17: Nominal dose rates in air calculated for 4L-12 UFC at 220 MWh/kgU (unit: Gy/h)
10
Years 20
Years 30
Years 50
Years 100
Years 200
Years 500
Years 1000 Years
104 Years
105 Years
106 Years
Fuel surface
96.8 65.3 49.7 30.6 9.55 0.949 5.56E
-3 3.38E
-3 2.41E
-3 3.38E
-3 4.23E
-3
Container surface
5.08 3.20 2.36 1.43 0.445 4.40E
-2 1.53E
-4 1.04E
-4 1.20E
-4 2.72E
-4 4.07E
-4
The highest burnup, 320 MWh/kgU, is adopted for the sensitivity test on fuel burnup to achieve the upper bound of radiation dose rate. The relative change from the nominal case is also listed as a percentage in Table 17. According to a similar sensitivity test in page 21 of reference Garisto et al (2009) and page 20 of Medri (2016), the dose rate of 320 MWh/kgU is generally 50-70 % higher than that of 220 MWh/kgU in 104 years, which is consistent with the data Table 18.

63
Table 18: Dose rates calculated at a high burnup of 320 MWh/kgU (unit: Gy/h)
10 Years
20 Years
30 Years
50 Years
100 Years
200 Years
500 Years
1000 Years
104 Years
105 Years
106 Years
Fuel surface
144 95.0 72.0 44.2 13.8 1.37 9.11E
-3 5.80E
-3 3.88E
-3 4.18E
-3 4.38E
-3
Compare to nominal case
+49% +45% +45% +44% +45% +44% +64% +72% +61% +24% +4%
Container surface
7.56 4.68 3.44 2.07 0.641 6.35E
-2 2.39E
-4 1.67E
-4 1.78E
-4 3.16E
-4 4.14E
-4
Compare to nominal case
+49% +46% +46% +45% +44% +44% +56% +61% +48% +16% +2%

64
INTERNAL PRESSURE EVOLUTION INSIDE A MARK II UFC
The complete tabulation of the internal pressure evolution calculations within a Mark II UFC over the time period of 106 a, is presented here. This calculation examines 924 kg of used fuel, the amount to be placed in one UFC (Boyle et al. 2016), for two burnup values: 220 MW h kg-1, which is the expected average burnup of used fuel bundles placed in a UFC, and 320 MW h kg-
1, which is the bounding case (as 48 bundles with such high burnup would not be able to be placed into one UFC). This work evaluated first the quantity of oxidants (N2, O2, H2O and trace gases) that will be trapped at time of closure through the ambient conditions in the encapsulation facility. The atmosphere within the facility is composed of 78% N2, 21 % O2, and 1% trace gases, which translates to 7.4 – 9.5 mol, 2.0 – 2.6 mol, and 0.09 – 0.12 mol respectively. The quantity of H2O in trapped air was 0.00 – 0.45 mol, based on its proportionality with the partial pressure of water, which is in the range of 0.00 – 4.25 kPa. The possibility of trapped water in the UFC due to cladding defects was also considered to obtain the maximum quantity of H2O trapped in the CANDU bundle to be 0.37 mol. A summary of the maximum amounts of trapped oxidants is presented in Table 19.
Table 19. Maximum quantity of oxidants trapped in a Mark II UFC at time of closure
Oxidant Source Quantity (mol)
N2 Air 9.5
O2 Air 2.6
Trace gases Air 0.12
H2O Air 0.45
0.82 Bundle 0.37
Using the quantities of trapped oxidants and the quantity of noble gases released from the used fuel as defined by Tait et al. (2000), the evolution of internal pressure was calculated using the ideal gas law. Over time, the internal pressure will continue to evolve due to i) the consumption of O2 by corrosion of the steel basket and structural vessel, ii) the consumption of H2O and production of H2 from the corrosion of the steel basket and structural vessel, iii) the production of noble gases from the radioactive decay of the used fuel (Boyle and Marinceu 2013), and iv) the evolving temperature of the trapped gases. The temperature of the air inside the UFC will continue to increase until it reaches a maximum of 120 °C at ~15 a after closure, then gradually decrease to ≤ 110 °C at ~60 a after closure (Guo 2015). From 103 a onwards, the temperature at the container surface is used to profile the evolution of temperature (Guo 2015, 2017). The results are presented below in Table 20 and Table 21, for 220 and 320 MWh/kgU respectively.
Table 20. Trapped gases and internal pressure in a Mark II UFC (220 MW h/kgU)
Time (a)
nnoble/kgUa
(mol/kg)
nnoble/UFCb (mol)
nN2 + trace (mol)
nO2 (mol)
nH2O
(mol)
nH2 (mol)
T (°C)
P (MPa)
0 0.000 0.000 9.62 2.6 0.82 --- 100 0.15
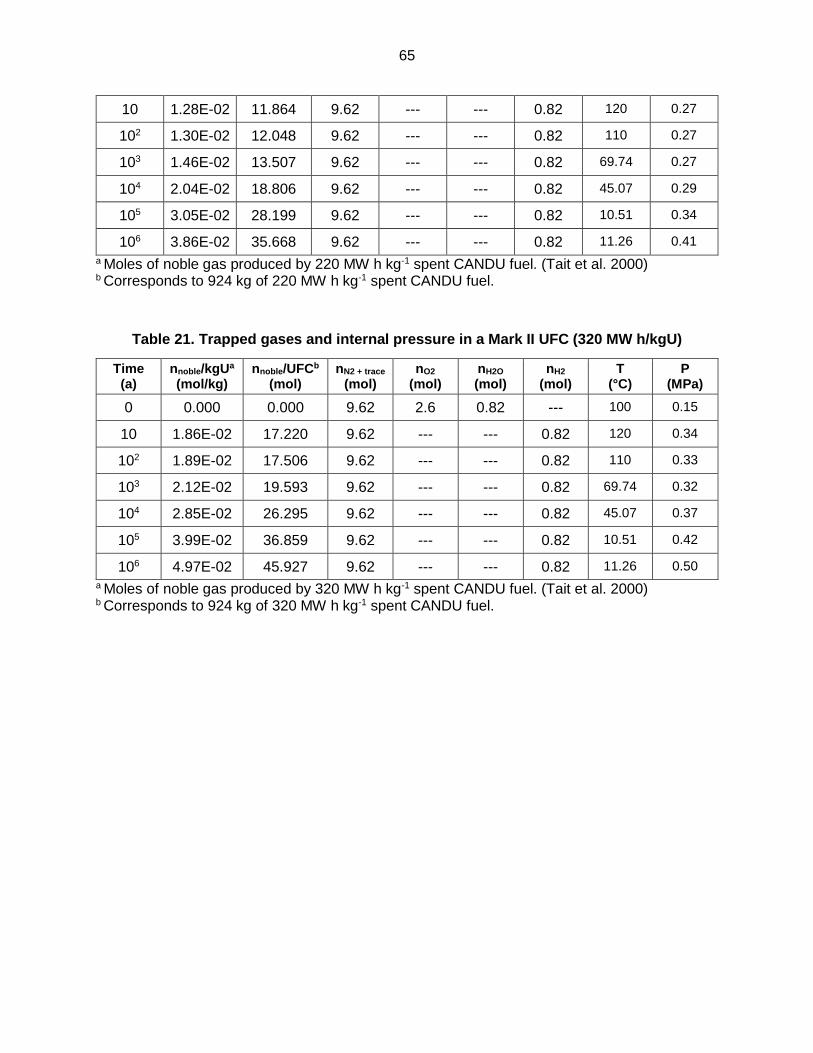
65
10 1.28E-02 11.864 9.62 --- --- 0.82 120 0.27
102 1.30E-02 12.048 9.62 --- --- 0.82 110 0.27
103 1.46E-02 13.507 9.62 --- --- 0.82 69.74 0.27
104 2.04E-02 18.806 9.62 --- --- 0.82 45.07 0.29
105 3.05E-02 28.199 9.62 --- --- 0.82 10.51 0.34
106 3.86E-02 35.668 9.62 --- --- 0.82 11.26 0.41
a Moles of noble gas produced by 220 MW h kg-1 spent CANDU fuel. (Tait et al. 2000) b Corresponds to 924 kg of 220 MW h kg-1 spent CANDU fuel.
Table 21. Trapped gases and internal pressure in a Mark II UFC (320 MW h/kgU)
Time (a)
nnoble/kgUa
(mol/kg)
nnoble/UFCb (mol)
nN2 + trace (mol)
nO2 (mol)
nH2O
(mol)
nH2 (mol)
T (°C)
P (MPa)
0 0.000 0.000 9.62 2.6 0.82 --- 100 0.15
10 1.86E-02 17.220 9.62 --- --- 0.82 120 0.34
102 1.89E-02 17.506 9.62 --- --- 0.82 110 0.33
103 2.12E-02 19.593 9.62 --- --- 0.82 69.74 0.32
104 2.85E-02 26.295 9.62 --- --- 0.82 45.07 0.37
105 3.99E-02 36.859 9.62 --- --- 0.82 10.51 0.42
106 4.97E-02 45.927 9.62 --- --- 0.82 11.26 0.50
a Moles of noble gas produced by 320 MW h kg-1 spent CANDU fuel. (Tait et al. 2000) b Corresponds to 924 kg of 320 MW h kg-1 spent CANDU fuel.

66
REFERENCES OF APPENDIX
Boyle, C., K. Birch and A. Zivkovic. 2016. Sixth Case Study Engineering Data. Nuclear Waste
Management Organization Toronto, Canada.
Boyle, C. and D. Marinceu. 2013. IV-25 Copper Vessel: Internal Pressure Structural Analysis. Nuclear Waste Management Organization Report Calculation NWMO APM-CALC-04320-0002-R000. Toronto, Canada.
Ellsworth, B. 2005. Safety Analysis Report for the Dry Storage Container Transportation Package (Vol. 1). Ontario Power Generation Report 00104-SR-79171–00001.
Garamszeghy, M. 2012. Nuclear Fuel Waste Projections in Canada – 2012 Update. Nuclear Waste Management Organization Report Technical Report NWMO TR-2012-13. Toronto, Canada.
Garisto, F., D.H. Barber, E. Chen, A. Inglot and C.A. Morrison. 2009. Alpha, Beta and Gamma Dose Rates in Water in Contact with Used CANDU Fuel. Nuclear Waste Management Organization Report Technical Report NWMO TR-2009-27. Toronto, Canada.
Guo, R. 2015. Thermal Modelling of a Mark II Container. Nuclear Waste Management Organization Report NWMO-TR-2015-06. Toronto, Canada.
Guo, R. 2017. Thermal response of a Canadian conceptual deep geological repository in crystalline rock and a method to correct the influence of the near-field adiabatic boundary condition. Engineering Geology, 218, 50–62.
Medri, C. 2012. Validation Report for MicroShield 9.05. Nuclear Waste Management Organization Report Technical Memorandum NWMO TM-01390-22790. Toronto, Canada.
Medri, C. 2016. Mark II Used Fuel Container Internal and External Surface Dose Rates. Nuclear Waste Management Organization Report NWMO APM-CALC-26200-0201-R000. Toronto, Canada.
Morco, R.P., J.M. Joseph, D.S. Hall, C. Medri, D.W. Shoesmith and J.C. Wren. 2017a. Modelling of radiolytic production of HNO3 relevant to corrosion of a used fuel container in deep geologic repository environments. Corrosion Engineering, Science and Technology, 52, 141–147.
Morco, R.P., J.M. Joseph, D.S. Hall, C. Medri, D.W. Shoesmith and J.C. Wren. 2017b. Modelling of radiolytic production of HNO3 relevant to corrosion of a used fuel container in deep geologic repository environments. Corrosion Engineering, Science and Technology, 52, 141–147.
Tait, J.C. and S. Hanna. 2001. Characteristics and Radionuclide Inventories of Used Fuel from OPG Nuclear Generating Stations. Volume 3 - Radionuclide Inventory Data Decay Times 10 to 300 Years. Ontario Power Generation Report OPG 06819-REP-01200-10029-R00 Vol. 3. Toronto, Canada.

67
Tait, J.C., H. Roman and C.A. Morrison. 2000. Characteristics and Radionuclide Inventories of Used Fuel from OPG Nuclear Generating Stations. Volume 2 - Radionuclide Inventory Data. Ontario Power Generation Report OPG 06819-REP-01200-10029-R00 Vol. 2. Toronto, Canada.
UIGI. 2011a. The composition of air – the components and properties of air. Universal Industrial Gases Inc.
UIGI. 2011b. Online Psychrometric Calculator. Universal Industrial Gases Inc.