Interior Earth Unit Tracking Sheet
21
1 Name _______________________________________ Period ______________ Mrs. Coates—Earth Science Interior Earth Unit Tracking Sheet My Progress Pre-Test Earth’s Heat Chemical Layers Physical Layers Evidence of Interior Convection Currents Post Test 4 (90-100%) 3 (80-89%) 2 (70-79%) 1 (0-69%) Learning Target Question Example Date Target was Taught in Class Earth was hot in the beginning and it has stayed hot under the crust How did the bombardment of Earth by solid particles affect its temperature? October 9/12 Layers of Earth can be separated based on chemical composition How are Earth’s Crust and Core different from one another? October 13/14 Layers of Earth can be separated based on physical properties How are Earth’s lithosphere and asthenosphere different from one another? October 13/14 Evidence tells us what the layers of earth are made of and how they interact Why would the composition of a meteorite resemble the Earth’s interior? October 13/14, October 20/21 Convection currents inside the earth move the tectonic plates How do scientists explain the movement of Earth’s tectonic plates? October 22/23 Unit Test: October 28 th (A) or 29 th (B)
Transcript of Interior Earth Unit Tracking Sheet

1
Name _______________________________________ Period ______________ Mrs. Coates—Earth Science
Inter i or Earth Un it Track ing Sheet
My Progress
Pre-Test Earth’s Heat
Chemical Layers
Physical Layers
Evidence of Interior
Convection Currents
Post Test
4 (90-100%)
3 (80-89%)
2 (70-79%)
1 (0-69%)
Learning Target Question Example Date Target was Taught
in Class
Earth was hot in the beginning and it has stayed hot under the crust
How did the bombardment of Earth by solid particles affect its temperature?
October 9/12
Layers of Earth can be separated based on chemical composition
How are Earth’s Crust and Core different from one another?
October 13/14
Layers of Earth can be separated based on physical properties
How are Earth’s lithosphere and asthenosphere different from one another?
October 13/14
Evidence tells us what the layers of earth are made of and how they interact
Why would the composition of a meteorite resemble the Earth’s interior?
October 13/14, October 20/21
Convection currents inside the earth move the tectonic plates
How do scientists explain the movement of Earth’s tectonic plates?
October 22/23
Un i t Te st : O ctober 2 8 t h ( A ) o r 2 9 t h (B )

2
AH-HA!
What is inside
the Earth?

3
Science Starter Sheet

4
Science Starter Sheet
5
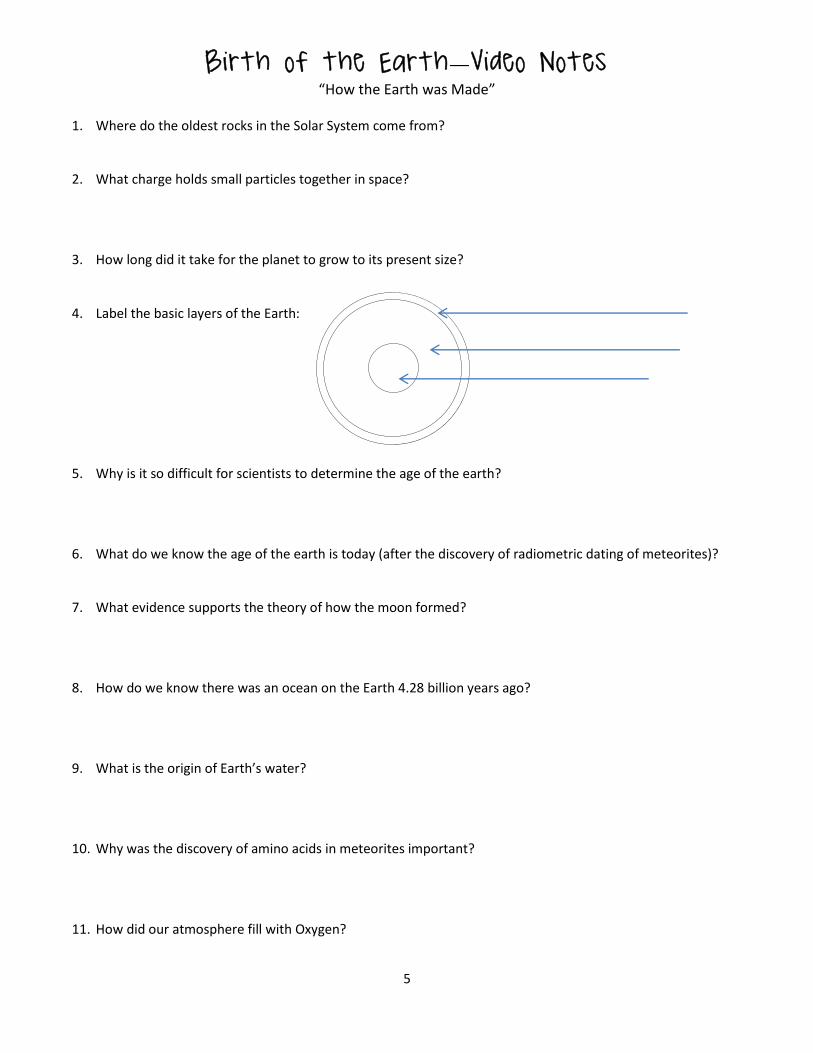
Birth of the Earth—V i de o Notes “How the Earth was Made”
1. Where do the oldest rocks in the Solar System come from?
2. What charge holds small particles together in space?
3. How long did it take for the planet to grow to its present size?
4. Label the basic layers of the Earth:
5. Why is it so difficult for scientists to determine the age of the earth?
6. What do we know the age of the earth is today (after the discovery of radiometric dating of meteorites)?
7. What evidence supports the theory of how the moon formed?
8. How do we know there was an ocean on the Earth 4.28 billion years ago?
9. What is the origin of Earth’s water?
10. Why was the discovery of amino acids in meteorites important?
11. How did our atmosphere fill with Oxygen?

6
What is the source of the heat in Earth’s interior?
The heat inside Earth moves continents builds mountains and causes earthquakes. Where does all
this heat come from?
If you think about a volcano, you know Earth must be hot inside. The heat inside Earth moves continents,
builds mountains and causes earthquakes. Where does all this heat inside Earth come from?
Earth was hot when it formed.
A lot of Earth’s heat is leftover from when our
planet formed four-and-a-half billion years ago.
Earth is thought to have arisen from a nebula (a
cloud of gas and dust in space). Solid particles,
called “planetesimals” condensed out of the
cloud. They’re thought to have stuck together
and created the early Earth. Bombarding
planetesimals heated Earth to a molten state.
So Earth started out with a lot of heat.
Earth makes some of its own heat.
Earth is cooling now – but very, very slowly. Earth is close to a steady temperature state. Over the past several
billion years, it might have cooled a couple of hundred degrees. Earth keeps a nearly steady temperature,
because it makes heat in its interior.
In other words, Earth has been losing heat since it formed, billions of years ago. But it’s producing almost as
much heat as its losing. The process by which Earth makes heat is called radioactive decay. It involves the
disintegration of natural radioactive elements inside Earth – like uranium, for example. Uranium is a special
kind of element because when it decays, heat is produced. It’s this heat that keeps Earth from cooling off
completely.

7
Many of the rocks in Earth’s crust and interior undergo this process of radioactive decay. This process
produces subatomic particles that zip away, and later collide with surrounding material inside the Earth. Their
energy of motion is converted to heat.
Without this process of radioactive decay, there would be fewer volcanoes and earthquakes – and less
building of Earth’s vast mountain ranges.
How hot is it inside Earth?
No one has come close to exploring Earth’s interior directly. So not all geophysicists agree on how hot it is at
Earth’s core. But the rate of travel of waves from earthquakes – called “seismic waves” – tells scientists a lot
about what materials make up the planet. Seismic data also reveal whether these materials are liquid, solid or
partially solid. Meanwhile, laboratory data indicate at what temperatures and pressures the materials inside
Earth should begin to melt.
From this evidence, Earth’s core temperature is estimated to be around 5,000 to 7,000 degrees Celsius. That’s
about as hot as the surface of the sun, but vastly cooler than the sun’s interior.
By the way, while the heat energy produced inside Earth is enormous, it’s some 5,000 times less powerful than
what Earth receives from the sun. The sun’s heat drives the weather and ultimately causes erosion. So it’s
ironic that – while Earth’s heat makes mountains – the sun’s energy tears them down again, bit by bit.

8
Earth ’ s Inter i o r Heat
Read and highlight the reading “What is the source of the heat in Earth’s interior?”
Answer the following questions.
1. Explain where most of the heat of the Earth came at its formation.
2. If Earth has been cooling since its formation, why is it still very hot inside?
3. How has radioactive decay contributed to Earth’s interior heat? Explain the process.
4. Why do you think radioactive decay would cause more volcanoes, earthquakes, and mountain building?
5. What are the two main ways that scientist learn about Earth’s interior? (Read more about these on p. 69-
70 of your textbook.)
6. What do these techniques indicate about Earth interior? What is the temperature of Earth’s Core?
7. How does the internal heat of the Earth compare to the heat we receive from the Sun?

9
Composition
Properties

10
Earth ’ s Inter i o r—Notes
_______________________ Composition _______________________ Properties
These layers are separated based on…
These layers are separated based on…
Names of these layers:
Names of these layers:
Evidence of composition:
Evidence of properties:

11
The Story of the Waves
Introduction:
This activity focuses on the indirect evidence for the Earth's internal structure from earthquake waves. Students are
asked to use their knowledge of the properties of seismic waves to interpret a graph showing how the velocities of P-
waves and S-waves change with depth in the Earth.
Background information: READ AND HIGHLIGHT
Earthquakes produce P- and S-waves which pass through the Earth. Table 1 summarizes the properties of P-waves and S-
waves.
Table 1: Properties of P-waves and S-waves
P-waves pass through both mantle and core, but are slowed and refracted at the mantle / core boundary at a
depth of 2900 km.
S-waves passing from the mantle to the core are absorbed because shear waves cannot be transmitted through
liquids. This is evidence that the outer core does not behave like a solid substance.
S-waves are not transmitted through the liquid outer core. This produces a 'shadow zone' on certain parts of the
Earth's surface where S-waves are not recorded, and this is used as the main piece of evidence to deduce the
size of the core. The core has a radius of 3470 km.
The main properties of the layers of the Earth are summarized in Table 2.
Earthquake Wave Properties Movement
P-Waves
(Primary waves)
The faster of the two types of waves; they travel through solids
and liquids but travel more slowly through liquids than solids
S-Waves
(Secondary waves)
The slower of the two types of wave; not transmitted by liquids
(or other fluids).

12
Table 2: The main properties of the layers of the Earth
Layer Properties
Crust A thin outer layer with a mean density of about 2.8 g cm-3. It is solid and consists of
continental crust (mainly of granite and sedimentary rocks) and oceanic crust (mainly of
basaltic rocks). Oceanic crust has an average thickness of 6 km whereas continental crust has
an average thickness of around 35 km. It cannot easily be seen on the graph due its small
scale.
Lithosphere The solid crust and upper mantle material that may be up to 200 km thick in places.
Asthenosphere The layer beneath the lithosphere, not synonymous with the low velocity zone. A zone of
flexible behavior (semi-solid) that can move.
Low velocity
zone
A zone within the asthenosphere in the upper mantle that is defined on seismic criteria. It
varies in depth between 50 and 250 km and represents part of the mantle that may be about
5% liquid. It transmits S-waves but both S- and P-wave velocities are reduced.
Mesosphere
(Mantle)
A layer about 2885 km thick with density increasing with depth from 3.3 - 5.4 g cm-3. It is solid
and is thought to consist of peridotite (an iron / magnesium-rich silicate rock).
Outer core A layer 2255 km thick which is very dense, increasing with depth from 9.9 - 12.3 g cm-3. It is
liquid and probably consists of an iron and sulfur mixture.
Inner core This has a 1215 km radius and is very dense, with a maximum density of 13.5 g cm-3. It is solid,
and is thought to consist of an iron and nickel mixture.

13

14
Use the background information above and the graph showing the velocities of S-waves and P-waves to answer the
questions below.
1. Outline the S- waves with blue crayon and P-waves in red.
2. Draw dashed lines across the graph to show where S-wave velocity changes suddenly. Outline these in green.
3. Label each of the zones between the lines to show how S-wave velocity changes, for example write ‘wave
velocity decreasing.
4. In what way is the P-wave velocity line different from the S-wave velocity line between the Earth’s surface and
2900 km depth?______________________________________________________________________________
___________________________________________________________________________________________
5. Why did both the P-wave and S-wave decrease in velocity at about 20 km below the Earth’s Surface?
___________________________________________________________________________________________
6. Why does the P-wave show up between 2900 – 5100 Km while S-waves do not? __________________________
___________________________________________________________________________________________
7. Explain what happened to the P-waves at 2900 Km. Why did that happen?______________________________
___________________________________________________________________________________________
8. Draw a dotted line on the graph to show where P-wave velocity changes. Outline these in orange.
9. Label each of the zones from 2900 km to 6400 km to show how P-wave velocity changes, for example write
‘wave velocity decreasing suddenly’ or ‘wave velocity increasing gradually’.
10. Use the information to mark, label, and lightly shade each layer according to the colors on the graph:
crust (brown) mantle (yellow) outer core (purple) inner core (pink)
11. If the Earth was solid all the way through, what would you expect the graph to look like?
___________________________________________________________________________________________
___________________________________________________________________________________________
12. Summarize the properties of the different layers labeled 1-4 in the diagram below. The first one has been done
for you. (On this diagram the crust is shown thicker than it really is, so that it can be seen.
P- and S-waves pass through the CRUST, so it is solid

15
Convect i on Currents—NOTES
Review—Three Types of Heat:
Transfer of heat… Example
Conduction
Radiation
Convection
Explanation Drawing of Molecules
What causes hot liquid/gas to rise:
What causes cold liquid/gas to sink:
Earth’s Interior Convection Currents:

16
P late Tecton i cs Convect i on Lab
Introduction: In this activity you will investigate how convection currents are created and how they move through a
liquid or in the case of plate movement, the mantle of Earth. The mantle is a solid that is able to move slowly, often
described as flexible like plastic. To understand how energy moves in the Earth system, it is important to understand
convection. Convection currents affect many of Earth’s systems including weather and climate, the movement of the
ocean, and plate tectonics. The Theory of Plate Tectonics was not complete until scientists understood convection in the
mantle. You will model how scientists explain how something as large as a continent can move.
Materials:
1 clear plastic or glass container, 5 Styrofoam cups, pipettes, food coloring, water, paper towels, teaspoon of sawdust
Procedure:
Trial A:
1. Place the container on top of three Styrofoam cups as shown below. 2. Fill the container ½ full with room temperature water.
3. Sprinkle sawdust on the surface. 4. Place a cup of room temperature water under the center so that
the surface of the water touches the pie pan. 5. Use a pipette to carefully place a drop of dye at the bottom, in
the center of the container. 6. Observe for 3 minutes and draw and record you observations of
the sawdust and food coloring in the data section. Trial B:
1. Empty the water from the container into the sink. Remove the room temperature cup of water. 2. Refill the container with room temperature water and place the cups under it again. 3. Sprinkle sawdust on the top. Place a cup under the center of the pie pan with very hot water. The top of the hot
water should touch the bottom of the pie pan. 4. Add a drop of food coloring at the bottom of the container, in the center. 5. Record your observations of the sawdust and food coloring.
Trial C:
1. Keep the pan from Trial B and carefully place a drop of a different color of dye at the edge of the pie pan. 2. Observe for at least 3 minutes and draw and record your observations in the data section.
Data/Observations:
Trial A (no heat, drop in center) Trial B (heat in center, drop in middle)

17
Data/Observations Continued:
Trial C (heat, drop on edge)
Analysis:
1. Using the observations you made, describe how a convection current works. (Use a textbook if you need some help.)
2. Why does colder water sink?
3. Why does warmer water rise?
4. Where in nature does convection occur?
5. If convection didn’t occur, what would happen to the atmosphere?
Clean Up Procedure:
1. Empty the water from the container into the sink.
2. Rinse the container so that no sawdust remains.
3. Empty the cup of hot water into the sink.
4. Wipe all sawdust off the counter top and THROW IT AWAY (do not drop it on the floor)!
5. Use paper towels to wipe up all water around your station.
6. Stack the Styrofoam cups.
7. Return the pipettes to the beakers full of dye.
8. Return to your assigned seat.

18
Earth ' s magnet i c f i e l d c ou l d f l i p in our l i fet ime
By | LiveScience Published October 21, 2014
A magnetic field shift is old news. Around 800,000 years ago, magnetic north hovered over Antarctica and reindeer lived in magnetic south. The poles have flipped several times throughout Earth's history. Scientists have estimated that a flip cycle starts with the magnetic field weakening over the span of a few thousand years, then the poles flip and the field springs back up to full strength again. However, a new study shows that the last time the Earth's poles flipped, it only took 100 years for the reversal to happen.
The Earth's magnetic field is in a weakening stage right now. Data collected this summer by a European Space Agency (ESA) satellite suggests the field is weakening 10 times faster than scientists originally thought. They predicted a flip could come within the next couple thousand years. It turns out that might be a very liberal estimate, scientists now say.
"We don't know whether the next reversal will occur as suddenly as this [previous] one did, but we also don't know that it won't," Paul Renne, director of the Geochronology Center at the University of California, Berkeley, said in a statement.
Geologists still are not sure what causes the planet's magnetic field to flip direction. Earth's iron core acts like a giant magnet and generates the magnetic field that envelops the planet. This helps protect against blasts of radiation that erupt from the sun and sometimes hurtle toward Earth. A weakening magnetic field could interrupt power grids and radio communication, and douse the planet in unusually high levels of radiation.
While the ESA satellite studied the magnetic field from above, Renne and a team of researchers studied it from below. The researchers dug through ancient lake sediments exposed at the base of the Apennine Mountains in Italy. Ash layers from long-ago volcanic eruptions are mixed into the sediment. The ash is made of magnetically sensitive minerals that hold traces of Earth's magnetic field lines, and the researchers were able to measure the direction the field was pointing.
Renne and colleagues then used a technique called argon-argon dating which works because radioactive potassium-40 decays into argon-40 at a known rate to determine the age of the rock sediment. The layers built up over a 10,000-year period, and the researchers could pinpoint where the poles flipped in the rock layers. The last flip happened around 786,000 years ago.
Changes measured by the Swarm satellite
over the past 6 months shows that Earth's
magnetic field is changing. The area with
the + sign is where it is strengthening, and –
sign show areas that are weakening.
Credit: ESA/DTU +
-

19
Sudden swap
The sediment layers also showed the magnetic field was unstable for about 6,000 years before the abrupt flip-flop. The period of instability included two low points in the field's strength, each of which lasted about 2,000 years.
Geologists don't know where the magnetic field is now in that reversal timescale or if this flip will even follow the same pattern as the last. The bottom line is that no one is sure when it's coming.
"We don't really know whether the next reversal is going to resemble the last one, so it's impossible to say whether we're just seeing the first of possibly several excursions (slight movements), or a true reversal," Renne told Live Science in an email.
Magnetic Doomsday?
While a pole flip could cause a few technical issues, there's no need to panic. Scientists have combed the geological timeline for any evidence of catastrophes that might be related to a magnetic flip. They haven't found any. The only havoc that a reversal would wreak is interference in the global electric grid. No direct evidence remains of past catastrophes triggered by a magnetic flip.
However, if the magnetic field weakens enough or temporarily disappears during the flip, then the Earth could be hit with dangerous amounts of solar radiation and cosmic rays. The exposure could mean that more people develop cancer, Renne said, though there’s no scientific proof this could happen.
Renne said more research is needed to understand the possible consequences of a shifting magnetic pole. The new study will be published in the November issue of the Geophysical Journal International.
Copyright 2014 LiveScience, a TechMediaNetwork company. All rights reserved.
Sources:
http://www.livescience.com/46694-magnetic-field-weakens.html
http://www.livescience.com/29572-earth-atmosphere-layers-atmospheric-pressure-infographic.html
http://newscenter.berkeley.edu/2014/10/14/earths-magnetic-field-could-flip-within-a-human-lifetime/
Ana l y s i s :
1. What continent is over our current magnetic south pole?
2. Which layer of the Earth creates our magnetic field?
3. What is the benefit to having a magnetic field?
4. What evidence shows that the magnetic poles have reversed in the past?
5. When will the magnetic poles reverse again?

20
Mode l ing Earth ’ s Mant le
Introduction: Earth’s mantle is made of rocks that are solid yet can flow like a liquid. In today’s lab you will be making a
fluid that will model this behavior. Please follow all directions carefully.
Materials
4 Tablespoons of cornstarch in a cup
20 mL of water
Graduated cylinder
3 drops food coloring
Plastic Fork
Procedure
1. Start by measuring 20 ml of water into a graduated cylinder. Add three drops of the color of your choice to the
water. You must add the food coloring; it adds both extra water as well as fabulously awesome color to you
mantle magma. Return food coloring to your teacher.
2. Pour the water and color mixture on top of the cornstarch and mix thoroughly with a fork. If you had the right
amount of water it will be tough to stir. Call your teacher over to check your mixture if you have any concerns.
3. Answer the questions below.
4. Waste disposal- rinse out cup, in sink, with lots of running water and return cup to lab prep area.
Analysis
Please answer these questions in complete sentences.
1. Poke your magma very quickly with your finger. Was your magma solid or liquid?
2. Place your finger gently on the surface of your magma and press. What happened to your finger?
3. Scoop or pour some magma into your hand. Try to roll it into a ball. As you try to roll it into a ball describe what is
happening.
4. What two states of matter is your magma going through?
5. What do you think is making your magma change state?
6. Place you magma (still in its cup) over the tray of ice and over the hot water. What effect does each temperature
have?

21
Conclusion: Write a paragraph to summarize your experiments. The first line is: A cornstarch solution can be used to
model the mantle of Earth. (Now use 4 sentences to describe how it is alike and different)
Write one paragraph (5 sentences) describing how temperature and pressure allow some mantle rocks to flow but not
others.