Interindividual Variability and Normal Ranges of Whole...
15
Interindividual Variability and Normal Ranges of Whole Blood and Plasma Thrombin Generation Saartje Bloemen, 1,2 Dana Huskens, 1,2 Joke Konings, 1,2 Romy M. Kremers, 1,2 Adam Miszta, 1,2 Bas de Laat, 1,2 and Hilde Kelchtermans 1,2 * Background: Assays measuring thrombin generation (TG) in plasma increasingly gained attention in the field of thrombosis and hemostasis. Adaptation of the method enabled the measurement of TG in whole blood (WB). Despite their potential, TG assays did not reach the stage of universal clinical application, partly because of the absence of normal ranges. Our study aimed to accurately determine normal ranges and interindividual variability of TG and correlate results with coagulation factor levels, sex, and oral contraceptive usage. Methods: The study protocol was evaluated by the local medical ethical board. In total, 129 healthy volunteers gave full informed consent. Normal ranges of TG in platelet-poor plasma (PPP), platelet-rich plasma (PRP), and WB were deter- mined according to CLSI guidelines. Results: Our study is the first to measure normal ranges of TG in PPP, PRP, and WB in a large healthy cohort. Significant correlations were found between TG in plasma and WB. Interindividual variability of TG in WB was comparable to that of plasma. Oral contraceptive use increased TG in PPP, PRP, and WB. The inhibitory effect of thrombomodulin on TG was significantly lower in females than in males. This effect was more pronounced upon oral contraceptive use. Primary clotting factor determinants for TG parameters depended on the tissue factor concentration, but were similar in WB and plasma. Conclusions: Establishing normal ranges for TG brings us 1 step closer to clinical use. Good correlations between plasma and WB (including clotting factor determinants for TG) suggest that WB TG can be reliably used in clinic. IMPACT STATEMENT Despite their potential, thrombin generation (TG) assays have not reached the stage of universal clinical application. Our study is the first to measure normal ranges of TG in plasma and whole blood (WB) in a large healthy cohort. Good correlations between plasma and WB (including clotting factor determinants) suggest that WB TG can be reliably used in clinic, paving the way for point-of-care applications of TG. With these normal ranges, we have now initiated a large prospective clinical study to determine the ability of TG to differentiate between health and different disease states. 1 Cardiovascular Research Institute Maastricht, Maastricht University Medical Centre, the Netherlands; 2 Synapse Research Institute, Maastricht, the Netherlands. *Address correspondence to this author at: Cardiovascular Research Institute Maastricht, Oxfordlaan 70, Maastricht 6229EV, the Netherlands. Fax +31-43-388-45-70; e-mail [email protected]. DOI: 10.1373/jalm.2017.023630 © 2017 American Association for Clinical Chemistry 3 Nonstandard abbreviations: TG, thrombin generation; PPP, platelet-poor plasma; PRP, platelet-rich plasma; CAT, calibrated automated throm- bography; WB, whole blood; TM, thrombomodulin; APC, activated protein C; TF, tissue factor; P 2 Rho, rhodamine substrate; PL, phospholipids; α 2 M-IIa, α 2 -macroglobulin-thrombin complex; BSA, bovine serum albumin; NPP, normal pooled plasma; ETP, endogenous thrombin potential; VI, velocity index; Ttpeak, time-to-peak; F, factor; Fg, fibrinogen; AT, antithrombin; TFPI, tissue factor pathway inhibitor. ARTICLES 150 JALM | 150 –164 | 02:02 | September 2017 ...............................................................................................................
Transcript of Interindividual Variability and Normal Ranges of Whole...

Interindividual Variability and Normal Ranges ofWhole Blood and Plasma Thrombin Generation
Saartje Bloemen,1,2 Dana Huskens,1,2 Joke Konings,1,2 Romy M. Kremers,1,2 AdamMiszta,1,2
Bas de Laat,1,2 and Hilde Kelchtermans1,2*
Background: Assays measuring thrombin generation (TG) in plasma increasingly gained attention in the field ofthrombosis and hemostasis. Adaptation of the method enabled the measurement of TG in whole blood (WB). Despitetheir potential, TG assays did not reach the stage of universal clinical application, partly because of the absence of normalranges. Our study aimed to accurately determine normal ranges and interindividual variability of TG and correlate resultswith coagulation factor levels, sex, and oral contraceptive usage.Methods: The study protocol was evaluated by the localmedical ethical board. In total, 129 healthy volunteers gave fullinformed consent. Normal ranges of TG in platelet-poor plasma (PPP), platelet-rich plasma (PRP), and WB were deter-mined according to CLSI guidelines.Results:Our study is the first tomeasure normal ranges of TG in PPP, PRP, andWB in a large healthy cohort. Significantcorrelations were found between TG in plasma andWB. Interindividual variability of TG in WB was comparable to that ofplasma. Oral contraceptive use increased TG in PPP, PRP, and WB. The inhibitory effect of thrombomodulin on TG wassignificantly lower in females than in males. This effect was more pronounced upon oral contraceptive use. Primary clottingfactor determinants for TG parameters depended on the tissue factor concentration, but were similar in WB and plasma.Conclusions: Establishing normal ranges for TG brings us 1 step closer to clinical use. Good correlations betweenplasma and WB (including clotting factor determinants for TG) suggest that WB TG can be reliably used in clinic.
IMPACT STATEMENTDespite their potential, thrombin generation (TG) assays have not reached the stage of universal clinical application.
Our study is the first to measure normal ranges of TG in plasma and whole blood (WB) in a large healthy cohort. Good
correlations between plasma andWB (including clotting factor determinants) suggest thatWB TG can be reliably used in
clinic, paving the way for point-of-care applications of TG. With these normal ranges, we have now initiated a large
prospective clinical study to determine the ability of TG to differentiate between health and different disease states.
1Cardiovascular Research InstituteMaastricht, Maastricht UniversityMedical Centre, theNetherlands; 2Synapse Research Institute,Maastricht, theNetherlands.*Address correspondence to this author at: Cardiovascular Research Institute Maastricht, Oxfordlaan 70, Maastricht 6229EV, theNetherlands. Fax +31-43-388-45-70; e-mail [email protected]: 10.1373/jalm.2017.023630© 2017 American Association for Clinical Chemistry3Nonstandard abbreviations: TG, thrombin generation; PPP, platelet-poor plasma; PRP, platelet-rich plasma; CAT, calibrated automated throm-bography; WB, whole blood; TM, thrombomodulin; APC, activated protein C; TF, tissue factor; P2Rho, rhodamine substrate; PL, phospholipids;α2M-IIa, α2-macroglobulin-thrombin complex; BSA, bovine serum albumin; NPP, normal pooled plasma; ETP, endogenous thrombin potential;VI, velocity index; Ttpeak, time-to-peak; F, factor; Fg, fibrinogen; AT, antithrombin; TFPI, tissue factor pathway inhibitor.
ARTICLES
150 JALM | 150–164 | 02:02 | September 2017
...............................................................................................................

Hemorrhagic and thrombotic diseases con-tribute substantially to morbidity and mortality.Therefore, a rapid diagnosis, risk stratification,and implementation andmonitoring of a tailoredtreatment are crucial. The conventional coagula-tion assays, including prothrombin time and ac-tivated partial thromboplastin time, are basedon measuring clotting times and may not reflectthe full complexity of a hemostatic impairment.Because in vitro fibrin formation occurs when<5% of the total amount of thrombin has beenformed, endpoint clotting assays do not assess95% of the hemostatic capacity in terms ofthrombin formation (1). Global hemostatic as-says measuring thrombin generation (TG)3 inplasma gained attention as a research tool in thefield of thrombosis and hemostasis (2). Evidenceis growing that TG can be used to elucidate co-agulation mechanisms, investigate hemorrhagiccoagulopathies, predict the risk of (recurrent)thrombosis, and monitor hemostatic and anti-thrombotic therapy (3–6).Aside from measuring TG in platelet-poor
plasma (PPP), TG assays allow assessment of the TGcapacity in platelet-rich plasma (PRP), in which plate-lets serve as the source of phospholipids. Therefore,the contribution of vonWillebrand factor and the ef-fect of thrombopenia, thrombopathy, as well as anti-platelet drugs, can be observed in the thrombogram(7). More recently, this calibrated automated throm-bography (CAT) assaywasmodified tomeasureTG inwholeblood (WB), bringing coagulation assays 1 stepcloser to truephysiological conditions (8). Byavoidingthe preparation of PRP/PPP, this WB approach re-duces the experimental time necessary to obtain apatient's result.Despite its potential for clinical diagnosis and
drug monitoring, TG assays have not achieved uni-versal clinical application. Although altered TG re-sults have been described in several clinicalsituations, the clinical relevance of the TG test andits diagnostic value is unclear because of the ab-sence of large clinical studies in which the treat-
ment decision is based on the outcome of the TG.In addition, the lack of standardization and largeinterlaboratory variability has hampered the im-plementation of TG assays as routine clinical tools.Nonetheless, multiple studies have shown that astandardized TG methodology effectively reducesthe variability of the assay to acceptable limits forusage in the clinics (9, 10). Apart from these limita-tions, the absence of reference ranges and a clearview on the interindividual variability in a largehealthy population further impedes clinical applica-tion of TG assays. In this study, we aimed to establishaccurate reference intervals for TG in PPP, PRP, andWB. As abnormalities in the protein C pathway arecommon risk factors for venous thrombosis, we de-cided to determine reference intervals for the per-centage inhibition of TG by exogenously addedthrombomodulin (TM) and activated protein C(APC). Furthermore, we investigated the effect ofthe sex, blood group, and oral contraceptive useon the different TG parameters.
MATERIAL AND METHODS
Reagents
Recombinant tissue factor (TF) and rhodaminesubstrate (P2Rho) were from Diagnostica Stago.Synthetic phospholipids (PL) were from AvantiPolar Lipids Inc. and were added in the form ofvesicles consisting of phosphatidylserine, phos-phatidylethanolamine, and phosphatidylcholine (1:1:3, mol:mol:mol). The calibrator α2-macroglobulin-thrombin complex (α2M-IIa) was prepared asdescribedpreviously (7). Z-Gly-Gly-Arg-aminomethyl-coumarin (ZGGR-AMC) was purchased fromBachem.HEPESbuffers containing5g/L (BSA5) or 60g/L bovine serum albumin (BSA60) were used to di-lute the reagents or substrates, respectively. Recom-binant human TM and APC were from Asahi KaseiPharma (Japan) and Veronique Regnault (France), re-spectively.
Thrombin Generation in a Healthy Population ARTICLES
September 2017 | 02:02 | 150–164 | JALM 151
...............................................................................................................

Study population
Our study protocol was evaluated by the localmedical ethical board (Medical Ethical CommitteeofMaastricht UniversityMedical Center). The studypopulation consisted of 129 healthy adult individ-uals. Participants were considered healthy if theydid not have any predisposition to/history ofthrombosis or bleeding or they did not take anyoral anticoagulant or antiplatelet drugs for at least2 weeks before testing. All participants gave fullinformed consent according to the Helsinki decla-ration. Experiments were conducted in accor-dance with approved guidelines and regulations.Blood was collected aseptically into vacuum tubesvia an antecubital puncture (1 volume trisodiumcitrate 0.105M to 9 volumes blood) (BD VacutainerSystem/Greiner tubes). The blood was kept atroom temperature and used within 4 h from col-lection. PRP was prepared by centrifuging theblood at 250g for 15 min. PPP was obtained bydouble centrifugation at 2630g for 10 min andstored at −80 °C until further use. Cell counts inWB and PRP were performed with a CoulterCounter analyzer (Beckman Coulter).For the normal pooled plasma (NPP), blood from
116 healthy control volunteers was collected.After an initial centrifugation step (2500g, 5 min)plasma was pooled, followed by ultracentrifugation(100000g, 10 min). Aliquots were snap-frozen in liq-uid nitrogen and stored at −80 °C until analysis.
Calibrated automated thrombography
CAT in PRP and PPP was executed as describedpreviously (7). In short, for the measurement inPPP, 20 μL of stimulus (TF, in the presence or ab-sence of TM/APC and PL) was added to 80 μL ofplasma. The final concentrations were 0, 1, or 5pmol/L TF, 4 μmol/L PL, 20 nmol/L APC, and 20nmol/L TM. TM and APC concentrations were de-termined to be around the IC50 levels in NPP, con-sidering the peak and endogenous thrombinpotential (ETP) values at 5 pmol/L TF. For PRP, the
final TF concentration was 1 pmol/L. The reactionwas started by adding 20 μL of FluCa (2.5 mmol/LZ-Gly-Gly-Arg-aminomethylcoumarin and 100mmol/L CaCl2 in BSA60 buffer) to the wells. Datawere acquired by specialized software fromThrombinoscope. ETP, peak, and velocity index[VI; peak/(time-to-peak−lag time)] data in PPPand PRP were normalized to the data generatedin NPP at 5 pmol/L TF and 1 pmol/L TF, respec-tively. In the presence of TM or APC, TG param-eters were expressed relative to the parametersin the absence of TM or APC [lag time and time-to-peak (Ttpeak) as ratio to corresponding pa-rameter without APC or TM; peak, ETP, and VI as% inhibition by TM or APC].Whole blood CAT was performed as described
previously, and data were normalized to each ofthe 2 devices used to measure whole blood TG (8).In short, 30 μL of blood was mixed with 10 μL ofP2Rho substrate (1.8 mmol/L) and 20 μL TF/CaCl2solutions. Final concentrations were 300 μmol/LP2Rho; 0, 0.5, and 2.5 pmol/L TF; and 16.7 mmol/LCaCl2. In the calibrationwells, the 20μL of reagentswere replaced with calibrator (300 nmol/L). Fluo-rescent signals were measured at excitation/emis-sion wavelengths of 485/538 nm by using theFluoroskan Ascent software (Thermo Labsystems).Fluorescent signals were transformed into throm-bin concentrations as originally described (11).
Clotting factor determinations
Levels of clotting factors were determined byuse of the STA-R Evolution analyzer (DiagnosticaStago). Levels were determined with clotting as-says triggered by either a thromboplastin-basedreagent [Factor (F)II, FV, FVII, FX] or a kaolin-basedreagent (FVIII, FIX, FXI). Fibrinogen levels (Fg)were measured by using the Clauss method. An-tithrombin (AT) levels were determined by achromogenic measurement. All assays werefrom Diagnostica Stago.
ARTICLES Thrombin Generation in a Healthy Population
152 JALM | 150–164 | 02:02 | September 2017
...............................................................................................................

Statistics
Continuous variables were expressed as medianand interquartile range (25%–75%). Interindividualvariability (%CV) was calculated for each variable as100 × (standard deviation/mean). Reference inter-vals were calculated by use of nonparametric meth-ods, in accordance with CLSI guidelines (12). Thelower reference interval limit was estimated as the2.5th percentile and the upper limit as the 97.5thpercentile of the distribution. Data were checked fornormality and the Spearman or Pearson correlationwas calculated accordingly to verify the associationbetween different parameters. Groups were com-pared by using the Mann–Whitney U-test for inde-pendent samples. Multiple linear regression analysiswas performed with lag time, ETP, or peak as depen-dent variables andplasma levels of coagulation factorsas independentvariables. Thestandardizedregressioncoefficients (β) of the independent variables and P val-uesareshown.StatisticswerecomputedbyusingSPSSforWindows, version 23 (SPSS Inc.).
RESULTS
Healthy control characteristics
Table 1 summarizes the age, blood counts, andplasma levels of AT, FII, FV, FVII, FX, Fg, FVIII, FIX, andFXI according to sex anduse of oral contraceptives.Concerning blood counts, hemoglobin levels,hematocrit, and red blood cell counts were sig-nificantly increased and platelet counts were sig-nificantly decreased in males compared with fe-males. AT levels proved to be significantly lowerin women than in men. Other coagulation fac-tors did not differ significantly between men andwomen. Women who take oral contraceptiveswere slightly younger compared with those whodo not. Oral contraceptive use resulted in signif-icantly higher levels of FII, FIX, and FX and lowerlevels of AT.
Correlations between TG assessed in PPP,PRP, and WB
TG parameters determined in PPP correlated sig-nificantly with the corresponding TG parameters de-termined in PRP and WB (Table 2 and Fig. 1 in theData Supplement that accompanies the onlineversionof this article at http://www.jalm.org/content/vol2/issue2). Highest correlations were observedbetween PPP and PRP, although lag time and Ttpeakwere systematically prolonged and peak levels wereincreased in PRP compared with those in PPP. Cor-relations between PPP and WB were significant andstronger in thepresenceofTF (Table2). A similar levelof significance was reached upon correlation of PRPandWB TG parameters (Table 2).
Determination of interindividual variabilityand reference intervals of TG
Subsequently, we determined the interindi-vidual variability (%CV) and reference intervals forall performed tests in 129 healthy volunteers, in-cluding blood counts; TG in PPP, PRP, andWB; andclotting factor determinations (Table 3). Medians,interquartile ranges (IQRs), and minimum and maxi-mumvalues of each parameter are indicated. For TGin the presence of TF, %CV of all parameters (apartfrom the VI) ranged between 10% and 27%. Inthe absence of TF, %CV of all parameters deter-mined inWBandPPP increased. For PPP at 5 pmol/LTF, TG was also determined in the presence of TMand APC, and reference intervals of the percentageof inhibition by TM and APC are shown in Table 3.%CVof the inhibition of the ETP/peak by APC/TMvar-ied from23%to34%.Ofnote, a goodcorrelationwasfoundbetween the% inhibitionof TGbyTMandAPC,for both the peak and ETP parameters (R = 0.7, seeFig. 1C in the online Data Supplement).
Effect of sex, oral contraceptive use, andage on TG parameters
The healthy population was further divided intomales (n = 66), females not taking oral contracep-
Thrombin Generation in a Healthy Population ARTICLES
September 2017 | 02:02 | 150–164 | JALM 153
...............................................................................................................

tives (n = 45), and females taking oral contracep-tives (n = 18). A trend toward a lower lag time infemales who did not take oral contraceptive com-pared with males was observed in PPP and WB,and a statistical significance was reached for PRP(Fig. 1). Concerning the effect of oral contraceptiveuse, the lag time (and similarly the Ttpeak, data notshown) was significantly reduced in females takingoral contraceptives compared with females who
did not take oral contraceptives and males, inplasma andWB (Fig. 1). In addition, oral contracep-tive use resulted in (significantly) increased ETPand peak values (and similarly VI, data not shown)in plasma and WB. In PPP, the % inhibition of thepeak and ETP by TM or APC was significantly re-duced in females compared with males, and thiseffect was even more pronounced in females tak-ing oral contraceptives (Fig. 2).
Table 1. General characteristics of 129 healthy individuals.
Based on sex All (n = 129) Women (n = 63) Men (n = 66) P valuesAge, years 32.0 (27.0–43.5) 32.0 (27.0–44.0) 31.0 (25.8–43.5) nsHemoglobin, mmol/L 9.0 (8.3–9.6) 8.4 (8.0–8.9) 9.5 (9.1–9.8) <0.0001Hematocrit, % 41.9 (39.0–44.0) 39.2 (37.6–41.6) 43.6 (42.0–45.3) <0.0001Red blood cell count, *1012/L 4.9 (4.5–5.1) 4.6 (4.4–4.9) 5.0 (4.8–5.2) <0.0001Platelet count, *109/L 315.7 (273.3–369.6) 332.2 (289.3–390.5) 295.4 (264.0–359.2) 0.004White blood cell count, *109/L 5.7 (5.0–6.7) 5.9 (5.1–7.0) 5.4 (4.8–6.5) nsAT (%) 117.0 (111.0–121.0) 114.0 (108.0–118.0) 119.0 (113.7–125.0) <0.0001FII (%) 114.0 (107.0–123.0) 114.0 (107.0–123.0) 114.0 (107.0–123.0) nsFV (%) 113.0 (99.0–126.0) 111.0 (98.0–123.0) 115.0 (100.2–130.0) nsFVII (%) 109.0 (96.5–129.5) 110.0 (98.0–133.0) 108.5 (96.0–127.0) nsFX (%) 108.0 (97.5–118.0) 105.0 (97.0–121.0) 108.5 (98.0–116.2) nsFibrinogen (g/L) 3.0 (2.7–3.5) 3.1 (2.7–3.7) 2.9 (2.7–3.4) nsFVIII (%) 117.0 (103.5–152.5) 117.0 (106.0–156.0) 117.5 (100.5–146.7) nsFIX (%) 124.0 (110.0–132.0) 124.0 (109.0–134.0) 124.0 (110.0–130.5) nsFXI (%) 110.0 (95.5–125.0) 110.0 (96.0–131.0) 109.0 (94.5–123.2) nsBased on sex andoral contraceptive use All (n = 63) No OC (n = 45) OC (n = 18) P values
Age, years 32.0 (27.0–44.0) 35.0 (28.0–49.5) 27.0 (23.8–30.8) 0.001Hemoglobin, mmol/L 8.4 (8.0–8.9) 8.5 (7.9–8.9) 8.2 (8.0–8.9) nsHematocrit, % 39.2 (37.6–41.6) 39.3 (37.7–41.7) 38.9 (37.3–41.7) nsRed blood cell count, *1012/L 4.6 (4.4–4.9) 4.6 (4.4–4.9) 4.6 (4.4–4.8) nsPlatelet count, *109/L 332.2 (289.3–390.5) 326.7 (291.5–383.4) 342.1 (273.1–396.6) nsWhite blood cell count, *109/L 5.9 (5.1–7.0) 6.1 (5.1–7.2) 5.8 (5.0–6.8) nsAT (%) 114.0 (108.0–118.0) 114.0 (111.0–119.5) 108.5 (105.7–114.0) 0.010FII (%) 114.0 (107.0–123.0) 111.0 (106.0–116.5) 128.0 (112.2–132.2) 0.001FV (%) 111.0 (98.0–123.0) 113.0 (100.0–126.0) 104.5 (91.2–116.2) nsFVII (%) 110.0 (98.0–133.0) 107.0 (98.5–124.0) 118.5 (91.7–135.2) nsFX (%) 105.0 (97.0–121.0) 102.0 (92.5–112.0) 123.0 (113.0–133.5) 0.0001Fibrinogen (g/L) 3.1 (2.7–3.7) 3.1 (2.7–3.7) 3.1 (2.7–3.7) nsFVIII (%) 117.0 (106.0–156.0) 119.0 (105.0–155.5) 115.0 (109.7–163.5) nsFIX (% 124.0 (109.0–134.0) 116.0 (104.5–127.0) 136.5 (121.2–144.0) 0.001FXI (%) 110.0 (96.0–131.0) 110.0 (96.0–126.0) 109.5 (91.0–136.2) ns
Medians and interquartile ranges (25%–75%) are indicated. P values are determined using the Mann–Whitney U-test; P-values <0.05 were consid-ered statistically significant.AT, antithrombin; F, factor; OC, oral contraceptives; ns, not significant.
ARTICLES Thrombin Generation in a Healthy Population
154 JALM | 150–164 | 02:02 | September 2017
...............................................................................................................

Agewas significantly (P <0.05) correlatedwith FV,FVII, and Fg levels [Spearman correlation coeffi-cient r = 0.388 (P <0.00001), 0.209 (P = 0.018),0.325 (P < 0.0005), respectively]. No significant cor-relations of TG parameters with age were ob-served (data not shown).
Dependence of TG parameters on the levelsof coagulation factors and inhibitors
Standardized regression coefficients and P val-ues for significant determinants of the indicatedTG parameters for different TF concentrations areshown in Table 4.
In the absence of TF, the lag time of TG in PPPand WB was mainly determined by Fg, FVIII, andFIX or FXI. The ETP and peak were mainly depen-dent on FII, FVIII, FIX, FXI (positive determinants),and AT (negative determinant). In the presenceof TF (1 and 5 pmol/L), the lag time was mainlydependent on AT, FVII, and Fg in plasma and WB.In PRP, FV additionally played a significant role.The ETP and peak at 1 pmol/L TF were mainlydependent on FII, FVIII, FIX, Fg (positive determi-nants) and AT, FV, and FVII (negative determi-nants). At high TF concentration, the ETP andpeak were mainly determined by FII, FXI, Fg (pos-itive determinants), and AT and FV (negativedeterminants).
Effect of blood group on thrombingeneration parameters
To determine the influence of blood group onthe parameters of the different TG assays, wedivided our population in individuals with bloodgroup O (n = 52) and non-O (n = 77). As expected,the peak and ETP were (significantly) lower inindividuals with the O blood group, in bothplasma and WB (Fig. 2 in the online Data Supple-ment). Observing the clotting factor determina-tions, this decrease in TG was accompanied withsignificantly lower levels of FVIII and FXI (Fig. 2C inthe online Data Supplement). Furthermore,there was a tendency for reduced levels of FIX inthe O population (P = 0.053).
DISCUSSION
TG according to the CATmethodwas introducedin 2002 for plasma and 2012 for WB, paving theway for near-patient TG testing (2, 8). Meanwhile,this CAT method has been adopted in researchlaboratories worldwide and proved to be a valu-able tool to diagnose and monitor patients at riskfor bleeding/thrombosis (3, 13–16). In this study,we determined interindividual variability and refer-ence intervals of TG parameters in PPP, PRP, andWB of 129 healthy volunteers.
Table 2. Correlation with TG parameters determined in PPP (or PRP#) at the indicated TFconcentration.
TF (pM) Assay ETP (nM.min)a Peak (nM)a Lag time (min)a Ttpeak (min)a VI (nM/min)a
0 WB (0 pmol/L) 0.587**** 0.377**** 0.195* 0.281** 0.361****1 PRP (1 pmol/L TF) 0.848**** 0.603**** 0.736**** 0.690**** 0.599****
WB (0.5 pmol/L) 0.630**** 0.435**** 0.502**** 0.566**** 0.465****1# WB (0.5 pmol/L) 0.517**** 0.325*** 0.574**** 0.651**** 0.482****5 WB (2.5 pmol/L) 0.633**** 0.523**** 0.463**** 0.550**** 0.441****
a Spearman correlation coefficients are shown. All correlations are statistically significant (*P < 0.05; **P < 0.01; ***P < 0.001; ****P < 0.0001).# Correlation with TG parameters determined in PRP at 1 pM TF.ETP, endogenous thrombin potential; PPP, platelet-poor plasma; PRP, platelet-rich plasma; TF, tissue factor; TG, thrombin generation; Ttpeak,time-to-peak; VI, velocity index; WB, whole blood.
Thrombin Generation in a Healthy Population ARTICLES
September 2017 | 02:02 | 150–164 | JALM 155
...............................................................................................................
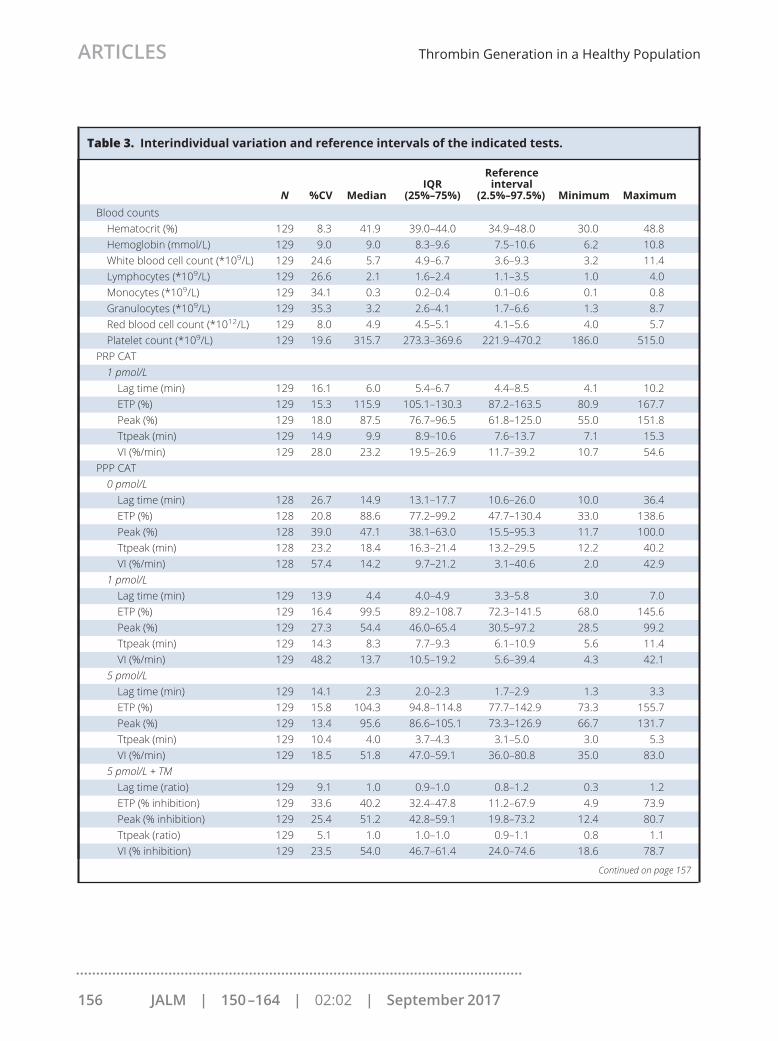
Table 3. Interindividual variation and reference intervals of the indicated tests.
N %CV MedianIQR
(25%–75%)
Referenceinterval
(2.5%–97.5%) Minimum MaximumBlood countsHematocrit (%) 129 8.3 41.9 39.0–44.0 34.9–48.0 30.0 48.8Hemoglobin (mmol/L) 129 9.0 9.0 8.3–9.6 7.5–10.6 6.2 10.8White blood cell count (*109/L) 129 24.6 5.7 4.9–6.7 3.6–9.3 3.2 11.4Lymphocytes (*109/L) 129 26.6 2.1 1.6–2.4 1.1–3.5 1.0 4.0Monocytes (*109/L) 129 34.1 0.3 0.2–0.4 0.1–0.6 0.1 0.8Granulocytes (*109/L) 129 35.3 3.2 2.6–4.1 1.7–6.6 1.3 8.7Red blood cell count (*1012/L) 129 8.0 4.9 4.5–5.1 4.1–5.6 4.0 5.7Platelet count (*109/L) 129 19.6 315.7 273.3–369.6 221.9–470.2 186.0 515.0
PRP CAT1 pmol/LLag time (min) 129 16.1 6.0 5.4–6.7 4.4–8.5 4.1 10.2ETP (%) 129 15.3 115.9 105.1–130.3 87.2–163.5 80.9 167.7Peak (%) 129 18.0 87.5 76.7–96.5 61.8–125.0 55.0 151.8Ttpeak (min) 129 14.9 9.9 8.9–10.6 7.6–13.7 7.1 15.3VI (%/min) 129 28.0 23.2 19.5–26.9 11.7–39.2 10.7 54.6
PPP CAT0 pmol/LLag time (min) 128 26.7 14.9 13.1–17.7 10.6–26.0 10.0 36.4ETP (%) 128 20.8 88.6 77.2–99.2 47.7–130.4 33.0 138.6Peak (%) 128 39.0 47.1 38.1–63.0 15.5–95.3 11.7 100.0Ttpeak (min) 128 23.2 18.4 16.3–21.4 13.2–29.5 12.2 40.2VI (%/min) 128 57.4 14.2 9.7–21.2 3.1–40.6 2.0 42.9
1 pmol/LLag time (min) 129 13.9 4.4 4.0–4.9 3.3–5.8 3.0 7.0ETP (%) 129 16.4 99.5 89.2–108.7 72.3–141.5 68.0 145.6Peak (%) 129 27.3 54.4 46.0–65.4 30.5–97.2 28.5 99.2Ttpeak (min) 129 14.3 8.3 7.7–9.3 6.1–10.9 5.6 11.4VI (%/min) 129 48.2 13.7 10.5–19.2 5.6–39.4 4.3 42.1
5 pmol/LLag time (min) 129 14.1 2.3 2.0–2.3 1.7–2.9 1.3 3.3ETP (%) 129 15.8 104.3 94.8–114.8 77.7–142.9 73.3 155.7Peak (%) 129 13.4 95.6 86.6–105.1 73.3–126.9 66.7 131.7Ttpeak (min) 129 10.4 4.0 3.7–4.3 3.1–5.0 3.0 5.3VI (%/min) 129 18.5 51.8 47.0–59.1 36.0–80.8 35.0 83.0
5 pmol/L + TMLag time (ratio) 129 9.1 1.0 0.9–1.0 0.8–1.2 0.3 1.2ETP (% inhibition) 129 33.6 40.2 32.4–47.8 11.2–67.9 4.9 73.9Peak (% inhibition) 129 25.4 51.2 42.8–59.1 19.8–73.2 12.4 80.7Ttpeak (ratio) 129 5.1 1.0 1.0–1.0 0.9–1.1 0.8 1.1VI (% inhibition) 129 23.5 54.0 46.7–61.4 24.0–74.6 18.6 78.7
Continued on page 157
ARTICLES Thrombin Generation in a Healthy Population
156 JALM | 150–164 | 02:02 | September 2017
...............................................................................................................

Our study is the first to measure TG in PPP, PRP,and WB in such a large healthy population. Asshown previously, increasing the TF concentrationin PPP was associated with increases in peak TGconcentration and decreases in lag time (17). In
this study and our previous findings (8), similarconclusionswere reached forWB. Therewere signif-icant correlations between TG determined in PPPand PRP. Although less pronounced, significant cor-relations were also found between TG in PPP/PRP
Table 3. Interindividual variation and reference intervals of the indicated tests. (Continued from page156)
N %CV MedianIQR
(25%–75%)
Referenceinterval
(2.5%–97.5%) Minimum Maximum5 pmol/L + APCLag time (ratio) 129 11.0 1.6 1.5–1.7 1.3–2.0 1.3 2.4ETP (% inhibition) 129 29.4 30.7 25.3–38.7 12.2–48.6 6.0 57.5Peak (% inhibition) 129 22.8 36.4 31.1–43.2 16.6–51.7 14.4 62.2Ttpeak (ratio) 129 7.0 1.3 1.3–1.4 1.2–1.5 1.2 1.7VI (% inhibition) 129 28.3 35.6 27.3–41.6 14.6–54.1 9.4 58.0
WB CAT0 pmol/LLag time (min) 128 22.0 7.2 6.4–8.2 4.4–11.0 2.9 13.2ETP (%) 128 22.4 98.2 84.4–110.3 64.9–156.7 56.9 172.1Peak (%) 128 29.2 98.6 80.6–116.4 52.4–165.4 39.5 186.5Ttpeak (min) 128 20.6 13.2 11.6–15.0 9.2–20.8 8.8 23.7VI (%/min) 128 48.1 16.5 11.7–22.1 5.4–41.5 4.2 42.5
0.5 pmol/LLag time (min) 128 13.2 3.9 3.5–4.3 3.0–5.0 2.9 5.3ETP (%) 128 22.5 96.7 82.9–112.6 61.0–151.2 58.6 176.3Peak (%) 128 20.0 96.6 85.2–112.8 64.1–145.1 58.2 155.4Ttpeak (min) 128 10.2 6.4 5.9–6.8 5.2–7.8 4.9 8.0VI (%/min) 128 20.4 40.3 34.2–47.2 25.8–61.3 24.3 64.8
2.5 pmol/LLag time (min) 128 13.3 2.0 1.8–2.1 1.5–2.6 1.0 2.7ETP (%) 128 22.9 99.0 83.5–113.7 59.7–155.9 53.6 170.2Peak (%) 128 19.2 96.8 87.7–111.9 61.2–142.0 54.1 147.6Ttpeak (min) 128 9.6 3.7 3.5–3.9 3.1–4.6 2.6 4.9VI (%/min) 128 19.2 57.1 50.6–64.9 37.1–85.1 29.9 94.5
Clotting factor determinationsAT (%) 129 7.8 117.0 111.0–121.0 98.0–137.0 93.0 147.0FII (%) 129 11.3 114.0 107.0–123.0 89.7–142.7 86.0 170.0FV (%) 129 19.3 113.0 99.0–126.0 71.5–162.0 62.0 193.0FVII (%) 129 21.0 109.0 96.5–129.5 71.2–163.0 45.0 174.0FX (%) 129 14.0 108.0 97.5–118.0 76.5–137.7 75.0 146.0Fg (g/L) 128 21.8 3.0 2.7–3.5 1.8–4.5 1.7 5.9FVIII (%) 129 30.2 117.0 103.5–152.5 75.5–236.7 58.0 275.0FIX (%) 129 14.4 124.0 110.0–132.0 93.5–156.0 78.0 199.0FXI (%) 129 19.0 110.0 95.5–125.0 64.5–150.5 42.0 165.0
AT, antithrombin; CAT, calibrated automated thrombography; ETP, endogenous thrombin potential; F, factor; Fg, fibrinogen; IQR, interquartile range;PPP, platelet-poor plasma; PRP, platelet-rich plasma; Ttpeak, time-to-peak; VI, velocity index; WB, whole blood.
Thrombin Generation in a Healthy Population ARTICLES
September 2017 | 02:02 | 150–164 | JALM 157
...............................................................................................................

and WB. Interindividual variability of TG in WB wascomparable with that of plasma and varied in thepresence of TF between 10% to 27% (not taking theVI intoaccount). Results inPPPandPRPcorrelatewellwith previous studies (7). As expected by the contri-bution of platelets to coagulation, the peak/ETP washigher in PRP than in PPP. It was shown that the lagtime increased inPRPcomparedwith that inPPPand
WB, probably because in PRP, TG is dependent onthe activation of platelets for exposing theprocoagu-lant phospholipid surface. In contrast, inWB, the redbloodcells provide sufficientprocoagulantphospho-lipids for optimal TG (8).Reference intervals in this study were deter-
mined according to the recommendations of theCLSI (12). These reference intervals will serve as
Fig. 1. Effect of sex and oral contraceptive use on TG parameters determined in PPP, PRP, and WB.TGwas determined in PPP (A; 1 pMTF), PRP (B; 1 pMTF), andWB (C; 0.5 pMTF) of 129 healthy control volunteers, as describedin Materials and Methods. The lag time, peak values, and ETP values of the resulting thrombograms are shown for thedifferent groups, including males (n = 66), females not taking oral contraceptives (n = 45), and females taking oral contra-ceptives (n = 18). Mean and SE are indicated. The gray areas delineated by the dotted lines represent the reference intervalsof the total population (2.5 percentile–97.5 percentile) (OC = oral contraceptives). Statistical significance is indicated asfollows: *P < 0.05; **P < 0.01; ***P < 0.001 using the Mann–Whitney U-test.
ARTICLES Thrombin Generation in a Healthy Population
158 JALM | 150–164 | 02:02 | September 2017
...............................................................................................................

guidance for identifying patients at risk for bleed-ing and thrombosis. It is important to note thatpreanalytical and analytical variables affect TG re-sults; these include plasma preparation, contactactivation, reagent sources, and concentrations(most notably TF and phospholipids) (18–20).Therefore, we emphasize that each laboratoryshould validate these reference intervals. Valida-tion is typically performed in 20 normal individuals,and if no more than 2 results are outside our pro-posed reference intervals, a laboratory may adoptour proposed reference intervals (12).The studied population reflects a normal healthy
population of adults. About 50% of the cohort was
female, of which about 30% used oral contracep-tives. The differences in hemoglobin levels, hemat-ocrit, red blood cell, and platelet count betweenfemales andmaleswere similar to those previouslyreported (21). In agreement with the NorthwickPark Heart study (22), AT levels were found to belower in females than in males, and this differencewas observed independent of oral contraceptiveuse (data not shown). Analyzing the subgroups inour population, we clearly showed that oral contra-ceptive use increases TG in PPP, PRP, and WB, andthis effect is in correlationwith the increased risk ofvenous thrombosis after oral contraceptive use (23).This prothrombotic effect of oral contraceptives,
Fig. 2. Effect of sex and oral contraceptive use on the inhibition of TG by TM and APC.TG was determined in PPP of 129 healthy volunteers in the absence and presence of TM and APC (5 pM TF). The % inhibitionof the peak and ETPby TM (A) andAPC (B)was calculated for thedifferent groups, includingmales (n=66), femalesnot takingoralcontraceptives (n = 45), and females taking oral contraceptives (n = 18). Mean and SE are indicated. The gray areas delineated bythedotted lines represent the reference intervalsof the totalpopulation (2.5percentile–97.5percentile) (OC=oral contraceptives).Statistical significance is indicated as follows: *P < 0.05; **P < 0.01; ***P < 0.001 using the Mann–Whitney U test.
Thrombin Generation in a Healthy Population ARTICLES
September 2017 | 02:02 | 150–164 | JALM 159
...............................................................................................................

even in the absence of added APC or TM, has beenpreviously shown (24). The increase in TG in fe-males taking oral contraceptives is most probablybecause of significantly higher levels of plasma FII,FX, and FIX and lower levels of plasma AT. Oralcontraceptive intake was previously shown to in-
duce a decrease in AT (25). The inhibitory effect ofTM and APC on TG proved to be significantly lowerin females than in males, and this effect was morepronounced upon intake of oral contraceptives.The higher inhibitory effect of TM/APC in malesmay be explained by their higher levels of protein S
Table 4. Determinants of TG parameters in PPP/PRP/WB triggered with different concentrationsof TF.
LT ETP Peak
Factor Beta P value Factor Beta P value Factor Beta P valueno TFPPP FVIII −0.278 0.003 AT −0.427 <0.001 AT −0.293 0.001
FIX −0.286 0.016 FII 0.555 <0.001 FII 0.340 0.001Fg 0.344 0.001 FVIII 0.168 0.013 FVIII 0.233 0.003
FXI 0.165 0.017 FIX 0.247 0.014WB FVIII −0.225 0.016 AT −0.300 0.001 AT −0.204 0.038
FXI −0.205 0.031 FII 0.599 <0.001 FII 0.307 0.012Fg 0.314 0.002 FXI 0.236 0.005 FXI 0.221 0.020
1 pmol/L TFPPP AT 0.292 0.003 AT −0.419 <0.001 AT −0.353 <0.001
FVII −0.205 0.041 FII 0.698 <0.001 FII 0.525 <0.001Fg 0.298 0.003 FV −0.229 <0.001 FV −0.370 <0.001
FXI 0.281 <0.001 FVIII 0.289 <0.001FIX 0.179 0.039
PRP AT 0.237 0.008 AT −0.456 <0.001 AT −0.366 <0.001FV 0.231 0.010 FII 0.734 <0.001 FII 0.577 <0.001Fg 0.348 <0.001 FV −0.234 <0.001 FV −0.310 <0.001
FVII −0.132 0.039 FVII −0.248 0.004FXI 0.214 <0.001Fg 0.170 0.007
WB AT 0.223 0.027 AT −0.277 0.002 AT −0.187 0.040Fg 0.297 0.004 FII 0.540 <0.001 FII 0.492 <0.001
FXI 0.259 0.003 FV −0.181 0.045FXI 0.284 0.001
5 pmol/L TFPPP AT 0.237 0.018 AT −0.373 <0.001 AT −0.196 0.002
FVII −0.255 0.014 FII 0.679 <0.001 FII 0.687 <0.001FV −0.211 0.002 FV −0.388 <0.001FXI 0.314 <0.001 FXI 0.194 0.001Fg 0.140 0.039 Fg 0.142 0.022
WB AT 0.207 0.039 AT −0.285 0.002 FII 0.384 0.001FVII −0.205 0.049 FII 0.466 <0.001 FXI 0.329 <0.001Fg 0.372 <0.001 FXI 0.312 <0.001
Data are expressed as standardized regression coefficients (beta) with P values.Only significant factors are shown.AT, antithrombin; F, factor; Fg, fibrinogen; PPP, platelet-poor plasma; PRP, platelet-rich plasma; TF, tissue factor; TG, thrombin generation;WB,whole blood.
ARTICLES Thrombin Generation in a Healthy Population
160 JALM | 150–164 | 02:02 | September 2017
...............................................................................................................

(26). The induction of APC resistance by oral con-traceptive use has been shown previously (27, 28).Differential effects of second-/third-generationoral contraceptives were reported, but our popu-lation was not powered to draw conclusions onthis point. Of note, despite the observed differ-ences induced by oral contraceptive usage, mostmeasurements remain within the referenceranges because these were determined on the to-tal population. The reference ranges would be nar-rower if we only selected healthy volunteers withoutoral contraceptive usage. However, in our view, indi-viduals taking oral contraceptives should also beconsidered as being healthy and therefore part ofthe reference ranges.In accordance with other studies, we found that
the contribution of several clotting factors to TG isinfluenced by the TF concentration (29). Althoughthe main determinants for TG were found to besimilar in WB, PRP, and PPP, subtle differenceswere observed and may be explained by the pres-ence and active contribution of cells. FXII, free pro-tein S, protein C, and tissue factor pathwayinhibitor (TFPI) levels have previously been shownto influence TG, but these quantitative determina-tions were outside the scope of our study. ProteinsC and S are well known for their natural anticoag-ulant function in hemostasis and abnormalities areassociated with an increased risk of thrombosis.Aside from genetic defects affecting the protein Csystem, multiple mechanisms and/or drugs canlead to acquired deficiencies of these proteins, in-cluding oral anticoagulation [reviewed in (30)]. Ofnote, by adding exogenously TM or APC to the TGtest, we showed that different activities of the pro-tein C pathway affect the TG, exemplified by theincreased APC resistance and thereby thrombingeneration in volunteers taking oral contracep-tives. In our study, 2 important determinants of theETP and peak in PPP and PRP, as well as in WB,proved to be FII and AT, irrespective of the TF con-centration. Previous studies similarly reported FIIand AT as the strongest determinants of the ETP at
high TF concentration but showed an importantrole for fibrinogen and TFPI at low TF concentra-tions (31). The peak and ETP of TG are also influ-enced by FVIII, FIX, and/or FXI. The procoagulanteffect of FVIII is important when TG is triggered inthe absence/presence of a low TF concentration.FXI seems to bemore important at high TF concen-trations. At high TF concentration, FXI is activatedby thrombin or another protease and is able tocontribute to sustained TG through activation ofFIX (32, 33). Recently, FXI levels were found to cor-relate with TG in PPP and PRP, even at high TFconcentrations (34).Interestingly, at both 1 and 5 pmol/L TF, an inhib-
itory effect of FV on the peak and ETP in PPP andPRP was observed. In WB, this anticoagulant effectof FV is only seen at 0.5 pmol/L TF for the peak. Theinhibitory effect of FV corresponds with previousstudies reporting that FVa inhibits the TF/FVIIacomplex to activate FX and FIX (35, 36). The re-ported mechanism of inhibition further explainswhy the anticoagulant effect of FV is not observedwhen TG is triggered in the absence of TF.Looking at the lag time of TG, the strongest
determinant in the absence or presence of a lowTF concentration appeared to be fibrinogen.Duchemin et al. also described a lengthening ofthe lag time with increasing fibrinogen levels (29).In whole blood, this effect was further extended tohigh TF concentrations. At high TF concentrationsin PPP, fibrinogen additionally is a determinant ofthe ETP and peak. This correlates with previouslypublished data reporting that both the ETP andpeak increase progressively with increasing fibrin-ogen concentrations (7, 29, 37). A possible expla-nation for the procoagulant effect of fibrinogenconsists of its interference with the binding ofthrombin to its inhibitors (37). At high TF concen-trations, FVII and AT were strong determinants ofthe lag time, as previously reported for FVII (31).We further confirmed that individuals with blood
group O are characterized by a significantly lowerTG compared with non-O individuals in PPP, PRP,
Thrombin Generation in a Healthy Population ARTICLES
September 2017 | 02:02 | 150–164 | JALM 161
...............................................................................................................

andWB (38). This reduction in TG can be explainedby significantly reduced levels of FVIII and FXI, and atrend toward reduced levels of FIX. The associationbetween TG and the phenotype of the ABO bloodgroup corresponds with epidemiological studiesshowing a relative risk of thrombosis of 0.65 in theO group compared with 1.15 in the non-O groups,whereas the bleeding risk in the O group is signifi-cantly higher than that in the non-O group (39, 40).To conclude, this is the first study that compares
TG in plasma and WB in such a large healthy co-hort. Reference intervals for TG parameters wereestablished in our healthy population, and a clear
effect of sex, oral contraceptive use, and bloodgroup was demonstrated. In our view, the rela-tively high interindividual variability in thrombin-generating capacity is important to take intoaccount before implementation of TG assays intoclinical practice. To determine the ability of TG todifferentiate between health and different diseasestates, we recently started a large prospective clin-ical study. Finally, the significant correlations be-tween TG in plasma and WB (including clottingfactor determinants), suggest that WB TG can bereliably used in clinic, paving the way for point-of-care applications of TG.
Author Contributions: All authors confirmed they have contributed to the intellectual content of this paper and have met thefollowing 4 requirements: (a) significant contributions to the conception and design, acquisition of data, or analysis and interpre-tation of data; (b) drafting or revising the article for intellectual content; (c) final approval of the published article; and (d)agreement to be accountable for all aspects of the article thus ensuring that questions related to the accuracy or integrity of anypart of the article are appropriately investigated and resolved.
Authors’ Disclosures or Potential Conflicts of Interest:Uponmanuscript submission, all authors completed the author disclosure form.
Role of Sponsor: No sponsor was declared.
Acknowledgments:Wewould like to thank S. Zwaveling and C. Kicken for their helpwith blood drawings. Finally, we thank AsahiKasei Pharma (Japan) and Veronique Regnault (France) for the kind gift of recombinant human TM and APC, respectively.
REFERENCES1. Al Dieri R, de Laat B, Hemker HC. Thrombin generation:
what have we learned? Blood Rev 2012;26:197–203.2. Hemker HC, Giesen P, AlDieri R, Regnault V, de Smed E,
Wagenvoord R, et al. The calibrated automatedthrombogram (CAT): a universal routine test for hyper- andhypocoagulability. Pathophysiol Haemost Thromb 2002;32:249–53.
3. Tripodi A. Thrombin generation assay and its applicationin the clinical laboratory. Clin Chem 2016;62:699–707.
4. Mancuso ME, Chantarangkul V, Clerici M, Fasulo MR,Padovan L, Scalambrino E, et al. The thrombin
generation assay distinguishes inhibitor from non-inhibitor patients with severe haemophilia A.Haemophilia 2016;22:e286–91.
5. Hemker HC. The application of thrombin generation inreal life clinical situations. Thromb Res 2015;136:3–4.
6. Bosch YP, Al Dieri R, ten Cate H, Nelemans PJ, Bloemen S,de Laat B, et al. Measurement of thrombin generationintra-operatively and its association with bleeding tendencyafter cardiac surgery. Thromb Res 2014;133:488–94.
7. Hemker HC, Giesen P, Al Dieri R, Regnault V, de Smedt E,Wagenvoord R, et al. Calibrated automated thrombin
Additional Content on this Topic
Near-Patient Thrombin Generation in Patients Undergoing Elective Cardiac SurgeryMartijn Moorlag, Evelien Schurgers, Ganeshram Krishnamoorthy, Anne Bouwhuis, et al. J Appl Lab Med2017;1:613–25Thrombin Generation Assay and Its Application in the Clinical LaboratoryArmando Tripodi. Clin Chem. 2016;62:699–707
ARTICLES Thrombin Generation in a Healthy Population
162 JALM | 150–164 | 02:02 | September 2017
...............................................................................................................

generation measurement in clotting plasma.Pathophysiol Haemost Thromb 2003;33:4–15.
8. Ninivaggi M, Apitz-Castro R, Dargaud Y, de Laat B, HemkerHC, Lindhout T. Whole-blood thrombin generationmonitored with a calibrated automated thrombogram-based assay. Clin Chem 2012;58:1252–9.
9. Dargaud Y, Wolberg AS, Luddington R, Regnault V,Spronk H, Baglin T, et al. Evaluation of a standardizedprotocol for thrombin generation measurement usingthe calibrated automated thrombogram: an internationalmulticentre study. Thromb Res 2012;130:929–34.
10. Loeffen R, Kleinegris MC, Loubele ST, Pluijmen PH, Fens D,van Oerle R, et al. Preanalytic variables of thrombingeneration: towards a standard procedure and validationof the method. J Thromb Haemost 2012;10:2544–54.
11. Hemker HC, Kremers R. Data management in thrombingeneration. Thromb Res 2013;131:3–11.
12. CLSI. Defining, Establishing and Verifying Reference Intervalsin the Clinical Laboratory; Approved Guideline–Third Edition.CLSI document EP28-A3c. Wayne, PA: Clinical andLaboratory Standards Institute; 2008;28:1–76.
13. Hemker HC, Al Dieri R, De Smedt E, Béguin S. Thrombingeneration, a function test of the haemostatic-thrombotic system. Thromb Haemost 2006;96:553–61.
14. Simioni P, Castoldi E, Lunghi B, Tormene D, Rosing J,Bernardi F. An underestimated combination of oppositesresulting in enhanced thrombotic tendency. Blood 2005;106:2363–5.
15. Dargaud Y, Trzeciak MC, Bordet JC, Ninet J, Negrier C. Useof calibrated automated thrombinography +/−thrombomodulin to recognise the prothromboticphenotype. Thromb Haemost 2006;96:562–7.
16. Brandts A, van Hylckama Vlieg A, Rosing J, Baglin TP,Rosendaal FR. The risk of venous thrombosis associatedwith a high endogenous thrombin potential in theabsence and presence of activated protein C. J ThrombHaemost 2007;5:416–8.
17. Chantarangkul V, Clerici M, Bressi C, Giesen PL, Tripodi A.Thrombin generation assessed as endogenous thrombinpotential in patients with hyper- or hypo-coagulability.Haematologica 2003;88:547–54.
18. Dargaud Y, Luddington R, Gray E, Negrier C, Lecompte T,Petros S, et al. Effect of standardization andnormalization on imprecision of calibrated automatedthrombography: an international multicentre study. Br JHaematol 2007;139:303–9.
19. Spronk HM, Dielis AW, De Smedt E, van Oerle R, Fens D,Prins MH, et al. Assessment of thrombin generation II:validation of the Calibrated Automated Thrombogram inplatelet-poor plasma in a clinical laboratory. ThrombHaemost 2008;100:362–4.
20. Gerotziafas GT, Depasse F, Busson J, Leflem L, Elalamy I,SamamaMM. Towards a standardization of thrombingeneration assessment: the influence of tissue factor,platelets and phospholipids concentration on the normalvalues of Thrombogram-Thrombinoscope assay. Thromb J2005;3:16.
21. Wakeman L, Al-Ismail S, Benton A, Beddall A, Gibbs A,
Hartnell S, et al. Robust, routine haematology referenceranges for healthy adults. Int J Lab Hematol2007;29:279–83.
22. Meade TW, Dyer S, Howarth DJ, Imeson JD, Stirling Y.Antithrombin III and procoagulant activity: sexdifferences and effects of the menopause. Br J Haematol1990;74:77–81.
23. Rosendaal FR, Helmerhorst FM, Vandenbroucke JP.Female hormones and thrombosis. Arterioscler ThrombVasc Biol 2002;22:201–10.
24. Rotteveel RC, Roozendaal KJ, Eijsman L, Hemker HC. Theinfluence of oral contraceptives on the time-integral ofthrombin generation (thrombin potential). ThrombHaemost 1993;70:959–62.
25. Franchi F, Biguzzi E, Martinelli I, Bucciarelli P, Palmucci C,D'Agostino S, Peyvandi F. Normal reference ranges ofantithrombin, protein C and protein S: effect of sex, ageand hormonal status. Thromb Res 2013;132:e152–7.
26. Koenen RR, Christella M, Thomassen LG, Tans G, RosingJ, Hackeng TM. Effect of oral contraceptives on theanticoagulant activity of protein S in plasma. ThrombHaemost 2005;93:853–9.
27. Curvers J, Thomassen MC, Rimmer J, Hamulyak K, van derMeer J, Tans G, et al. Effects of hereditary and acquiredrisk factors of venous thrombosis on a thrombingeneration-based APC resistance test. Thromb Haemost2002;88:5–11.
28. Tchaikovski SN, van Vliet HA, Thomassen MC, Bertina RM,Rosendaal FR, Sandset PM, et al. Effect of oralcontraceptives on thrombin generation measured viacalibrated automated thrombography. Thromb Haemost2007;98:1350–6.
29. Duchemin J, Pan-Petesch B, Arnaud B, Blouch MT, AbgrallJF. Influence of coagulation factors and tissue factorconcentration on the thrombin generation test inplasma. Thromb Haemost 2008;99:767–73.
30. Esmon CT, Vigano-D'Angelo S, D'Angelo A, Comp PC.Anticoagulation proteins C and S. Adv Exp Med Biol1987;214:47–54.
31. Dielis AW, Castoldi E, Spronk HM, van Oerle R, HamulyakK, Ten Cate H, Rosing J. Coagulation factors and theprotein C system as determinants of thrombingeneration in a normal population. J Thromb Haemost2008;6:125–31.
32. Kravtsov DV, Matafonov A, Tucker EI, Sun MF, Walsh PN,Gruber A, Gailani D. Factor XI contributes to thrombingeneration in the absence of factor XII. Blood 2009;114:452–8.
33. Naito K, Fujikawa K. Activation of human blood coagulationfactor XI independent of factor XII. Factor XI is activated bythrombin and factor XIa in the presence of negativelycharged surfaces. J Biol Chem 1991;266:7353–8.
34. Pike GN, Cumming AM, Hay CR, Bolton-Maggs PH,Burthem J. Sample conditions determine the ability ofthrombin generation parameters to identify bleedingphenotype in FXI deficiency. Blood 2015;126:397–405.
35. Al Dieri R, Bloemen S, Kelchtermans H, Wagenvoord R,Hemker HC. A new regulatory function of activated factor
Thrombin Generation in a Healthy Population ARTICLES
September 2017 | 02:02 | 150–164 | JALM 163
...............................................................................................................

V: inhibition of the activation by tissue factor/factor VII(a)of factor X. J Thromb Haemost 2013;11:503–11.
36. Huskens D, Vries M, Konings J, Wagenvoord R, BloemenS, Dieri RA, et al. Activated factor V inhibits the activationof factor IX by tissue factor/factor VIIa complex. J ThrombHaemost 2015;13:314.
37. Kremers RM, Wagenvoord RJ, Hemker HC. The effect offibrin(ogen) on thrombin generation and decay. ThrombHaemost 2014;112:486–94.
38. Kremers RM, Mohamed AB, Pelkmans L, Hindawi S,
Hemker HC, de Laat HB, et al. Thrombin generatingcapacity and phenotypic association in ABO bloodgroups. PLoS One 2015;10:e0141491.
39. Dentali F, Sironi AP, Ageno W, Bonfanti C, Crestani S,Frattini F, et al. Relationship between ABO blood groupand hemorrhage: a systematic literature review andmeta-analysis. Semin Thromb Hemost 2013;39:72–82.
40. Franchini M, Favaloro EJ, Targher G, Lippi G. ABO bloodgroup, hypercoagulability, and cardiovascular and cancerrisk. Crit Rev Clin Lab Sci 2012;49:137–49.
ARTICLES Thrombin Generation in a Healthy Population
164 JALM | 150–164 | 02:02 | September 2017
...............................................................................................................