Interim Unaudited Financial Statements 30 September … statement of comprehensive income 1...
23
(Incorporated in Malaysia) Interim Unaudited Financial Statements 30 September 2013
Transcript of Interim Unaudited Financial Statements 30 September … statement of comprehensive income 1...

(Incorporated in Malaysia)
Interim Unaudited Financial Statements
30 September 2013

CONTENTS
PAGE
CONSOLIDATED STATEMENT OF COMPREHENSIVE INCOME 1
CONSOLIDATED STATEMENT OF FINANCIAL POSITION 2
CONSOLIDATED STATEMENT OF CHANGES IN EQUITY 3
CONSOLIDATED STATEMENT OF CASH FLOWS 4 – 5
EXPLANATORY NOTES PURSUANT TO MALAYSIAN
FINANCIAL REPORTING STANDARD 134
6 – 11
EXPLANATORY NOTES PURSUANT TO APPENDIX 9B (RULE
9.22(2)) OF THE LISTING REQUIREMENTS OF BURSA MALAYSIA
SECURITIES BERHAD (“BURSA SECURITIES”)
12– 21

-1-
CONSOLIDATED STATEMENT OF COMPREHENSIVE INCOME FOR THE THREE-MONTH PERIOD ENDED 30 SEPTEMBER 2013
Note
30 SEPT
2013
30 SEPT
2012
30 SEPT
2013
30 SEPT
2012
RM'000 RM'000 RM'000 RM'000
Revenue 10 40,816 56,670 105,875 113,011
Cost of sales (30,064) (47,430) (73,536) (88,129)
- Depreciation (8,008) (10,536) (24,048) (31,293)
- Others (22,056) (36,894) (49,488) (56,836)
Gross profit 10,752 9,240 32,339 24,882
Other income 193 125 1,190 1,007
Administrative expenses (5,965) (6,670) (18,143) (19,050)
- Depreciation (493) (579) (1,482) (1,814)
- Others (5,472) (6,091) (16,661) (17,236)
Selling and marketing expenses (776) (808) (1,377) (1,557)
Other (expenses)/gain, net (728) 2,222 (3,197) 4,690
Operating profit 3,476 4,109 10,812 9,972
Finance costs (2,222) (2,334) (6,202) (7,190)
Share of results of associates - (217) 718 (509)
Profit before tax 1,254 1,558 5,328 2,273
Income tax expense 21 (427) (86) (439) (96)
Profit for the period 827 1,472 4,889 2,177
Other comprehensive income/(loss), net of tax
Item that may be subsequently reclassified to profit or
loss:- Foreign currency translation, representing other
- comprehensive income/(loss) for the period 3,980 (7,449) 9,848 (7,701)
Total comprehensive income/(loss) 4,807 (5,977) 14,737 (5,524)
Profit attributable to:
Owners of the parent 946 1,505 5,217 2,104
Non-controlling interests (119) (33) (328) 73
827 1,472 4,889 2,177
Total comprehensive income/(loss) attributable to:
Owners of the parent 4,623 (4,699) 14,338 (4,417)
Non-controlling interests 184 (1,278) 399 (1,107)
4,807 (5,977) 14,737 (5,524)
Earnings per share attributable to owners of the
parent:
Basic, for profit for the period (sen) 27 0.08 0.13 0.45 0.18
Diluted, for profit for the period (sen) 27 0.08 0.13 0.45 0.18
3 MONTHS ENDED 9 MONTHS ENDED

-2-
CONSOLIDATED STATEMENT OF FINANCIAL POSITION AS AT 30 SEPTEMBER 2013
AS AT AS AT
Note 30 SEPT 2013 31 DEC 2012
RM'000 RM'000
ASSETS
Non-current assets
Property, plant and equipment 11 105,940 107,841
Investments in jointly controlled entities - 244
Investments in associates 127 585
Development costs 444 464
Other receivables 199 346
Gaming licenses 474 446
107,184 109,926
Current assets
Inventories 1,595 8,043
Trade Receivables 53,215 62,088
Other Receivables 10,452 9,905
Assets of disposal group classified as held for sale 7,471 7,364
Tax Recoverable 358 188
Due from associates 2,583 2,405
Deposits with licensed banks 9,226 4,608
Cash and bank balances 26,683 26,030
111,583 120,631
TOTAL ASSETS 218,767 230,557
EQUITY AND LIABILITIES
Equity attributable to owners of the parent
Share capital 8 115,486 115,119
Share premium 14,389 14,373
Foreign exchange translation reserve (21,066) (30,187)
Share option reserve 464 376
Accumulated losses (34,968) (40,185)
74,305 59,496
Non-controlling interests 9,428 9,027
Total equity 83,733 68,523
Non-current liabilities
Borrowings 23 49,576 65,084
Deferred tax liabilities 195 195
49,771 65,279
Current liabilities
Borrowings 23 27,969 25,247
Trade payables 31,609 48,831
Other payables 24,355 20,500
Liabilities of disposal group classified as held for sale 362 550
Due to jointly controlled entities - 185
Due to associates 70 532
Due to other shareholders 883 890
Tax payable 15 20
85,263 96,755
Total liabilities 135,034 162,034
TOTAL EQUITY AND LIABILITIES 218,767 230,557
Net assets per share (sen) 6 5

-3-
CONSOLIDATED STATEMENT OF CHANGES IN EQUITY FOR THE PERIOD ENDED 30 SEPTEMBER 2012 AND 30 SEPTEMBER 2013
Share Capital
Share
Premium
Foreign Exchange
Translation
Reserve
Share
Option
Reserve
Accumulated
Losses Total
Non-
controlling
Interests
Total
Equity
RM'000 RM'000 RM’000 RM’000 RM'000 RM'000 RM'000 RM'000
At 1 January 2012 115,119 14,373 (23,133) 213 (47,128) 59,444 6,322 65,766
Total comprehensive (loss)/income for the period - - (6,521) - 2,104 (4,417) (1,107) (5,524)
Transaction with owners:
Share option granted under ESOS - - - 80 - 80 - 80
Accretion/(Dilution) from change in stake - - - - 225 225 (225) -
Consideration paid by non-controlling interests in a
subsidiary - - - - - - 4,812 4,812
At 30 September 2012 115,119 14,373 (29,654) 293 (44,799) 55,332 9,802 65,134
At 1 January 2013 115,119 14,373 (30,187) 376 (40,185) 59,496 9,027 68,523
Total comprehensive income for the period - - 9,121 - 5,217 14,338 399 14,737
Transaction with owners:
Issue of ordinary shares pursuant to ESOS 367 - - - - 367 - 367
Share option granted under ESOS - 16 - 88 - 104 - 104
Deconsolidation of a subsidiary - - - - - - 2 2
At 30 September 2013 115,486 14,389 (21,066) 464 (34,968) 74,305 9,428 83,733
|------------- Non-Distributable ----------------|
|------------------------------------ Attributable to owners of the parent ---------------------------------|
-4-
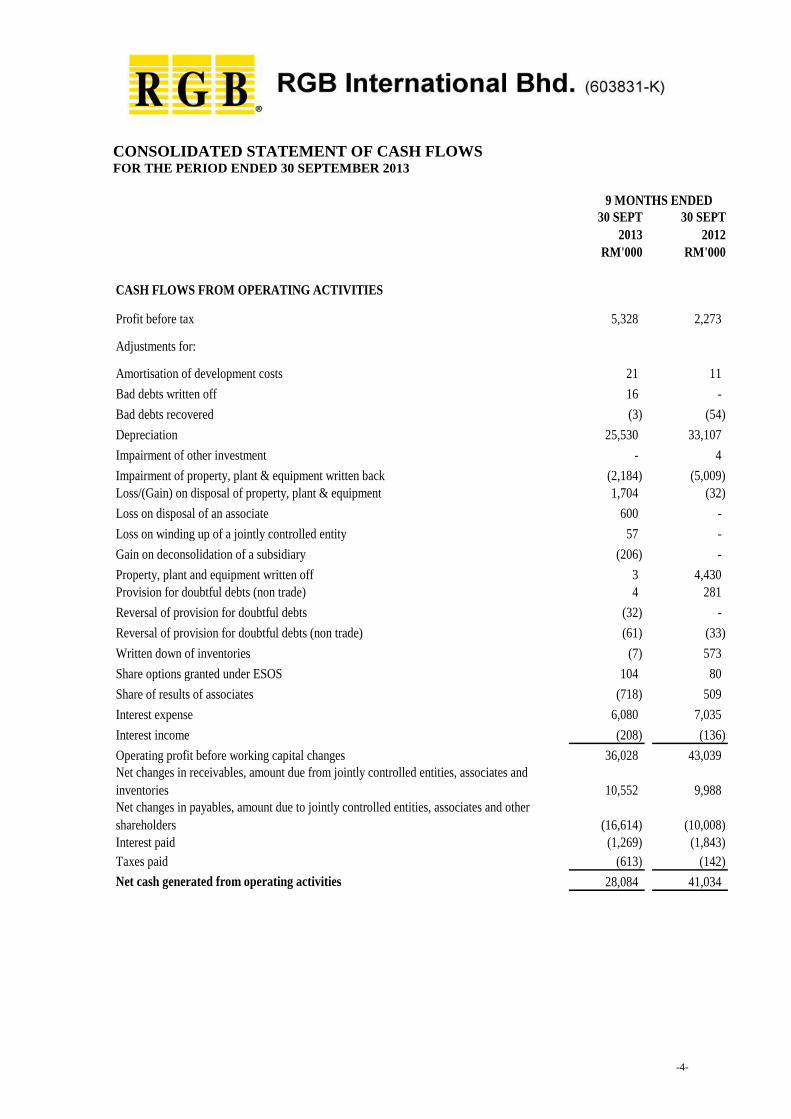
CONSOLIDATED STATEMENT OF CASH FLOWS FOR THE PERIOD ENDED 30 SEPTEMBER 2013
30 SEPT
2013
30 SEPT
2012
RM'000 RM'000
CASH FLOWS FROM OPERATING ACTIVITIES
Profit before tax 5,328 2,273
Adjustments for:
Amortisation of development costs 21 11
Bad debts written off 16 -
Bad debts recovered (3) (54)
Depreciation 25,530 33,107
Impairment of other investment - 4
Impairment of property, plant & equipment written back (2,184) (5,009)
Loss/(Gain) on disposal of property, plant & equipment 1,704 (32)
Loss on disposal of an associate 600 -
Loss on winding up of a jointly controlled entity 57 -
Gain on deconsolidation of a subsidiary (206) -
Property, plant and equipment written off 3 4,430
Provision for doubtful debts (non trade) 4 281
Reversal of provision for doubtful debts (32) -
Reversal of provision for doubtful debts (non trade) (61) (33)
Written down of inventories (7) 573
Share options granted under ESOS 104 80
Share of results of associates (718) 509
Interest expense 6,080 7,035
Interest income (208) (136)
Operating profit before working capital changes 36,028 43,039
Net changes in receivables, amount due from jointly controlled entities, associates and
inventories 10,552 9,988
Net changes in payables, amount due to jointly controlled entities, associates and other
shareholders (16,614) (10,008)
Interest paid (1,269) (1,843)
Taxes paid (613) (142)
Net cash generated from operating activities 28,084 41,034
9 MONTHS ENDED

-5-
CONSOLIDATED STATEMENT OF CASH FLOWS (CONTINUED) FOR THE PERIOD ENDED 30 SEPTEMBER 2013
30 SEPT
2013
30 SEPT
2012
RM'000 RM'000
CASH FLOWS FROM INVESTING ACTIVITIES
Purchase of property, plant and equipment (12,048) (21,949)
Proceeds from disposal of property, plant and equipment 219 231
Changes in fixed deposits pledged to licensed banks (4,619) (275)
Expenditure on development costs - (665)
Proceeds from disposal of associates 145 -
Distribution from a jointly controlled entity 185 -
Partial consideration from disposal of a subsidiary 2,409 687
Interest received 208 136
Net cash used in investing activities (13,501) (21,835)
CASH FLOWS FROM FINANCING ACTIVITIES
Net repayment of bankers' acceptances and onshore foreign currency loan (4,647) (428)
Net repayment of term loan and commercial papers (13,162) (18,608)
Repayment of finance lease liability (87) (112)
Proceeds from issuance of shares 367 -
Proceeds from subscription of ordinary shares by minoriy interests - 4,812
Net cash used in financing activities (17,529) (14,336)
NET CHANGES IN CASH AND CASH EQUIVALENTS (2,946) 4,863
EFFECTS OF FOREIGN EXCHANGE RATE CHANGES 4,443 (3,825)
CASH AND CASH EQUIVALENTS AT BEGINNING OF THE FINANCIAL PERIOD 21,888 22,524
CASH AND CASH EQUIVALENTS AT THE END OF THE FINANCIAL PERIOD 23,385 23,562
* Cash and cash equivalents at end of the financial period comprise the following:
Cash and bank balances 26,683 28,128
Deposits with licensed banks 9,226 4,589
Less: Bank overdrafts (3,300) (4,568)
32,609 28,149
Add: Cash and bank balances for disposal group classified as held for sale 2 2
Less: Fixed deposit pledged to licensed banks (9,226) (4,589)
23,385 23,562
9 MONTHS ENDED

-6-
PART A - EXPLANATORY NOTES PERSUANT TO MALAYSIAN FINANCIAL REPORTING
STANDARD (“MFRS”) 134
1. Basis of Preparation
The interim financial statements are unaudited and have been prepared in accordance with
MFRS 134 Interim Financial Reporting and paragraph 9.22 of the Listing Requirements of Bursa
Malaysia Securities Berhad.
The interim financial statements should be read in conjunction with the audited financial statements
for the year ended 31 December 2012. These explanatory notes attached to the interim financial
statements provide an explanation of events and transactions that are significant to an understanding
of the changes in the financial position and performance of the Group since the year ended 31
December 2012.
2. Changes in Accounting Policies
2.1 Adoption of Standards, Amendments and Issues Committee (“IC”) Interpretations and
changes in accounting policies
During the financial period, the Group has adopted the following Standards, Amendments and
IC Interpretations:
MFRS 3 Business Combinations (IFRS 3 Business Combinations issued
by IASB in March 2004)
MFRS 10 Consolidated Financial Statements
MFRS 11 Joint Arrangements
MFRS 12 Disclosure of Interests in Other Entities
MFRS 13 Fair Value Measurement
MFRS 119 Employee Benefits (revised)
MFRS 127 Separate Financial Statements
MFRS 128 Investments in Associates and Joint Ventures
Amendments to MFRS 1 First-time Adoption of MFRS – Government Loans
Amendments to MFRS 7 Disclosures – Offsetting Financial Assets and Financial
Liabilities
Amendments to MFRS 10,
MFRS 11 and MFRS 12
Consolidated Financial Statements, Joint Arrangements and
Disclosure of Interests in Other Entities: Transition
Guidance
Amendments to MFRS 101 Presentation of Items of Other Comprehensive Income
IC Interpretation 20 Stripping Costs in the Production Phase of a Surface Mine
Amendments to MFRSs Annual Improvements 2009 – 2011 Cycle

-7-
2. Changes in Accounting Policies (Continued)
2.1 Adoption of Standards, Amendments and Issues Committee (“IC”) Interpretations and
changes in accounting policies (Continued)
The adoption of the above pronouncements did not have any impact on the financial
statements of the Group, except for the following:
(a) Amendments to MFRS 101 Presentation of Items of Other Comprehensive Income
The amendments to MFRS 101 Presentation of Items of Other Comprehensive Income
change the grouping of items presented in other comprehensive income. Items that could
be reclassified to profit or loss at a future point in time, i.e. exchange differences on
translation of foreign operations would be presented separately from items that will never
be reclassified.
The adoption of this amendment affects presentation only and has no financial impact on
the Group’s financial statements.
2.2 Standards issued but not yet effective
MFRS 9 Financial instruments
Amendments to MFRS 9 Mandatory Effective Date of MFRS 9 and Transition
Disclosures
Amendments to MFRS 10 Consolidated Financial Statements: Investment Entities
Amendments to MFRS 12 Disclosure of Interests in Other Entities: Investment Entities
Amendments to MFRS 127 Consolidated and Separate Financial Statements: Investment
Entities
Amendments to MFRS 132 Offsetting Financial Assets and Financial Liabilities
The Group will adopt the above pronouncements when they become effective in the respective
financial periods. These pronouncements are not expected to have any effect to the financial
statements of the Group upon their initial application.
3. Auditors’ Report on Preceding Annual Financial Statements
The auditors’ report on the financial statements for the year ended 31 December 2012 was not
qualified.
4. Significant Event
During the quarter under review, there were no events that have not been reflected in the financial
statements.
5. Comments about Seasonal or Cyclical Factors
The overall business of the Group was not affected by any significant seasonal factors except for
the sales of machines which are subject to seasonal fluctuation.

-8-
6. Unusual Items due to their Nature, Size or Incidence
There were no items affecting assets, liabilities, equity, net income, or cash flows during the current
quarter.
7. Changes in Estimates
There were no changes in the nature and amount of estimates reported that will have a material
effect in the current quarter.
8. Changes in Debts and Equity Securities
There were no issuances, cancellations, repurchases, resale and repayments of debt and equity
securities except for the following:
Share Capital
2013 2012
As at 1 January 1,151,189 1,151,189
Issue of ordinary shares pursuant to
ESOS 3,672 -
As at 30 September/December 1,154,861 1,151,189
Number of
Ordinary Shares ('000) of RM0.10 each
9. Dividend
No dividend was paid for the financial period ended 30 September 2013.

-9-
10. Segmental Information
Segment information is presented in respect of the Group’s business segments:
30 SEPT
2013
30 SEPT
2012
30 SEPT
2013
30 SEPT
2012
RM’000 RM’000 RM’000 RM’000
Segment Revenue
Sales and Marketing 23,136 36,677 50,802 56,436
Technical Support and Management 17,504 19,079 54,476 54,005
Others (1) 224 998 741 2,822
40,864 56,754 106,019 113,263
Eliminations (48) (84) (144) (252)
Revenue 40,816 56,670 105,875 113,011
EBITDA*
Sales and Marketing 1,897 1,861 5,741 4,157
Technical Support and Management 11,795 12,863 35,809 37,062
Others (358) (574) (830) (4,104)
Unallocated (1,627) 689 (5,945) 306
Total 11,707 14,839 34,775 37,421
Segment Results
Sales and Marketing 1,868 2,103 5,017 5,148
Technical Support and Management 3,837 2,316 13,635 5,575
Others (614) (1,023) (1,942) (1,104)
5,091 3,396 16,710 9,619
Unallocated (expenses)/income (1,615) 713 (5,898) 353
- Foreign exchange (loss)/gain (1,116) 2,162 (3,223) 4,079
- Interest income 85 38 168 111
- Sundry Income 76 59 346 632
- Legal and professional fee (84) (466) (738) (1,362)
- Other expenses (576) (1,080) (2,451) (3,107)
Operating profit 3,476 4,109 10,812 9,972
3 MONTHS ENDED 9 MONTHS ENDED
Note
(1) “Others” consist of revenue from leasing of Chateau building, manufacturing activities,
research & development activities and inter-segment transaction.
* Earnings before interest, taxation, depreciation, amortisation, impairment of property, plant &
equipment, intangible assets and investments.

-10-
11. Valuation of Property, Plant and Equipment
The Group did not revalue any of its property, plant and equipment during the current quarter under
review.
12. Subsequent Events
There were no material events subsequent to the end of the current quarter except for:
(a) Pursuant to the Sale and Purchase Agreement dated 22 June 2011 for the disposal of 32%
equity interest in Chateau de Bavet Club Co., Ltd. (“CDBC”), second tranche of 345,600
shares representing 9.6% of the entire capital of CDBC has been transferred to the acquirer on
6 November 2013. As a result, Macrocept Sdn Bhd now holds 48.34% of CDBC.
(b) The Company has allotted a total of 150,300 ordinary shares of RM0.10 each for cash
pursuant to the Company’s ESOS at a weighted average issue price of RM0.10 per ordinary
share.
13. Changes in the Composition of the Group during the quarter
There were no material changes in the composition of the Group except for:
(a) Diamond House (Nipo) Co., Ltd., a dormant company incorporated in Cambodia, was
deregistered on 23 September 2013.
14. Changes in Contingent Liabilities and Contingent Assets
There were no material changes in contingent liabilities and assets since the previous quarter.
15. Capital Commitments
The amount of capital commitments approved but not provided for in the interim financial
statements is as follows:
AS AT
30 SEPT 2013
RM’000
Gaming machines and equipment 5,800

-11-
16. Significant Related Party Transactions
There were no significant related party transactions during the current quarter except for:
1.7.2013 to 1.1.2013 to
30.09.2013 30.09.2013
RM’000 RM’000
Sales of products to:
- Kelab Sukan dan Rekreasi Perubatan Pulau Pinang 124 124
The abovementioned club is regarded as a related party of the Group as a director of the Company
has substantial influences in this club.
The directors are of the opinion that the related party transactions above have been entered into in
the normal course of business and have been established on terms and conditions that are not
materially different from those obtainable in transactions with unrelated parties.

-12-
B. EXPLANATORY NOTES PURSUANT TO PARAGRAPH 9.22 OF THE LISTING
REQUIREMENTS OF BURSA SECURITIES
17. Performance Review
30 SEPT
2013
30 SEPT
2012
% 30 SEPT
2013
30 SEPT
2012
%
RM’000 RM’000 +/(-) RM’000 RM’000 +/(-)
Revenue
Sales and Marketing 23,136 36,677 -37% 50,802 56,436 -10%
Technical Support and Management 17,504 19,079 -8% 54,476 54,005 +1%
Others (1) 176 914 -81% 597 2,570 -77%
Total 40,816 56,670 -28% 105,875 113,011 -6%
EBITDA*
Sales and Marketing 1,897 1,861 +2% 5,741 4,157 +38%
Technical Support and Management 11,795 12,863 -8% 35,809 37,062 -3%
Others (358) (574) -38% (830) (4,104) -80%
Unallocated (1,627) 689 -336% (5,945) 306 -2043%
Total 11,707 14,839 -21% 34,775 37,421 -7%
Profit/(Loss) before tax
Sales and Marketing 1,727 1,718 +1% 5,453 4,213 +29%
Technical Support and Management 3,216 1,428 +125% 11,436 2,835 +303%
Others (631) (1,069) -41% (1,989) (1,288) +54%
4,312 2,077 +108% 14,900 5,760 +159%
Unallocated Expenses (3,058) (519) +489% (9,572) (3,487) +175%
- Finance cost (1,443) (1,232) +17% (3,674) (3,840) -4%
- Foreign exchange (loss)/ gain (1,116) 2,162 -152% (3,223) 4,079 -179%
- Interest income 85 38 +124% 168 111 +51%
- Sundry Income 76 59 +29% 346 632 -45%
- Legal and professional fee (84) (466) -82% (738) (1,362) -46%
- Other expenses (576) (1,080) -47% (2,451) (3,107) -21%
Profit before tax 1,254 1,558 -20% 5,328 2,273 +134%
3 MONTHS ENDED 9 MONTHS ENDED
Note
(1) “Others” consist of revenue from leasing of Chateau building, manufacturing activities,
research & development activities and inter-segment transaction.
* Earnings before interest, taxation, depreciation, amortisation, impairment of property, plant &
equipment, intangible assets and investments.

-13-
17. Performance Review (Continued)
(i) Comparison with previous year’s corresponding quarter
The Sales and Marketing (“SSM”) division’s revenue decreased by 37% for quarter ended 30
September 2013 as compared to previous year’s corresponding quarter mainly due to decrease in
number of machines sold in the region. The sales for this quarter was only limited to the
replacement market. There were no orders from new integrated resorts in this quarter. However, the
EBITDA improved by 2%.
The revenue for Technical Support and Management (“TSM”) division decreased slightly by 8%
for the quarter ended 30 September 2013 as compared to previous year’s corresponding quarter.
This is due mainly to adverse weather conditions across the region and post election conditions in
Cambodia. However, profit before tax for TSM division increased by 125% due to lower
depreciation of gaming machines, utilization of mobilized machines and significant reduction in
cost of upkeep and transportation of gaming machines.
The revenue of “Others” division was mainly contributed by sales of refurbished machines and
table games layout.
The foreign exchange loss of RM1.1 million in this quarter is due to appreciation of US Dollar
against the local currencies.
(ii) Comparison with previous year’s corresponding period
The revenue decreased by 10% for nine months period ended 30 September 2013 as compared to
preceding year for SSM division. This is due to decrease in the number of machines sold. However,
the profit before tax has increased by 29% due to improvement in profit margin, lower interest
expense, lower travelling expenses and staff salaries.
The revenue for TSM division increased slightly by 1% for nine months period ended 30 September
2013 as compared to preceding year. The profit before tax increased by 303% due to lower
depreciation of gaming machines, utilization of mobilized machines and lower interest expense,
lower cost of upkeep and transportation of gaming machines.
The loss before taxation for Others is mainly related to R&D expenditures and depreciation of
Chateau Casino.

-14-
18. Comparison with previous quarter's results
CURRENT PREVIOUS
QUARTER QUARTER %
RM’000 RM’000 +/(-)
Revenue
Sales and Marketing 23,136 14,940 +55%
Technical Support and Management 17,504 18,403 -5%
Others (1) 176 267 -34%
Revenue 40,816 33,610 +21%
EBITDA*
Sales and Marketing 1,897 2,599 -27%
Technical Support and Management 11,795 11,728 +1%
Others (358) (381) -6%
Unallocated (1,627) (3,768) -57%
11,707 10,178 +15%
Profit/(Loss) before tax
Sales and Marketing 1,727 2,494 -31%
Technical Support and Management 3,216 4,671 -31%
Others (631) (817) -23%
4,312 6,348 -32%
Unallocated expenses (3,058) (4,848) -37%
- Finance cost (1,443) (1,099) +31%
- Foreign exchange loss (1,116) (2,808) -60%
- Interest income 85 43 +98%
- Sundry income 76 142 -46%
- Legal and professional fee (84) (289) -71%
- Other expenses (576) (837) -31%
Profit before tax 1,254 1,500 -16%
Note
(1) “Others” consist of revenue from leasing of Chateau building, manufacturing activities,
research & development activities and inter-segment transaction.
* Earnings before interest, taxation, depreciation, amortisation, impairment of property, plant &
equipment, intangible assets and investments.

-15-
18. Comparison with previous quarter's results (Continued)
The increase in revenue and profit before tax for SSM division in this quarter is due to increase in
number of casino equipments sold in this quarter. The profit before tax for SSM division decreased
by 31% due to lower profit margin and trade show expenses.
The revenue and profit before tax for TSM division decreased by 5% and 31% respectively. The
drop in revenue is due to adverse weather conditions and post election conditions in Cambodia. The
decrease in profit before tax is due to payment of annual bonus and trade show expenses in this
quarter.
The loss before taxation for Others is mainly related to R&D expenditures and depreciation of
Chateau Casino.
19. Commentary on Prospects
SSM Division expects to sell more than 1,000 machines during the year based on book orders in
hand.
TSM Division expects to commence operations in a few additional outlets in the region in the
remaining year. We remain focused on growing revenue at existing concessions via increasing yield
per machine and continue to source for new and potential markets. Capital expenditure for new
gaming machines will remain low with priority to place quality and high yield machines in the new
outlets.
In view of the foregoing and barring unforeseen circumstances, the Group expects to perform better
this year.
20. Profit Forecast
The company did not announce any profit forecast for the year.
21. Income Tax Expense
3 MONTHS ENDED 9 MONTHS ENDED
30 SEPT 2013 30 SEPT 2012 30 SEPT 2013 30 SEPT 2012
RM’000 RM’000 RM’000 RM’000
Income Tax
- Current period 427 86 439 96
Domestic income tax is calculated at the Malaysian statutory rate of 25% (2012: 25%) of the
estimated assessable profit for the period. The effective tax rate of the Group for the nine months
period is lower than the statutory income tax rate mainly due to income subjected to different tax
jurisdictions and income not subjected to tax, partially offset by expenses not deductible for tax
purposes.

-16-
22. Corporate Proposals
Save as disclosed below, there were no corporate proposals announced but not completed as at the
date of this announcement:
(a) Status Of Employee Share Option Scheme (“ESOS”)
Grant Date Exercise
Price
Balance
As At
Granted Exercised Forfeited Balance
As At
1 Jan 2013 30 Sept 2013
RM '000 '000 '000 '000 '000
25 Nov 2010 0.10 61,286 - (3,565) (717) 57,004
13 Feb 2012 0.10 2,827 - (89) (218) 2,520
1 Nov 2012 0.10 10,908 - (19) (341) 10,548
75,021 - (3,673) (1,276) 70,072
Number of Options Over
Ordinary Shares of RM0.10 each
The above option expires on 20 October 2019.
(b) Proposed Issuance of 7 Years Unrated Commercial Paper (“CP”) and/ or Medium Term
Notes (“MTN”) with an aggregate nominal value of RM73 million (“CP/MTN”
Programme)
The Group had issued RM62 million CPs and RM10 million MTN respectively under the 7
years Unrated CP/MTN Programme to refinance the existing CP/MTN Programme on 15 June
2013. During the quarter, the Group retired RM4.85 million of CPs leaving a balance of
RM57.15 million as at 30 September 2013.
(c) Disposal of 32% equity interest in Chateau
Pursuant to the Sale and Purchase Agreement dated 22 June 2011 for the disposal of 32%
equity interest in Chateau, 12.8% and 9.6% equity interest has been transferred to the acquirer
in 2012 and Q4’13 respectively.

-17-
23. Borrowings
AS AT AS AT
30 SEPT 2013 31 DEC 2012
RM’000 RM’000
Short Term Borrowings:
Secured
Bank overdrafts 3,300 4,144
Onshore foreign currency loan 9,662 14,309
Commercial papers 14,657 6,466
Finance lease liability 238 216
Term loans 112 112
27,969 25,247
Long Term Borrowings:
Secured
Commercial papers 38,988 54,300
Finance lease liability 242 350
Term loans 346 434
39,576 55,084
Unsecured
Medium term notes 10,000 10,000
49,576 65,084
Total borrowings 77,545 90,331
Borrowings denominated in foreign currency as at 30 Sept 2013:
USD’000 RM’000
Borrowings 3,112 10,142
24. Material Litigation
The Group is not engaged in any material litigation, either as plaintiff or defendant and the
Directors do not know of any proceedings pending or threatened or of any fact likely to give to any
proceedings which might adversely affect the position or business of the Group, save for the
announcements made on 8 February 2013 and 15 February 2013.
There is no further development in connection with the above matter as at the date of this
announcement.

-18-
25. Notes to the Statements of Comprehensive Income
The profitbefore taxation is after accounting for the following:
30 SEPT
2013
30 SEPT
2012
30 SEPT
2013
30 SEPT
2012
RM’000 RM’000 RM’000 RM’000
Interest income (95) (41) (208) (136)
Interest expenses 2,187 2,279 6,080 7,035
Amortisation of development costs 7 7 21 11
Bad debts written off 16 - 16 -
Bad debts recovered - - (3) (54)
Depreciation 8,501 11,115 25,530 33,107
Impairment of other investment - - - 4
Impairment of property, plant & equipment written back (241) (120) (2,184) (5,009)
Loss/(Gain) on disposal of property, plant & equipment 59 (5) 1,704 (32)
Loss on disposal of an associate - - 600 -
Loss on winding up of a jointly controlled entity - - 57 -
Gain on deconsolidation of a subsidiary (206) - (206) -
Property, plant and equipment written off - 65 3 4,430
Provision for doubtful debts (non trade) 2 3 4 281
Reversal of provision for doubtful debts (1) - (32) -
Reversal of provision for doubtful debts (non trade) - (9) (61) (33)
Written down of inventories (7) 573 (7) 573
3 MONTHS ENDED 9 MONTHS ENDED
-19-
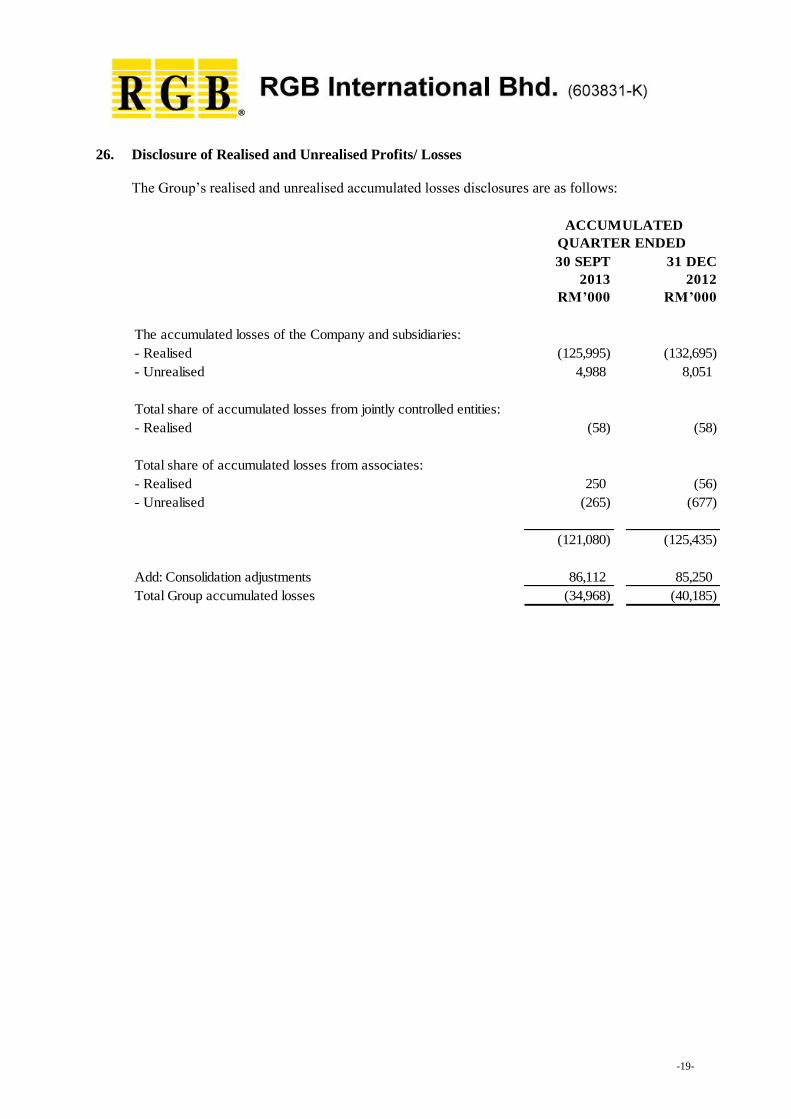
26. Disclosure of Realised and Unrealised Profits/ Losses
The Group’s realised and unrealised accumulated losses disclosures are as follows:
30 SEPT
2013
31 DEC
2012
RM’000 RM’000
The accumulated losses of the Company and subsidiaries:
- Realised (125,995) (132,695)
- Unrealised 4,988 8,051
Total share of accumulated losses from jointly controlled entities:
- Realised (58) (58)
Total share of accumulated losses from associates:
- Realised 250 (56)
- Unrealised (265) (677)
(121,080) (125,435)
Add: Consolidation adjustments 86,112 85,250
Total Group accumulated losses (34,968) (40,185)
ACCUMULATED
QUARTER ENDED

-20-
27. Earnings Per Share
(a) Basic
Basic earnings per share amounts are calculated by dividing the profit for the period
attributable to owners of the parent by the weighted average number of ordinary shares in
issue during the period.
30 SEPT
2013
30 SEPT
2012
30 SEPT
2013
30 SEPT
2012
Profit attributable to owners of the parent
(RM’000) 946 1,505 5,217 2,104
Weighted average number of ordinary shares in
issue (’000) 1,154,816 1,151,189 1,152,654 1,151,189
Basic earnings per share (sen) 0.08 0.13 0.45 0.18
3 MONTHS ENDED 9 MONTHS ENDED
(b) Diluted
For the purpose of calculating diluted earnings per share, the profit for the period attributable
to owners of the parent by the weighted average number of ordinary shares in issue during the
period have been adjusted for the dilutive effects of share options granted.
30 SEPT
2013
30 SEPT
2012
30 SEPT
2013
30 SEPT
2012
Profit attributable to owners of the parent
(RM’000) 946 1,505 5,217 2,104
Weighted average number of ordinary shares in
issue (’000) 1,154,816 1,151,189 1,152,654 1,151,189
Effect of dilution of share options 11,191 - 8,344 -
Adjusted weighted average number of ordinary
shares in issue and issuable ('000) 1,166,007 1,151,189 1,160,998 1,151,189
Diluted earnings per share (sen) 0.08 0.13 0.45 0.18
3 MONTHS ENDED 9 MONTHS ENDED

-21-
28. Authorisation for Issue
On 26 November 2013, the Board of Directors authorised the issue of these interim financial
statements.
By Order of the Board
RGB International Bhd. (603831-K)
Datuk Chuah Kim Seah, JP
Group Managing Director
26 November 2013