INTERIM RESULTS 26 JULY 2018 - inchcape.com · Jaguar Land Rover in Colombia, and BMW in Guam...
34
INTERIM RESULTS 26 JULY 2018
Transcript of INTERIM RESULTS 26 JULY 2018 - inchcape.com · Jaguar Land Rover in Colombia, and BMW in Guam...

INTERIM RESULTS 26 JULY 2018

Contents
“ We have made good progress in Distribution, the higher margin core of our business, over the first half of 2018, offsetting the expected challenges in our Retail markets. The Group’s resilient first half profit performance is broadly consistent with the phasing of our full year guidance and so we reiterate our expectation of a solid profit performance for the year as a whole. With comparatives easing into the second half in Retail and with our focus on optimising performance against some challenging market dynamics we intend to drive an improved second half performance.
As we highlighted at our Capital Markets Day on 6th June we continue to see excellent growth opportunities, both organic and inorganic, for Inchcape. Today we announce our eighth Distribution business win over the last 24 months, a new Jaguar Land Rover contract in Kenya: a small business today, but a key milestone for development of our African footprint. It represents our first contract win in Africa in 50 years and means that we have achieved incremental business in all of the world regions on which we are focused as part of our Ignite strategy.
The Inchcape investment case is a multi-layered growth story, with our highly cash generative and attractive global Distribution business at its core. We believe that through our business optimisation initiatives, M&A focus, and plans to capitalise on future industry trends we are well positioned to deliver growth for our shareholders through organic progress, industry consolidation and cash returns. “
Stefan Bomhard, Group CEO of Inchcape plc, commented
Interim Report1 Group Chief Executive Comments2 First Half Highlights and Key Financials3 Ignite Strategy4 Operational Review5 Operating Review6 Asia7 Australasia8 UK and Europe9 Emerging Markets10 Finance Review
Financial statements12 Consolidated Income Statement (unaudited)13 Consolidated Statement of Comprehensive Income (unaudited)14 Consolidated Statement of Financial Position (unaudited)15 Consolidated Statement of Changes in Equity (unaudited)16 Consolidated Statement of Cash Flows
(unaudited)17 Notes (unaudited)
Other information32 Independent Review Report to Inchcape plc33 Statement of Directors’ Responsibilities
Clarifying our Financial MetricsThe following table shows the key profit measures that we use throughout this report to most accurately describe underlying operating performance and how they relate to statutory measures.
Metric Results Use of Metric
Gross Profit 639.6 Direct profit contribution from Value Drivers (e.g. Vehicles and Aftersales)
Less: Segment operating expenses (435.7)
Trading Profit 203.9 Underlying profit generated by our Segments
Less: Central Costs (10.7)
Operating Profit (pre Exceptional Items) 193.2 Underlying profit generated by the Group
Less: Exceptional Items (4.4)
Operating Profit 188.8 Statutory measure of Operating Profit
Less: Net Finance Costs (27.6)
Profit Before Tax 161.2 Statutory measure of profit after the costs of financing the Group
Add back: Exceptional Items 18.3
Profit Before Tax & Exceptional Items 179.5 One of the Group’s KPIs
inchcape.com
1

Strong Distribution offsetting weaker Retail
First Half Highlights:
• Encouraging revenue growth of 6.8% in constant currency, and growth of 3.8% in actual currency
• Pre-exceptional profit before tax growth of 2% excluding property profit1 at constant currency, with strong Distribution momentum offsetting Retail challenges
• Reported profit before tax of £161.2m, down 15.6%
• Full year guidance confirmed. Continue to expect solid constant currency profit growth, with H1 overall performance largely as anticipated
• Strong performance in core Distribution business, with trading profit up 21% constant currency, supported by strength in Asia
• Retail market performance reflects significant vehicle margin pressure, as expected, down 61% in constant currency. Comparatives ease in the second half
• New Distribution contracts for Suzuki in Central America, Jaguar Land Rover in Colombia, and BMW in Guam announced since the start of the year
• Further new Jaguar Land Rover contract win in Kenya announced today – important strategic development for our African business
• Interim dividend per share +13%
Inchcape plc, the global automotive distributor, announces its half year results for the six months ended 30 June 2018.
KEY FINANCIALS (UNAUDITED)Actual Currency Constant Currency
Actual Rates H1 2018 H1 20175 YoY YoY
Revenue £4.6bn £4.4bn +3.8% +6.8%Pre-exceptional2,3 operating profit £193.2m £207.4m (6.9)% (1.2)%Pre-exceptional2,4 profit before tax £179.5m £196.2m (8.5)% (2.9)%Pre-exceptional1,2,4 profit before tax, excluding property profit £179.5m £186.9m (4.0)% +2.0%Reported profit before tax £161.2m £191.1m (15.6)%Reported basic EPS 26.9p 32.8p (18.0)%Basic adjusted EPS 31.3p 33.9p (7.7)%Dividend per share 8.9p 7.9p +12.7%
Vehicle gross profit £402.4m £381.7m +5.4% +9.3%Aftersales gross profit £237.2m £232.7m +1.9% +7.0%Distribution trading profit £180.9m £160.6m +12.6% +20.8%
Retail trading profit £23.0m £60.2m (61.8)% (61.3)%
1. Excluding Australia property profit of £9.3m in H1 2017.2. H1 2018 operating exceptional charge is £4.4m, for costs incurred in relation to the acquisition and integration of the Grupo Rudelman
business in Central America. H1 2017 reported profit includes an exceptional charge of £5.1m in relation to the fixed cost review announced in 2016 and transactional costs for the South American acquisition in December 2016. See note 3.
3. Our Central America acquisition contributed £5.3m to H1 2018 pre-exceptional operating profit4. H1 2018 exceptional finance costs of £13.9m relating to the fair value basis of assessment of the Group’s US$ Private Placement loan notes.
See note 55. IFRS 15 has been implemented for the year ending 31 December 2018. We have adopted a fully retrospective approach to transition,
with all comparatives restated within this statement
inchcape.com
2

IGNITE STRATEGYLead in Customer ExperienceWe will invest to maintain our position as leader in customer service innovation in automotive distribution and retail, with digital a key priority.
Become the OEMs’ Partner of ChoiceWe will build and strengthen our working relationships with our OEM partners by investing time in understanding their needs, seeking greater opportunities for collaboration with the aim of becoming a strategic business partner of choice.
Deliver full potential from all our revenue streamsWe will increase our management focus on our Used vehicle and Aftersales activities at all levels of the organisation, enhancing their perceived status within the business and deepening further reporting and analysis.
Leverage our Global ScaleWe will leverage the Group’s unique diversity and size into a true competitive advantage for Inchcape.
Invest to Accelerate GrowthWe have a clear plan to work more actively with our OEM partners to identify distribution and retail acquisition opportunities that fit their strategic agendas, and create mutual value.
IGNITE UPDATEWe have continued to make very pleasing progress across all five elements of our Ignite strategy in the first half of the 2018. As outlined at our recent Capital Markets Day, Ignite has been the key driver in our push to further differentiate the company in all core areas of operation, as well as providing a strong foundation from which to grow both organically and through M&A.
Most significantly, we continued our expansion in high growth potential markets with the acquisition in March of Grupo Rudelman and the Suzuki distribution contracts for Costa Rica and Panama. This was our second scale acquisition in Latin America in 18 months and also included the rights to distribute several Chinese automotive brands, further highlighting our commitment to building growth platforms for the future.
Over the period Jaguar Land Rover awarded Inchcape new business in Colombia and, as announced today, have awarded Inchcape the distribution contract for Kenya. From January we also started to operate as the distributor for BMW in Guam.
Nurturing the OEM partnerships we have built over many years, as well as building relationships with new partners, is a key facet of Ignite as we strive to become the OEMs’ ‘Partner of Choice’. We have dedicated, cross-functional teams spanning multiple markets that share insight and best practice to realise the potential of our partnerships; staying close to the OEMs and maintaining regular meaningful contact at all levels ensures that we are able to participate when new opportunities arise.
Staying with the theme of leveraging our scale, we have continued to make good progress with the ongoing delivery of our procurement-driven savings, optimising our global cost base and driving significant economies of scale.
Inchcape’s global diversification, focus on higher margin distribution markets and spread of revenue streams all reduce the exposure of the Group to cyclical new car trends. Our Ignite-driven focus on realising the full potential of all our revenue streams continues to deliver traction with operational improvement programmes in Used vehicles, Aftersales and Finance & Insurance (F&I).
Our commitment to leading in customer experience is now focused on building and embedding our digital and data capabilities in measurement, process automation, Search Engine Optimisation and online listings and reviews. Having laid the foundations of the ‘Inchcape Experience’ to improve how we interact with customers, we’re now working to empower our local marketing teams to further drive improvements in customer experience, especially online. Our digital development will also play a key role in our plans to create profitable growth opportunities from the trends which are shaping the future of the automotive industry.
We originally set out our Ignite strategy in 2016 to take us on a path of growth. We are delivering against this agenda, both organically and through consolidating our fragmented industry, and we are confident that we will continue to maximise Inchcape’s potential through Ignite.
STEFAN BOMHARDGroup Chief Executive
Ignite
Deliver full potential on all
our revenue streams
Invest to accelerate
growth
Leverage our global
scale
Lead in customer
experience
Become the OEM’s
partner of choice
TO BE THE WORLD’S MOST
TRUSTED AUTOMOTIVE
DISTRIBUTOR & RETAILER
inchcape.com
3

Operational Review
PERFORMANCE REVIEWOur performance in the first half of 2018 was broadly in line with the phasing of our full year guidance and reflects good trading profit growth across many of our markets. Our core Distribution business has continued to perform strongly, however, challenging trading conditions in the UK and Australia Retail markets has resulted in a flat year-on-year pre-exceptional constant currency underlying profit before tax, excluding a property profit in 2017 that has not repeated and excluding our recent Central America acquisition. The Central America acquisition adds 2% growth to this.
Revenue of £4.6bn in the first half of 2018 was up by 3.8% at actual rates on the previous year and up 6.8% at constant currency, with growth strongly driven by our Emerging Markets business, including 45.5% constant currency growth in our Russian business which was driven by our outperformance of a recovering market. Our new Central America business, focused on Suzuki in Costa Rica and Panama, contributed £55.8m of revenue since acquisition in March. Excluding the acquisition revenue grew 5.5% in constant currency.
In the first half of 2018 we generated pre-exceptional operating profit of £193.2m, a decline of 1.2% in constant currency. Our operating margin was down 50bps to 4.2%, reflecting the challenging trading environment in the UK and Australia Retail and the prior year property profit, partially offset by a strong performance in our Asia business. The new Central America business contributed £5.3m of operating profit to the half year, in-line with our expectations and achieving a trading margin of 9.5%. Excluding the acquisition pre-exceptional operating profit declined 4.0% in constant currency.
In the first half of 2018, trading profit of £180.9m in our Distribution segment increased by 12.6% in actual currency and was up by 20.8% at constant currency, with a strong performance in our Asia business, due to market share gains in our key markets of Singapore and Hong Kong, and a pleasing improvement in New Vehicle profitability in Singapore year-on-year, supported by a strong model mix. Our Distribution performance also benefitted from a strong increase in profitability in Europe, driven by Greece, Belgium and the Balkans, and Australia with the Yen transactional currency movements providing a year-on-year benefit.
Our Retail segment delivered a trading profit of £23.0m, down 61.8% in actual currency and 61.3% at constant currency, continuing the trend from the second half of 2017 and reflecting very challenging conditions for Vehicles in our UK and Australia Retail businesses. The first half of 2017 also included a £9.3m property profit in our Australian Retail market. Our Russian business was a highlight in the first half, delivering improved trading across our value drivers and leveraging the Ignite strategy to drive strong growth in our Used business. Russian trading profit improved from a loss of £1.2m in the prior year to a profit of £5.0m in the first half of 2018.
Pre-exceptional profit before tax declined 2.9% over the period in constant currency, but excluding the Australia property profit in the prior year grew 2.0%.
Operating cash flow, excluding the cash cost of exceptional items, was £200.8m over the first half (2017 H1: £252.0m), with 104% conversion (2017 H1: 122%) reflecting good control of working capital, albeit against a low December 2017 base and therefore driving an outflow for the period. Free cash flow was £69.2m over the first half (2017 H1: £149.8m), with 36% conversion (2017 H1: 72%). This reflected a more normalised level of net working capital and a higher proportion of expected full year
capex in the first half compared to 2017. Year to date Capex spend was largely driven by planned investments in the UK. During the period we spent £137.6m (net of disposal proceeds) on acquisitions, principally related to the Central American acquisition in March 2018. We ended the first half of the year with a net debt position of £163.7m (2017 H1 net debt: £0.1m, 2017 FY net funds: £80.2m).
DIVIDENDConsistent with our dividend policy, and given the strength of our balance sheet, the Board has declared an interim dividend of 8.9p (2017 H1: 7.9p). This represents a year-on-year increase of 12.7%. Inchcape sets its interim dividend at a third of the prior year’s total dividend (2017 FY: 26.8p). The interim dividend will be paid on 5 September 2018 to shareholders on the register at close of business on 3 August 2018. The Dividend Reinvestment Plan is available to ordinary shareholders and the final date for receipt of elections to participate is 14 August 2018.
CAPITAL ALLOCATIONThe Board targets a capital structure that will provide Inchcape with the flexibility to invest in organic growth and to make further value-creating acquisitions while avoiding sustained excess net cash balances. With this stated objective, and following the Central America acquisition made in March, Inchcape announced that it would no longer continue with the share repurchase programme which was announced in February. The Board will continue to evaluate appropriate capital allocation over time.
PEOPLEWith deep automotive experience across the Group, a strong ethos of operational discipline and an unrelenting focus on delivering outstanding customer service, Inchcape’s people are central to our success. Management would like to express their sincere thanks to colleagues around the world for their commitment and dedication through the first half of the year.
OUTLOOKOur full year expectation for 2018 is unchanged, with the performance reflecting the trends from the first half of year with ongoing growth in our Distribution businesses acting as an offset to challenging trading conditions in some of our Retail markets. We expect to deliver a solid constant currency performance in 2018. With comparatives easing into the second half in Retail we intend to drive an improved second half performance.
Asia
Australasia
UK and Europe
Emerging Markets
inchcape.com
4

Operating Review
KEY PERFORMANCE INDICATORS1 – RESULTSSix months to
30.06.18 £m
Six months to 30.06.17
£m % change
% change in constant currency
Sales 4,613.5 4,443.0 3.8% 6.8%Operating margin before exceptional items 4.2% 4.7% (0.5ppt) (0.3ppt)Profit before tax and exceptional items 179.5 196.2 (8.5%) (2.9%)Free cash flow 69.2 149.8Return on capital employed2 26% 31%
1. See note 15 for definition of Key Performance Indicators and other Alternative Performance Measures.2. Excluding the Central America acquisition, which was integrated in March, ROCE was 28%.
VALUE DRIVERSGross profit
Six months to 30.06.18
£m
Gross profit Six months to
30.06.17£m % change
% change in constant currency
Group Vehicles 402.4 381.7 5.4% 9.3%Aftersales 237.2 232.7 1.9% 7.0%Total 639.6 614.4 4.1% 8.4%
Distribution Vehicles 248.7 213.9 16.3% 21.9%Aftersales 142.0 139.7 1.6% 8.8%Total 390.7 353.6 10.5% 16.8%
Retail Vehicles 153.7 167.8 (8.4%) (6.6%)Aftersales 95.2 93.0 2.4% 4.5%Total 248.9 260.8 (4.6%) (2.7%)
BUSINESS ANALYSISSix months to
30.06.18 £m
Six months to 30.06.17
£m% change
% change in constant currency
SalesDistribution 2,108.6 2,012.4 4.8% 9.0%Retail 2,504.9 2,430.6 3.1% 4.9%Trading profitDistribution 180.9 160.6 12.6% 20.8%Retail 23.0 60.2 (61.8%) (61.3%)
REGIONAL ANALYSIS2018
Operating/ Trading profit
£m
2018 Exceptional
items£m
2018 Reported
£m
2017 Operating/
Trading profit£m
2017 Exceptional items
£m
2017 Reported
£m
Asia 85.8 85.8 74.9 – 74.9Australasia 42.7 42.7 50.0 – 50.0Emerging Markets 42.5 42.5 41.4 (1.1) 40.3UK and Europe 32.9 32.9 54.5 (2.5) 52.0Trading profit 203.9 203.9 220.8 (3.6) 217.2Central Costs (10.7) (4.4) (15.1) (13.4) (1.5) (14.9)Operating profit 193.2 (4.4) 188.8 207.4 (5.1) 202.3
The Group reports its results in the condensed consolidated interim financial statements using actual rates of exchange. The operational review reports results at actual rates of exchange, but to enhance comparability they are also shown in a form that isolates the impact of currency movements from period to period by applying the June 2018 exchange rates to both periods’ results (constant currency). The results are also adjusted for the impact of exceptional items to provide additional information regarding the Group’s underlying performance. Where exceptional items and unallocated central costs are excluded from operating profit the results are referred to as ‘trading profit’.
Unless otherwise stated, variances from the previous year and forward looking comments are stated in constant currency.
See note 15 for Alternative Performance Measures definitions.
inchcape.com
5

AsiaOperating Review continued
Revenue growth for Asia was resilient at 2.6% for the first half. This reflects strong revenue growth in Hong Kong, with the market up 3% excluding the high volume of Electric Vehicles sold in the prior year driven by a tax incentive change in April 2017. As anticipated, this was partially offset by a declining market in Singapore, down 13% for the period. Pleasingly, we gained market share in both markets with significant gains in both passenger and commercial vehicles in Hong Kong.
In Singapore the Certificate of Entitlement cycle has phased down driving a lower New Vehicle volume. However, we have benefitted from actively driving an improved vehicle mix, including new SUV models, the Toyota Harrier and CH-R, and the Toyota Sienta MPV. The improved mix has increased turnover per unit and gross profit per unit (GPU), which alongside an improved F&I performance has led to a strong year-on-year profit performance in Singapore.
Our Hong Kong performance reflects the underlying New Vehicle market growth and the strong share gain. We delivered a good performance in our Toyota business, with the facelift Alphard model being successfully launched in February. In addition, we saw good growth versus prior year in our Jaguar Land Rover business. Coupled with disciplined overheads control, this resulted in strong first half profit growth in Hong Kong.
In Macau we benefitted from strong market growth, whereas some of our smaller markets including Brunei were challenged by market declines. China’s profitability benefited from the disposal of our Jaguar Land Rover Retail operation in Shaoxing during the first quarter of 2018.
Asian trading profit overall was up by 20.7% year-on-year, supported by the positive trading performances in Singapore, Hong Kong and Macau. This was mainly due to New Vehicles but Used Vehicles, whilst much lower in total contribution, saw strong gross profit growth in line with our Ignite strategy. F&I, another key strategic focus across the Group, also saw strong profit growth. Aftersales gross profit growth was also good over the period.
We expect to deliver a robust performance in 2018 in Asia, reflecting a year-on-year profit decline in the second half of 2018 as the comparative becomes harder and the Singapore market continues to cycle down.
KEY FINANCIAL HIGHLIGHTSSix months to
30.06.18 £m
Six months to 30.06.17
£m % change% change
in constant currency
Sales 789.1 806.9 (2.2%) 2.6%Trading profit 85.8 74.9 14.6% 20.7%Trading Margin % 10.9% 9.3% 1.6ppt 1.6ppt
BUSINESS MODELAt the heart of the Asia region, we are the Distributor and exclusive Retailer for Toyota, Lexus, Hino and Suzuki and operate Distribution and exclusive Retail for Jaguar, Land Rover and Ford in Hong Kong with additional Distribution and Retail franchises across the region.
TRADING PROFIT
42%
Country Route to market BrandsHong Kong Macau
Distribution & Exclusive Retail Toyota, Lexus, Hino, Daihatsu, Jaguar, Land Rover, Ford, Maxus
Singapore Distribution & Exclusive Retail Toyota, Lexus, Hino, SuzukiBrunei Distribution & Exclusive Retail Toyota, LexusGuam Distribution & Exclusive Retail Toyota, Lexus, Chevrolet, BMWSaipan Distribution & Exclusive Retail ToyotaThailand Distribution & Exclusive Retail Jaguar, Land RoverChina Retail Porsche, Mercedes, Lexus
inchcape.com
6

AustralasiaOperating Review continued
Australasia delivered a strong revenue performance in the first half, including £33.7m of revenue from our Peugeot Citroen (PSA) Distribution operations, which were acquired in June 2017. The Australian market grew by 1.0%, with a decline in New South Wales but with growth in the majority of the other states. The SUV segment continued to grow ahead of non-SUV vehicles, with growth of 11% and a decline of 11% respectively.
Distribution revenue for the period was up 11.2%, driven by good growth in Subaru volumes and the contribution from PSA year-on-year. Subaru New Car registrations grew by 1.3% in the first half, maintaining our market share. The Subaru XV, an entry level model in the range, grew strongly over the period, whilst the planned launch of the new Forester model in the second half of 2018 impacted volumes as old stock was run-down ahead of this.
In our Retail business, revenue grew by 6.6% with growth in our Subaru owned sites in Melbourne but with a decline in the more challenging Sydney market impacting our performance. The contribution from our new Peugeot City site in Melbourne and new sites for Volkswagen and Jaguar Land Rover which commenced trading for Inchcape in the second half of 2017 also supported the total revenue trend.
Australasia trading profit overall was 9.1% lower than last year, with the 53.2% increase in the Distribution business more than offset by the Retail decline. In contrast to 2017, our Subaru business benefitted from a transactional currency tailwind of close to £13m which helped offset the GPU impact of a mix shift towards the entry point of the brand range, the timing of the new Forester model launch later in the year and a more challenging pricing environment for some models.
Our Retail business saw trading profit decline by 88.8% and was against a first half of 2017 which included a property profit of £9.3m, which impacted our reported performance. The underlying Retail trading profit decrease reflects a difficult Sydney market, our biggest region in Australia for New Vehicles, broad based weakness in market share for European brands and further F&I pressure due to the upcoming regulatory change. Pleasingly, we delivered good performances in our Used operations, supported by the success of our investment in the Docklands Direct business.
Our PSA business is trading in-line with our expectations, as we invest to build the success of the brand and leverage new exciting models in the line-up.
We expect to deliver a resilient performance in 2018 in Australasia.
KEY FINANCIAL HIGHLIGHTSSix months to
30.06.18 £m
Six months to 30.06.17
£m % change% change
in constant currency
Sales 819.7 798.4 2.7% 8.8%Retail 411.2 408.6 0.6% 6.6%Distribution 408.5 389.8 4.8% 11.2%Trading profit 42.7 50.0 (14.6%) (9.1%)Retail 2.3 21.9 (89.5%) (88.8%)Distribution 40.4 28.1 43.8% 53.2%Trading Margin % 5.2% 6.3% (1.1ppt) (1.0ppt)Retail 0.6% 5.4% (4.8ppt) (4.8ppt)Distribution 9.9% 7.2% 2.7ppt 2.7ppt
BUSINESS MODELWe are the Distributor for Subaru in both Australia and New Zealand, in addition to Peugeot and Citroen in Australia. We also operate multi-franchise Retail operations in Sydney, Melbourne and Brisbane.
TRADING PROFIT
21%
Country Route to market BrandsAustralia Distribution & Retail Subaru, Peugeot, Citroen
Retail BMW, Jaguar, Land Rover, Volkswagen, MINI, Honda, Isuzu, Kia, Mitsubishi, Aston Martin, Bentley, McLaren, Rolls-Royce
New Zealand Distribution Subaru
inchcape.com
7
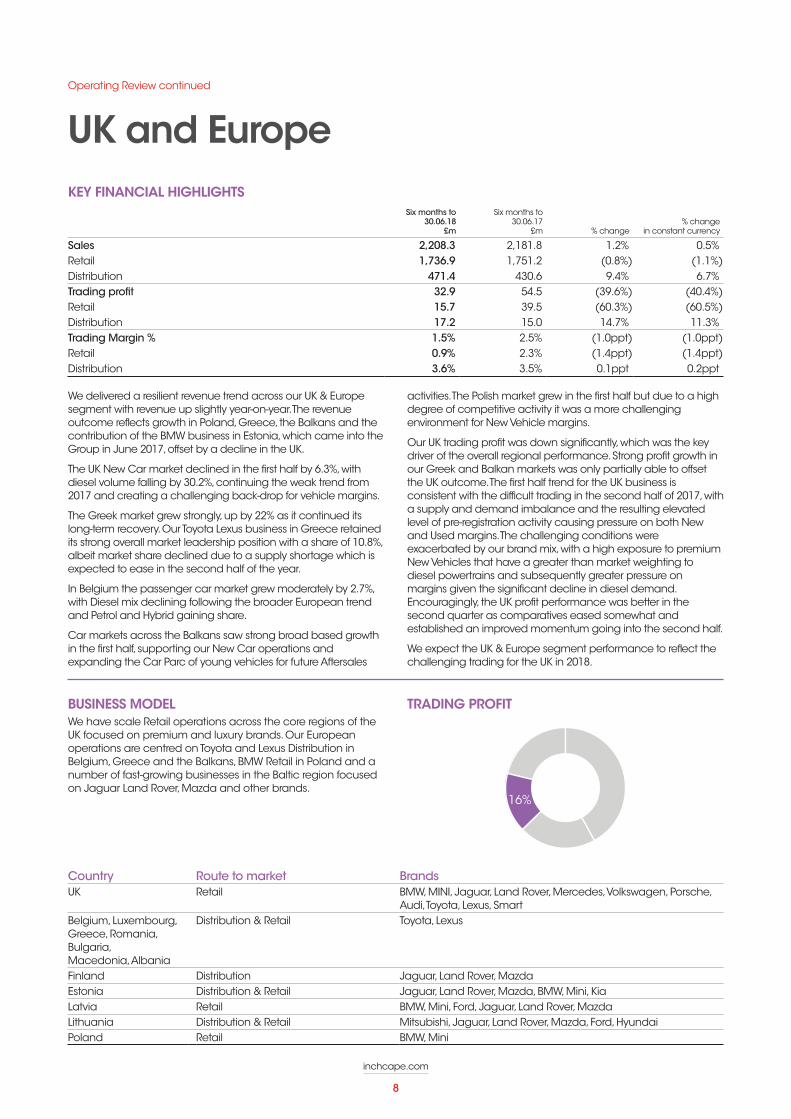
UK and EuropeOperating Review continued
We delivered a resilient revenue trend across our UK & Europe segment with revenue up slightly year-on-year. The revenue outcome reflects growth in Poland, Greece, the Balkans and the contribution of the BMW business in Estonia, which came into the Group in June 2017, offset by a decline in the UK.
The UK New Car market declined in the first half by 6.3%, with diesel volume falling by 30.2%, continuing the weak trend from 2017 and creating a challenging back-drop for vehicle margins.
The Greek market grew strongly, up by 22% as it continued its long-term recovery. Our Toyota Lexus business in Greece retained its strong overall market leadership position with a share of 10.8%, albeit market share declined due to a supply shortage which is expected to ease in the second half of the year.
In Belgium the passenger car market grew moderately by 2.7%, with Diesel mix declining following the broader European trend and Petrol and Hybrid gaining share.
Car markets across the Balkans saw strong broad based growth in the first half, supporting our New Car operations and expanding the Car Parc of young vehicles for future Aftersales
activities. The Polish market grew in the first half but due to a high degree of competitive activity it was a more challenging environment for New Vehicle margins.
Our UK trading profit was down significantly, which was the key driver of the overall regional performance. Strong profit growth in our Greek and Balkan markets was only partially able to offset the UK outcome. The first half trend for the UK business is consistent with the difficult trading in the second half of 2017, with a supply and demand imbalance and the resulting elevated level of pre-registration activity causing pressure on both New and Used margins. The challenging conditions were exacerbated by our brand mix, with a high exposure to premium New Vehicles that have a greater than market weighting to diesel powertrains and subsequently greater pressure on margins given the significant decline in diesel demand. Encouragingly, the UK profit performance was better in the second quarter as comparatives eased somewhat and established an improved momentum going into the second half.
We expect the UK & Europe segment performance to reflect the challenging trading for the UK in 2018.
KEY FINANCIAL HIGHLIGHTSSix months to
30.06.18 £m
Six months to 30.06.17
£m % change% change
in constant currency
Sales 2,208.3 2,181.8 1.2% 0.5%Retail 1,736.9 1,751.2 (0.8%) (1.1%)Distribution 471.4 430.6 9.4% 6.7%Trading profit 32.9 54.5 (39.6%) (40.4%)Retail 15.7 39.5 (60.3%) (60.5%)Distribution 17.2 15.0 14.7% 11.3%Trading Margin % 1.5% 2.5% (1.0ppt) (1.0ppt)Retail 0.9% 2.3% (1.4ppt) (1.4ppt)Distribution 3.6% 3.5% 0.1ppt 0.2ppt
BUSINESS MODELWe have scale Retail operations across the core regions of the UK focused on premium and luxury brands. Our European operations are centred on Toyota and Lexus Distribution in Belgium, Greece and the Balkans, BMW Retail in Poland and a number of fast-growing businesses in the Baltic region focused on Jaguar Land Rover, Mazda and other brands.
TRADING PROFIT
16%
Country Route to market BrandsUK Retail BMW, MINI, Jaguar, Land Rover, Mercedes, Volkswagen, Porsche,
Audi, Toyota, Lexus, Smart Belgium, Luxembourg, Greece, Romania, Bulgaria, Macedonia, Albania
Distribution & Retail Toyota, Lexus
Finland Distribution Jaguar, Land Rover, MazdaEstonia Distribution & Retail Jaguar, Land Rover, Mazda, BMW, Mini, KiaLatvia Retail BMW, Mini, Ford, Jaguar, Land Rover, MazdaLithuania Distribution & Retail Mitsubishi, Jaguar, Land Rover, Mazda, Ford, HyundaiPoland Retail BMW, Mini
inchcape.com
8

Emerging MarketsOperating Review continued
Our Emerging Markets delivered another half of strong sales growth with underlying constant currency sales increasing by 23.0% excluding the Central American acquisition, and including the acquisition by 32.3%.
In South America our BMW business performed well in Chile, gaining market share in a growing market and leading the premium segment for two consecutive quarters. Our Peru BMW business also grew, retaining its strong market leadership position within a market that faced the challenge of an automotive tax increase in the period.
Our Subaru operations in South America performed strongly, with Subaru volume growth in Chile, Peru, Argentina and Colombia. Our Hino operation in Colombia continued to decline with the market for trucks and buses remaining challenging, although over the second quarter performance started to improve as confidence built post presidential elections.
Our Ethiopian business continues to make up a material part of the region’s results. The state of emergency from 2017 through to June 2018 and currency restrictions created a more difficult backdrop for New Vehicle sales, however, our Aftersales gross profit performance in Africa was very close to flat year-on-year, and acted as a defensive value driver.
The Russian retail business was an important contributor to the region’s organic revenue performance, growing by 45.5%. The Russian market for our brands was up by 7% in the first half of 2018 and we saw strong market share gains for the majority of our sites. Our Aftersales operations grew revenue and profit strongly and we also expanded our F&I offering. Overall our Russian business delivered a trading profit of £5.0m for the period, a significant improvement from the £1.2m loss in the first half of 2017.
Trading profit for the Emerging Markets overall increased by 18.9%, and was up strongly on an underlying basis by 4.0% excluding the accretion from the Central American acquisition. The new Central American business contributed £55.8m to sales and £5.3m to trading profit in the half year, having been consolidated from the start of the second quarter. The Costa Rica and Panama New Vehicle markets were, as expected, weaker year-on-year. We are pleased with how the integration is proceeding and we are confident in the potential for the business.
We expect to deliver a strong performance in our Emerging Markets segment in 2018.
KEY FINANCIAL HIGHLIGHTSSix months to
30.06.18 £m
Six months to 30.06.17
£m % change% change
in constant currency
Sales 796.4 655.9 21.4% 32.3%Retail 356.8 270.8 31.8% 45.5%Distribution 439.6 385.1 14.2% 23.3%Trading profit 42.5 41.4 2.7% 18.9%Retail 5.0 (1.2) NM NMDistribution 37.5 42.6 (12.0%) 1.8%Trading Margin % 5.3% 6.3% (1.0ppt) (0.6ppt)Retail 1.4% (0.4%) 1.8ppt 1.9pptDistribution 8.5% 11.0% (2.5ppt) (1.8ppt)
BUSINESS MODEL
In South America, we have BMW Distribution businesses in Chile and Peru as well as Subaru and Hino operations across these markets, Colombia and Argentina. In Costa Rica and Panama we principally distribute Suzuki. Our business in Ethiopia is centred on Distribution and exclusive Retail for Toyota. In Russia we operate retail centres representing a number of our global OEM brand partners.
TRADING PROFIT
21%
Country Route to market BrandsEthiopia & Djibouti Distribution and Exclusive Retail Toyota, Daihatsu, Komatsu, New Holland, HinoRussia Retail Toyota, Audi, BMW, Jaguar, Land Rover, Lexus, Mini, Rolls Royce, VolvoChile Distribution and Retail BMW, Subaru, Rolls Royce, Hino, DFSKPeru Distribution and Retail BMW, Subaru, DFSK, BYDColumbia Distribution and Retail Subaru, Hino, Jaguar, Land Rover, DFSK, Mack, Daihatsu, BAICArgentina Distribution and Retail Subaru, SuzukiCosta Rica Distribution and Retail Suzuki, BAIC, Changan, JAC, Kubota Panama Distribution and Retail Suzuki, Changan, Great Wall, JAC
inchcape.com
9

In addition to the segmental results, detailed below are the financial implications of our operating activities.
CENTRAL COSTSUnallocated central costs for the half year are £10.7m before exceptional items (2017: £13.4m).
OPERATING EXCEPTIONAL ITEMSIn the first half of 2018, the Group has recorded exceptional operating costs of £4.4m (2017: £5.1m). These costs were incurred in relation to the acquisition and integration of the Grupo Rudelman business in Central America.
In the first half of 2017, the exceptional operating costs comprised costs of £3.8m associated with the global cost reduction programme and £1.3m in relation to the acquisition and integration of the Subaru and Hino distribution businesses in South America.
NET FINANCING COSTSNet financing costs, before exceptional finance costs, have increased from £11.2m in 2017 to £13.7m in 2018. The increase is due to increased levels of debt and supplier financing following the acquisition of the business in Central America in March 2018, together with the impact of increase in base rates in the second half of 2017 and the annualisation of the interest cost on the Sterling loan notes.
In the first half of the year we have incurred exceptional finance costs of £13.9m. This represents a one-off correction to the fair value basis of assessment of the Group’s US$ Private Placement Loan Notes. This amount has been reported as an exceptional item in order to provide additional useful information regarding the Group’s underlying business performance. The impact on profit before tax in each of the prior periods affected was not material and, had each period been reported correctly, there would have been no impact on executive or employee remuneration.
TAXThe effective tax rate for the half year, before exceptional items, is 25.5% compared to 25.7% for the same period last year.
NON-CONTROLLING INTERESTSProfits attributable to our non-controlling interests were £3.9m in the first half of 2018 (2017: £4.0m). The Group’s non-controlling interests principally comprise a 33% minority holding in UAB Vitvela in Lithuania, a 30% share in NBT Brunei, a 10% share of Subaru Australia and 6% of the Motor Engineering Company of Ethiopia.
FOREIGN CURRENCYDuring the period, the Group derived a loss of £12.5m (2017: a gain of £18.4m) from the translation of its overseas profits before tax into sterling at the 2018 average exchange rate when compared with the average exchange rates used for translation in the first half of 2017.
PENSIONSAt 30 June 2018, the IAS 19 net post-retirement surplus was £93.0m (31 December 2017: £72.3m). In the first half of the year and in-line with the funding programme agreed with the Trustees, the Group made additional cash contributions to the UK pension schemes amounting to £1.5m (2017: £1.5m). In the first half of the year Aviva has completed the issue of individual policies to members of the TKM pension scheme and the trustees of the scheme returned £16.8m before tax (£10.9m after tax) of the surplus in the scheme to the Group.
ACQUISITIONS AND DISPOSALSDuring the first six months of 2018 the Group acquired Grupo Rudleman, a Suzuki focused distribution business with integrated retail assets operating in Costa Rica and Panama. The total cost of this acquisition was £155.5m including cash acquired of £8.5m. In the first half of the year, the Group has also disposed of its Jaguar Land Rover operations in Shaoxing generating disposal proceeds of £12.0m.
During 2017 the Group acquired premium automotive operations in Estonia, focused on exclusive distribution for BMW Group, from United Motors AS, entered into a distribution contract with Groupe PSA to distribute the Peugeot and Citroen brands in Australia and acquired four sites in Australia. The total cost of these acquisitions was £19.3m. In addition, the Group also made a completion payment of £4.4m in relation to the Subaru and Hino Distribution business in South America. In 2017, the Group also disposed of its Lexus operations in Shanghai, generating disposal proceeds of £5.6m.
FINANCINGDuring the first half of the year, the Group has entered into a £120m bilateral facility with a relationship bank, maturing in March 2019 with an option to extend for a further 6 months, with terms similar to those of the Group’s existing Revolving Credit Facilities.
CAPITAL EXPENDITURENet capital expenditure in the first half of the 2018 was £55.3m (2016: £33.4m). The outlook for the full year is similar to the level of expenditure in 2017 and the increase in the first half reflects the phasing of spend, including a number of planned projects in the UK, which is expected to be lower in the second half of the year. We expect net capex to fall to a more normalised level of c.£75m in 2019.
CASHFLOW AND NET DEBTThe Group delivered free cash flow of £69.2m (2017: £149.8m). After the acquisition of Grupo Rudelman in March 2018 for £155.5m (including cash acquired of £8.5m) and payment of the final dividend for 2017 (£78.3m) the Group had net debt of £163.7m (31 December 2017: net funds of £80.2m).
Finance Review
inchcape.com
10

PRINCIPAL BUSINESS RISKSThe Board set out in the Annual Report and Accounts 2017 a number of principal business risks which could impact the performance of the Group and these remain unchanged for this Interim Report and the remaining six months of 2018. The key risks comprised:
• Loss of distribution contract with major brand partner
• Significant retrenchment of credit available to customers, dealer network or Inchcape plc negatively impacts vehicle sales and/or operational capability
• Brand failure or major interruption to OEM operations or product supply negatively impacts vehicle sales
• Major loss of confidential or sensitive data results in financial penalty and/or reputational damage
• Failure to extract value from acquisitions
• Impact of disruptive technologies and/or new entrants to the industry threatens our position in the value chain
• Failure to engage the next generation of (connected) customers impacts on revenues and/or OEM relations
• Fluctuations in exchange rates with negative impact on financial performance
The Group Inchcape Peace of Mind (iPOM) Committee has delegated authority from the Executive Committee to manage Inchcape’s Risk Management process. The iPOM committee’s aim is to ensure that Risk Management is core to all decision-making and has a broad remit and responsibility to:
• Ensure systematic risks are effectively managed through the development of coherent policies, process, control framework and effective assurance monitoring processes;
• Ensure dynamic and emerging risks are identified at a market level and for the Group as a whole, mitigation actions are identified and implemented and cross-market best practice is shared.
Market iPOM committees are embedded in each market. They operate according to Standard Terms of Reference and report to the Group iPOM committee. Consistent risk management tools are developed centrally and utilised Group-wide.
CURRENCY, FUNDING AND LIQUIDITY, INTEREST RATE AND COUNTERPARTY RISKSAll material transactional foreign exchange exposures are hedged using forward contracts. Counterparties and limits are approved for cash deposits and these are monitored closely. The Group continues to hedge its US dollar loan notes with cross currency interest rate swaps.
Funding and liquidity risk is actively managed through strict controls on inventory and the use of supplier credit to fund the largest cash outflows of the Group. The Group also maintains significant committed funding facilities.
Further details of the Group’s principal risks and risk management process can be found on pages 30-37 of the Annual Report and Accounts 2017.
GOING CONCERNHaving reassessed the principal risks, the Directors consider it appropriate to adopt the going concern basis of accounting in preparing the interim condensed consolidated financial information.
Finance Review continued
FREE CASH FLOW RECONCILIATIONSix months to
30.06.18 £m
Six months to 30.06.18
£m
Six months to 30.06.17
£m
Six months to 30.06.17
£m
Net cash generated from operating activities 123.9 167.8 Add back: Payments in respect of exceptional items 6.3 21.9 Net cash generated from operating activities, before exceptional items 130.2 189.7 Purchase of property, plant and equipment (49.6) (32.4)Purchase of intangible assets (13.2) (13.6)Proceeds from disposal of property, plant and equipment 7.5 12.6 Net capital expenditure (55.0) (33.4)Dividends paid to non-controlling interests (5.7) (6.5)Free cash flow 69.2 149.8
inchcape.com
11

Consolidated Income Statement (unaudited) For the six months ended 30 June 2018
inchcape.com 12
Notes
Six months to 30 Jun 2018
£m
Six months to 30 Jun 2017 (restated)1
£m
Year to 31 Dec 2017
(restated)1 £m
Revenue 2 4,613.5 4,443.0 8,953.3 Cost of sales (3,973.9) (3,828.6) (7,702.1) Gross profit 2 639.6 614.4 1.251.2 Net operating expenses (450.8) (412.1) (857.2) Operating profit 2 188.8 202.3 394.0 Operating profit before exceptional items 193.2 207.4 406.6 Exceptional operating items 3 (4.4) (5.1) (12.6) Finance income 4 8.0 8.3 14.6 Finance costs 5 (35.6) (19.5) (39.6) Finance costs before exceptional items 5 (21.7) (19.5) (39.6) Exceptional finance costs 3, 5 (13.9) – – Profit before tax 161.2 191.1 369.0 Tax 6 (45.7) (49.8) (93.4) Tax before exceptional tax 6 (45.8) (50.4) (96.1) Exceptional tax 3, 6 0.1 0.6 2.7 Profit for the period 115.5 141.3 275.6 Profit attributable to: – Owners of the parent 111.6 137.3 267.7 – Non-controlling interests 3.9 4.0 7.9 115.5 141.3 275.6 Basic earnings per share (pence) 7 26.9p 32.8p 64.3p Diluted earnings per share (pence) 7 26.8p 32.4p 63.6p
1. See note 14.
The notes on pages 17 to 31 are an integral part of these condensed consolidated interim financial statements.
inchcape.com
12

Consolidated Statement of Comprehensive Income (unaudited) For the six months ended 30 June 2018
inchcape.com 13
Six months to 30 Jun 2018
£m
Six months to 30 Jun 2017 (restated)1
£m
Year to 31 Dec 2017
(restated)1 £m
Profit for the period 115.5 141.3 275.6
Other comprehensive income / (loss):
Items that will not be reclassified to the consolidated income statement
Defined benefit pension scheme remeasurements 39.4 (4.0) 37.9
Current tax recognised in consolidated statement of comprehensive income (5.9) – –
Deferred tax recognised in consolidated statement of comprehensive income (0.6) 0.8 (5.5)
32.9 (3.2) 32.4
Items that may be reclassified subsequently to the consolidated income statement
Cash flow hedges 23.4 13.9 15.5
Exchange differences on translation of foreign operations (8.6) (37.2) (68.0)
Deferred tax recognised in consolidated statement of comprehensive income (6.3) (4.4) (5.0)
8.5 (27.7) (57.5)
Other comprehensive income / (loss) for the period, net of tax 41.4 (30.9) (25.1)
Total comprehensive income for the period 156.9 110.4 250.5
Total comprehensive income attributable to:
– Owners of the parent 151.7 105.4 242.2
– Non-controlling interests 5.2 5.0 8.3
156.9 110.4 250.5
1. See note 14.
The notes on pages 17 to 31 are an integral part of these condensed consolidated interim financial statements.
inchcape.com
13

Consolidated Statement of Financial Position (unaudited) As at 30 June 2018
inchcape.com 14
Notes
As at 30 Jun 2018
£m
As at 30 Jun 2017 (restated)1
£m
As at 31 Dec 2017
(restated)1 £m
Non-current assets
Intangible assets 772.3 618.5 639.5
Property, plant and equipment 833.6 765.0 788.4
Investments in joint ventures and associates 4.2 4.4 4.2
Available for sale financial assets 11d 7.0 3.6 7.3
Trade and other receivables 56.2 58.8 59.0
Deferred tax assets 25.8 31.5 36.7
Retirement benefit asset 120.3 74.1 105.9
1,819.4 1,555.9 1,641.0
Current assets
Inventories 1,747.4 1,642.5 1,768.6
Trade and other receivables 522.0 452.2 465.0
Available for sale financial assets 11d 0.2 – 0.2
Derivative financial instruments 11d 75.7 60.7 52.4
Current tax assets 10.3 18.4 10.1
Cash and cash equivalents 9b 930.8 768.2 926.9
3,286.4 2,942.0 3,223.2
Assets held for sale 12 13.7 6.4 13.8
3,300.1 2,948.4 3,237.0
Total assets 5,119.5 4,504.3 4,878.0
Current liabilities Trade and other payables (2,212.0) (2,056.0) (2,264.2)
Derivative financial instruments 11d (1.0) (35.3) (21.6)
Current tax liabilities (68.8) (72.2) (73.7)
Provisions (18.5) (22.4) (21.2)
Borrowings 9b (869.6) (411.5) (534.5)
(3,169.9) (2,597.4) (2,915.2)
Non-current liabilities
Trade and other payables (17.7) (29.2) (29.3)
Provisions (13.7) (10.4) (11.5)
Deferred tax liabilities (100.0) (79.0) (78.6)
Borrowings 9b (274.8) (414.1) (361.9)
Retirement benefit liability (27.3) (41.8) (33.6)
(433.5) (574.5) (514.9)
Total liabilities (3,603.4) (3,171.9) (3,430.1)
Net assets 1,516.1 1,332.4 1,447.9
Equity Share capital 8 41.6 41.6 41.6
Share premium 8 146.7 146.7 146.7
Capital redemption reserve 139.0 139.0 139.0
Other reserves (76.4) (54.3) (83.5)
Retained earnings 1,245.1 1,042.3 1,183.5
Equity attributable to owners of the parent 1,496.0 1,315.3 1,427.3
Non-controlling interests 20.1 17.1 20.6
Total equity 1,516.1 1,332.4 1,447.9
1. See note 14.
The notes on pages 17 to 31 are an integral part of these condensed consolidated interim financial statements.
inchcape.com
14

Consolidated Statement of Changes in Equity (unaudited) For the six months ended 30 June 2018
inchcape.com 15
Notes
Share capital
£m
Share premium
£m
Capital redemption
reserve £m
Other reserves
£m
Retained earnings
£m
Equity attributable
to equity owners of the
parent £m
Non- controlling
interests £m
Total shareholders’
equity £m
At 1 January 2017 42.2 146.7 138.4 (25.6) 1,042.2 1,343.9 18.6 1,362.5
Adjustment for IFRS 15 14 – – – – (5.8) (5.8) – (5.8)
At 1 January 2017 (restated)1 42.2 146.7 138.4 (25.6) 1,036.4 1,338.1 18.6 1,356.7
Profit for the period ended 30 June 2017 (restated)1
– – – – 137.3 137.3 4.0 141.3
Other comprehensive (loss) / income for the period ended 30 June 2017 (restated)1
– – – (28.7) (3.2) (31.9) 1.0 (30.9)
Total comprehensive income / (loss) for the period ended 30 June 2017 (restated)1
– – – (28.7) 134.1 105.4 5.0 110.4
Share-based payments, net of tax – – – – 5.1 5.1 – 5.1
Share buyback programme (0.6) – 0.6 – (50.2) (50.2) – (50.2) Net purchase of own shares by the Inchcape Employee Trust
– – – – (13.1) (13.1) – (13.1)
Dividends: – Owners of the parent 8b – – – – (70.0) (70.0) – (70.0)
– Non-controlling interests – – – – – – (6.5) (6.5)
At 30 June 2017 (restated)1 41.6 146.7 139.0 (54.3) 1,042.3 1,315.3 17.1 1,332.4
At 1 January 2017 42.2 146.7 138.4 (25.6) 1,042.2 1,343.9 18.6 1,362.5
Adjustment for IFRS 15 14 – – – – (5.8) (5.8) – (5.8)
At 1 January 2017 (restated)1 42.2 146.7 138.4 (25.6) 1,036.4 1,338.1 18.6 1,356.7
Profit for the year (restated)1 – – – – 267.7 267.7 7.9 275.6 Other comprehensive (loss) / income for the year (restated)1
– – – (57.9) 32.4 (25.5) 0.4 (25.1)
Total comprehensive income / (loss) for the year (restated)1
– – – (57.9) 300.1 242.2 8.3 250.5
Share-based payments, net of tax – – – – 11.0 11.0 – 11.0
Share buyback programme (0.6) – 0.6 – (50.2) (50.2) – (50.2) Net purchase of own shares by the Inchcape Employee Trust
– – – – (11.1) (11.1) – (11.1)
Dividends:
– Owners of the parent 8b – – – – (102.7) (102.7) – (102.7)
– Non-controlling interests – – – – – – (6.3) (6.3)
At 1 January 2018 (restated)1 41.6 146.7 139.0 (83.5) 1,183.5 1,427.3 20.6 1,447.9
Profit for the period ended 30 June 2018 – – – – 111.6 111.6 3.9 115.5 Other comprehensive income for the period ended 30 June 2018
– – – 7.1 33.0 40.1 1.3 41.4
Total comprehensive income for the period ended 30 June 2018
– – – 7.1 144.6 151.7 5.2 156.9
Share-based payments, net of tax – – – – 4.0 4.0 – 4.0 Net purchase of own shares by the Inchcape Employee Trust
– – – – (8.7) (8.7) – (8.7)
Dividends:
– Owners of the parent 8b – – – – (78.3) (78.3) – (78.3) – Non-controlling interests – – – – – – (5.7) (5.7)
At 30 June 2018 41.6 146.7 139.0 (76.4) 1,245.1 1,496.0 20.1 1,516.1
1. See note 14.
The notes on pages 17 to 31 are an integral part of these condensed consolidated interim financial statements.
inchcape.com
15
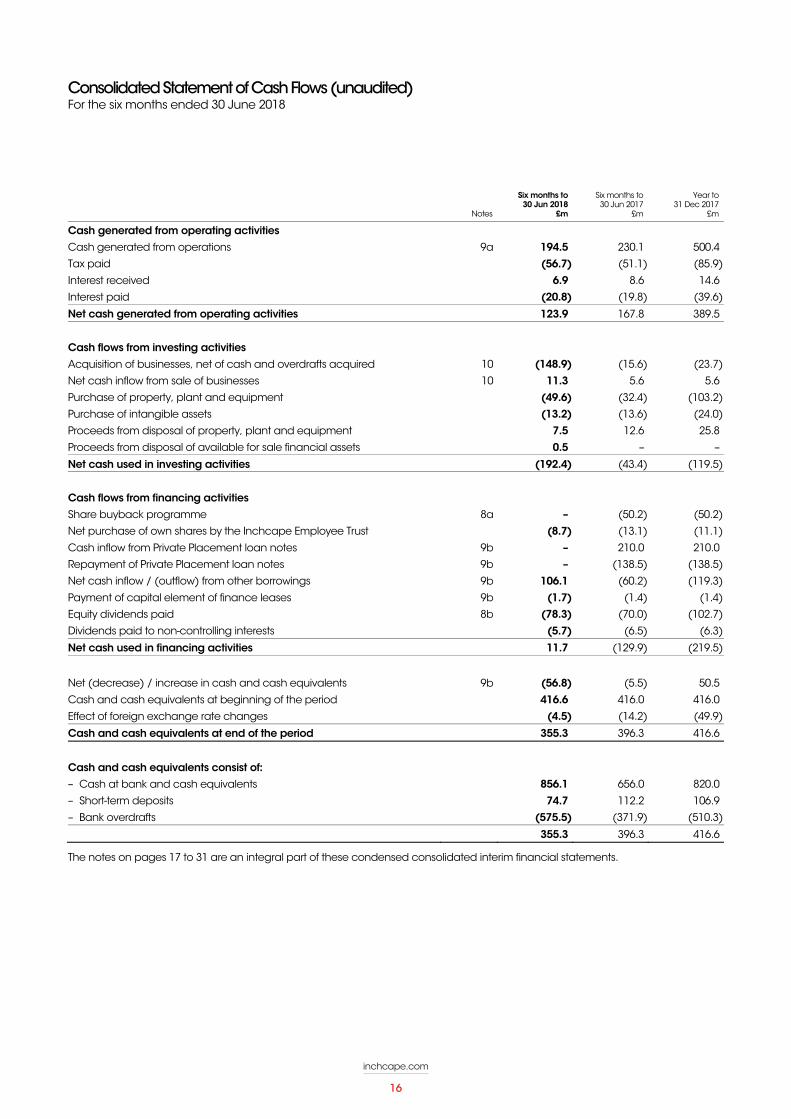
Consolidated Statement of Cash Flows (unaudited) For the six months ended 30 June 2018
inchcape.com 16
Notes
Six months to 30 Jun 2018
£m
Six months to 30 Jun 2017
£m
Year to 31 Dec 2017
£m
Cash generated from operating activities
Cash generated from operations 9a 194.5 230.1 500.4
Tax paid (56.7) (51.1) (85.9)
Interest received 6.9 8.6 14.6
Interest paid (20.8) (19.8) (39.6)
Net cash generated from operating activities 123.9 167.8 389.5
Cash flows from investing activities
Acquisition of businesses, net of cash and overdrafts acquired 10 (148.9) (15.6) (23.7)
Net cash inflow from sale of businesses 10 11.3 5.6 5.6
Purchase of property, plant and equipment (49.6) (32.4) (103.2)
Purchase of intangible assets (13.2) (13.6) (24.0)
Proceeds from disposal of property, plant and equipment 7.5 12.6 25.8
Proceeds from disposal of available for sale financial assets 0.5 – –
Net cash used in investing activities (192.4) (43.4) (119.5)
Cash flows from financing activities
Share buyback programme 8a – (50.2) (50.2)
Net purchase of own shares by the Inchcape Employee Trust (8.7) (13.1) (11.1)
Cash inflow from Private Placement loan notes 9b – 210.0 210.0
Repayment of Private Placement loan notes 9b – (138.5) (138.5)
Net cash inflow / (outflow) from other borrowings 9b 106.1 (60.2) (119.3)
Payment of capital element of finance leases 9b (1.7) (1.4) (1.4)
Equity dividends paid 8b (78.3) (70.0) (102.7)
Dividends paid to non-controlling interests (5.7) (6.5) (6.3)
Net cash used in financing activities 11.7 (129.9) (219.5)
Net (decrease) / increase in cash and cash equivalents 9b (56.8) (5.5) 50.5
Cash and cash equivalents at beginning of the period 416.6 416.0 416.0
Effect of foreign exchange rate changes (4.5) (14.2) (49.9)
Cash and cash equivalents at end of the period 355.3 396.3 416.6
Cash and cash equivalents consist of:
– Cash at bank and cash equivalents 856.1 656.0 820.0
– Short-term deposits 74.7 112.2 106.9
– Bank overdrafts (575.5) (371.9) (510.3)
355.3 396.3 416.6
The notes on pages 17 to 31 are an integral part of these condensed consolidated interim financial statements.
inchcape.com
16

Notes (unaudited)
inchcape.com 17
1 BASIS OF PREPARATION AND ACCOUNTING POLICIES Basis of preparation The condensed consolidated interim financial statements for the period ended 30 June 2018 have been prepared on a going concern basis in accordance with International Accounting Standard 34 ‘Interim Financial Reporting’ as adopted by the European Union and the Disclosure and Transparency Rules of the Financial Conduct Authority. These condensed consolidated interim financial statements should be read in conjunction with the Annual Report and Accounts 2017, which have been prepared in accordance with IFRSs as adopted by the European Union and International Financial Reporting Interpretation Committee (IFRIC) interpretations and with those parts of the Companies Act 2006 applicable to companies reporting under IFRS.
These condensed consolidated interim financial statements are unaudited, but have been reviewed by the external auditors. The condensed consolidated interim financial statements in the Interim Report do not constitute statutory accounts within the meaning of Section 434 of the Companies Act 2006. The Group’s published consolidated financial statements for the year ended 31 December 2017 were approved by the Board of Directors on 26 February 2018 and delivered to the Registrar of Companies. The report of the auditors on those accounts was unqualified and did not contain an emphasis of matter paragraph or a statement under section 498 of the Companies Act 2006. The condensed consolidated interim financial statements on pages 12 to 31 were approved by the Board of Directors on 25 July 2018.
Newly adopted accounting policies The accounting policies adopted in the preparation of the condensed consolidated interim financial statements are consistent with those of the Group’s Annual Report and Accounts 2017 other than taxes on income which are accrued using the tax rate that is expected to be applicable for the full financial year, and the following standards which have been newly adopted from 1 January 2018:
IFRS 9 Financial instruments IFRS 9 brings together the classification and measurement, impairment and hedge accounting aspects of the International Accounting Standards Board’s project to replace IAS 39.
Classification and measurement IFRS 9 amends the classification and measurement of financial assets:
Financial assets are either measured at amortised cost, fair value through other comprehensive income (FVTOCI) or fair value through profit or loss (FVTPL);
Financial assets are measured at amortised cost or FVTOCI if certain restrictive conditions are met. All other financial assets are measured at FVTPL; and
All investments in equity instruments are measured at fair value. For those investments in equity instruments that are not held for trading, there is an irrevocable election to present gains and losses in other comprehensive income (OCI). Dividends are recognised in profit or loss.
The adoption of IFRS 9 has had no impact on the classification and measurement of the Group’s financial assets or financial liabilities.
Impairment The new impairment model in IFRS 9 is now based on an ‘expected loss’ model rather than an ‘incurred loss’ model. Under the impairment approach in IFRS 9, it is not necessary for a credit event to have occurred before credit losses are recognised. Instead, an entity should account for expected credit losses and changes in those expected credit losses. A simplified impairment model is applicable to trade and other contractual receivables with maturities that are less than 12 months. For trade and other contractual receivables with maturity longer than 12 months, entities have a choice of applying the complex three stage model or the simplified model. The Group has applied the simplified approach to the recognition of lifetime expected credit losses for its trade receivables and the calculation of the loss allowance for these assets as at 1 January 2018 was broadly in line with the loss allowance calculated under IAS 39.
Hedge accounting On initial application of IFRS 9, an entity may choose, as its accounting policy, to continue to apply the hedge accounting requirements of IAS 39 instead of the hedge accounting requirements of IFRS 9. The Group has elected to apply IFRS 9 hedge accounting requirements because they are more closely aligned with the way that the Group manages its risks. Under the new hedge accounting requirements:
The 80-125% highly effective threshold has been removed;
Risk components of non-financial items can qualify for hedge accounting provided that the risk component is separately identifiable and reliably measurable;
An aggregated position (i.e. combination of a derivative and a non-derivative) can qualify for hedge accounting provided that it is managed as one risk exposure;
When entities designate the intrinsic value of options, the initial time value is deferred in OCI and subsequent changes in time value are recognised in OCI;
When entities designate only the spot element of a forward contract, the forward points can be deferred in OCI and subsequent changes in forward points are recognised in OCI. Initial foreign currency basis spread can also be deferred in OCI with subsequent changes be recognised in OCI; and
Net foreign exchange cash flow positions can qualify for hedge accounting.
inchcape.com
17

Notes (unaudited) continued
inchcape.com 18
1 BASIS OF PREPARATION AND ACCOUNTING POLICIES CONTINUED IFRS 9 Financial instruments continued The Group currently applies hedge accounting to:
the Group’s cross currency interest rate swaps that are used to hedge the fixed interest rate risk and the forward foreign currency risks associated with the Group’s Private Placement loan notes denominated in US dollars; and
the transactional currency exposures on the purchases of vehicles and parts in a currency other than an operating unit’s functional currency.
An assessment of the Group’s hedging relationships under IFRS 9 has been performed and it has been determined that the relationships qualify as continuing hedging relationships under the new standard and therefore the application of IFRS 9 has not had a material impact on the Group’s consolidated financial statements.
The Group has elected not to restate comparatives on initial application of IFRS 9.
IFRS 15 Revenue from contracts with customers IFRS 15 establishes a single comprehensive model for entities to use in accounting for revenue arising from contracts with customers. It supersedes the previous revenue recognition guidance including IAS 18 Revenue and IAS 11 Construction contracts, and has been effective for the Group from 1 January 2018.
The core principle of IFRS 15 is that an entity should recognise revenue to depict the transfer of promised goods or services to customers in an amount that reflects the consideration to which the entity expects to be entitled in exchange for those goods or services. Specifically, the standard introduces a five-step approach to revenue recognition:
Step 1: Identify the contract(s) with a customer
Step 2: Identify the performance obligations in the contract
Step 3: Determine the transaction price
Step 4: Allocate the transaction price to the performance obligations in the contract
Step 5: Recognise revenue when (or as) each performance obligation is satisfied
The following revenue streams have been identified as being impacted by the adoption of the new standard:
Area Previous treatment New treatment under IFRS 15
The provision of extended warranties to customers over and above the OEM warranty where the Group acts as the principal in the supply of the warranty service.
The Group provides an estimate of the cost of fulfilling the future obligation on the sale of the vehicle. The cost of fulfilling the obligation when it arises is then charged against the provision.
A proportion of revenue will be allocated to the extended warranty obligation and deferred to the balance sheet. The revenue will subsequently be recognised over time along with the costs incurred in fulfilling any warranty obligations.
The sale of vehicles which are subject to a buyback commitment and the possibility of the buyback being exercised by the customer is not highly likely as the buyback price set is below the expected market value.
Revenue and profit associated with vehicles sold subject to a buyback commitment are deferred and recognised over the period of the commitment.
Revenue is recognised in full when the vehicle is sold. However, an estimate of the value of the buyback payments is deducted from revenue and deferred to the balance sheet. Similarly, an estimate of the value of the vehicles to be returned is deducted from cost of sales and also deferred to the balance sheet.
Payments made by a Distribution business to a dealer in the form of a discount, rebate, credit note or some other form of incentive.
In most cases, these are deducted from revenue.
The new standard clarifies that all transactions that fall within this category should be accounted for as a reduction in revenue by the Distributor and not as an expense within cost of sales.
Additional services included in the sale of a vehicle to a customer as part of the total vehicle package (e.g. free servicing, roadside assistance, fuel coupons etc) where the Group is acting as a principal in the fulfilment of the service at a future date, rather than simply as an agent in selling the additional service and with no continuing obligation.
Varies dependent on the conclusions reached with regards to whether the Group is acting as principal or agent. Where the Group is acting as an agent, revenue is recognised in full on the sale of a vehicle. Where the Group is acting as principal, revenue is deferred.
The new standard set outs more comprehensive guidance on principal and agent relationships.
Where the Group acts as principal, the value of the additional services should be separately identified, deducted from revenue, recognised as deferred revenue on the balance sheet and subsequently recognised as revenue when the service is provided, or over the period to which the service relates.
Where the Group acts as an agent, the net amount retained after the deduction of any costs paid to the principal is recognised as revenue. If a product or service is provided free to a customer, then the costs paid to the principal should be deducted from revenue rather than charged to cost of sales.
inchcape.com
18

Notes (unaudited) continued
inchcape.com 19
1 BASIS OF PREPARATION AND ACCOUNTING POLICIES CONTINUED Area Previous treatment New treatment under IFRS 15
Vehicle registration and similar fees which are charged to the customer on the sale of a vehicle and which are collected by the Group on behalf of an authority.
In most, but not all, cases these are excluded from revenue.
The new standard set outs more comprehensive guidance on principal and agent relationships.
As a consequence of the new guidance, where it is concluded that the Group is acting as an agent of a government in the collection of such fees, the amount of the vehicle registration fee should be excluded from revenue.
The Group has elected to apply the new standard retrospectively to each prior reporting period, and has accordingly restated the comparative information for the immediately preceding periods in accordance with IAS 8 Accounting Policies, Changes in Accounting Estimates and Errors. Further details of the restatement can be seen in Note 14 to these condensed consolidated interim financial statements.
Standards not yet effective The following standards were in issue but were not yet effective at the balance sheet date. These standards have not yet been early adopted by the Group, and will be applied for the Group’s financial years commencing on or after 1 January 2019:
IAS 7, ‘Amendment to IAS 7, Cash flow statements’
IAS 12, ‘Amendment to IAS 12, Income taxes’
IAS 27, ‘Amendment to IAS 27, Separate financial statements’
IFRS 2, ‘Amendment to IFRS 2, Share-based payment’
IFRS 16, ‘Leases’
Management are currently reviewing the new standards to assess the impact that they may have on the Group’s reported position and performance. Management do not expect that the adoption of the standards listed above will have a material impact on the financial statements of the Group, except as noted below:
IFRS 16 Leases IFRS 16 introduces a comprehensive model for the identification of lease arrangements and accounting treatments for both lessees and lessors. IFRS 16 will supersede the current guidance on leases including IAS 17 Leases and the related interpretations when it becomes effective for the Group’s financial year commencing 1 January 2019.
Under IFRS 16, the distinction between operating leases (off balance sheet) and finance leases (on balance sheet) is removed for lessee accounting and replaced with a model where a right-of-use asset and a corresponding liability are recognised for all leases by lessees. As a result, all leases will be on balance sheet except for short-term leases and leases of low value assets.
The right-of-use asset is initially measured at cost and subsequently measured at cost less accumulated depreciation. The lease liability is initially measured at the present value of the lease payments. Subsequently, the lease liability is adjusted for interest and lease payments. As a consequence, earnings before interest, depreciation, amortisation and tax (EBITDA) will increase because operating lease expenses currently included in EBITDA will be recognised instead as amortisation of the right-of-use asset and interest expense on the lease liability. However, there will be an overall reduction in profit before tax in the early years of a lease because the amortisation and interest charges will exceed the current straight-line expense incurred under IAS 17. In addition, the classification of cash flows will also be affected because operating lease payments under IAS 17 are presented within operating cash flows, whereas under IFRS 16 the payments will be split into a principal and interest portion which will be presented as financing and operating cash flows respectively.
As at 31 December 2017, the Group had non-cancellable operating lease commitments of £410.7m. A preliminary assessment indicated that these arrangements would meet the definition of a lease under IFRS 16 and hence the Group will recognise a right-of-use asset and a corresponding liability in respect of all these leases unless they qualify as short-term or low value leases. The new requirement to recognise a right-of-use asset and related lease liability is expected to have a significant impact on the amounts recognised in the Group’s financial statements. Management are currently assessing the potential impact and at this stage it is not practicable to provide a reasonable estimate of the financial effect until this review is complete. Management anticipates electing to apply the new standard on a fully retrospective basis, restating the comparative information for the immediately preceding periods in accordance with IAS 8 Accounting Policies, Changes in Accounting Estimates and Errors.
inchcape.com
19

Notes (unaudited) continued
inchcape.com 20
1 BASIS OF PREPARATION AND ACCOUNTING POLICIES CONTINUED Significant accounting judgements and estimates Goodwill The Group’s policy is that goodwill is not subject to amortisation but is tested for impairment annually and whenever events or circumstances indicate that the carrying amount may not be recoverable. An impairment loss is recognised for the amount by which the asset’s carrying amount exceeds its recoverable amount, the latter being the higher of the asset’s fair value less costs to sell and value in use. Value in use calculations are performed using cash flow projections, discounted at a pre-tax rate which reflects the asset specific risks and the time value of money.
At the end of 2017, the Group reported that the headroom attributable to the UK Retail Cash Generating Unit (CGU) was 24%. In the first half of 2018, the UK New Car market declined by 6.3%, continuing the weak trend from 2017. In addition, the supply imbalance and the elevated level of pre-registration activity resulted in pressure on both New and Used margins.
As a result the Group has updated the impairment test for the UK Retail CGU in the first half of the year based on a value in use calculation. This calculation used cash flow projections based on revised five year financial forecasts prepared by management. The key assumptions for these forecasts were those relating to volumes, gross margins, the level of working capital required to support trading and capital expenditure and have been based on past experience, recent trading and expectations of future changes in the market, consistent with external sources of information. Cash flows after the five year period were extrapolated using a growth rate of 2.0% for a further five years. A terminal value calculation was used to estimate the cash flows after year ten using a long-term growth rate of 2.0%. These cash flows were then discounted back to present value using a risk adjusted discount rate of 10.3%.
The carrying amount of UK Retail goodwill as at 30 June 2018 was £266m, almost all of which arose prior to 2008. The base case value in use calculation for the UK Retail CGU resulted in headroom of approximately £46m (8% of the total carrying value of the UK Retail CGU). A sensitivity analysis to potential changes in gross profit per unit was applied to the base case value in use calculation. The sensitivities applied were to gross margins for New vehicles, Used vehicles and Aftersales. The table below shows the amount by which each would need to decrease in isolation, with no consequential changes in other assumptions, in order for the estimated recoverable amount to equal the carrying value of assets.
Assumption Change required for the carrying value to exceed the recoverable amount
New vehicle margin (25 bps)
Used vehicle margin (30 bps)
Aftersales margin (100 bps)
Foreign currency translation The principal exchange rates used for translation purposes are as follows:
Average rates Period end rates
30 Jun 2018 30 Jun 2017 31 Dec 2017 30 Jun 2018 30 Jun 2017 31 Dec 2017
Australian dollar 1.78 1.68 1.69 1.78 1.70 1.73
Chilean peso 842.07 837.69 843.40 863.66 864.97 832.35
Euro 1.14 1.17 1.15 1.13 1.14 1.13
Hong Kong dollar 10.76 9.85 10.11 10.36 10.16 10.57
Singapore dollar 1.82 1.77 1.79 1.80 1.79 1.81
Russian rouble 81.27 73.62 75.56 82.93 76.71 77.88
inchcape.com
20

Notes (unaudited) continued
inchcape.com 21
2 SEGMENTAL ANALYSIS The Group has eight reportable segments which have been identified based on the operating segments of the Group that are regularly reviewed by the chief operating decision maker, which has been determined to be the Executive Committee, in order to assess performance and allocate resources. Operating segments are then aggregated into reporting segments to combine those with similar economic characteristics. The following summary describes the operations of each of the Group’s reportable segments:
Distribution Australasia Distribution of new vehicles and parts in Australia and New Zealand together with associated marketing and logistics operations.
UK and Europe Distribution of new vehicles and parts, together with associated marketing activities, in mature European markets.
Asia Exclusive distribution and sale of new vehicles and parts, in Asian markets, together with associated aftersales activities of service and bodyshop repairs.
Emerging Markets Distribution of new vehicles and parts, in growing markets, together with associated aftersales activities of service and bodyshop repairs.
Retail Australasia Sale of new and used vehicles in Australia together with associated aftersales activities of service, bodyshop repairs and parts sales.
UK and Europe Sale of primarily new and used premium vehicles in mature markets, together with associated aftersales activities of service, bodyshop repairs and parts sales.
Emerging Markets Sale of new and used vehicles in growing markets together with associated aftersales activities of service, bodyshop repairs and parts sales.
Central Comprises the Group’s head office function and includes all central activities including the Board, finance, human resources, marketing, governance and global information services.
Distribution
Six months to 30 June 2018 Australasia
£m
UK and Europe
£m Asia
£m
Emerging Markets
£m
Total Distribution
£m
Revenue from third parties 408.5 471.4 789.1 439.6 2,108.6
Results Trading profit / (loss) 40.4 17.2 85.8 37.5 180.9 Operating exceptional items – – – – –
Operating profit / (loss) after exceptional items 40.4 17.2 85.8 37.5 180.9
Distribution
Six months to 30 June 2017 (restated) Australasia
£m
UK and Europe
£m Asia
£m
Emerging Markets
£m
Total Distribution
£m
Revenue from third parties 389.8 430.6 806.9 385.1 2,012.4
Results Trading profit / (loss) 28.1 15.0 74.9 42.6 160.6
Operating exceptional items – (1.8) – (0.6) (2.4)
Operating profit / (loss) after exceptional items 28.1 13.2 74.9 42.0 158.2
Distribution
Year to 31 December 2017 (restated) Australasia
£m
UK and Europe
£m Asia
£m
Emerging Markets
£m
Total Distribution
£m
Revenue from third parties 834.6 885.9 1,692.6 794.8 4,207.9
Results Trading profit / (loss) 71.3 31.2 156.0 86.6 345.1
Operating exceptional items (0.1) (5.2) (0.1) (2.4) (7.8)
Operating profit / (loss) after exceptional items 71.2 26.0 155.9 84.2 337.3
inchcape.com
21
Notes (unaudited) continued
inchcape.com 22
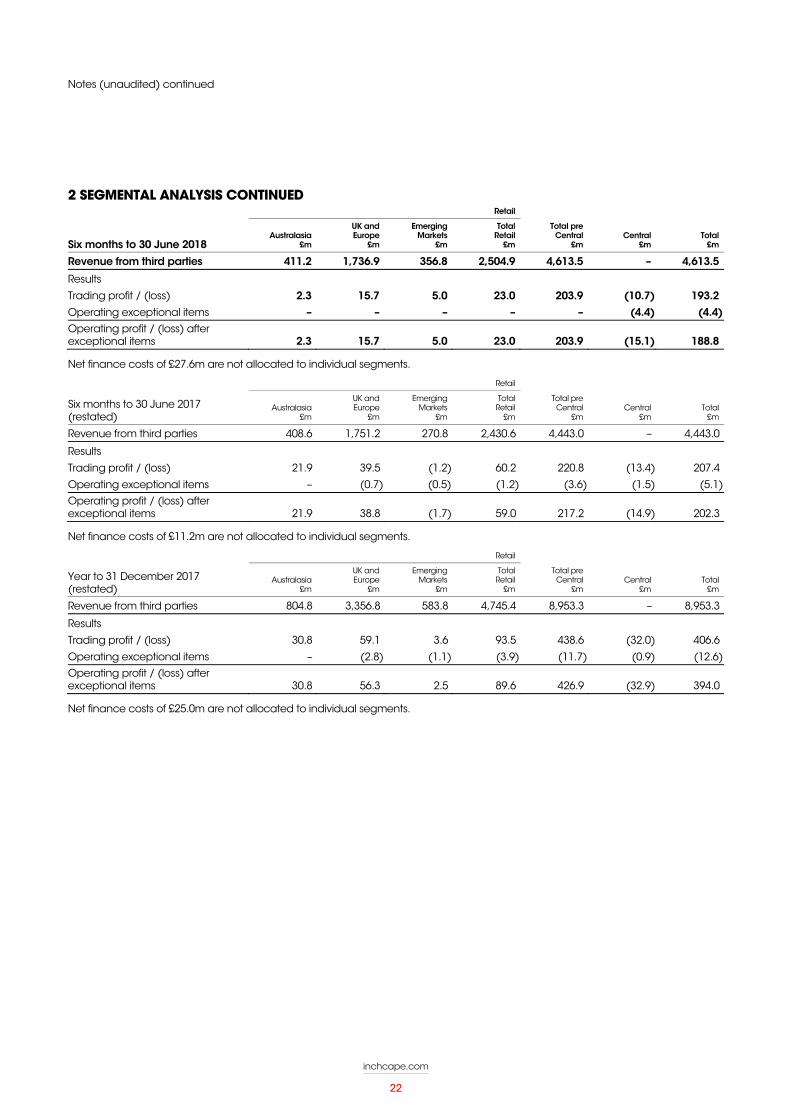
2 SEGMENTAL ANALYSIS CONTINUED Retail
Six months to 30 June 2018 Australasia
£m
UK and Europe
£m
Emerging Markets
£m
Total Retail
£m
Total pre Central
£m Central
£m Total
£m
Revenue from third parties 411.2 1,736.9 356.8 2,504.9 4,613.5 – 4,613.5
Results Trading profit / (loss) 2.3 15.7 5.0 23.0 203.9 (10.7) 193.2 Operating exceptional items – – – – – (4.4) (4.4) Operating profit / (loss) after exceptional items 2.3 15.7 5.0 23.0 203.9 (15.1) 188.8
Net finance costs of £27.6m are not allocated to individual segments.
Retail
Six months to 30 June 2017 (restated)
Australasia £m
UK and Europe
£m
Emerging Markets
£m
Total Retail
£m
Total pre Central
£m Central
£m Total
£m
Revenue from third parties 408.6 1,751.2 270.8 2,430.6 4,443.0 – 4,443.0
Results
Trading profit / (loss) 21.9 39.5 (1.2) 60.2 220.8 (13.4) 207.4
Operating exceptional items – (0.7) (0.5) (1.2) (3.6) (1.5) (5.1) Operating profit / (loss) after exceptional items 21.9 38.8 (1.7) 59.0 217.2 (14.9) 202.3
Net finance costs of £11.2m are not allocated to individual segments.
Retail
Year to 31 December 2017 (restated)
Australasia £m
UK and Europe
£m
Emerging Markets
£m
Total Retail
£m
Total pre Central
£m Central
£m Total
£m
Revenue from third parties 804.8 3,356.8 583.8 4,745.4 8,953.3 – 8,953.3
Results Trading profit / (loss) 30.8 59.1 3.6 93.5 438.6 (32.0) 406.6
Operating exceptional items – (2.8) (1.1) (3.9) (11.7) (0.9) (12.6) Operating profit / (loss) after exceptional items 30.8 56.3 2.5 89.6 426.9 (32.9) 394.0
Net finance costs of £25.0m are not allocated to individual segments.
inchcape.com
22

Notes (unaudited) continued
inchcape.com 23
2 SEGMENTAL ANALYSIS CONTINUED Gross profit for Distribution and Retail activities is analysed as follows. Certain prior period comparatives have been reclassified for consistency of presentation:
Six months to 30 June 2018 Vehicles
£m Aftersales
£m Total
£m
Distribution 248.7 142.0 390.7 Retail 153.7 95.2 248.9
Group 402.4 237.2 639.6
Six months to 30 June 2017 (restated) Vehicles
£m Aftersales
£m Total
£m
Distribution 213.9 139.7 353.6
Retail 167.8 93.0 260.8
Group 381.7 232.7 614.4
Year to 31 December 2017 (restated) Vehicles
£m Aftersales
£m Total
£m
Distribution 457.7 290.1 747.8
Retail 317.1 186.3 503.4
Group 774.8 476.4 1,251.2
3 EXCEPTIONAL ITEMS
Six months to 30 Jun 2018
£m
Six months to 30 Jun 2017
£m
Year to 31 Dec 2017
£m
Acquisition of businesses (4.4) (1.3) (2.1)
Restructuring costs – (3.8) (10.5)
Total exceptional operating items (4.4) (5.1) (12.6)
Exceptional finance costs (see note 5) (13.9) – –
Total exceptional items before tax (18.3) (5.1) (12.6)
Exceptional tax 0.1 0.6 2.7
Total exceptional items (18.2) (4.5) (9.9)
During the period exceptional operating costs of £4.4m have been incurred in connection with the acquisition and integration of the Grupo Rudelman business in Central America.
In 2017 the Group incurred restructuring costs of £10.5m as part of a Group-wide programme commenced in 2016 to better align the organisation with the Ignite strategy. The costs incurred comprised headcount reduction and costs associated with the redevelopment of the third party Retail network in certain markets. Exceptional costs of £2.1m were also incurred in relation to the 2016 acquisition of the Subaru, Hino and associated Distribution businesses in South America.
4 FINANCE INCOME
Six months to 30 Jun 2018
£m
Six months to 30 Jun 2017
£m
Year to 31 Dec 2017
£m
Bank and other interest receivable 4.5 3.9 7.2
Net interest income on post-retirement plan assets and liabilities 1.0 0.7 1.4
Other finance income 2.5 3.7 6.0
Total finance income 8.0 8.3 14.6
inchcape.com
23

Notes (unaudited) continued
inchcape.com 24
5 FINANCE COSTS
Six months to 30 Jun 2018
£m
Six months to 30 Jun 2017
£m
Year to 31 Dec 2017
£m
Interest payable on bank borrowings 4.4 5.0 7.7
Interest payable on Private Placement 3.5 2.7 6.0
Interest payable on other borrowings 0.1 0.1 0.2
Fair value adjustment on Private Placement1 14.5 (25.4) (34.3)
Fair value (gain) / loss on cross-currency interest rate swaps (0.4) 24.7 33.1
Stock holding interest 12.1 12.4 24.3
Other finance costs 1.4 – 2.7
Capitalised borrowing costs – – (0.1)
Total finance costs 35.6 19.5 39.6
Total finance costs are analysed as follows:
Finance costs before exceptional items 21.7 19.5 39.6
Exceptional finance costs1 13.9 – –
Total finance costs 35.6 19.5 39.6
1. Included within finance costs is a fair value adjustment in relation to the Group’s Private Placement Loan Notes of £14.5m. Included within this is £13.9m which represents a non-recurring correction to the fair value basis of assessment relating to prior periods. This amount has been reported as an exceptional item in order to provide additional useful information regarding the Group’s underlying business performance.
6 INCOME TAX
Six months to 30 Jun 2018
£m
Six months to 30 Jun 2017 (restated)1
£m
Year to 31 Dec 2017
(restated)1 £m
Current tax – UK corporation tax 0.9 4.5 3.9
– Overseas tax 42.4 47.6 98.3
Adjustments to prior year liabilities – UK 0.9 – 2.2
– Overseas (0.1) (0.1) (0.5)
Current tax 44.1 52.0 103.9
Deferred tax 1.6 (2.2) (10.5)
Total tax charge 45.7 49.8 93.4
The total tax charge is analysed as follows:
– Tax charge on profit before exceptional items 45.8 50.4 96.1
– Tax credit on exceptional items (0.1) (0.6) (2.7)
Total tax charge 45.7 49.8 93.4
1. See note 14.
The effective tax rate for the half year, before exceptional items, is 25.5% compared to 25.7% (restated) for the same period last year. The effective rate for the half year, after exceptional items, is 28.3% (26.1% (restated) for the same period last year).
In October 2017 the EU Commission opened a formal State Aid investigation into an exemption within the UK’s current Controlled Foreign Company (‘CFC’) regime (introduced in 2013) for certain finance income. The investigation is ongoing, but if the Commission ultimately concludes that the provisions do constitute State Aid then they would require the UK to recover any such aid from affected parties.
The Group has claimed the benefit of this exemption, and therefore may be adversely affected by the outcome of the investigation. If the Commission were to conclude that the finance exemption with the UK’s CFC regime constitutes State Aid and no other exemptions were available to the Group then, as at 30 June 2018, an additional liability of £4.8m in respect of tax and £0.3m in respect of interest would arise unless such a decision could be successfully challenged in the EU Courts. However, no provision has been made in respect of this investigation since we believe that it is more likely than not that no additional tax will ultimately be due.
inchcape.com
24

Notes (unaudited) continued
inchcape.com 25
6 INCOME TAX CONTINUED Franked Investment Income Group Litigation Order The Group is a participant in an action in the United Kingdom against HM Revenue and Customs (HMRC) in the Franked Investment Income Group Litigation Order (FII GLO). There are 25 corporate groups in the FII GLO. The action concerns the treatment for UK corporate tax purposes of profits earned overseas and distributed to the UK.
As reported previously, the resolution of the test case in the FII GLO remains incomplete. The Group has in the meantime joined an action at the High Court to establish whether judgment should be entered for non-test claims, also involving the determination of some issues that do not arise in the test case. A positive judgment would result in the recovery by Inchcape of amounts claimed from HMRC. However, this judgment would remain subject to the final conclusion of the test case and so could be amended resulting in a reduction of the non-test case recoveries and thus a repayment to HMRC.
As at 30 June 2018, no further receipts have been recognised in relation to the balance of the Group’s claim in the FII GLO due to the uncertainty of the eventual outcome given the test case has not yet completed nor has the Group’s specific claim been heard by the Courts. However, subject to the final resolution of the test case, the minimum value of the Group’s case has been agreed with HMRC and is £35.8m calculated on a simple interest basis.
7 EARNINGS PER SHARE
Six months to 30 Jun 2018
£m
Six months to 30 Jun 2017 (restated)1
£m
Year to 31 Dec 2017
(restated)1 £m
Profit for the period 115.5 141.3 275.6
Non-controlling interests (3.9) (4.0) (7.9)
Basic earnings 111.6 137.3 267.7
Exceptional items 18.2 4.5 9.9
Adjusted earnings 129.8 141.8 277.6
Basic earnings per share 26.9p 32.8p 64.3p
Diluted earnings per share 26.8p 32.4p 63.6p
Basic Adjusted earnings per share 31.3p 33.9p 66.7p
Diluted Adjusted earnings per share 31.2p 33.4p 66.0p
1. See note 14.
Six months to 30 Jun 2018
number
Six months to 30 Jun 2017
number
Year to 31 Dec 2017
number
Weighted average number of fully paid ordinary shares in issue during the period 415,052,664 419,438,037 417,209,998
Weighted average number of fully paid ordinary shares in issue during the period:
– Held by the Inchcape Employee Trust (632,844) (1,420,227) (1,181,859)
Weighted average number of fully paid ordinary shares for the purposes of basic EPS 414,419,820 418,017,810 416,028,139
Dilutive effect of potential ordinary shares 2,270,094 6,158,971 4,735,677 Adjusted weighted average number of fully paid ordinary shares in issue during the period for the purposes of diluted EPS 416,689,914 424,176,781 420,763,816
Basic earnings per share is calculated by dividing the Basic earnings for the period by the weighted average number of fully paid ordinary shares in issue during the period, less those shares held by the Inchcape Employee Trust and repurchased as part of the share buyback programme.
Diluted earnings per share is calculated on the same basis as the Basic earnings per share with a further adjustment to the weighted average number of fully paid ordinary shares to reflect the effect of all dilutive potential ordinary shares. Dilutive potential ordinary shares comprise share options and other share-based awards.
Basic Adjusted earnings (which excludes exceptional items) is adopted to assist the reader in understanding the underlying performance of the Group. Adjusted earnings per share is calculated by dividing the Adjusted earnings for the period by the weighted average number of fully paid ordinary shares in issue during the period, less those shares held by the Inchcape Employee Trust and repurchased as part of the share buyback programme.
Diluted Adjusted earnings per share is calculated on the same basis as the Basic Adjusted earnings per share with a further adjustment to the weighted average number of fully paid ordinary shares to reflect the effect of all dilutive potential ordinary shares. Dilutive potential ordinary shares comprise share options and other share-based awards.
inchcape.com
25

Notes (unaudited) continued
inchcape.com 26
8 SHAREHOLDERS’ EQUITY A. Issue of ordinary shares During the period, the Group issued £nil (June 2017 – £nil, Dec 2017 – £nil) of ordinary shares exercised under the Group's share option schemes.
Share buyback programme In light of the acquisition of Grupo Rudelman on 26 March 2018, the Board decided not to continue with the share repurchase programme which was announced on 27 February 2018. The Board will however continue to evaluate the Group’s allocation of capital over time.
Therefore, during the six months ended 30 June 2018, the Group repurchased none of its own shares (June 2017 – 6,129,028, Dec 2017 – 6,129,028) through purchases on the London Stock Exchange, at a cost of £nil (June 2017 – £49.8m, Dec 2017 – £49.8m). The shares repurchased during the prior periods were cancelled, with none held as treasury shares at the end of the reporting period. An amount of £nil (June 2017 – £0.6m, Dec 2017 – £0.6m), equivalent to the nominal value of the cancelled shares, was transferred to the capital redemption reserve in the prior periods. Costs of £nil (June 2017 – £0.4m, Dec 2017 – £0.4m) associated with the transfer to the Group of the repurchased shares and their subsequent cancellation were charged to the profit and loss reserve in the prior periods.
B. Dividends The following dividends were paid by the Group:
Six months to 30 Jun 2018
£m
Six months to 30 Jun 2017
£m
Year to 31 Dec 2017
£m
Final dividend for the year ended 31 December 2017 of 18.9p per share (2016 – 16.8p per share) 78.3 70.0 70.0 Interim dividend for the six months ended 30 June 2017 of 7.9p per share (2016 – 7.0p per share) – – 32.7
78.3 70.0 102.7
An interim dividend of 8.9p per share (£36.9m) for the period ending 30 June 2018 was approved by the Board on 25 July 2018 and will be paid on Wednesday 5 September 2018 to shareholders who are on the register at close of business on Friday 3 August 2018. The Dividend Reinvestment Plan (DRIP) is available to ordinary shareholders and the final date for receipt of elections to participate in the DRIP is 14 August 2018.
9 NOTES TO THE STATEMENT OF CASH FLOWS A. Reconciliation of cash generated from operations
Six months to 30 Jun 2018
£m
Six months to 30 Jun 2017 (restated)1
£m
Year to 31 Dec 2017
(restated)1 £m
Cash flows from operating activities
Operating profit 188.8 202.3 394.0
Exceptional items 4.4 5.1 12.6
Amortisation including non-exceptional impairment of intangible assets 5.5 9.0 13.8
Depreciation of property, plant and equipment 22.0 22.1 43.8
Profit on disposal of property, plant and equipment (1.1) (9.0) (10.6)
Share-based payments charge 3.7 5.0 10.2
Decrease / (increase) in inventories 65.9 (99.6) (239.6)
Increase in trade and other receivables (30.0) (15.7) (36.1)
(Decrease) / increase in trade and other payables (80.2) 135.9 350.8
Increase / (decrease) in provisions 0.9 (4.7) (6.1)
Pension contributions less the pension charge for the period2 18.7 1.2 3.1
Decrease / (increase) in interest in leased vehicles 4.2 1.1 (1.4)
Payments in respect of operating exceptional items (6.3) (21.9) (32.1)
Other non-cash items (2.0) (0.7) (2.0)
Cash generated from operations 194.5 230.1 500.4
1. See note 14.
2. Includes additional payments of £1.5m (June 2017 – £1.5m, Dec 2017 – £2.7m).
inchcape.com
26
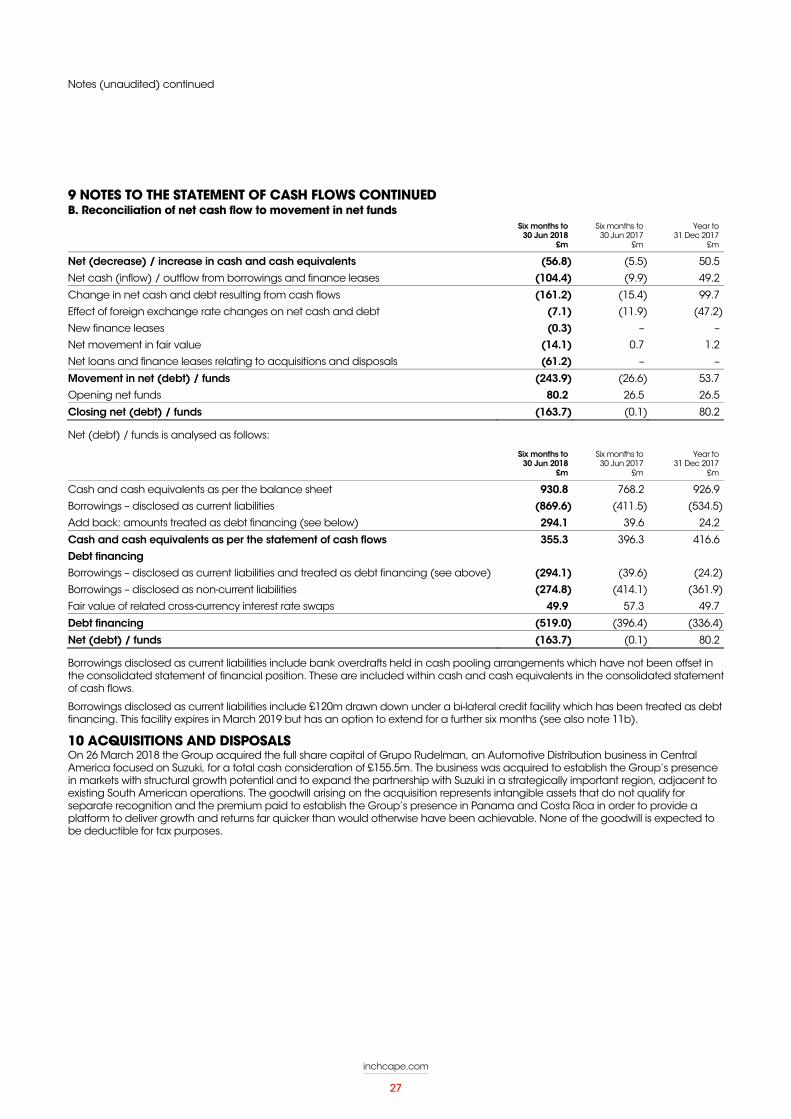
Notes (unaudited) continued
inchcape.com 27
9 NOTES TO THE STATEMENT OF CASH FLOWS CONTINUED B. Reconciliation of net cash flow to movement in net funds
Six months to 30 Jun 2018
£m
Six months to 30 Jun 2017
£m
Year to 31 Dec 2017
£m
Net (decrease) / increase in cash and cash equivalents (56.8) (5.5) 50.5
Net cash (inflow) / outflow from borrowings and finance leases (104.4) (9.9) 49.2
Change in net cash and debt resulting from cash flows (161.2) (15.4) 99.7
Effect of foreign exchange rate changes on net cash and debt (7.1) (11.9) (47.2)
New finance leases (0.3) – –
Net movement in fair value (14.1) 0.7 1.2
Net loans and finance leases relating to acquisitions and disposals (61.2) – –
Movement in net (debt) / funds (243.9) (26.6) 53.7
Opening net funds 80.2 26.5 26.5
Closing net (debt) / funds (163.7) (0.1) 80.2
Net (debt) / funds is analysed as follows:
Six months to 30 Jun 2018
£m
Six months to 30 Jun 2017
£m
Year to 31 Dec 2017
£m
Cash and cash equivalents as per the balance sheet 930.8 768.2 926.9
Borrowings – disclosed as current liabilities (869.6) (411.5) (534.5)
Add back: amounts treated as debt financing (see below) 294.1 39.6 24.2
Cash and cash equivalents as per the statement of cash flows 355.3 396.3 416.6
Debt financing
Borrowings – disclosed as current liabilities and treated as debt financing (see above) (294.1) (39.6) (24.2)
Borrowings – disclosed as non-current liabilities (274.8) (414.1) (361.9)
Fair value of related cross-currency interest rate swaps 49.9 57.3 49.7
Debt financing (519.0) (396.4) (336.4)
Net (debt) / funds (163.7) (0.1) 80.2
Borrowings disclosed as current liabilities include bank overdrafts held in cash pooling arrangements which have not been offset in the consolidated statement of financial position. These are included within cash and cash equivalents in the consolidated statement of cash flows.
Borrowings disclosed as current liabilities include £120m drawn down under a bi-lateral credit facility which has been treated as debt financing. This facility expires in March 2019 but has an option to extend for a further six months (see also note 11b).
10 ACQUISITIONS AND DISPOSALS On 26 March 2018 the Group acquired the full share capital of Grupo Rudelman, an Automotive Distribution business in Central America focused on Suzuki, for a total cash consideration of £155.5m. The business was acquired to establish the Group’s presence in markets with structural growth potential and to expand the partnership with Suzuki in a strategically important region, adjacent to existing South American operations. The goodwill arising on the acquisition represents intangible assets that do not qualify for separate recognition and the premium paid to establish the Group’s presence in Panama and Costa Rica in order to provide a platform to deliver growth and returns far quicker than would otherwise have been achievable. None of the goodwill is expected to be deductible for tax purposes.
inchcape.com
27

Notes (unaudited) continued
inchcape.com 28
10 ACQUISITIONS AND DISPOSALS CONTINUED Details of the provisional fair values of the identifiable assets and liabilities as at the date of acquisition are set out below:
2018
£m
Assets and liabilities acquired, at provisional values1 Intangible assets 0.2 Property, plant and equipment 38.2 Tax assets 0.3 Inventory 58.0 Trade and other receivables 29.3 Cash and cash equivalents 8.5 Trade and other payables (17.0) Provisions (0.9) Borrowings (61.2) Tax liabilities (1.7)
Net assets acquired 53.7 Distribution agreement recognised on acquisition (net of deferred tax) 56.5 Goodwill 45.3
Purchase consideration 155.5
1 Work is currently underway to identify the fair value of assets and liabilities acquired. The values at which assets and liabilities are stated above are therefore provisional values largely based on book values at the acquisition date.
The acquired business contributed £55.8m revenue and £5.3m operating profit before exceptional items to the Group's reported figures between the date of acquisition and 30 June 2018.
If the acquisition had occurred on 1 January 2018, the approximate revenue and operating profit before exceptional items for the period ended 30 June 2018 of the Group would have been £4,659.0m and £195.3m respectively.
During the period ended 30 June 2018 the Group also acquired one Lexus site in the UK for consideration of £1.8m, and disposed of its Jaguar Land Rover operations in Shaoxing generating disposal proceeds of £12.0m.
In 2017 the Group acquired premium automotive operations in Estonia, focused on exclusive distribution for BMW Group, from United Motors AS; Northstar Motor Group and Bayford City Peugeot in the Australasia Retail segments; and entered into a distribution contract with Groupe PSA to distribute the Peugeot and Citroen brands in Australia. The total cost of these acquisitions was £19.3m with total goodwill and other indefinite life intangible assets arising on the transactions of £13.4m. The Group also disposed of its Lexus operations in Shanghai generating disposal proceeds of £5.6m.
11 FINANCIAL RISK MANAGEMENT A. Financial risk factors Exposure to financial risks comprising market risks (currency risk and interest rate risk), funding and liquidity risk and counterparty risk arises in the normal course of the Group’s business.
During the six months to 30 June 2018, the Group has continued to apply the financial risk management process and policies as detailed in the Group’s principal risks and risk management process included in the Annual Report and Accounts 2017.
The condensed consolidated interim financial statements do not include all financial risk management information and disclosures required in the annual financial statements and further details can be found in the Annual Report and Accounts 2017.
B. Liquidity risk In March 2018 the Group entered into and drew down in full on a further bi-lateral credit facility for £120m. This facility expires in March 2019 with an option to extend by a further six months. Further revolving credit facility drawings of £43.5m are on existing committed facilities expiring in 2022. The Group has also drawn in full £18.3m on new uncommitted facilities in the period.
Other than the refinancing mentioned above, there have been no material changes to the contractual undiscounted cash flows of the Group's liabilities during the six months to June 2018.
C. Vehicle funding arrangements The Group finances the purchase of new vehicles for sale and a portion of used vehicle inventories using vehicle funding facilities provided by various lenders including the captive finance companies associated with brand partners. Such arrangements generally have a maturity of 90 days or less and the Group is normally required to repay amounts outstanding on the earlier of the sale of the vehicles that have been funded under the facilities or the stated maturity date. Amounts due under these vehicle funding arrangement s are included within trade and other payables in the consolidated statement of financial position. Related cash flows are reported within cash flows from operating activities in the consolidated statement of cash flows. As at 30 June 2018, the total amount outstanding under such arrangements was £1,468m (30 June 2017 – £1,429m; 31 December 2017 – £1,548m)
Vehicle funding facilities are subject to LIBOR-based (or similar) interest rates. The interest incurred under these arrangements is included within finance costs in the consolidated income statement and reported as stock holding interest (see note 5). Related cash flows are reported as interest paid in the consolidated statement of cash flows.
inchcape.com
28

Notes (unaudited) continued
inchcape.com 29
11 FINANCIAL RISK MANAGEMENT CONTINUED D. Fair value measurements In accordance with IFRS 13, disclosure is required for financial instruments that are measured in the consolidated statement of financial position at fair value. This requires disclosure of fair value measurements by level for the following fair value measurement hierarchy:
quoted prices in active markets (level 1);
inputs other than quoted prices that are observable for the asset or liability, either directly or indirectly (level 2); or
inputs for the asset or liability that are not based on observable market data (level 3).
The following table presents the Group’s assets and liabilities that are measured at fair value:
Six months to 30 June 2018 Six months to 30 June 2017 Year to 31 December 2017
Level 1
£m Level 2
£m Level 3
£m Total
£m Level 1
£m Level 2
£m Level 3
£m Total
£m Level 1
£m Level 2
£m Level 3
£m Total
£m
Assets
Derivatives used for hedging – 75.7 – 75.7 – 60.7 – 60.7 – 52.4 – 52.4
Available for sale financial assets 0.7 – 6.5 7.2 1.3 – 2.3 3.6 1.3 – 6.2 7.5
0.7 75.7 6.5 82.9 1.3 60.7 2.3 64.3 1.3 52.4 6.2 59.9
Liabilities
Derivatives used for hedging – (1.0) – (1.0) – (35.3) – (35.3) – (21.6) – (21.6)
Level 1 represents the fair value of financial instruments that are traded in active markets and is based on quoted market prices at the end of the reporting period.
The fair value of financial instruments that are not traded in an active market (level 2) is determined by using valuation techniques which include the present value of estimated future cash flows. These valuation techniques maximise the use of observable market data where it is available and rely as little as possible on entity specific estimates.
Level 3 assets relate entirely to a 15% equity interest in Hino Motors Manufacturing Company SAS in Colombia.
Derivative financial instruments are carried at their fair values. The fair value of forward foreign exchange contracts and foreign exchange swaps represents the difference between the value of the outstanding contracts at their contracted rates and a valuation calculated using the spot rates of exchange and prevailing forward interest rates at 30 June 2018.
The Group’s derivative financial instruments comprise the following:
Assets Liabilities
Six months to 30 Jun 2018
£m
Six months to 30 Jun 2017
£m
Year to 31 Dec 2017
£m
Six months to 30 Jun 2018
£m
Six months to 30 Jun 2017
£m
Year to 31 Dec 2017
£m
Cross currency interest rate swap 49.9 57.3 49.7 (0.1) – –
Forward foreign exchange contracts 25.8 3.4 2.7 (0.9) (35.3) (21.6)
75.7 60.7 52.4 (1.0) (35.3) (21.6)
12 ASSETS HELD FOR SALE
As at 30 Jun 2018
£m
As at 30 Jun 2017
£m
As at 31 Dec 2017
£m
Assets held for sale 13.7 6.4 13.8
As at 30 June 2018 assets held for sale relate to surplus properties within the UK, Colombia and Russia which are actively marketed with a view to sale.
13 RELATED PARTY DISCLOSURES There have been no material changes to the principal subsidiaries and joint ventures as listed in the Annual Report and Accounts for the year ended 31 December 2017, except for the addition of those subsidiaries acquired as part of the acquisition of Grupo Rudelman in the period.
All related party transactions arise during the ordinary course of business and are on an arm’s length basis.
There were no material transactions or balances between the Group and its key management personnel during the six months to 30 June 2018.
inchcape.com
29

Notes (unaudited) continued
inchcape.com 30
14 RESTATEMENT ON INITIAL ADOPTION OF IFRS 15 The principal restatements as a result of the initial adoption of IFRS 15 Revenue from contracts with customers are set out in the following tables.
The impacts on the consolidated income statement are:
Six months to 30 Jun 2017
£m
Year to 31 Dec 2017
£m
(Decrease) / increase in revenue (15.5) 4.1
Increase / (decrease) in cost of sales 14.9 (5.0)
Net decrease in gross profit, operating profit and profit before tax (0.6) (0.9)
Increase in tax charge (0.3) (0.3)
Decrease in profit for the period (0.9) (1.2)
Attributable to:
Owners of the parent (0.9) (1.2)
Non-controlling interests – –
The impacts on the consolidated statement of financial position are:
As at 30 Jun 2017
£m
As at 31 Dec 2017
£m
Increase in non-current assets 2.2 0.3
Increase in current assets 1.2 1.5
Increase in total assets 3.4 1.8
Increase in current liabilities (21.5) (22.7)
Decrease in non-current liabilities 11.4 14.0
Increase in total liabilities (10.1) (8.7)
Decrease in net assets and total equity (6.7) (6.9)
Attributable to:
Owners of the parent (6.7) (6.9)
Non-controlling interests – –
inchcape.com
30

Notes (unaudited) continued
inchcape.com 31
15 ALTERNATIVE PERFORMANCE MEASURES The Group assesses its performance using a variety of alternative performance measures which are not defined under International Financial Reporting Standards. These provide insight into how the Board and Executive Committee monitor the Group’s strategic and financial performance, and provide useful information on the underlying trends, performance and position of the Group.
Performance Measure Definition Why we measure it
Operating margin Operating profit (before exceptional items) divided by revenue.
A key metric of operational efficiency, ensuring that we are leveraging global scale to translate sales growth to profit.
Profit before tax & Exceptional Items
Represents the profit made after operating and interest expense excluding the impact of exceptional items and before tax is charged.
A key driver of delivering sustainable and growing earnings to shareholders.
Exceptional items Items that are charged or credited in the consolidated income statement which are material and non-recurring in nature.
The separate reporting of exceptional items helps provide additional useful information regarding the Group’s underlying business performance and is consistent with the way that financial performance is measured by the Board and the Executive Committee.
Free cash flow
Net cash flows from operating activities, before exceptional cash flows, less normalised net capital expenditure and dividends paid to non-controlling interests.
A key driver of the Group’s ability to ‘Invest to Accelerate Growth’ and to make distributions to shareholders.
Return on capital employed (ROCE)
Operating profit (before exceptional items) divided by the average of opening and closing capital employed, where capital employed is defined as net assets less net funds.
A key measure of Ignite (Invest to Accelerate Growth), ROCE is a measure of the Group’s ability to drive better returns for investors on the capital we invest.
Net funds / (debt) Cash and cash equivalents less borrowings adjusted for the fair value of derivatives that hedge interest rate or currency risk on borrowings.
A measure of the Group’s net indebtedness that provides an indicator of the overall balance sheet strength.
Net capital expenditure
Cash outflows from the purchase of property, plant, equipment and intangible assets less the proceeds from the disposal of property, plant, equipment and intangible assets.
A measure of the net amount invested in operational facilities in the period.
inchcape.com
31

Independent Review Report to Inchcape plc
inchcape.com 32
We have been engaged by Inchcape plc (“the company”) to review the condensed consolidated interim financial statements for the six months ended 30 June 2018 which comprise the consolidated income statement, consolidated statement of comprehensive income, consolidated statement of financial position, consolidated statement of changes in equity, consolidated statement of cash flows, and the related explanatory notes. We have read the other information contained in the interim financial report and considered whether it contains any apparent misstatements or material inconsistencies with the information in the condensed consolidated interim financial statements.
This report is made solely to the company in accordance with International Standard on Review Engagements (UK and Ireland) 2410 ‘Review of Interim Financial Information Performed by the Independent Auditor of the Entity’ issued by the Auditing Practices Board. Our work has been undertaken so that we might state to the company those matters we are required to state to it in an independent review report and for no other purpose. To the fullest extent permitted by law, we do not accept or assume responsibility to anyone other than the company, for our review work, for this report, or for the conclusions we have formed.
DIRECTORS’ RESPONSIBILITIES The interim financial report is the responsibility of, and has been approved by, the directors. The directors are responsible for preparing the interim financial report in accordance with the Disclosure and Transparency Rules of the United Kingdom’s Financial Conduct Authority.
As disclosed in note 1, the annual consolidated financial statements of the Group are prepared in accordance with IFRSs as adopted by the European Union. The condensed consolidated interim financial statements included in this interim financial report have been prepared in accordance with International Accounting Standard 34 ‘Interim Financial Reporting’ as adopted by the European Union.
OUR RESPONSIBILITY Our responsibility is to express to the company a conclusion on the condensed consolidated interim financial statements in the interim financial report based on our review.
SCOPE OF REVIEW We conducted our review in accordance with International Standard on Review Engagements (UK and Ireland) 2410 ‘Review of Interim Financial Information Performed by the Independent Auditor of the Entity’ issued by the Auditing Practices Board for use in the United Kingdom. A review of interim financial information consists of making inquiries, primarily of persons responsible for financial and accounting matters, and applying analytical and other review procedures. A review is substantially less in scope than an audit conducted in accordance with International Standards on Auditing (UK and Ireland) and consequently does not enable us to obtain assurance that we would become aware of all significant matters that might be identified in an audit. Accordingly, we do not express an audit opinion.
CONCLUSION Based on our review, nothing has come to our attention that causes us to believe that the condensed consolidated interim financial statements in the interim financial report for the six months ended 30 June 2018 is not prepared, in all material respects, in accordance with International Accounting Standard 34 as adopted by the European Union and the Disclosure and Transparency Rules of the United Kingdom’s Financial Conduct Authority.
Deloitte LLP Statutory Auditor
London, England
25 July 2018
inchcape.com
32

Statement of Directors’ Responsibilities
inchcape.com 33
INTRODUCTION The Directors confirm that the condensed consolidated interim financial statements in the Interim Report have been prepared in accordance with International Accounting Standard 34, ‘Interim Financial Reporting’ as adopted by the European Union and that the Interim Report includes a fair review of the information required by Disclosure and Transparency Rules 4.2.7R and 4.2.8R, namely:
an indication of important events that have occurred during the first six months and their impact on the condensed consolidated interim financial statements;
a description of the principal risks and uncertainties for the remaining six months of the financial year; and
material related party transactions in the first six months and any material changes in the related party transactions described in the last Annual Report.
The Directors and positions held during the period were as published in the Annual Report and Accounts 2017. A list of current Directors is maintained on the Inchcape plc website (www.inchcape.com).
On behalf of the Board
Stefan Bomhard 25 July 2018
Group Chief Executive
inchcape.com
33