Interim Report - RIB Software · interim group management report report on earnings, financial...
28
Scan to learn more about YTWO Formative January - September 2017 Interim Report
Transcript of Interim Report - RIB Software · interim group management report report on earnings, financial...

Scan to learn more about YTWO Formative
January - September 2017
Interim Report

LETTER TO OUR SHAREHOLDERS
Thomas Wolf, Chairman of the Administrative Board, CEO
DEAR SHAREHOLDERS, DEAR FRIENDS OF RIB SOFTWARE SE,
The RIB Group looks back on a successful Q3 2017 during
which the third Phase-III-contract of the current calendar
year could already be concluded with Implenia, the leading
Swiss construction and construction services company. In
addition, six Phase-II-contracts were reported. Strong
growth rates were also achieved for revenue and software
licenses. The RIB stock price reflects this positive develop-
ment.
In recent years, from 2011 to 2016, our iTWO community
and iTWO/YTWO brands have reached a high level. For the
new five year plan from 2017 to 2021, and the years there-
after until 2026, the outlook is positive throughout. Govern-
ments worldwide, the IT industry and clients are discovering
the benefits of integrating two (iTWO) worlds, the virtual into
the physical. iTWO stands for this MR (Mixed Reality) pro-
cess in the construction industry.
1. We are on a strong path to reach our 2021 – 2026 tar-
gets: building up a community of 1,000 iTWO 5D techno-
logy partners and iTWO key account clients as the engi-
ne to transform the traditional building and infrastructure
industry into one of the most advanced industries on the
planet, keeping a steady EBITDA margin of approx.
30% in the software business.
2. We are on a strong path to support with iTWO³ - New
Thinking, New Working, New IT Technology - and the
iTWO City Technology the development of the 21st cen-
tury City and Infrastructure, also known as “Smart Cities”.
3. We are on a strong path to support with iTWO 4.0 the
next generation of IT, the Internet of Things (IoT). With
the new iTWO 4.0 platform and YTWO platform, iTWO
SP (smart production) and the xTWO platform, we have
LETTER TO OuR ShAREhOLDERS
2 RIB SOFTWARE SE | INTERIM REPORT JANUARY - SEPTEMBER 2017

developed exactly those solutions that the market is de-
manding and requiring for the digitalization and industri-
alization.
The global building and construction industry has re-
ached a size of almost uSD 9 trillion and will grow to
uSD 15 trillion by 2025. The IT spending can grow
from around uSD 90 billion (1%) today to around uSD
500 billion (3.3%). To position ourselves as a lea-
ding supplier tapping into this USD 500 billion mar-
ket, we will work hard on our organizational foundation.
Following RIB’s philosophy, we consider ourselves an IT
partner and enabler, which creates value to our clients,
rather than just a software vendor. To achieve this goal, we
have trained world-leading experts in the areas of business
process management, technical enterprise resource plan-
ning & controlling. Our RIB top experts have deep practical
knowledge in the macro- and micro-economic dynamics in
the global made-to-order and process industry. Together
with our clients, we are determined to halve their current
and future risks and double their profits. We are deter-
mined to reduce up to 50% waste in different sectors and
to achieve 30% benefits for the whole iTWO community, as
well as a contribution to the greater society. We are also
determined to support our industry by developing the next
generation of talents together with the leading technology
universities in the world, such as Georgia Institute of Tech-
nology in Atlanta, uSA.
In 2016, we have completed the R&D work on the iTWO 4.0
Release 1.0, the next generation platform which will be the
main RIB technology in 2017 - 2021. Consequently we are
continuing the shift, which we started in the last year, from
a more R&D driven organization into a stronger marketing
driven organization. We are now able to offer standardized
IT solutions based on global “best practices”, which include
industry-specific content. In 2016, we have also positioned
YTWO in the market, the perfect IT platform and supply
chain solution for real estate developers and construction
materials suppliers.
In summary, with iTWO³, iTWO 4.0, YTWO Formative (SCM),
iTWO SP (PPS and smart production), iTWO PCI (project
cost insurance), iTWOtx (tender exchange platform), iTWO
FM (facility management), iTWO City (project developer plat-
form), iTWO World (communication platform), xTWOstore
(e-commerce platform for sanitaryware), iTWOscm, iTWOcx
(Collaboration Platform) and iTWO LAB (conceptual working
environment), we are working with maximum speed on
the end-to-end construction process.
The iTWO Technology development is done in close part-
nership and cooperation with our key iTWO Technology
Partners, such as clients, enablers and universities. here we
have formed together with our investors one of the stron-
gest IT teams in the world.
The world economy has slowed down in the last months
and some sectors like Oil & Gas and regions like China have
reduced their growth outlook for the next 12 months. But,
based on the 4.0 (IoT) and mass customization opportunity
for the process and made-to-order industry and on the infra-
structure needs of a 4 billion strong middle class of consu-
mers (today: 2 billion) in the next years, the fundamentals
are extremely supportive for a strong business development
in 2017 - 2026. Moreover, RIB also has a strong financial
foundation, which enables it to win a significant stake of the
expected uSD 500 billion market opportunity in the future.
Thanks for your trust and support. I can promise the RIB
team will not rest and work hard to reach the next record
level and reach a real break-through for our technology, for
our management and for our investors.
Kind regards
Thomas Wolf
LETTER TO OuR ShAREhOLDERS
3INTERIM REPORT JANUARY - SEPTEMBER 2017 | RIB SOFTWARE SE

RIB OVERVIEW
HIGHLIGHTS JANUARY - SEPTEMBER 2017
CONSOLIDATED FIGURES - OVERVIEW
€ million unless otherwise indicated3rd quarter
20173rd quarter
2016 change9 months
20179 months
2016 change
Revenue 28.4 20.9 35.9% 81.7 70.8 15.4%
Software licenses 10.8 4.4 145.5% 26.6 19.2 38.5%
Software as a Service / Cloud 3.0 2.8 7.1% 10.4 9.7 7.2%
Maintenance 8.1 7.0 15.7% 24.0 20.5 17.1%
Consulting 4.6 5.2 -11.5% 15.2 16.2 -6.2%
e-Commerce 1.9 1.4 35.7% 5.4 5.2 3.8%
Operating EBITDA* 11.2 4.2 166.7% 35.9 17.9 100.6%
as % of revenue 39.4% 20.1 % 43.9% 25.3%
Operating EBT* 7.2 1.9 278.9% 25.0 10.9 129.4%
as % of revenue 25.4% 9.1 % 30.6% 15.4 %
Expenses from purchase price
allocations (PPA amortisation) 0.9 1.0 -10.0% 2.7 3.1 -12.9%
Net cash flows from operating
activities . - , 25.3 13.3 90.2%
Cash incl. available-for-sale
securities** . - , 148.3 135.4 9.5%
Equity ratio** . - ,, 81.1% 82.1% .
Average number of employees . - , 815 762 7.0%
* EBITDA and EBT adjusted for currency effects (9M 2017: € -0.2 million; 9M 2016: € -0.9 million) and one-off / special effects (9M 2017: € +0.4 million; 9M 2016: € 0.0 million)
** Previous year as of 31 December 2016
9M 2016 9M 20169M 2017 9M 2017
CASH FLOWS FROM OP. ACTIVITIES
in € million
SOFTWARE LICENSE REVENUES
in € million26.6 25.3
13.3
19.2
38.5% 90.2%
9M 2016 9M 2017 9M 2016 9M 2017
REVENUEin € million
70.881.7
35.9
17.9
15.4% 100.6%
OPERATING EBITDA*in € million
RIB OvERvIEW
4 RIB SOFTWARE SE | INTERIM REPORT JANUARY - SEPTEMBER 2017

RIB ON THE CAPITAL MARKET
RIB SHARE PRICE PERFORMANCE JANUARY - SEPTEMBER 2017
EVALUATION OF THE ANALYSTS
RIB Software SE TecDax
90%
100%
110%
120%
130%
140%
€ 16.12
€ 14.88
€ 13.64
€ 12.40
€ 11.16
JAN FEB MAR APR MAY JUN JUL AUG SEP
€ 17.36
SHARE PRICE GAINJAN-SEP 2017
>44%
SHARE PRICE GAININ Q3 2017
>21%
MARKET CAPITALIZATION END OF Q3
>€ 840 million
KEPLER CHEUVREUX
BUY | € 22.00
EQUINET
BUY | € 16.50
HAUCK & AUFHÄUSER
BUY | € 16.00
UBS
Neutral | € 15.10
WARBURG
BUY | € 18.50
BERENBERG
BUY | € 17.00
RIB ON ThE CAPITAL MARKET
5INTERIM REPORT JANUARY - SEPTEMBER 2017 | RIB SOFTWARE SE

INTERIM GROUP MANAGEMENT REPORTREPORT ON EARNINGS, FINANCIAL POSITION AND NET WORTH
REVENUE INCREASES BY 15.4% TO € 81.7 MILLION SOFTWARE LICENCE REVENUE INCREASES BY 38.5% TO € 26.6 MILLION The RIB Group maintained its positive business performance of the first half-year of 2017 and continued to achieve strong
growth rates for revenue and profit. During the first nine months, Group revenue increased by 15.4% to € 81.7 million (previ-
ous year: € 70.8 million). International revenue increased by 31.5% to € 43.4 million (previous year: € 33.0 million). Revenue
in the iTWO key account segment increased by 108.2% to € 12.7 million (previous year: € 6.1 million). The sale of software
licenses also witnessed significant growth of 38.5% to € 26.6 million (previous year: € 19.2 million).
Deferred maintenance rates increased by 17.1% from € 20.5 million to € 24.0 million and continue to form a large share of re-
curring revenue. In sum, recurring revenue (Maintenance and SaaS) increased by 13.9% to € 34.4 million (previous year: € 30.2
million). Revenue in the iTWO mass market segment increased by 14.5% to € 9.5 million (previous year: € 8.3 million).
OPERATING EBITDA* INCREASES BY 100.6% TO € 35.9 MILLIONOperating earnings before interest, taxes, depreciation and amortization of property and intangible assets (operating EBITDA*)
increased by 100.6% to € 35.9 million compared to the previous year (previous year: € 17.9 million) which corresponds to
an operating EBITDA margin of 43.9% (previous year: 25.3%). Operating earnings before taxes (operating EBT*) increased
significantly by 129.4% to € 25.0 million (previous year: € 10.9 million) during the reporting period. This includes the sale of
software licences to the joint venture YTWO in the first quarter of 2017. The resulting effect of € 7.6 million was stated under
other operating income (cf. Note 5 of Annex to the RIB Software SE Interim Report). Expenses from purchase price allocations
(PPA amortisation) reduced markedly by 12.9% to € 2.7 million (previous year: € 3.1 million). The tax rate was 36.1% (previ-
ous year: 43.0%). Due to the revenue growth in the high-margin business segments, the Group‘s gross margin increased by
approximately 7 percentage points to 61.1% (previous year: 54.2%).
R&D COSTS INCREASES BY 33.8% TO € 9.9 MILLIONR&D costs increased by 33.8% to € 9.9 million (previous year: € 7.4 million) during the reporting period. This increase was
primarily due to the strengthening of our iTWO 4.0 development team. At € 7.7 million, administrative costs remained at the
previous year‘s level (previous year: € 7.7 million). Marketing and distribution costs increased by 7.9% to € 13.7 million (previ-
ous year: € 12.7 million). The average number of employees increased by 7.0% to 815 (previous year: 762).
OPERATING CASH FLOW AT € 25.3 MILLION (+90.2%)Net cash flow from operating activities reached € 25.3 million during the reporting period and exceeded the previous year‘s
value by 90.2% (previous year: € 13.3 million). This development was driven primarily by successful business develop-
ment. In addition, the remaining payment of software sales to YTWO in the first quarter of 2017 led to inflows of funds
totaling € 4.6 million.
Net cash flow from investments was € -3.5 million compared to € -4.6 million in the previous year. The reporting period inclu-
des payments of € 2.9 million from the sale of MAC International to the joint venture YTWO.
*) EBITDA, EBT adjusted for currency effects (9M 2017: € -0.2 million; 9M 2016: € -0.9 million) and one-off / special effects (9M 2017: € 0.4 million; 9M 2016:
€ 0.0 million)
6 RIB SOFTWARE SE | INTERIM REPORT JANUARY - SEPTEMBER 2017
INTERIM GROuP MANAGEMENT REPORT | REPORT ON EARNINGS, FINANCIAL POSITION AND NET WORTh

Net cash flow from financing activities of € -1.5 million (previous year: € -15.9 million) primarily includes payments of bank
liabilities for the acquisition of the business property in Stuttgart (€ 6.0 million) and the dividend payments (€ -7.2 million).
In the previous year, this included dividend payments (€ -7.3 million), payments for the acquisition of treasury shares (€ -5.8
million) and payments for the settlement of other financial liabilities (€ -2.6 million).
On 30 September 2017, the Group possessed liquid funds, including securities available for sale, of € 148.3 million (31 Decem-
ber 2016: € 135.4 million). Equities amounted to € 288.0 million (31 December 2016: € 291.8 million). The equity ratio was
slightly reduced to 81.1% (31 December 2016: 82.1%).
Trade payables reduced slightly to € 1.5 million (31 December 2016: € 2.5 million). Trade receivables increased by € 8.0 million
to € 26.4 million (31 December 2016: € 18.4 million).
OPPORTUNITY AND RISK REPORTBased on the very positive YTWO development in 2017, Flex, as the joint venture partner of YTWO, has agreed to a shift of
the exercise period of the option right from 01.02.2018 to 01.09.2018. See also note 19 to the consolidated financial state-
ments for the 2016 financial year.
With regard to further important opportunities and risks of the expected development of the RIB Group, please refer to the
opportunities and risks described in the management report of 31 December 2016.
FORECAST REPORTIn view of the sustainable trend towards the digital transformation of the construction industry, we continue to see good
growth opportunities for the RIB Group, which are reflected in the successful development in the third quarter of 2017. In the
first nine months of 2017, the RIB Group‘s revenue and EBITDA are significantly above the previous year‘s figures. Based
on a promising deal pipeline, we are currently assuming further Phase-II-deals in 2017, but with the uncertainty that these
deals may shift to future periods in 2018. Due to the positive business development in the first nine months of 2017, the RIB
Group concretises the revenue forecast for fiscal year 2017 to the upper third of the published guidance (€ 98 million to € 108
million) and increases the EBITDA forecast for fiscal year 2017 to a range from € 38 million to € 41 million (previous forecast:
€ 28 million to € 38 million).
7INTERIM REPORT JANUARY - SEPTEMBER 2017 | RIB SOFTWARE SE
REPORT ON EARNINGS, FINANCIAL POSITION AND NET WORTh | INTERIM GROuP MANAGEMENT REPORT

CONSOLIDATED INCOME STATEMENT
For the period: 01.01.2017 to 30.09.2017
figures in € thousand, unless otherwise indicated Note3rd quarter
20173rd quarter
20169 months
20179 months
2016
Revenue (4) 28,372 20,924 81,681 70,798
Cost of sales -10,337 -10,082 -31,831 -32,365
Gross profit 18,035 10,842 49,850 38,433
Other operating income (5) 868 294 10,155 696
Marketing and distribution costs -4,669 -3,804 -13,691 -12,722
General administrative expenses -2,277 -2,750 -7,740 -7,720
Research and development expenses -3,238 -2,371 -9,923 -7,405
Other operating expenses (6) -134 -280 -461 -1,217
Financial income 65 57 123 275
Finance costs -43 -39 -136 -369
Profit shares from investments accounted for
using the equity method -1,345 -45 -2,989 -3
Profit before tax 7,262 1,904 25,188 9,968
Income taxes -3,323 -793 -9,079 -4,253
Profit after tax 3,939 1,111 16,109 5,715
Loss attributable to non-controlling interests -13 -10 -40 -120
Profit attributable to owners of the parent
company 3,952 1,121 16,149 5,835
Result per share on the basis of the share ear-
nings of the shareholders of RIB Software SE:
- -
basic (8) 0.09 € 0.02 € 0.36 € 0.13 €
diluted (8) 0.09 € 0.02 € 0.35 € 0.13 €
CONSOLIDATED INTERIM FINANCIAL STATEMENTS
8 RIB SOFTWARE SE | INTERIM REPORT JANUARY - SEPTEMBER 2017
CONSOLIDATED INTERIM FINANCIAL STATEMENTS | CONSOLIDATED INCOME STATEMENT

CONSOLIDATED STATEMENT OF COMPREHENSIVE INCOME
For the period: 01.01.2017 to 30.09.2017
Figures in € thousand3rd quarter
20173rd quarter
20169 months
20179 months
2016
Profit after tax 3,939 1,111 16,109 5,715
Components reclassified with no effect on profit and loss: , . -
Revaluations -46 8 -137 24
Other consolidated comprehensive income after taxes for components reclassified with no effect on profit and loss -46 8 -137 24
Components reclassified in subsequent periods with an effect on profit and loss:
-
Exchange differences -3,765 -194 -13,386 -1,318
Changes in value of available-for-sale securities 0 0 0 0
Other consolidated comprehensive income after taxes for components reclassified with an effect on profit and loss -3,765 -194 -13,386 -1,318
Other consolidated comprehensive income after taxes -3,811 -186 -13,523 -1,294
Total consolidated comprehensive income 128 925 2,586 4,421
of which attributable to non-controlling interests -13 -10 -40 -120
of which attributable to owners of the parent company 141 935 2,626 4,541
9INTERIM REPORT JANUARY - SEPTEMBER 2017 | RIB SOFTWARE SE
CONSOLIDATED STATEMENT OF COMPREhENSIvE INCOME | CONSOLIDATED INTERIM FINANCIAL STATEMENTS

CONSOLIDATED STATEMENT OF FINANCIAL POSITION AS OF 30.09.2017 AND 31.12.2016
Figures in € thousand Note 30.09.2017 31.12.2016
Goodwill (9) 65,113 67,166
Other intangible assets 48,719 50,005
Property, plant and equipment 15,478 16,185
Investment properties 4,822 5,272
Investments accounted for using the equity method (10) 35,559 52,166
Prepaid land use lease payments 924 1,006
Other assets 16 16
Deferred tax assets 2,349 1,541
Total non-current assets 172,980 193,358
Inventories 1,937 1,432
Trade receivables 26,429 18,420
Gross amounts due from customers for contract
work 377 136
Available-for-sale securities 92 98
Other assets 5,020 6,650
Cash and cash equivalents 148,204 135,323
Total current assets 182,059 162,059
Total assets 355,039 355,417
10 RIB SOFTWARE SE | INTERIM REPORT JANUARY - SEPTEMBER 2017
CONSOLIDATED INTERIM FINANCIAL STATEMENTS | CONSOLIDATED STATEMENT OF FINANCIAL POSITION AS OF 30.09.2017 AND 31.12.2016

Figures in € thousand Note 30.09.2017 31.12.2016
Subscribed capital 46,846 46,846
Treasury shares -10,597 -10,597
Capital reserves 183,309 182,284
Legal reserves 95 95
Other retained reserves - 144 0
Accumulated other consolidated comprehensive income -2,171 11,352
Retained earnings 70,575 61,926
Equity attributable to owners of the parent company 288,201 291,906
Non-controlling interests (11) -163 -123
Total equity 288,038 291,783
Pension provisions 3,970 3,840
Bank loans 5,300 0
Other provisions 323 286
Other finance liabilities 2,039 1,882
Deferred tax liabilities 11,210 12,116
Total non-current liabilities 22,842 18,124
Bank loans 400 0
Trade payables 1,496 2,456
Provisions for income taxes 8,812 4,337
Other provisions 1,142 1,153
Accruals 4,938 4,496
Deferred revenue 23,709 12,817
Other financial liabilities 50 579
Other liabilities 3,612 19,672
Total current liabilities 44,159 45,510
Total liabilities 67,001 63,634
Total equity and liabilities 355,039 355,417
11INTERIM REPORT JANUARY - SEPTEMBER 2017 | RIB SOFTWARE SE
CONSOLIDATED STATEMENT OF FINANCIAL POSITION AS OF 30.09.2017 AND 31.12.2016 | CONSOLIDATED INTERIM FINANCIAL STATEMENTS

CONSOLIDATED STATEMENT OF CHANGES IN EQUITY
For the period: 01.01.2017 to 30.09.2017
Accumulated other comprehensive income
Figures in € thousand
Issued
capital
Capital
reserves
Legal
reserves
Other
retained
reserves
Changes in
value of avai-
lable-for-sale
securities
Foreign
currency
translation
reserve
Revalua-
tions
Treasury
shares
Retained
earnings
Equity attributa-
ble to owners of
parent
Non-con-
trolling
interests
Total equity
according to
consolidated
statement
of financial
position
As of 1 January 2016 46,846 181,396 95 0 1 8,332 -390 -4,828 54,657 286,109 -167 285,942
Profit after tax - - - - - - - - 5,835 5,835 -120 5,715
Other comprehensive income - - - - - -1,318 24 - - -1,294 - -1,294
Total comprehensive income 0 0 0 0 - 0 -1,318 24 0 5,835 4,541 -120 4,421
Purchase of treasury shares - - - - - - - -5,769 - -5,769 - -5,769
Dividend payment - - - - - - - - -7,291 -7,291 - -7,291
Capital increase - - - - - - - - - 0 - 0
Other changes - - - - - - - - - 0 - 0
Share-based remuneration - 807 - - - - - - - 807 - 807
As of 30 September 2016 46,846 182,203 95 0 1 7,014 -366 -10,597 53,201 278,397 -287 278,110
As of 1 January 2017 46,846 182,284 95 0 0 11,925 -573 -10,597 61,926 291,906 -123 291,783
Profit after tax - - - - - - - - 16,149 16,149 -40 16,109
Other comprehensive income - - - - 0 -13,386 -137 - - -13,523 - -13,523
Total comprehensive income 0 0 0 0 0 -13,386 -137 0 16,149 2,626 -40 2,586
Purchase of treasury shares - - - - - - - - - - - 0
Dividend payment - - - - - - - - -7,196 -7,196 - -7,196
Capital increase - - - - - - - - - - - 0
Other changes - - - 144 - - - - -304 -160 - -160
Share-based remuneration - 1,025 - - - - - - - 1,025 - 1,025
As of 30 September 2017 46,846 183,309 95 144 0 -1,461 -710 -10,597 70,575 288,201 -163 288,038
12 RIB SOFTWARE SE | INTERIM REPORT JANUARY - SEPTEMBER 2017
CONSOLIDATED INTERIM FINANCIAL STATEMENTS | CONSOLIDATED STATEMENT OF ChANGES IN EQuITY

CONSOLIDATED STATEMENT OF CHANGES IN EQUITY
For the period: 01.01.2017 to 30.09.2017
Accumulated other comprehensive income
Figures in € thousand
Issued
capital
Capital
reserves
Legal
reserves
Other
retained
reserves
Changes in
value of avai-
lable-for-sale
securities
Foreign
currency
translation
reserve
Revalua-
tions
Treasury
shares
Retained
earnings
Equity attributa-
ble to owners of
parent
Non-con-
trolling
interests
Total equity
according to
consolidated
statement
of financial
position
As of 1 January 2016 46,846 181,396 95 0 1 8,332 -390 -4,828 54,657 286,109 -167 285,942
Profit after tax - - - - - - - - 5,835 5,835 -120 5,715
Other comprehensive income - - - - - -1,318 24 - - -1,294 - -1,294
Total comprehensive income 0 0 0 0 - 0 -1,318 24 0 5,835 4,541 -120 4,421
Purchase of treasury shares - - - - - - - -5,769 - -5,769 - -5,769
Dividend payment - - - - - - - - -7,291 -7,291 - -7,291
Capital increase - - - - - - - - - 0 - 0
Other changes - - - - - - - - - 0 - 0
Share-based remuneration - 807 - - - - - - - 807 - 807
As of 30 September 2016 46,846 182,203 95 0 1 7,014 -366 -10,597 53,201 278,397 -287 278,110
As of 1 January 2017 46,846 182,284 95 0 0 11,925 -573 -10,597 61,926 291,906 -123 291,783
Profit after tax - - - - - - - - 16,149 16,149 -40 16,109
Other comprehensive income - - - - 0 -13,386 -137 - - -13,523 - -13,523
Total comprehensive income 0 0 0 0 0 -13,386 -137 0 16,149 2,626 -40 2,586
Purchase of treasury shares - - - - - - - - - - - 0
Dividend payment - - - - - - - - -7,196 -7,196 - -7,196
Capital increase - - - - - - - - - - - 0
Other changes - - - 144 - - - - -304 -160 - -160
Share-based remuneration - 1,025 - - - - - - - 1,025 - 1,025
As of 30 September 2017 46,846 183,309 95 144 0 -1,461 -710 -10,597 70,575 288,201 -163 288,038
13INTERIM REPORT JANUARY - SEPTEMBER 2017 | RIB SOFTWARE SE
CONSOLIDATED STATEMENT OF ChANGES IN EQuITY | CONSOLIDATED INTERIM FINANCIAL STATEMENTS

CONSOLIDATED STATEMENT OF CASH FLOWS
For the period: 01.01.2017 to 30.09.2017
Figures in € thousand9 months
20179 months
2016
Cash flows from operating activities:
Profit before tax 25,188 9,968
Adjustments for:
Depreciation of property, plant and equipment 766 563
Amortisation of intangible assets 6,958 6,124
Depreciation of investment property 102 102
Changes in valuation allowances for trade receivables 37 114
Other non-cash items 12,589 1,122
Interest expense and other finance cost 136 369
Financial income -123 -275
45,653 18,087
Working capital adjustments:
Increase/decrease(-) in provisions and deferred liabilities -60 19
Increase(-)/decrease in receivables and other assets -9,970 2,015
Increase/decrease(-) in received payments -15,584 -476
Increase/decrease(-) in liabilities from trade payables and other liabilities 9,470 3,269
Cash generated from operations 29,509 22,914
Interest paid -68 -30
Interest received 53 181
Income taxes paid -4,180 -9,736
Net cash flows from operating activities 25,314 13,329
Proceeds from the disposal of non-current assets 4 0
Purchase of property, plant and equipment -476 -586
Purchase/production of intangible assets -5,922 -6,569
Disposal of consolidated companies less cash disposed 2,878 0
Purchase(-)/sale of available-for-sale securities 6 2,578
Net cash flows from investing activities -3,510 -4,577
Dividends paid -7,196 -7,291
Payments to non-controlling interests 0 -200
Payments made for the acquisition of treasury shares 0 -5,769
Payments made for redeeming other financial liabilities -150 -2,602
Dividend received from investments accounted for using the equity method 97 0
Cash received from bank loans 6,000 0
Repayment of bank loans -300 0
Net cash flows used in financing activities -1,549 -15,862
Change in cash and cash equivalents impacting cash flow 20,255 -7,110
Cash and cash equivalents at the beginning of the period 135,323 174,335
Currency-related change in cash and cash equivalents -7,374 -1,185
Cash and cash equivalents at the end of the period 148,204 166,040
Composition of cash and cash equivalents:
Liquid funds, unrestricted 145,065 164,266
Liquid funds, restricted 3,139 1,774
Total 148,204 166,040
14 RIB SOFTWARE SE | INTERIM REPORT JANUARY - SEPTEMBER 2017
CONSOLIDATED INTERIM FINANCIAL STATEMENTS | CONSOLIDATED STATEMENT OF CASh FLOWS

NOTES TO THE CONSOLIDATED INTERIM FINANCIAL STATEMENTS
1. CORPORATE INFORMATION
RIB Software AG has entered into a European Stock Company (Societas Europaea / SE) and is now trading as
RIB Software SE. The new legal form has been registered in the commercial register on 3 April 2017.
This condensed consolidated interim financial statement of RIB Software SE (the “Company”) and its subsidia-
ries (collectively the “Group”) was drawn up according to the regulations of the International Financial Repor-
ting Standards (IFRS). It complies in particular with the IAS 34 regulations “Interim reporting”.
The condensed consolidated interim financial statement has not been subjected to auditing inspection or a
general audit.
Our business activity is in some respects subject to seasonal fluctuations. In the past the revenue in the fourth
quarter tended to be higher than in the individual preceding quarters. The interim results can therefore only be
regarded as an indicator for the results of the entire financial year.
This condensed and unaudited consolidated interim financial statement should be read with the audited IFRS
consolidated financial statements of RIB Software SE as of 31 December 2016. Due to the representation of
the numbers in € thousands, rounding differences may arise in individual items.
2. ACCOUNTING POLICIES
In drawing up the consolidated interim financial report the same accounting policies and calculation methods
were used as in the consolidated financial statements as of 31 December 2016.
3. CONSOLIDATED GROUP
i-PBS Production Business Solutions Gmbh, vienna/Austria, and RIB Software (Americas) Inc., Wilmington/
uSA, were deconsolidated in the reporting period and deleted from the relevant company register.
Compared to the consolidated financial statements as of 31 December 2016, the scope of consolidation as of
30 September 2017 also includes RIB COE Europe Gmbh, Stuttgart. The company was founded on 19 April
2017. The sole shareholder is RIB Software SE.
4. REVENUE
Revenue breaks down as follows:
Figures in € thousand 9 months 2017 9 months 2016
Software licences 26,649 19,207
Software as a service / cloud 10,404 9,742
Total software licences and software as a service / cloud 37,053 28,949
Maintenance 24,016 20,471
Consulting 15,249 16,193
e-Commmerce 5,363 5,185
Total revenue 81,681 70,798
15INTERIM REPORT JANUARY - SEPTEMBER 2017 | RIB SOFTWARE SE
NOTES TO ThE CONSOLIDATED INTERIM FINANCIAL STATEMENTS | CONSOLIDATED INTERIM FINANCIAL STATEMENTS
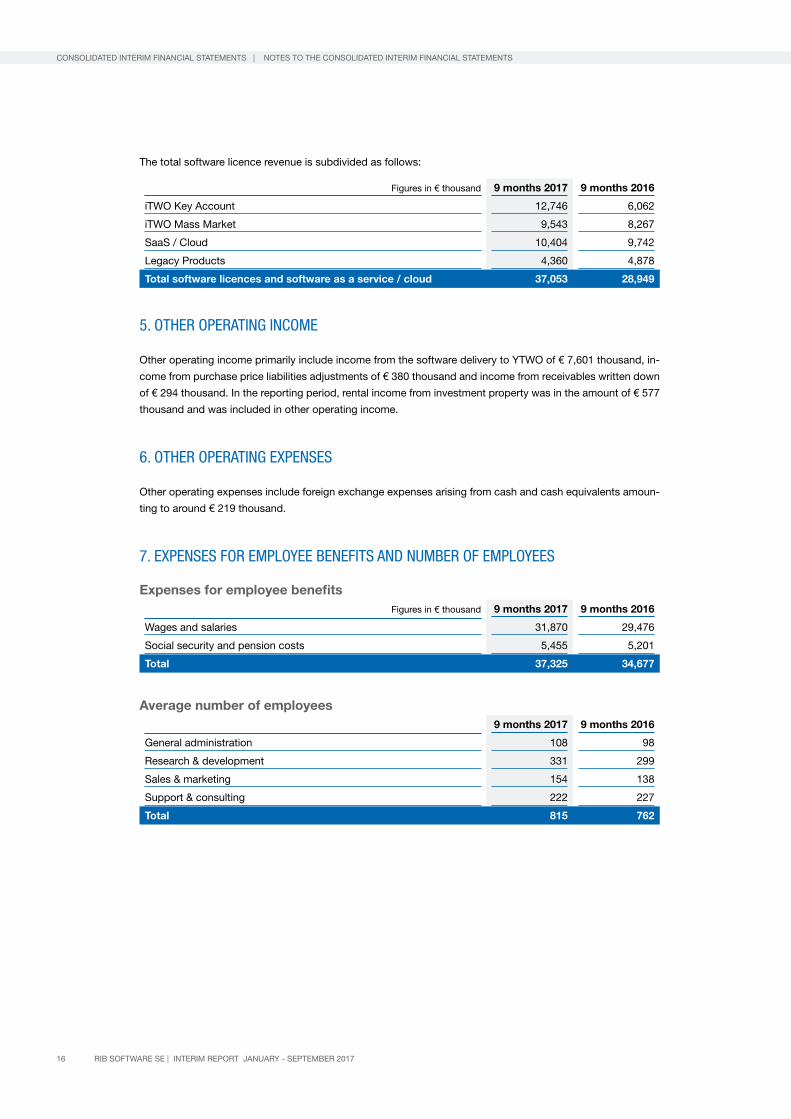
The total software licence revenue is subdivided as follows:
Figures in € thousand 9 months 2017 9 months 2016
iTWO Key Account 12,746 6,062
iTWO Mass Market 9,543 8,267
SaaS / Cloud 10,404 9,742
Legacy Products 4,360 4,878
Total software licences and software as a service / cloud 37,053 28,949
5. OTHER OPERATING INCOME
Other operating income primarily include income from the software delivery to YTWO of € 7,601 thousand, in-
come from purchase price liabilities adjustments of € 380 thousand and income from receivables written down
of € 294 thousand. In the reporting period, rental income from investment property was in the amount of € 577
thousand and was included in other operating income.
6. OTHER OPERATING EXPENSES
Other operating expenses include foreign exchange expenses arising from cash and cash equivalents amoun-
ting to around € 219 thousand.
7. EXPENSES FOR EMPLOYEE BENEFITS AND NUMBER OF EMPLOYEES
Expenses for employee benefitsFigures in € thousand 9 months 2017 9 months 2016
Wages and salaries 31,870 29,476
Social security and pension costs 5,455 5,201
Total 37,325 34,677
Average number of employees 9 months 2017 9 months 2016
General administration 108 98
Research & development 331 299
Sales & marketing 154 138
Support & consulting 222 227
Total 815 762
16 RIB SOFTWARE SE | INTERIM REPORT JANUARY - SEPTEMBER 2017
CONSOLIDATED INTERIM FINANCIAL STATEMENTS | NOTES TO ThE CONSOLIDATED INTERIM FINANCIAL STATEMENTS

8. EARNINGS PER SHARE – BASIC AND DILUTED
Earnings per share are calculated on the basis of the profit share of the shareholders in RIB Software SE as
shown in the following table:
figures in € thousand 9 months 2017 9 months 2016
Profit share of the shareholders of RIB Software SE – basic and diluted 16,149 5,835
figures in thousand shares 9 months 2017 9 months 2016
Weighted average of shares in circulation - basic 44,985 45,351
Dilution effect 705 471
Weighted average of shares in circulation - diluted 45,690 45,822
The average commercial value of the Company’s shares used to calculate the dilution effect of existing share
options is based on the quoted market prices for the period in which the options were in circulation.
9. GOODWILLFigures in € thousand 30.09.2017 31.12.2016
Licence/software business segment 42,513 43,730
SaaS/Cloud business segment 12,380 12,770
Consulting business segment 5,591 5,815
iTWO reporting segment 60,484 62,315
xTWO (e-Commerce) business segment 689 689
xTWO reporting segment 689 689
GZ TWO development entity 3,046 3,268
Arriba Finance 894 894
Total 65,113 67,166
The change in carrying amounts by € -2,053 thousand was attributable to currency translation effects of good-
will held in local currency, which were recognised outside profit or loss.
10. INVESTMENTS ACCOUNTED FOR USING THE EQUITY METHOD
Figures in € thousand YTWO Exactal Others Total
Carrying amounts as of 31.12.2016 49,170 2,892 104 52,166
Additions 0 0 39 39
Elimination of unrealized profits from “downstream sales” -7,601 0 0 -7,601
Dividend paid to the group 0 -97 0 -97
Profit/loss attributable to the group recognized in the consolidated income statement -3,199 210 0 -2,989
Profit/loss attributable to the group recognized in the consolidated comprehensive income -5,836 -123 0 -5,959
Carrying amounts as of 30.09.2017 32,534 2,882 143 35,559
17INTERIM REPORT JANUARY - SEPTEMBER 2017 | RIB SOFTWARE SE
NOTES TO ThE CONSOLIDATED INTERIM FINANCIAL STATEMENTS | CONSOLIDATED INTERIM FINANCIAL STATEMENTS
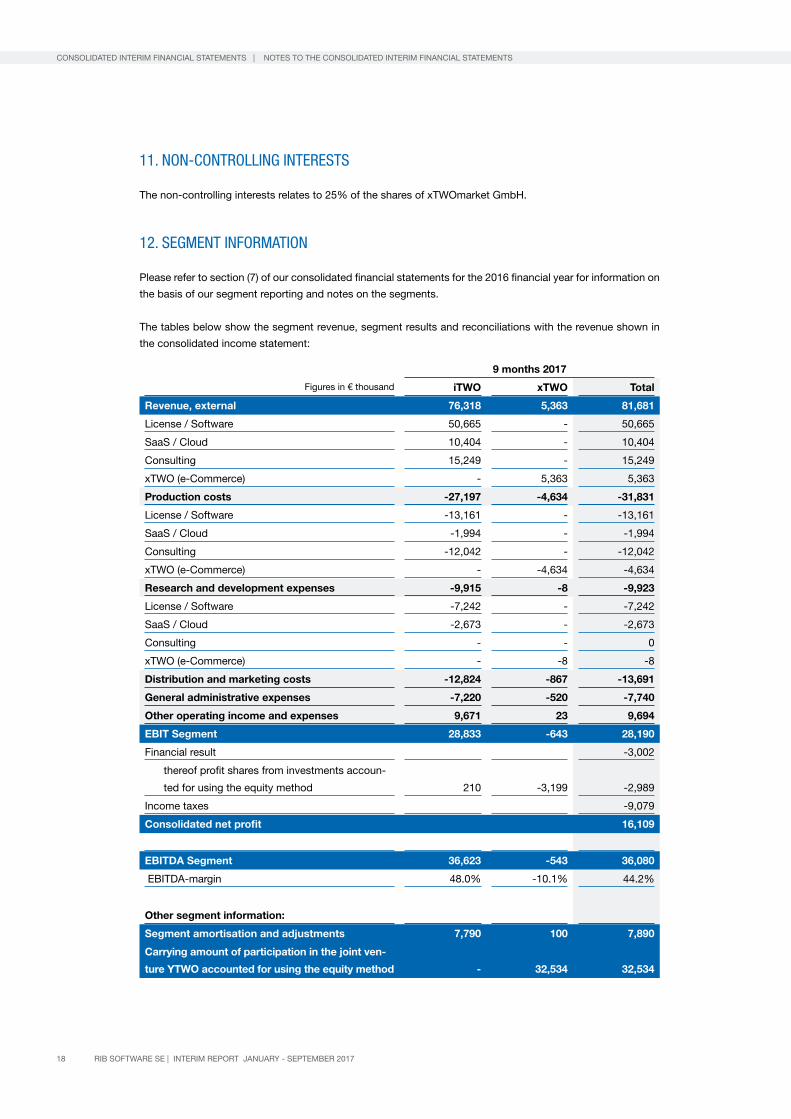
11. NON-CONTROLLING INTERESTS
The non-controlling interests relates to 25% of the shares of xTWOmarket Gmbh.
12. SEGMENT INFORMATION
Please refer to section (7) of our consolidated financial statements for the 2016 financial year for information on
the basis of our segment reporting and notes on the segments.
The tables below show the segment revenue, segment results and reconciliations with the revenue shown in
the consolidated income statement:
9 months 2017
Figures in € thousand iTWO xTWO Total
Revenue, external 76,318 5,363 81,681
License / Software 50,665 - 50,665
SaaS / Cloud 10,404 - 10,404
Consulting 15,249 - 15,249
xTWO (e-Commerce) - 5,363 5,363
Production costs -27,197 -4,634 -31,831
License / Software -13,161 - -13,161
SaaS / Cloud -1,994 - -1,994
Consulting -12,042 - -12,042
xTWO (e-Commerce) - -4,634 -4,634
Research and development expenses -9,915 -8 -9,923
License / Software -7,242 - -7,242
SaaS / Cloud -2,673 - -2,673
Consulting - - 0
xTWO (e-Commerce) - -8 -8
Distribution and marketing costs -12,824 -867 -13,691
General administrative expenses -7,220 -520 -7,740
Other operating income and expenses 9,671 23 9,694
EBIT Segment 28,833 -643 28,190
Financial result -3,002
thereof profit shares from investments accoun-
ted for using the equity method 210 -3,199 -2,989
Income taxes -9,079
Consolidated net profit 16,109
EBITDA Segment 36,623 -543 36,080
EBITDA-margin 48.0% -10.1% 44.2%
Other segment information:
Segment amortisation and adjustments 7,790 100 7,890
Carrying amount of participation in the joint ven-
ture YTWO accounted for using the equity method - 32,534 32,534
18 RIB SOFTWARE SE | INTERIM REPORT JANUARY - SEPTEMBER 2017
CONSOLIDATED INTERIM FINANCIAL STATEMENTS | NOTES TO ThE CONSOLIDATED INTERIM FINANCIAL STATEMENTS

9 months 2016
Figures in € thousand iTWO xTWO Total
Revenue, external 65,613 5,185 70,798
License / Software 39,678 - 39,678
SaaS / Cloud 9,742 - 9,742
Consulting 16,193 - 16,193
xTWO (e-Commerce) - 5,185 5,185
Production costs -27,442 -4,923 -32,365
License / Software -13,316 - -13,316
SaaS / Cloud -1,329 - -1,329
Consulting -12,797 - -12,797
xTWO (e-Commerce) - -4,923 -4,923
Research and development expenses -7,373 -32 -7,405
License / Software -5,652 - -5,652
SaaS / Cloud -1,721 - -1,721
Consulting - - 0
xTWO (e-Commerce) - -32 -32
Distribution and marketing costs -11,610 -1,112 -12,722
General administrative expenses -7,052 -668 -7,720
Other operating income and expenses -626 105 -521
EBIT Segment 11,510 -1,445 10,065
Financial result -97
thereof profit shares from investments accounted
for using the equity method 0 0 0
Income taxes -4,253
Consolidated net profit 5,715
EBITDA Segment 18,345 -1,364 16,981
EBITDA-margin 28.0% -26.3% 24.0%
Other segment information:
Segment amortisation and adjustments 6,835 81 6,916
Carrying amount of participation in the joint ven-
ture YTWO accounted for using the equity method - - 0
The Managing Directors as the chief operating decision-makers do not request submission of any regular de-
tails of segment assets and segment liabilities.
19INTERIM REPORT JANUARY - SEPTEMBER 2017 | RIB SOFTWARE SE
NOTES TO ThE CONSOLIDATED INTERIM FINANCIAL STATEMENTS | CONSOLIDATED INTERIM FINANCIAL STATEMENTS

Geographic informationRevenue by geographic area (based on the location of customers) breaks down as follows:
Figures in € thousand 9 months 2017 9 months 2016
EMEA (Europe, Middle East and Africa) 64,706 57,040
APAC (Asia Pacific) 6,646 3,133
North America 10,329 10,625
Total revenue 81,681 70,798
13. FINANCIAL INSTRUMENTS - FAIR VALUE
Classifications and fair valuesThe following table shows the book values and fair values of financial assets and financial liabilities, including
their levels in the fair value hierarchy. It does not contain any information on the fair value of financial assets
and financial debts that are not assessed at fair value if the book value is an appropriate approximation of the
fair value.
20 RIB SOFTWARE SE | INTERIM REPORT JANUARY - SEPTEMBER 2017
CONSOLIDATED INTERIM FINANCIAL STATEMENTS | NOTES TO ThE CONSOLIDATED INTERIM FINANCIAL STATEMENTS

Carrying amount Fair value
Figures in € thousandAvailable
for saleLoans and
receivablesLevel
1Level
2Level
3 Total
As of 30 September 2017
Financial assets at fair value
Cash market and investment funds 86 - 86 - - 86
Corporate Bonds 6 - 6 - - 6
Total 92 - 92 - - 92
Financial assets not mea-sured at fair value
Accounts receivable trade - 26,429 - - - -
Other Assets* 844
Cash and cash equivalents - 148,204 - - - -
Total - 175,477 - - - -
Held for trading
Other finan-cial liabilities
Level 1
Level 2
Level 3 Total
Financial liabilities at fair value
Derivates 2,027 - - - 2,027 2,027
Financial liabilities not measured at fair value
Bank liabilities 5,700
Accounts payable trade - 1,496 - - - -
Other financial liabilities - 62 - - - -
Other liabilities** - 850 - - - -
Total 2,027 8,108 - - 2,027 2,027
* This item does not include other assets in the amount of € 4,192 thousand, which are not financial assets.
** This item does not include other liabilities in the amount of € 2,762 thousand, which are not financial
liabilities.
21INTERIM REPORT JANUARY - SEPTEMBER 2017 | RIB SOFTWARE SE
NOTES TO ThE CONSOLIDATED INTERIM FINANCIAL STATEMENTS | CONSOLIDATED INTERIM FINANCIAL STATEMENTS

Carrying amount Fair value
Figures in € thousandAvailable
for saleLoans and
receivablesLevel
1Level
2Level
3 Total
As of 31 December 2016
Financial assets at fair value . .
Cash market and invest-ment funds 86 - 86 - - 86
Corporate Bonds 12 - 12 - - 12
Total 98 - 98 - - 98
Financial assets not mea-sured at fair value
Accounts receivable trade - 18,420 - - - -
Other Assets* 4,594
Cash and cash equivalents - 135,323 - - - -
Total - 158,337 - - - -
Held for trading
Other finan-cial liabilities
Level 1
Level 2
Level 3 Total
Financial liabilities at fair value
Derivates 2,239 - - 379 1,860 2,239
Financial liabilities not measured at fair value
Accounts payable trade - 2,456 - - - -
Other financial liabilities - 222 - - - -
Other liabilities** - 1,455 - - - -
Total 2,239 4,133 - 379 1,860 2,239
* This item does not include other assets in the amount of € 2,072 thousand, which are not financial assets.
** This item does not include other liabilities in the amount of € 18,217 thousand, which are not financial
liabilities.
22 RIB SOFTWARE SE | INTERIM REPORT JANUARY - SEPTEMBER 2017
CONSOLIDATED INTERIM FINANCIAL STATEMENTS | NOTES TO ThE CONSOLIDATED INTERIM FINANCIAL STATEMENTS

Determination of the fair valuesThe Group uses the following hierarchy for determining and disclosing the fair value of financial instruments:
Level 1:
fair values measured based on quoted prices (unadjusted) in active markets for identical assets or liabilities
Level 2:
fair values measured based on valuation techniques for which any inputs which have a significant effect on
the recorded fair value are not observable, either directly or indirectly
Level 3:
fair values measured based on valuation techniques for which any inputs which have a significant effect on
the recorded fair value are not observable, either directly or indirectly
In determining the time when re-groupings are to be deemed to have occurred between different levels, we
refer to the date of the event or the change in the circumstances that caused the regrouping.
The financial liabilities measured at fair value are derivative financial liabilities from company acquisitions.
The derivatives classified as level 2 as of 31 December 2016 were liabilities from the acquisition of the sub-
sidiary RIB US Cost whose amount depends in particular on the future share price development of the RIB
Software SE. As of 31 March 2017 it was clear that the share price targets were no longer reached within the
agreed period, the liability of € 380 thousand was charged to the income statement as of 31 March 2017.
The derivatives assigned to level 3 are the liability under the option agreement in connection with the acquisi-
tion of the company RIB SAA.
In the 2015 financial year, the group acquired 75% of the shares in RIB SAA. At the same time, purchase and
sale options for the transfer of outstanding shares of 25% were concluded with the sellers. From the holding
position within the scope of the sale option agreement, the group has a financial liability for which an amortized
fair value of € 2,632 thousand was calculated. Of this, a partial amount of € 1,582 thousand was assigned to
the company acquisition and a partial amount in the amount of € 1,050 thousand in a separate transaction in
the form of a pay agreement.
The financial liability attributable to the acquisition of companies was estimated in full in the context of the
accounting for the acquisition of the company. The financial liability assigned to the separate transaction is
accrued over a period of 66 months at the charge of personnel expenses and is recognized as of the balance
sheet date with an amount of € 408 thousand in the financial liabilities. The personnel expenses attributable
to the reporting period amount to € 143 thousand. The interest on financial liabilities resulted in an interest
expense of € 25 thousand.
23INTERIM REPORT JANUARY - SEPTEMBER 2017 | RIB SOFTWARE SE
NOTES TO ThE CONSOLIDATED INTERIM FINANCIAL STATEMENTS | CONSOLIDATED INTERIM FINANCIAL STATEMENTS

For a description of the techniques used in the assessment of this liability as well as the input factors used in
the calculation of the fair value, please refer to our explanations in section (38) in the consolidated financial
statement as of 31 December 2016.
In the reporting period, there were no transfers between levels one and two and no transfers into or out of level
three.
The financial liabilities valued at fair value developed as follows in the reporting period:
Figures in € thousand 2017
As of 1 January 2,239
Changes without effect on profits
0
Changes with effect on profits
Income from the subsequent valuation of purchase price liabilities (other operating income) -380
Personnel expenses from the accumulation of purchase price liabilities (production costs) 143
Expenses from the interest accrued on purchase price liabilities (finance expenses) 25
-212
As of 30 September 2,027
Material valuation parameters were subjected to a sensitivity analysis for measuring the financial liabilities
on level three. The calculations carried out for this purpose by the Group were undertaken separately for the
valuation parameters classified as material. An increase or decrease in the material assumptions would have
had the following effects on the carrying amounts of the financial liabilities on level three of € 2,027 thousand:
Figures in € thousand
Sensitivity Carrying amount
Discounting interest rate used for the discounting period + 1 %-point 1,903
Discounting interest rate used for the discounting period - 1 %-point 2,060
Growth rate in the budgeted revenues in the budget period + 10.0 % 2,217
Growth rate in the budgeted revenues in the budget period - 10.0 % 1,678
Stuttgart, 30 October 2017
RIB Software SE
The Managing Directors
Thomas Wolf Michael Sauer helmut Schmid Mads Bording Rasmussen
24 RIB SOFTWARE SE | INTERIM REPORT JANUARY - SEPTEMBER 2017
CONSOLIDATED INTERIM FINANCIAL STATEMENTS | NOTES TO ThE CONSOLIDATED INTERIM FINANCIAL STATEMENTS

25INTERIM REPORT JANUARY - SEPTEMBER 2017 | RIB SOFTWARE SE
NOTES TO ThE CONSOLIDATED INTERIM FINANCIAL STATEMENTS | CONSOLIDATED INTERIM FINANCIAL STATEMENTS

IMPRINT
Published by:RIB Software SE
vaihinger Straße 151
70567 Stuttgart
Responsible for content:RIB Software SE, Stuttgart
Photos:Page 2: Andreas Dalferth
Design and realisation:RIB Software SE, Stuttgart.
All rights and technical alterations reserved.
Copyright 2017RIB Software SE
October 2017
Trademarks:RIB, RIB iTWO, ARRIBA, the RIB logo and the iTWO logo are registered Trademarks of RIB Software SE in Ger-
many und optionally in other countries. All other trademarks and product names is property of the respective
owners. After deadline changes may have occurred. RIB does not guarantee its accuracy.
Translation of the original German version:The English version of the Interim Report is a translation of the original German version; in the event of varian-
ces, the German version shall take precedence over the English translation.
FURTHER INFORMATION
FuRThER INFORMATION
26 RIB SOFTWARE SE | INTERIM REPORT JANUARY - SEPTEMBER 2017

RIB Software SEvaihinger Straße 151
70567 Stuttgart
Investor RelationsPhone: +49 (0) 711 7873-191
Fax: +49 (0) 711 7873-311
E-Mail: [email protected]
Internet: group.rib-software.com
CareersInternet: group.rib-software.com/en/careers
Product information and References
www.rib-software.com/itwo-references
www.rib-software.com/itwo-broschuere
CONTACT
FINANCIAL CALENDAR 2017
28 April 2017
Interim Report
(January - March 2017)
Analyst Conference Call
30 May 2017
Annual General Meeting
31 March 2017
Annual Report 2016
Analyst Conference Call
31 July 2017
Interim Report
(January - June 2017)
Analyst Conference Call
30 October 2017
Interim Report
(January - September 2017)
Analyst Conference Call
FuRThER INFORMATION
27INTERIM REPORT JANUARY - SEPTEMBER 2017 | RIB SOFTWARE SE

Scan to learn more about YTWO Formative
January - September 2017
Interim Report
RIB Software SE
Investor Relations Vaihinger Straße 151 70567 Stuttgart
Phone: +49 711 7873-191 Fax: +49 711 7873-311
E-Mail: [email protected] Internet: group.rib-software.com