Interim Report Q2 2019 - Goodvalley...Highlights Page 1 GOODALLE Z Q2 2019 INTERIM REPORT Goodvalley...
26
Interim Report Q2 2019
Transcript of Interim Report Q2 2019 - Goodvalley...Highlights Page 1 GOODALLE Z Q2 2019 INTERIM REPORT Goodvalley...

Interim Report Q2 2019

Highlights
Page 1G O O D V A L L E Y • Q 2 2 0 1 9 I N T E R I M R E P O R T
Goodvalley increased its production and sales of live pigs in Q2 2019 as market conditions and prices improved across Europe. Higher input prices had Goodvalley reduce the number of pigs slaughtered as the sales price for value added pork products could not immediately be adjusted to compensate the elevated cost level. Operational performance remained strong at Group level despite negative effects of the aftermath of cases of stomach ulcers in the herd in Ukraine in Q1.
“ We were pleased to maintain strong operational performance in the quarter while building up the herd across our markets to an all-time high on the back of our recent investments in improved and upgraded stables. Our live pigs sales benefited from the improved demand in Eu-rope, which led to less profitable pork production at our slaughterhouse, though, as the steep increase in input costs could not be immediately com-pensated by higher sales prices for pork products on supermarket shelves.
” says CEO Hans Henrik Pedersen.
Contact information Hans Henrik Pedersen, CEO Tel.: +45 7652 2000
Conference callA conference call for investors, analysts and other stake-holders will be conducted in English by CEO Hans Henrik Pedersen and Vice CEO Kristian Brokop on 28 August 2019 at 10 AM (CET). The conference call can be followed live via this link, and participants may dial telephone num-bers provided at our corporate website to ask questions.
Q 2 2 0 1 9• Group revenue increased to DKK 385 million (Q2 2018: DKK 374
million) as Goodvalley sold more live pigs at a higher average price. The Group’s Adjusted EBITDA* declined slightly to DKK 77 million (Q2 2018: DKK 83 million) corresponding to an Adjusted EBITDA margin of 20.0% (Q2 2018: 22.2%) due to lower sales of pork products and higher feed costs.
• Revenue in the Polish business was stable at DKK 240 million (Q2 2018: DKK 239 million), and Adjusted EBITDA increased to DKK 22 million (Q2 2018: DKK 18 million). The development was driven by higher live pig sales volume and price, which was partly offset by lower pork sales volume during the quarter.
• In Ukraine, revenue increased to DKK 97 million (Q2 2018: DKK 92 million) based on moderately higher volumes and prices. Adjusted EBITDA declined to DKK 37 million (Q2 2018: DKK 49 million) due to repercussions of cases of stomach ulcers in the pig production in Q1, as well as lower expectations for the upcoming harvest.
• Russia lifted revenue to DKK 48 million (Q2 2018: DKK 43 million), whereas Adjusted EBITDA declined to DKK 13 mil-lion (Q2 2018: DKK 20 million) due to a negative impact on the arable activities caused by drought in the spring as well as a significant reduction in the meat-to-feed ratio.
H 1 2 0 1 9• Group revenue was DKK 707 million (H1 2018: DKK 725 mil-
lion), and Adjusted EBITDA amounted to DKK 114 million (H1 2018: DKK 156 million), corresponding to an Adjusted EBITDA margin of 16.1% (H1 2018: 21.5%).
• Polish revenue came to DKK 452 million (DKK 466 million) with Adjusted EBITDA of DKK 29 million (H1 2018: DKK 54 million).
• In Ukraine, revenue was DKK 172 million (H1 2018: DKK 183 million), and Adjusted EBITDA came to DKK 53 million (H1 2018: DKK 78 million).
• The Russian business generated revenue of DKK 83 million (H1 2018: DKK 76 million) and Adjusted EBITDA of DKK 24 million (H1 2018: DKK 31 million).
O U T L O O K :Goodvalley maintains expectations of generating revenue of DKK 1,400-1,550 million and an Adjusted EBITDA of DKK 220-280 million in 2019.
*In this report, Adjusted EBITDA refers to EBITDA adjusted for herd price changes and non-recurring items, cf. page 3.

Page 2G O O D V A L L E Y • Q 2 2 0 1 9 I N T E R I M R E P O R T
Financial highlightsDKK million Q 2 2 0 1 9 Q 2 2 0 1 8 H 1 2 0 1 9 H 1 2 0 1 8
Income statement
Revenue 385 374 707 725
Total income 518 446 898 856
Gross profit 160 103 225 226
EBITDA 136 73 177 170
Adjusted EBITDA 77 83 114 156
EBIT 100 42 106 110
Financial items, net (4) (8) (12) (18)
Profit / (loss) for the period 95 34 92 92
Adjusted* profit 24 37 6 63
Cash flow
Operating activity 61 44 86 83
Investing activity (15) (85) (36) (123)
Free cash flow 45 (41) 51 (40)
Financing activity (24) 13 (34) 12
Balance sheet
Non-current assets 2,040 1,864 2,040 1,864
Net working capital 609 599 609 599
Invested capital 2,649 2,463 2,649 2,463
Total assets 2,839 2,819 2,839 2,819
Equity 1,399 1,318 1,399 1,318
Net interest-bearing debt 1,186 1,142 1,186 1,142
DKK million Q 2 2 0 1 9 Q 2 2 0 1 8 H 1 2 0 1 9 H 1 2 0 1 8
Financial ratios
Gross margin 41.5% 27.6% 31.9% 31.1%
EBITDA margin 35.2% 19.6% 25.1% 23.5%
Adjusted EBITDA margin 20.0% 22.2% 16.1% 21.5%
EBIT margin 26.0% 11.3% 15.0% 15.2%
Free cash flow / Revenue 11.8% (11.0%) 7.3% (5.5%)
Cash conversion 79.1% 53.1% 76.6% 53.3%
Capex 19 (68) 41 (109)
NIBD/Adjusted EBITDA LTM 6.6 3.1 6.6 3.1
Equity ratio 49.3% 46.8% 49.3% 46.8%
ROIC 1.6% 8.9% 1.6% 8.9%
FTE end of period 2,209 2,301 2,209 2,301
Share ratios
Earnings per share, DKK 2 1 2 2
Goodvalley Bond Obligor Group*
Revenue 337 331 624 649
Total income 471 395 804 765
EBITDA 124 50 152 134
Adjusted EBITDA 64 63 90 125
Interest bearing debt 1,222 1,216 1,222 1,216
Net interest bearing debt 1,175 1,144 1,175 1,144
Adjusted EBITDA LTM 119 312 119 312
NIBD/Adjusted EBITDA LTM 9.9 3.7 9.9 3.7
* Bond Obligor Group consists of: Goodvalley A/S, Finansax ApS, Goodvalley Agro SA, Goodvalley Sp. Z o.o. and Goodvalley Ukraine LLC.
*In this report, Adjusted profit refers to profit for the period adjusted for non-recurring items, herd price changes and exchange rate adjustments in financial items.
Page 3G O O D V A L L E Y • Q 2 2 0 1 9 I N T E R I M R E P O R T
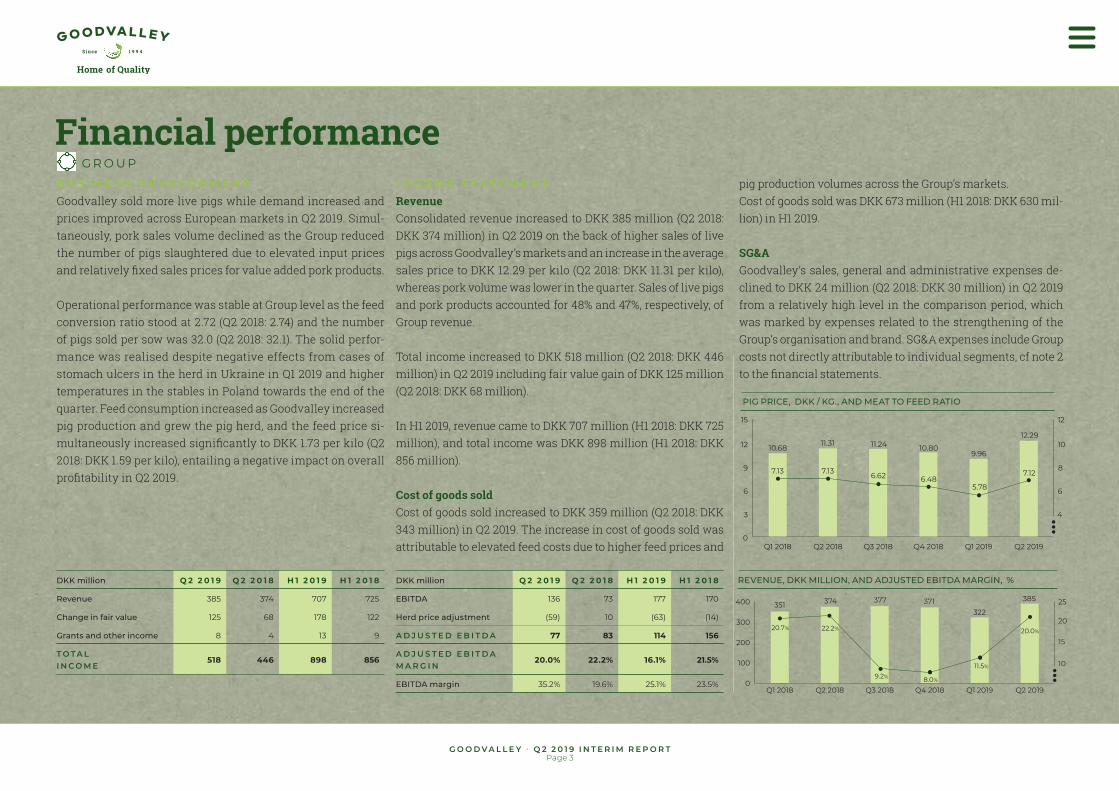
Financial performanceB U S I N E S S D E V E L O P M E N TGoodvalley sold more live pigs while demand increased and prices improved across European markets in Q2 2019. Simul-taneously, pork sales volume declined as the Group reduced the number of pigs slaughtered due to elevated input prices and relatively fixed sales prices for value added pork products.
Operational performance was stable at Group level as the feed conversion ratio stood at 2.72 (Q2 2018: 2.74) and the number of pigs sold per sow was 32.0 (Q2 2018: 32.1). The solid perfor-mance was realised despite negative effects from cases of stomach ulcers in the herd in Ukraine in Q1 2019 and higher temperatures in the stables in Poland towards the end of the quarter. Feed consumption increased as Goodvalley increased pig production and grew the pig herd, and the feed price si-multaneously increased significantly to DKK 1.73 per kilo (Q2 2018: DKK 1.59 per kilo), entailing a negative impact on overall profitability in Q2 2019.
I N C O M E S TAT E M E N TRevenueConsolidated revenue increased to DKK 385 million (Q2 2018: DKK 374 million) in Q2 2019 on the back of higher sales of live pigs across Goodvalley’s markets and an increase in the average sales price to DKK 12.29 per kilo (Q2 2018: DKK 11.31 per kilo), whereas pork volume was lower in the quarter. Sales of live pigs and pork products accounted for 48% and 47%, respectively, of Group revenue.
Total income increased to DKK 518 million (Q2 2018: DKK 446 million) in Q2 2019 including fair value gain of DKK 125 million (Q2 2018: DKK 68 million).
In H1 2019, revenue came to DKK 707 million (H1 2018: DKK 725 million), and total income was DKK 898 million (H1 2018: DKK 856 million).
Cost of goods soldCost of goods sold increased to DKK 359 million (Q2 2018: DKK 343 million) in Q2 2019. The increase in cost of goods sold was attributable to elevated feed costs due to higher feed prices and
pig production volumes across the Group’s markets.Cost of goods sold was DKK 673 million (H1 2018: DKK 630 mil-lion) in H1 2019. SG&AGoodvalley’s sales, general and administrative expenses de-clined to DKK 24 million (Q2 2018: DKK 30 million) in Q2 2019 from a relatively high level in the comparison period, which was marked by expenses related to the strengthening of the Group’s organisation and brand. SG&A expenses include Group costs not directly attributable to individual segments, cf note 2 to the financial statements.
DKK million Q 2 2 0 1 9 Q 2 2 0 1 8 H 1 2 0 1 9 H 1 2 0 1 8
Revenue 385 374 707 725
Change in fair value 125 68 178 122
Grants and other income 8 4 13 9
T O T A L I N C O M E
518 446 898 856
DKK million Q 2 2 0 1 9 Q 2 2 0 1 8 H 1 2 0 1 9 H 1 2 0 1 8
EBITDA 136 73 177 170
Herd price adjustment (59) 10 (63) (14)
A D J U S T E D E B I T D A 77 83 114 156
A D J U S T E D E B I T D A M A R G I N
20.0% 22.2% 16.1% 21.5%
EBITDA margin 35.2% 19.6% 25.1% 23.5%
REVENUE, DKK MILLION, AND ADJUSTED EBITDA MARGIN, %
G R O U P
050
100150
200250
300350
400 25
15
10
20
351 374 377 371 385
322
Q2 2019Q1 2019Q4 2018Q3 2018Q2 2018Q1 2018
20.7% 22.2%
9.2% 8.0%
11.5%
20.0%
PIG PRICE, DKK / KG., AND MEAT TO FEED RATIO
0
3
6
9
12
15
4
6
8
10
12
10.6811.31 11.24 10.80
9.96
12.29
Q2 2019Q1 2019Q4 2018Q3 2018Q2 2018Q1 2018
7.13 7.13 6.62 6.485.78
7.12
Page 4G O O D V A L L E Y • Q 2 2 0 1 9 I N T E R I M R E P O R T
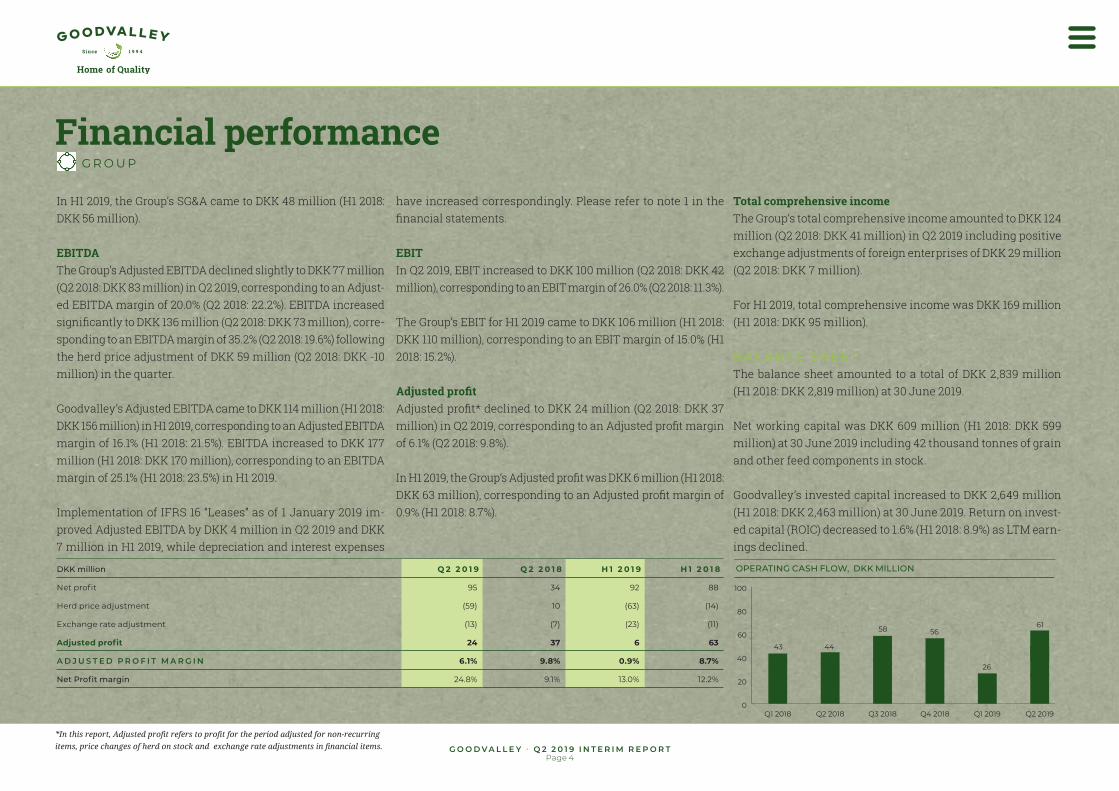
Financial performanceIn H1 2019, the Group’s SG&A came to DKK 48 million (H1 2018: DKK 56 million).
EBITDAThe Group’s Adjusted EBITDA declined slightly to DKK 77 million (Q2 2018: DKK 83 million) in Q2 2019, corresponding to an Adjust-ed EBITDA margin of 20.0% (Q2 2018: 22.2%). EBITDA increased significantly to DKK 136 million (Q2 2018: DKK 73 million), corre-sponding to an EBITDA margin of 35.2% (Q2 2018: 19.6%) following the herd price adjustment of DKK 59 million (Q2 2018: DKK -10 million) in the quarter.
Goodvalley’s Adjusted EBITDA came to DKK 114 million (H1 2018: DKK 156 million) in H1 2019, corresponding to an Adjusted EBITDA margin of 16.1% (H1 2018: 21.5%). EBITDA increased to DKK 177 million (H1 2018: DKK 170 million), corresponding to an EBITDA margin of 25.1% (H1 2018: 23.5%) in H1 2019.
Implementation of IFRS 16 “Leases” as of 1 January 2019 im-proved Adjusted EBITDA by DKK 4 million in Q2 2019 and DKK 7 million in H1 2019, while depreciation and interest expenses
have increased correspondingly. Please refer to note 1 in the financial statements.
EBITIn Q2 2019, EBIT increased to DKK 100 million (Q2 2018: DKK 42 million), corresponding to an EBIT margin of 26.0% (Q2 2018: 11.3%).
The Group’s EBIT for H1 2019 came to DKK 106 million (H1 2018: DKK 110 million), corresponding to an EBIT margin of 15.0% (H1 2018: 15.2%).
Adjusted profitAdjusted profit* declined to DKK 24 million (Q2 2018: DKK 37 million) in Q2 2019, corresponding to an Adjusted profit margin of 6.1% (Q2 2018: 9.8%).
In H1 2019, the Group’s Adjusted profit was DKK 6 million (H1 2018: DKK 63 million), corresponding to an Adjusted profit margin of 0.9% (H1 2018: 8.7%).
Total comprehensive incomeThe Group’s total comprehensive income amounted to DKK 124 million (Q2 2018: DKK 41 million) in Q2 2019 including positive exchange adjustments of foreign enterprises of DKK 29 million (Q2 2018: DKK 7 million).
For H1 2019, total comprehensive income was DKK 169 million (H1 2018: DKK 95 million).
B A L A N C E S H E E TThe balance sheet amounted to a total of DKK 2,839 million (H1 2018: DKK 2,819 million) at 30 June 2019.
Net working capital was DKK 609 million (H1 2018: DKK 599 million) at 30 June 2019 including 42 thousand tonnes of grain and other feed components in stock.
Goodvalley’s invested capital increased to DKK 2,649 million (H1 2018: DKK 2,463 million) at 30 June 2019. Return on invest-ed capital (ROIC) decreased to 1.6% (H1 2018: 8.9%) as LTM earn-ings declined.
DKK million Q 2 2 0 1 9 Q 2 2 0 1 8 H 1 2 0 1 9 H 1 2 0 1 8
Net profit 95 34 92 88
Herd price adjustment (59) 10 (63) (14)
Exchange rate adjustment (13) (7) (23) (11)
Adjusted profit 24 37 6 63
A D J U S T E D P R O F I T M A R G I N 6.1% 9.8% 0.9% 8.7%
Net Profit margin 24.8% 9.1% 13.0% 12.2%
*In this report, Adjusted profit refers to profit for the period adjusted for non-recurring items, price changes of herd on stock and exchange rate adjustments in financial items.
G R O U P
OPERATING CASH FLOW, DKK MILLION
0
20
40
6043 44
58 5661
26
60
80
100
Q2 2019Q1 2019Q4 2018Q3 2018Q2 2018Q1 2018

Page 5G O O D V A L L E Y • Q 2 2 0 1 9 I N T E R I M R E P O R T
Total equity increased to DKK 1,399 million (H1 2018: DKK 1,318 million) at 30 June 2019, corresponding to an equity ratio of 49.3% (H1 2018: 46.8%).
Goodvalley’s net interest-bearing debt increased to DKK 1,186 million (H1 2018: DKK 1,142 million) at 30 June 2019 due to a DKK 55 million effect of implementing IFRS 16 “Leases”, cf. note 1 to the financial statements. NIBD/Adjusted EBITDA LTM increased to 6.6 (H1 2018: 3.1).
N E W S E G M E N T R E P O R T I N GOn 13 August 2019, Goodvalley announced (company an-nouncement no. 10/2019) a new financial reporting structure introducing the geographical segments Poland, Ukraine and Russia to replace the historical business segments. The re-vised external reporting structure is a consequence of the launch of one Group identity in 2018 and the introduction of a country-based organisational structure and internal man-agement reporting setup. The introduction of a new reporting structure has no influence on the Group’s CO2 neutral and vertically integrated business model, which is unchanged.
The new reporting structure has been implemented with retrospective effect, whereby comparative figures have been restated accordingly. See note 2 to the financial statements for an overview of selected financial figures presented in ac-cordance with the historical business areas and the new geo-graphical segments.
Financial performanceG R O U P
ROIC, %
0
5
10
15
20
12.8
8.96.4
4.02.1 1.6
Q2 2019Q1 2019Q4 2018Q3 2018Q2 2018Q1 2018
PIGS SOLD, THOUSAND TONNES (LIVE WEIGHT)
0
5
10
15
20
25
30
35
Q2 2019Q1 2019Q4 2018Q3 2018Q2 2018Q1 2018
14.2 14.1 13.5 14.9 14.0 14.3
9.8 9.1 9.4 10.3 8.1 9.5
4.0 4.6 4.55.1 5.1
4.1
28.0 27.7 27.430.3
26.328.8
POLAND UKRAINE RUSSIA

Page 6G O O D V A L L E Y • Q 2 2 0 1 9 I N T E R I M R E P O R T
Financial performanceSales of pork products declined to 10.5 thousand tonnes (Q2 2018: 13.0 thousand tonnes) in Poland in Q2 2019 as Goodvalley slaughtered fewer pigs due to high input costs that could not be immediately absorbed as sales prices for value added pork products were partly fixed in the quarter. Goodvalley grew the share of MAP (Modified Atmosphere Packaging) products to 27% (Q2 2018: 19%), while the share of processed products and deboned meat amounted to 23% (Q2 2018: 25%) and 50% (Q2 2018: 56%), respectively. Sales of Goodvalley’s branded products continued to improve in Q2 2019.
The impact of lower pork product sales was mitigated as Good-valley grew sales of live pigs moderately to 14.3 thousand tonnes (Q2 2018: 14.1 thousand tonnes) at a higher average pig price of DKK 12.37 per kilo (Q2 2018: DKK 10.63 per kilo).
Revenue in the Polish business was stable at DKK 240 million (Q2 2018: DKK 239 million), accounting for 62% of Group revenue.
Segment revenue was comprised of 74% from pork products, 17% from external sales of live pigs and 9% from external sales of crops and energy from the Group’s eight biogas plants in Poland.
Total income grew significantly to DKK 321 million (Q2 2018: DKK 257 million) in Q2 2019 due to the higher pig price and increasing volumes at the Group’s newly renovated farms as well as higher expectations for the arable yield in Poland, entailing fair value adjustments of DKK 74 million (Q2 2018: DKK 13 million).
Adjusted EBITDA increased to DKK 22 million (Q2 2018: DKK 18 million), corresponding to an improvement of the Adjusted EBITDA margin to 9.3% (Q2 2018: 7.6%) on the back of the higher pig price and a slightly improved feed conversion ratio of 2.78 (Q2 2018: 2.83). Progress was realized despite a significant in-crease in the feed price to DKK 1.82 per kilo (Q2 2018: DKK 1.72 per kilo) and a temporary decline in production efficiency at
DKK million Q 2 2 0 1 9 Q 2 2 0 1 8 H 1 2 0 1 9 H 1 2 0 1 8
R E V E N U E 240 239 452 466
Change in fair value 74 13 102 50
Other income 7 5 13 8
T O TA L I N C O M E 321 257 567 524
E B I T D A 71 8 88 63
A D J U S T E D E B I T D A 22 18 29 54
Adjusted EBITDA margin 9.3% 7.6% 6.4% 11.5%
SALE OF PORK (SLAUGHTERED), THOUSAND TONNES
PIG PRICE, DKK/ KG., AND MEAT TO FEED RATIO
PIGS SOLD PER SOW, HEADS
P O L A N D
0
2
4
6
8
10
12
8
6
4
10
12
Q2 2019Q1 2019Q4 2018Q3 2018Q2 2018Q1 2018
10.53
6.31
5.66 5.745.03
6.796.17
10.63 10.35 9.999.07
12.37
5
7
9
11
13
15
Q2 2019Q1 2019Q4 2018Q3 2018Q2 2018Q1 2018
13.0 13.0
12.0
13.3
11.5
10.5
25
27
29
31
33
35
Q2 2019Q1 2019Q4 2018Q3 2018Q2 2018Q1 2018
31.0 30.9
29.7 29.7
32.2
30.0
HAM
HOTDOGS
The traditional sausage is the main category in Poland, and Goodvalley´s
quality product offers unique product attributes, differentiating it from other
products in the category, which compete mainly on price.
Goodvalley´s ham product was well-received during a test period
in Poland´s largest retail chain, Biedronka. The product holds signi-
ficant potential and Goodvalley is preparing to launch wider distribution
in late autumn, which is considered the best season for this category.
Goodvalley´s hotdogs were the first processed products in the Group´s brand-
ed product range. The product holds a premium market position, offering
consumers 100% meat content and a clean label. The product is currently
available to consumers in the main Polish retail chains and across a range
of smaller stores.
SAUSAGES
CLIMATE- FRIENDLY
NON GMO FEED
RWA
All of our products have three attributes:
Page 7G O O D V A L L E Y • Q 2 2 0 1 9 I N T E R I M R E P O R T
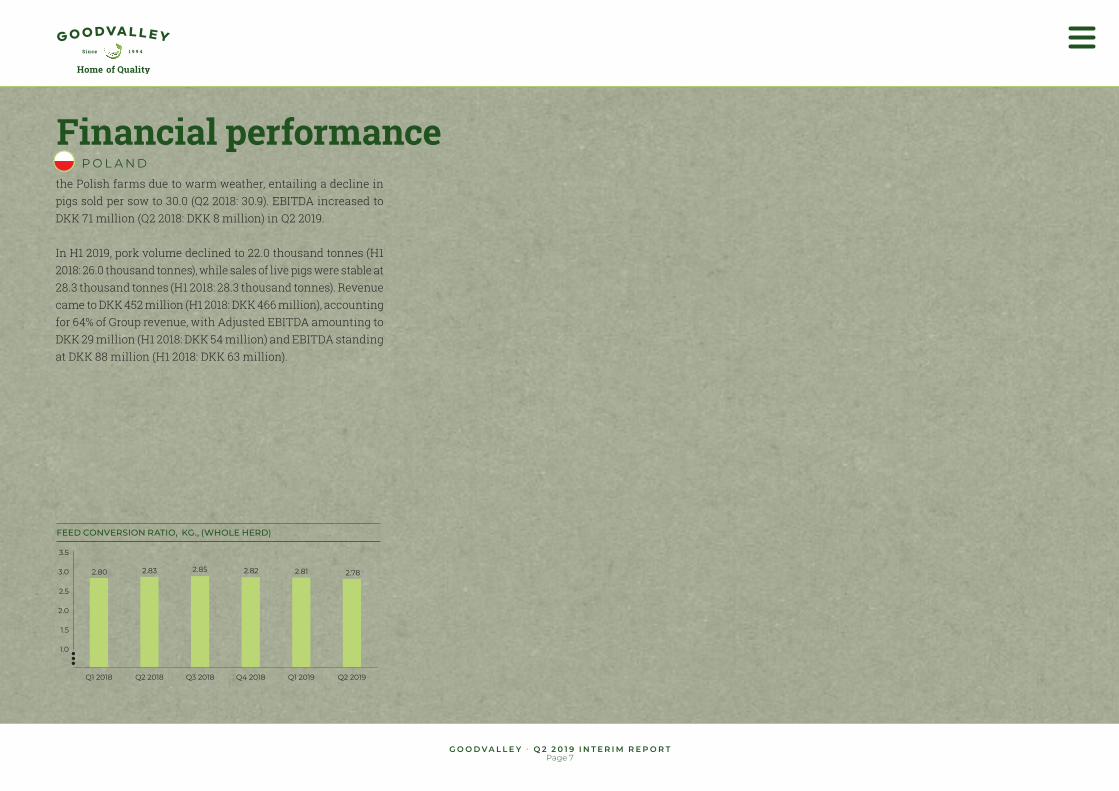
Financial performancethe Polish farms due to warm weather, entailing a decline in pigs sold per sow to 30.0 (Q2 2018: 30.9). EBITDA increased to DKK 71 million (Q2 2018: DKK 8 million) in Q2 2019.
In H1 2019, pork volume declined to 22.0 thousand tonnes (H1 2018: 26.0 thousand tonnes), while sales of live pigs were stable at 28.3 thousand tonnes (H1 2018: 28.3 thousand tonnes). Revenue came to DKK 452 million (H1 2018: DKK 466 million), accounting for 64% of Group revenue, with Adjusted EBITDA amounting to DKK 29 million (H1 2018: DKK 54 million) and EBITDA standing at DKK 88 million (H1 2018: DKK 63 million).
FEED CONVERSION RATIO, KG., (WHOLE HERD)
P O L A N D
0.5
1.0
1.5
2.0
2.5
3.0
3.5
Q2 2019Q1 2019Q4 2018Q3 2018Q2 2018Q1 2018
2.80 2.83 2.85 2.82 2.81 2.78
Page 8G O O D V A L L E Y • Q 2 2 0 1 9 I N T E R I M R E P O R T
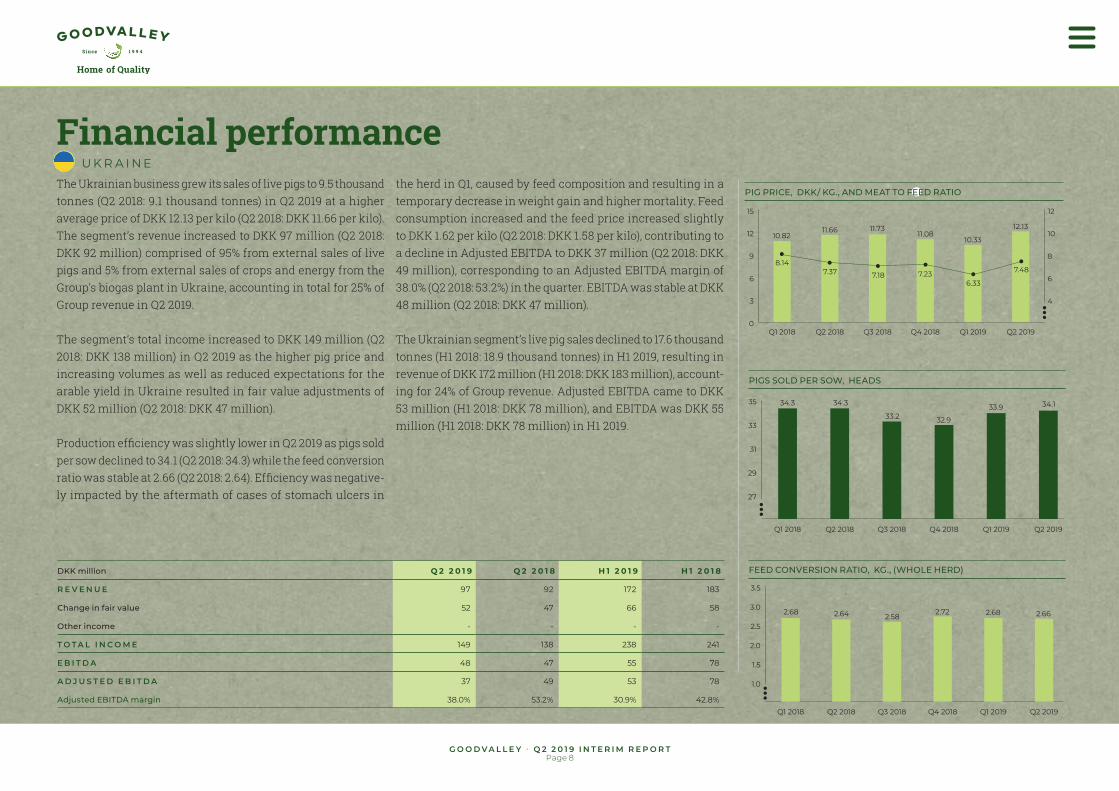
Financial performanceThe Ukrainian business grew its sales of live pigs to 9.5 thousand tonnes (Q2 2018: 9.1 thousand tonnes) in Q2 2019 at a higher average price of DKK 12.13 per kilo (Q2 2018: DKK 11.66 per kilo). The segment’s revenue increased to DKK 97 million (Q2 2018: DKK 92 million) comprised of 95% from external sales of live pigs and 5% from external sales of crops and energy from the Group’s biogas plant in Ukraine, accounting in total for 25% of Group revenue in Q2 2019.
The segment’s total income increased to DKK 149 million (Q2 2018: DKK 138 million) in Q2 2019 as the higher pig price and increasing volumes as well as reduced expectations for the arable yield in Ukraine resulted in fair value adjustments of DKK 52 million (Q2 2018: DKK 47 million).
Production efficiency was slightly lower in Q2 2019 as pigs sold per sow declined to 34.1 (Q2 2018: 34.3) while the feed conversion ratio was stable at 2.66 (Q2 2018: 2.64). Efficiency was negative-ly impacted by the aftermath of cases of stomach ulcers in
the herd in Q1, caused by feed composition and resulting in a temporary decrease in weight gain and higher mortality. Feed consumption increased and the feed price increased slightly to DKK 1.62 per kilo (Q2 2018: DKK 1.58 per kilo), contributing to a decline in Adjusted EBITDA to DKK 37 million (Q2 2018: DKK 49 million), corresponding to an Adjusted EBITDA margin of 38.0% (Q2 2018: 53.2%) in the quarter. EBITDA was stable at DKK 48 million (Q2 2018: DKK 47 million).
The Ukrainian segment’s live pig sales declined to 17.6 thousand tonnes (H1 2018: 18.9 thousand tonnes) in H1 2019, resulting in revenue of DKK 172 million (H1 2018: DKK 183 million), account-ing for 24% of Group revenue. Adjusted EBITDA came to DKK 53 million (H1 2018: DKK 78 million), and EBITDA was DKK 55 million (H1 2018: DKK 78 million) in H1 2019.
PIGS SOLD PER SOW, HEADS
FEED CONVERSION RATIO, KG., (WHOLE HERD)
PIG PRICE, DKK/ KG., AND MEAT TO FEED RATIO
U K R A I N E
0
3
6
9
12
15
4
6
8
10
12
Q2 2019Q1 2019Q4 2018Q3 2018Q2 2018Q1 2018
10.82
8.147.37 7.18 7.23
6.33
7.48
11.66 11.7311.08
10.33
12.13
DKK million Q 2 2 0 1 9 Q 2 2 0 1 8 H 1 2 0 1 9 H 1 2 0 1 8
R E V E N U E 97 92 172 183
Change in fair value 52 47 66 58
Other income - - - -
T O TA L I N C O M E 149 138 238 241
E B I T D A 48 47 55 78
A D J U S T E D E B I T D A 37 49 53 78
Adjusted EBITDA margin 38.0% 53.2% 30.9% 42.8%
25
27
29
31
33
35
Q2 2019Q1 2019Q4 2018Q3 2018Q2 2018Q1 2018
34.3 34.3
33.2 32.9
33.9 34.1
0.5
1.0
1.5
2.0
2.5
3.0
3.5
Q2 2019Q1 2019Q4 2018Q3 2018Q2 2018Q1 2018
2.68 2.64 2.582.72 2.68 2.66

PIGS SOLD PER SOW, HEADS
FEED CONVERSION RATIO, KG., (WHOLE HERD)
PIG PRICE, DKK/ KG AND MEAT TO FEED RATIO
Page 9G O O D V A L L E Y • Q 2 2 0 1 9 I N T E R I M R E P O R T
Financial performanceR U S S I A
In Q2 2019, Goodvalley Russia lifted sales of live pigs to 5.1 thousand tonnes (Q2 2018: 4.6 thousand tonnes) at a slightly lower price of DKK 12.40 per kilo (Q2 2018: DKK 12.57 per kilo). Revenue in the Russian business grew to DKK 48 million (Q2 2018: DKK 43 million) from external sales of live pigs, accounting in total for 13% of Group revenue in the quarter.
Total income for the Russian activities was moderately lower at DKK 48 million (Q2 2018: DKK 51 million) in Q2 2019.
Adjusted EBITDA declined to DKK 13 million (Q2 2018: DKK 20 million), corresponding to an Adjusted EBITDA margin of 28.0% (Q2 2018: 46.0%) in Q2 2019 due to a significant increase in the feed price to DKK 1.64 per kilo (Q2 2018: DKK 1.17 per kilo) as well as negative effects of challenging weather conditions on the
Russian arable activities. Pig production efficiency was higher as the number of pigs sold per sow in the Russian business increased to 32.5 (Q2 2018: 32.0) driven by general efficiency improvements resulting mainly from cross-border knowledge sharing across the Group. EBITDA declined to DKK 12 million (Q2 2018: DKK 23 million) in Q2 2019.
In H1 2019, the Russian segment grew its live pig sales volume to 9.2 thousand tonnes (H1 2018: 8.6 thousand tonnes) and rev-enue to DKK 83 million (H1 2018: DKK 76 million), accounting for 12% of Group revenue. Adjusted EBITDA was DKK 24 million (H1 2018: DKK 31 million), and EBITDA came to DKK 26 million (H1 2018: DKK 36 million) in H1 2019.
25
27
29
31
33
35
Q2 2019Q1 2019Q4 2018Q3 2018Q2 2018Q1 2018
31.9 32.0 32.0
33.133.6
32.5
0.5
1.0
1.5
2.0
2.5
3.0
3.5
Q2 2019Q1 2019Q4 2018Q3 2018Q2 2018Q1 2018
2.74 2.69 2.69 2.67 2.68 2.65
0
3
6
9
12
15
Q2 2019Q1 2019Q4 2018Q3 2018Q2 2018Q1 2018
8
6
4
10
12
8.48
10.94
12.57 13.5612.41
11.1912.40
9.50 9.09
6.857.55
10.73
DKK million Q 2 2 0 1 9 Q 2 2 0 1 8 H 1 2 0 1 9 H 1 2 0 1 8
R E V E N U E 48 43 83 76
Change in fair value (1) 7 10 14
Other income 1 - - 1
T O TA L I N C O M E 48 51 93 91
E B I T D A 12 23 26 36
A D J U S T E D E B I T D A 13 20 24 31
Adjusted EBITDA margin 28.0% 46.0% 28.4% 40.7%

Page 10G O O D V A L L E Y • Q 2 2 0 1 9 I N T E R I M R E P O R T
OutlookGoodvalley maintains the outlook for 2019 based on year-to-date performance and expectations of higher market prices for live pigs, which are seen to boost results from the Group's pig production units, while simultaneously reducing earnings from the production of value added food products due to elevated in-put prices and relatively fixed sales prices. The outlook for 2019 is furthermore impacted by increased feed costs and reduced expectations for the Group’s arable yields. Group revenue is expected to amount to DKK 1,400-1,550 million, and Adjusted EBITDA is expected to reach DKK 220-280 million.
AssumptionsFollowing a significant price increase in Q2 2019, Goodvalley now bases the outlook for the full-year on an average market pricefor live pigs of DKK 12.0 per kilo (previously DKK 11.2 per kilo)
slaughter pig and a feed price of DKK 1.72 per kilo (previously DKK 1.69 per kilo) at Group level.
Current fluctuations in live pig prices in Goodvalley’s markets continue to be driven mainly by changes in supply and demand in the Chinese market following ASF outbreaks, entailing con-tinued low transparency. The outlook is furthermore based on current exchange rates for the Group’s key currencies as well as the prevailing economic situation in Goodvalley’s markets.
The outlook represents our current expectations for the de-velopment in the Group’s revenue and Adjusted EBITDA, and Goodvalley’s EBITDA may thus deviate significantly from this outlook.
This report contains forward-looking statements reflecting Goodvalley’s current forecasts of future events, operational performance and financial results. Such statements are subject to uncertainty as factors within and beyond Goodvalley’s control may cause actual performance and results to differ materially from the forecasts in this report. Such factors include, among other things, the fair value of pigs, global and local market prices of pork meat, changes in consumer preferences and demand, consumer purchasing power, competition, any outbreak of animal diseases or epidemics, the supply of utilities, developments in financial markets and changes or amendments to legislation, regu-lation or the political situation in Goodvalley’s markets. See also the section on risk management and note 4.2 to the annual financial statements for 2018.
D K K M I L L I O N 2 0 1 9 O U T L O O K
R E V E N U E 1,400-1,550
A D J U S T E D E B I T D A 220-280
F I N A N C I A L C A L E N D A R 2 0 1 9 2 7 N O V E M B E R 2 0 1 9 : I N T E R I M R E P O R T Q 3 2 0 1 9
Page 11G O O D V A L L E Y • Q 2 2 0 1 9 I N T E R I M R E P O R T
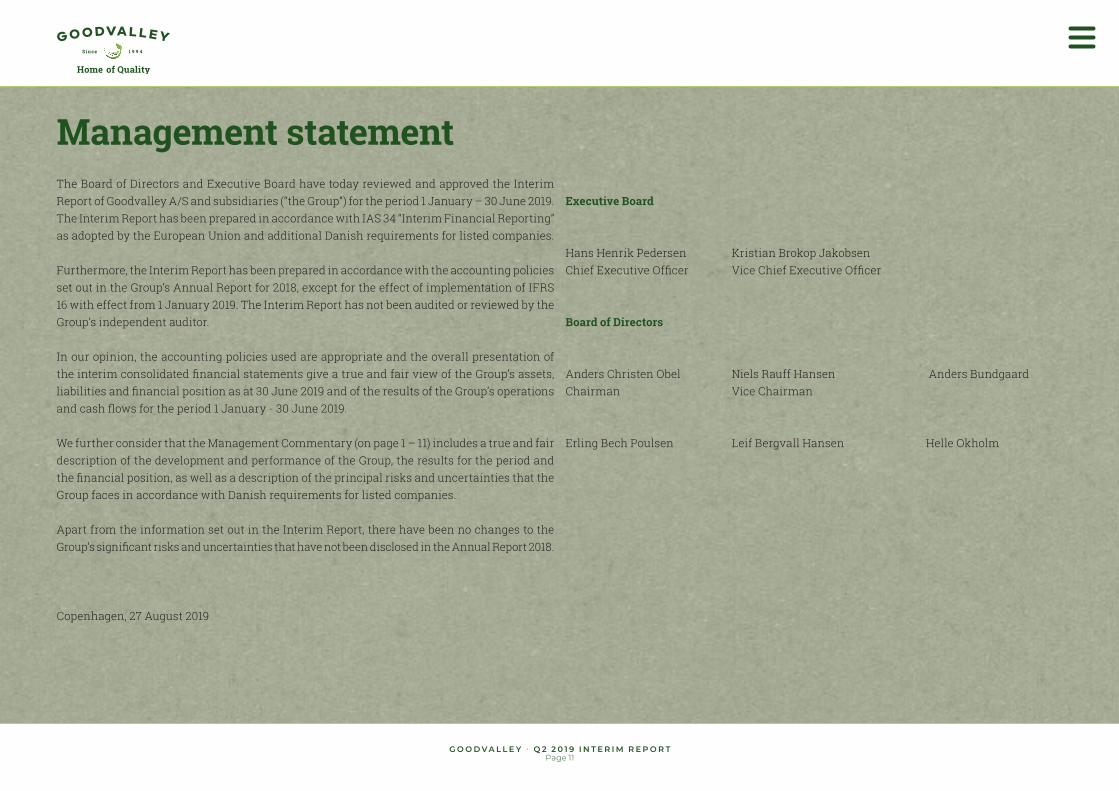
Management statementThe Board of Directors and Executive Board have today reviewed and approved the Interim Report of Goodvalley A/S and subsidiaries (“the Group”) for the period 1 January – 30 June 2019. The Interim Report has been prepared in accordance with IAS 34 “Interim Financial Reporting” as adopted by the European Union and additional Danish requirements for listed companies. Furthermore, the Interim Report has been prepared in accordance with the accounting policies set out in the Group’s Annual Report for 2018, except for the effect of implementation of IFRS 16 with effect from 1 January 2019. The Interim Report has not been audited or reviewed by the Group’s independent auditor.
In our opinion, the accounting policies used are appropriate and the overall presentation of the interim consolidated financial statements give a true and fair view of the Group’s assets, liabilities and financial position as at 30 June 2019 and of the results of the Group’s operations and cash flows for the period 1 January - 30 June 2019.
We further consider that the Management Commentary (on page 1 – 11) includes a true and fair description of the development and performance of the Group, the results for the period and the financial position, as well as a description of the principal risks and uncertainties that the Group faces in accordance with Danish requirements for listed companies.
Apart from the information set out in the Interim Report, there have been no changes to the Group’s significant risks and uncertainties that have not been disclosed in the Annual Report 2018.
Copenhagen, 27 August 2019
Executive Board
Hans Henrik Pedersen Kristian Brokop JakobsenChief Executive Officer Vice Chief Executive Officer
Board of Directors
Anders Christen Obel Niels Rauff Hansen Anders BundgaardChairman Vice Chairman
Erling Bech Poulsen Leif Bergvall Hansen Helle Okholm

Page 12G O O D V A L L E Y • Q 2 2 0 1 9 I N T E R I M R E P O R T
Consolidated Financial Statements

Page 13G O O D V A L L E Y • Q 2 2 0 1 9 I N T E R I M R E P O R T
Consolidated statement of comprehensive income
C O N S O L I D AT E D I N C O M E S TAT E M E N TD K K M I L L I O N Q 2 2 0 1 9 Q 2 2 0 1 8 H 1 2 0 1 9 H 1 2 0 1 8
Revenue 385 374 707 725
Change in fair value of biological Assets 125 68 178 122
Grants and other income 8 4 13 9
T O TA L I N C O M E 518 446 898 856
Cost of goods sold (COGS) (359) (343) (673) (630)
G R O S S P R O F I T 160 103 225 226
SG&A (24) (30) (48) (56)
E B I T D A 136 73 177 170
Depreciation and amortisation (36) (31) (71) (60)
P R O F I T B E F O R E F I N A N C I A L E X P E N S E S A N D TA X
100 42 106 110
Financial income 1 1 1 3
Financial expenses (18) (16) (36) (32)
Exchange rate adjustments 13 7 23 11
P R O F I T B E F O R E TA X 96 34 94 92
Income tax (1) - (2) -
P R O F I T O F C O N T I N U I N G O P E R AT I O N S 95 34 92 92
Profit /(loss) for the year of discontinued operations
- - - (4)
P R O F I T F O R T H E P E R I O D 95 34 92 88
Profit / loss is attributable to:
Owners 95 34 92 88
T O TA L 95 34 92 88
C O N S O L I D AT E D S TAT E M E N T O F C O M P R E H E N S I V E D K K M I L L I O N Q 2 2 0 1 9 Q 2 2 0 1 8 H 1 2 0 1 9 H 1 2 0 1 8
Profit for the period 95 34 92 88
Items that may be reclassi f ied subsequently to profit or loss
Exchange adjustments of foreign enterprises 29 7 77 7
T O TA L C O M P R E H E N S I V E I N C O M E 124 41 169 95
Comprehensive income is attributable to:
Owners 124 41 169 95
TOTAL 124 41 169 95
Page 14G O O D V A L L E Y • Q 2 2 0 1 9 I N T E R I M R E P O R T
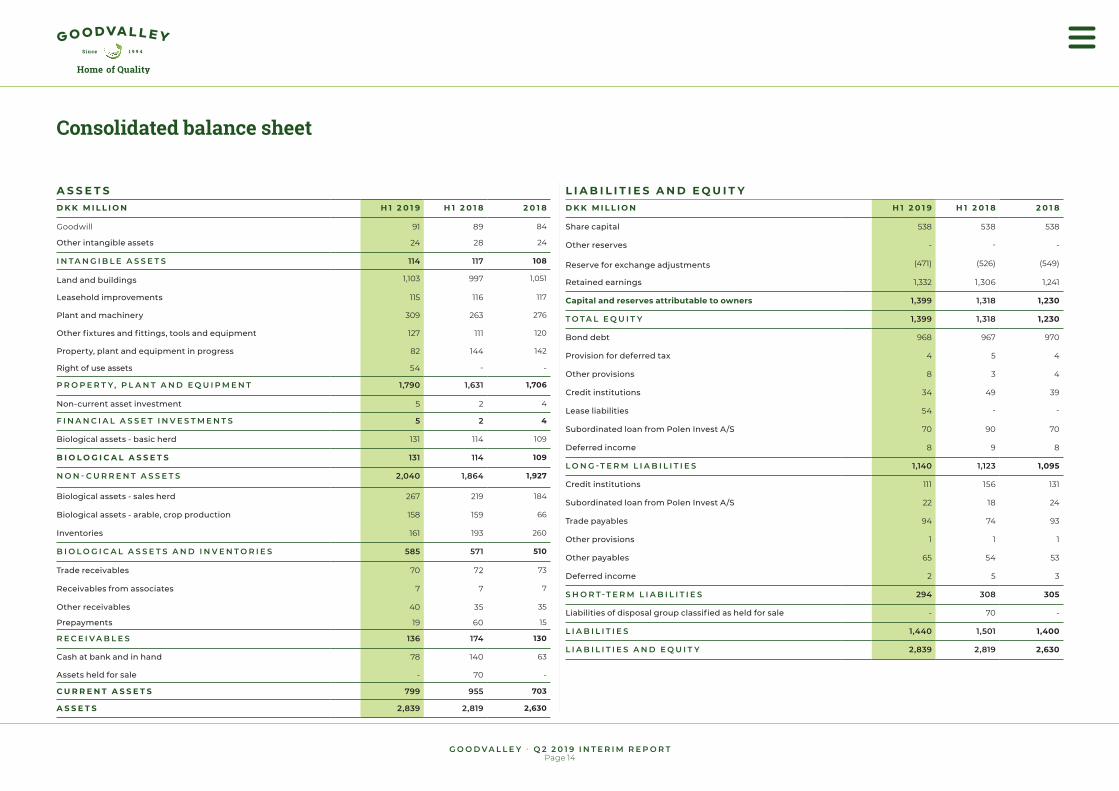
Consolidated balance sheet
A S S E T SD K K M I L L I O N H 1 2 0 1 9 H 1 2 0 1 8 2 0 1 8
Goodwill 91 89 84
Other intangible assets 24 28 24
I N TA N G I B L E A S S E T S 114 117 108
Land and buildings 1,103 997 1,051
Leasehold improvements 115 116 117
Plant and machinery 309 263 276
Other fixtures and fittings, tools and equipment 127 111 120
Property, plant and equipment in progress 82 144 142
Right of use assets 54 - -
P R O P E R T Y , P L A N T A N D E Q U I P M E N T 1,790 1,631 1,706
Non-current asset investment 5 2 4
F I N A N C I A L A S S E T I N V E S T M E N T S 5 2 4
Biological assets - basic herd 131 114 109
B I O L O G I C A L A S S E T S 131 114 109
N O N - C U R R E N T A S S E T S 2,040 1,864 1,927
Biological assets - sales herd 267 219 184
Biological assets - arable, crop production 158 159 66
Inventories 161 193 260
B I O L O G I C A L A S S E T S A N D I N V E N T O R I E S 585 571 510
Trade receivables 70 72 73
Receivables from associates 7 7 7
Other receivables 40 35 35
Prepayments 19 60 15
R E C E I V A B L E S 136 174 130
Cash at bank and in hand 78 140 63
Assets held for sale - 70 -
C U R R E N T A S S E T S 799 955 703
A S S E T S 2,839 2,819 2,630
L I A B I L I T I E S A N D E Q U I T YD K K M I L L I O N H 1 2 0 1 9 H 1 2 0 1 8 2 0 1 8
Share capital 538 538 538
Other reserves - - -
Reserve for exchange adjustments (471) (526) (549)
Retained earnings 1,332 1,306 1,241
Capital and reserves attributable to owners 1,399 1,318 1,230
T O TA L E Q U I T Y 1,399 1,318 1,230
Bond debt 968 967 970
Provision for deferred tax 4 5 4
Other provisions 8 3 4
Credit institutions 34 49 39
Lease liabilities 54 - -
Subordinated loan from Polen Invest A/S 70 90 70
Deferred income 8 9 8
L O N G -T E R M L I A B I L I T I E S 1,140 1,123 1,095
Credit institutions 111 156 131
Subordinated loan from Polen Invest A/S 22 18 24
Trade payables 94 74 93
Other provisions 1 1 1
Other payables 65 54 53
Deferred income 2 5 3
S H O R T-T E R M L I A B I L I T I E S 294 308 305
Liabilities of disposal group classified as held for sale - 70 -
L I A B I L I T I E S 1,440 1,501 1,400
L I A B I L I T I E S A N D E Q U I T Y 2,839 2,819 2,630

Page 15G O O D V A L L E Y • Q 2 2 0 1 9 I N T E R I M R E P O R T
Statement of changes in equity
H 1 2 0 1 9D K K M I L L I O N S H A R E
C A P I TA LR E S E R V E F O R E X C H A N G E
A D J U S T M E N T S R E TA I N E D E A R N I N G S E Q U I T Y O W N E R S T O TA L
E Q U I T Y
E Q U I T Y A T 1 J A N U A R Y 2 0 1 9 538 (548) 1,240 1,230 1,230
Net profit for the period - - 92 92 92
Other comprehensive income - 77 - 77 77
C O M P R E H E N S I V E I N C O M E F O R T H E P E R I O D - 77 92 169 169
E Q U I T Y AT 3 0 J U N E 2 0 1 9 538 (471) 1,332 1,399 1,399
H 1 2 0 1 8D K K M I L L I O N S H A R E
C A P I TA LR E S E R V E F O R E X C H A N G E
A D J U S T M E N T S R E TA I N E D E A R N I N G S E Q U I T Y O W N E R S T O TA L
E Q U I T Y
E Q U I T Y A T 1 J A N U A R Y 2 0 1 8 538 (491) 1,218 1,265 1,265
Net profit for the year - - 88 88 88
Other comprehensive income/ (loss) - (35) - (35) (35)
C O M P R E H E N S I V E I N C O M E F O R T H E Y E A R - (35) 88 53 53
E Q U I T Y AT 3 0 J U N E 2 0 1 8 538 (526) 1,306 1,318 1,318
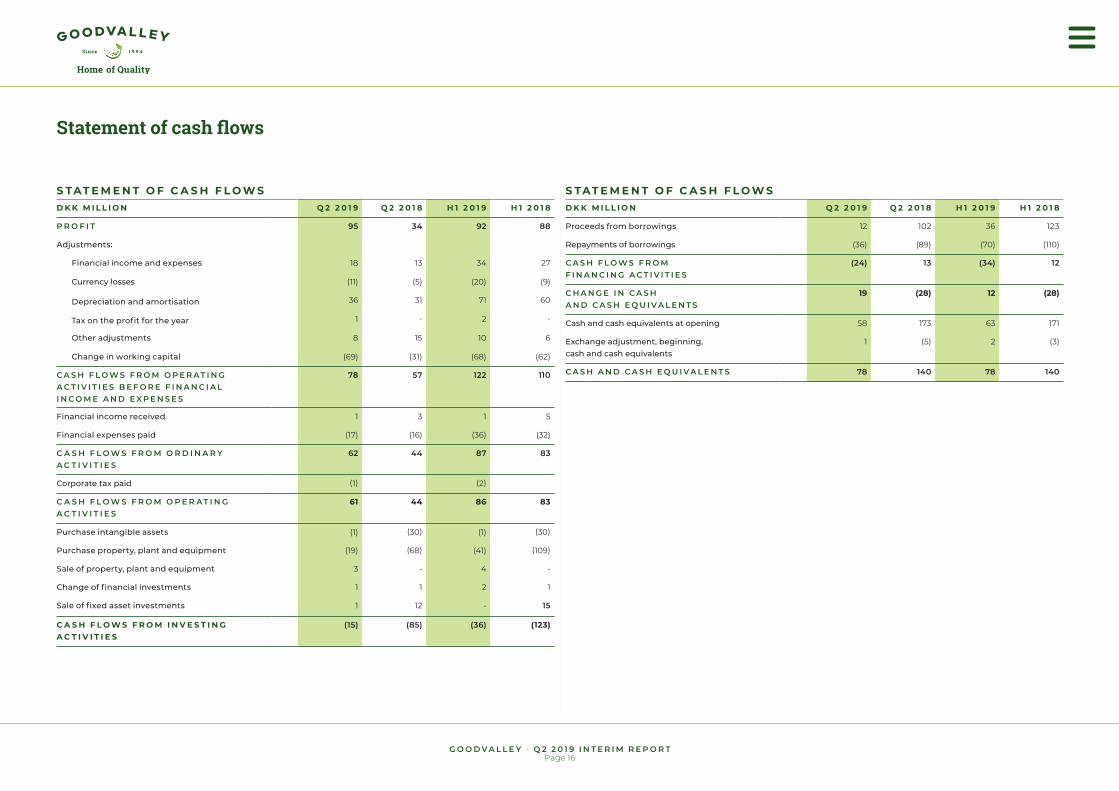
Page 16G O O D V A L L E Y • Q 2 2 0 1 9 I N T E R I M R E P O R T
S TAT E M E N T O F C A S H F L O W SD K K M I L L I O N Q 2 2 0 1 9 Q 2 2 0 1 8 H 1 2 0 1 9 H 1 2 0 1 8
P R O F I T 95 34 92 88
Adjustments:
Financial income and expenses 18 13 34 27
Currency losses (11) (5) (20) (9)
Depreciation and amortisation 36 31 71 60
Tax on the profit for the year 1 - 2 -
Other adjustments 8 15 10 6
Change in working capital (69) (31) (68) (62)
C A S H F L O W S F R O M O P E R A T I N G A C T I V I T I E S B E F O R E F I N A N C I A L I N C O M E A N D E X P E N S E S
78 57 122 110
Financial income received 1 3 1 5
Financial expenses paid (17) (16) (36) (32)
C A S H F L O W S F R O M O R D I N A R Y A C T I V I T I E S
62 44 87 83
Corporate tax paid (1) (2)
C A S H F L O W S F R O M O P E R AT I N G A C T I V I T I E S
61 44 86 83
Purchase intangible assets (1) (30) (1) (30)
Purchase property, plant and equipment (19) (68) (41) (109)
Sale of property, plant and equipment 3 - 4 -
Change of financial investments 1 1 2 1
Sale of fixed asset investments 1 12 - 15
C A S H F L O W S F R O M I N V E S T I N G A C T I V I T I E S
(15) (85) (36) (123)
S TAT E M E N T O F C A S H F L O W SD K K M I L L I O N Q 2 2 0 1 9 Q 2 2 0 1 8 H 1 2 0 1 9 H 1 2 0 1 8
Proceeds from borrowings 12 102 36 123
Repayments of borrowings (36) (89) (70) (110)
C A S H F L O W S F R O M F I N A N C I N G A C T I V I T I E S
(24) 13 (34) 12
C H A N G E I N C A S H A N D C A S H E Q U I V A L E N T S
19 (28) 12 (28)
Cash and cash equivalents at opening 58 173 63 171
Exchange adjustment, beginning, cash and cash equivalents
1 (5) 2 (3)
C A S H A N D C A S H E Q U I VA L E N T S 78 140 78 140
Statement of cash flows

Page 17G O O D V A L L E Y • Q 2 2 0 1 9 I N T E R I M R E P O R T
G R O S S P R O F I T F U L LY S P L I T B Y N AT U R E :D K K M I L L I O N H 1 2 0 1 9 H 1 2 0 1 8
G R O S S P R O F I T F U L LY S P L I T B Y N A T U R E :
Gross profit reported 225 226
Staff expenses 94 110
SG&A (26) (28)
Gross profit by nature 293 308
I N C O M E S T A T E M E N T S P L I T B Y F U N C T I O N S ( D E P R E C I A T I O N A N D A M O R T I S A T I O N ) :
Total income 898 856
Cost of goods sold including depreciation and amortisation
(736) (686)
G R O S S P R O F I T 162 170
Other operating items - -
SG&A, including depreciation and amortisation (56) (60)
E B I T 106 110
D E P R E C I A T I O N A N D A M O R T I S A T I O N
Amortisation of intangible assets (1) -
Depreciation of tangible assets (70) (60)
T O T A L D E P R E C I A T I O N A N D A M O R T I S A T I O N
(71) (60)
D E P R E C I A T I O N A N D A M O R T I S A T I O N
Cost of goods sold (65) (56)
Sales and administrative costs (6) (4)
T O TA L D E P R E C I AT I O N A N D A M O R T I S AT I O N
(71) (60)
L E A S E L I A B I L I T I E S 3 1 D E C E M B E R 2 0 1 8 A S D I S C L O S E D I N T H E A N N U A L R E P O R T 2 0 1 8
1 6 3
Short-term leases (less than 12 months) (38)
Leases of a low value (15)
Discounting (51)
L E A S E L I A B I L I T I E S R E C O G N I S E D AT 1 J A N U A R Y 2 0 1 9
59
Note 1 - Accounting principlesThis interim financial report is prepared in accordance with IAS 34 ”Interim Financial Reporting” as adopted by the EU and additional Danish disclosure requirements for interim reports of listed companies.
The accounting policies are unchanged from those applied in the Annual Report for 2018, to which reference is made, except for the effect of implementation of IFRS 16. The effects of transitioning to IFRS 16 are described below.
IMPACT OF NEW ACCOUNTING STANDARDS IN 2019 IFRS 16 IFRS 16 replaces IAS 17 Leases, and sets out the principles for the recognition, measurement, presentation and disclosure of leases and will result in almost all leases being recognised on the balance sheet by lessees, as the distinction between operat-ing and finance leases is removed. Under this new standard, an asset (the right to use the leased item) and a financial liability to make lease payments are recognized for all leases with a term of more than 12 months unless the leased asset is of low value. Accordingly, the Group’s leases were recognised in the balance sheet at 1 January 2019 in the form of right of use assets and lease liabilities.
As regards the income statement, IFRS 16 implementation has resulted in lease expenses being replaced by depreciation of right of use assets and interest on lease liabilities.
The recognition of lease assets and lease liabilities, respectively, resulted in an increase of the Group's total assets and liabilities of DKK 59 million at 1 January 2019. The amount is specified below.
Based on the current lease composition, IFRS 16 implementation will mean that annual leasing expenses of DKK 13 million are replaced by depreciation of DKK 10 million and interest of DKK 5 million in 2019. Implementation will thus increase EBITDA with DKK 13 million and decrease pre-tax profit by DKK 2 million for the full financial year.
The Group’s key figures and financial ratios are also affected by capitalisation of leases under IFRS 16. Invested capital and net interest-bearing debt both increased by DKK 59 million at 1 January 2019, and based on the current composition of leases, implementation is expected to reduce the return on invested capital (ROIC) by about 0.2 of a percentage point, the equity ratio by about 1.1 percentage points and improve the NIBD/Adjusted EBITDA LTM by around 0.1.
Any new leases entered into in 2019 will be recognised as ad-ditions of right of use assets and lease liabilities, respectively, which will enhance the effect on the above-mentioned account-ing items and ratios in 2019.
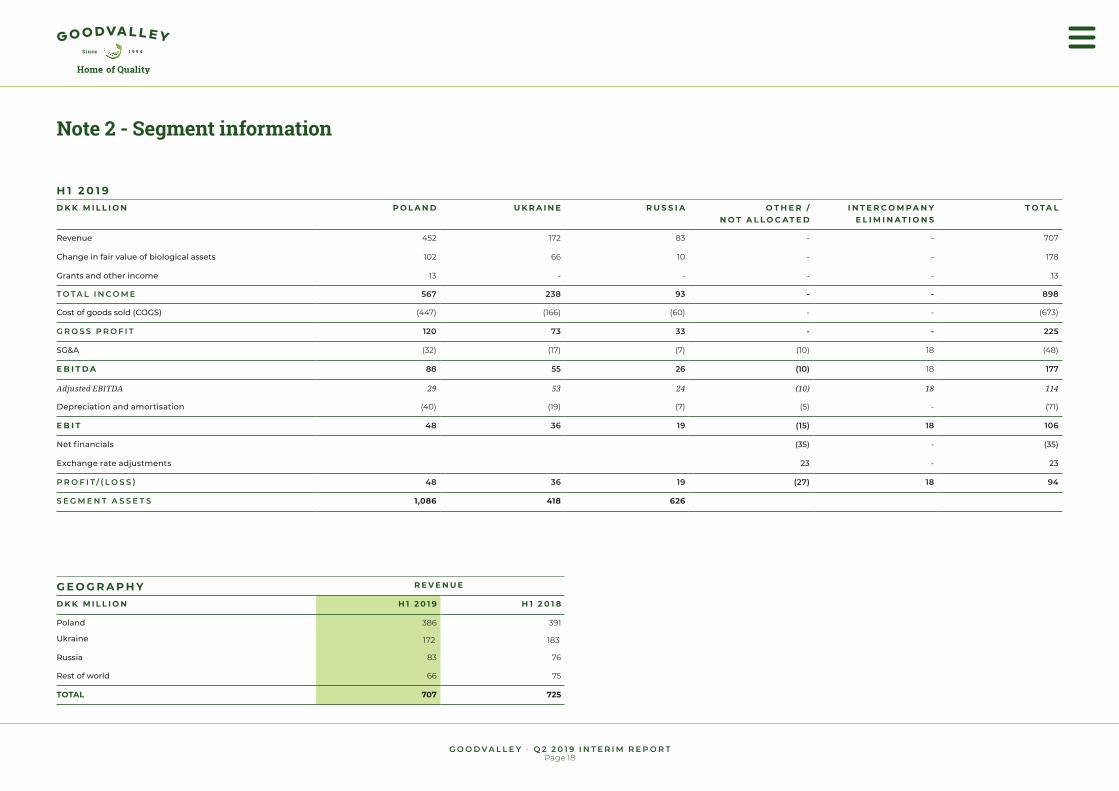
G E O G R A P H Y R E V E N U E
D K K M I L L I O N H 1 2 0 1 9 H 1 2 0 1 8
Poland 386 391
Ukraine 172 183
Russia 83 76
Rest of world 66 75
TOTAL 707 725
Page 18G O O D V A L L E Y • Q 2 2 0 1 9 I N T E R I M R E P O R T
Note 2 - Segment information
H 1 2 0 1 9D K K M I L L I O N P O L A N D U K R A I N E R U S S I A O T H E R /
N O T A L L O C AT E DI N T E R C O M P A N Y
E L I M I N AT I O N ST O TA L
Revenue 452 172 83 - - 707
Change in fair value of biological assets 102 66 10 - - 178
Grants and other income 13 - - - - 13
T O T A L I N C O M E 567 238 93 - - 898
Cost of goods sold (COGS) (447) (166) (60) - - (673)
G R O S S P R O F I T 120 73 33 - - 225
SG&A (32) (17) (7) (10) 18 (48)
E B I T D A 88 55 26 (10) 18 177
Adjusted EBITDA 29 53 24 (10) 18 114
Depreciation and amortisation (40) (19) (7) (5) - (71)
E B I T 48 36 19 (15) 18 106
Net financials (35) - (35)
Exchange rate adjustments 23 - 23
P R O F I T / ( L O S S ) 48 36 19 (27) 18 94
S E G M E N T A S S E T S 1,086 418 626

Page 19G O O D V A L L E Y • Q 2 2 0 1 9 I N T E R I M R E P O R T
Note 2 - Segment information
H 1 2 0 1 8D K K M I L L I O N P O L A N D U K R A I N E R U S S I A O T H E R /
N O T A L L O C AT E DI N T E R C O M P A N Y
E L I M I N AT I O N ST O TA L
Revenue 466 183 76 - - 725
Change in fair value of biological assets 50 58 14 - - 122
Grants and other income 8 - 1 - - 9
T O T A L I N C O M E 524 241 91 - - 856
Cost of goods sold (COGS) (435) (148) (47) - - (630)
G R O S S P R O F I T 89 93 44 - - 226
SG&A (26) (15) (8) (21) 14 (56)
E B I T D A 63 78 36 (21) 14 170
Adjusted EBITDA 54 78 31 (21) 14 156
Depreciation and amortisation (38) (15) (7) - - (60)
E B I T 25 63 29 (21) 14 110
Net financials (29) - (29)
Exchange rate adjustments 11 - 11
P R O F I T / ( L O S S ) 25 63 29 (39) 14 92
S E G M E N T A S S E T S 1,089 304 411

Page 20G O O D V A L L E Y • Q 2 2 0 1 9 I N T E R I M R E P O R T
Note 2 - Segment information
Q 2 2 0 1 9D K K M I L L I O N P O L A N D U K R A I N E R U S S I A O T H E R /
N O T A L L O C AT E DI N T E R C O M P A N Y
E L I M I N AT I O N ST O TA L
Revenue 240 97 48 - - 385
Change in fair value of biological assets 74 51 (1) - - 125
Grants and other income 7 - 1 - - 8
T O T A L I N C O M E 321 149 48 - - 518
Cost of goods sold (COGS) (235) (91) (32) - - (359)
G R O S S P R O F I T 86 58 16 - - 160
SG&A (15) (9) (4) (2) 9 (21)
E B I T D A 71 48 12 (2) 9 139
Adjusted EBITDA 22 37 13 (2) 9 80
Depreciation and amortisation (20) (10) (4) (5) - (39)
E B I T 51 38 8 (7) 9 100
Net financials (18) - (18)
Exchange rate adjustments 13 - 13
P R O F I T / ( L O S S ) 51 38 8 (11) 9 95
Page 21G O O D V A L L E Y • Q 2 2 0 1 9 I N T E R I M R E P O R T
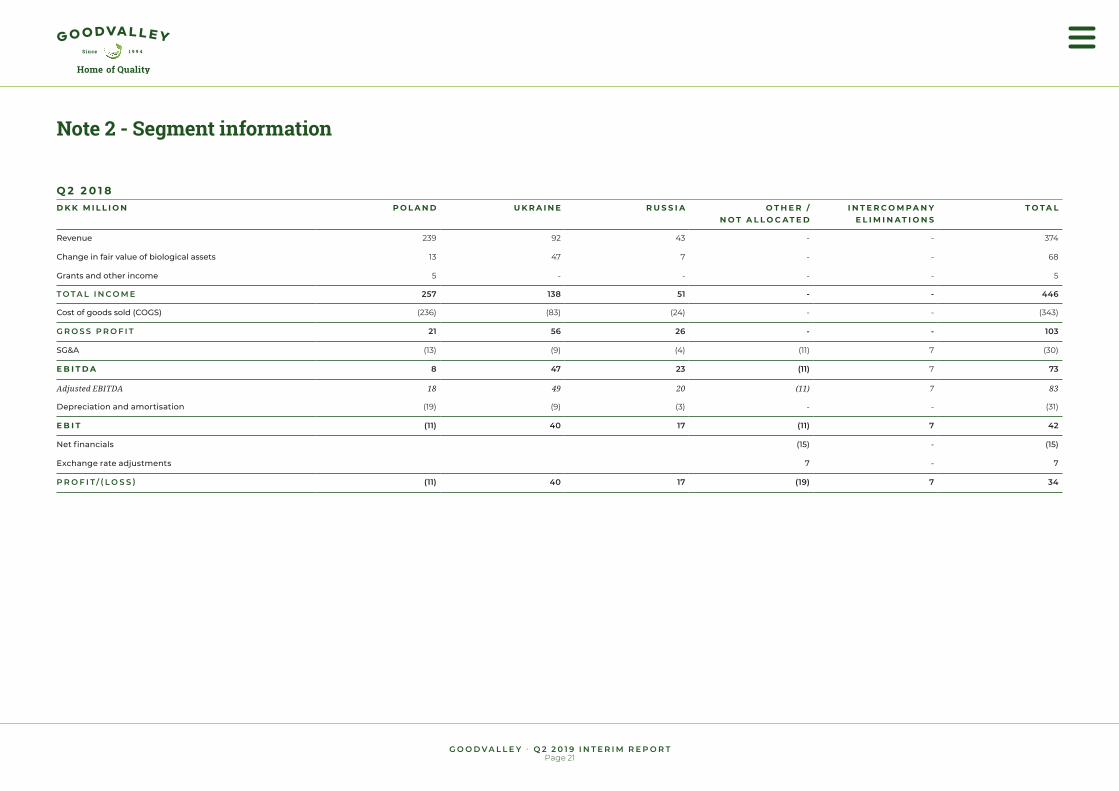
Note 2 - Segment information
Q 2 2 0 1 8D K K M I L L I O N P O L A N D U K R A I N E R U S S I A O T H E R /
N O T A L L O C AT E DI N T E R C O M P A N Y
E L I M I N AT I O N ST O TA L
Revenue 239 92 43 - - 374
Change in fair value of biological assets 13 47 7 - - 68
Grants and other income 5 - - - - 5
T O T A L I N C O M E 257 138 51 - - 446
Cost of goods sold (COGS) (236) (83) (24) - - (343)
G R O S S P R O F I T 21 56 26 - - 103
SG&A (13) (9) (4) (11) 7 (30)
E B I T D A 8 47 23 (11) 7 73
Adjusted EBITDA 18 49 20 (11) 7 83
Depreciation and amortisation (19) (9) (3) - - (31)
E B I T (11) 40 17 (11) 7 42
Net financials (15) - (15)
Exchange rate adjustments 7 - 7
P R O F I T / ( L O S S ) (11) 40 17 (19) 7 34
Page 22G O O D V A L L E Y • Q 2 2 0 1 9 I N T E R I M R E P O R T
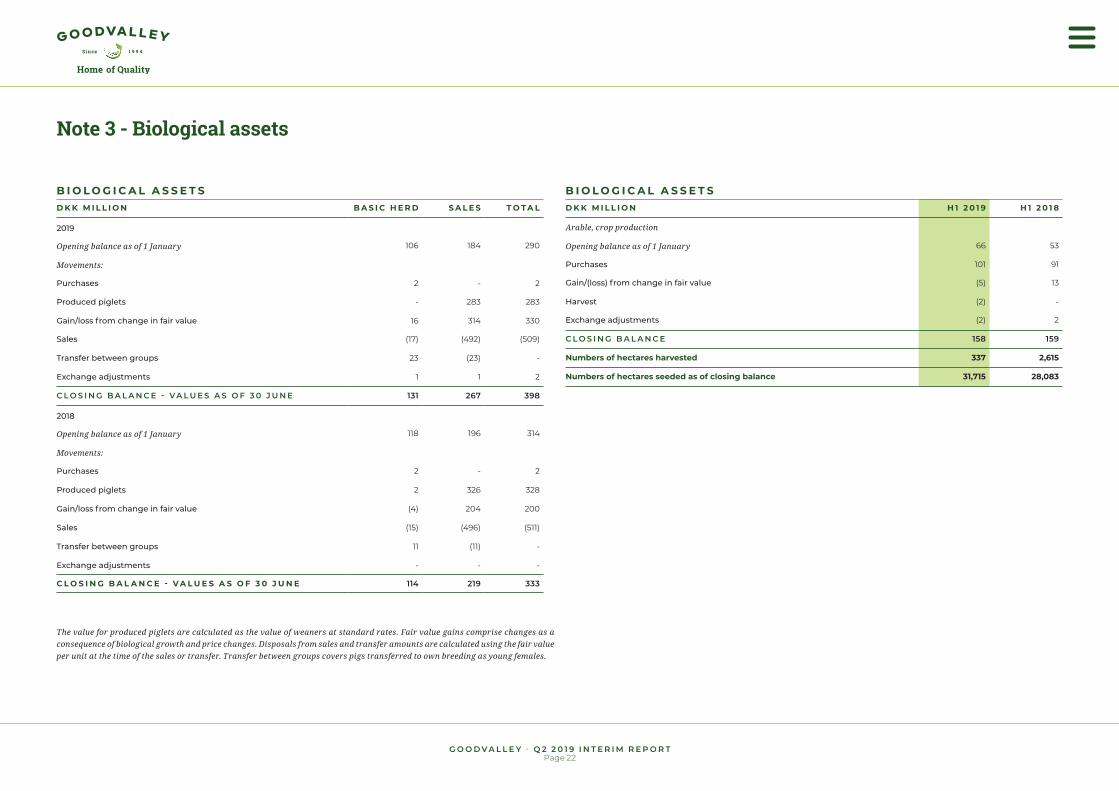
Note 3 - Biological assets
B I O L O G I C A L A S S E T SD K K M I L L I O N B A S I C H E R D S A L E S T O TA L
2019
Opening balance as of 1 January 106 184 290
Movements:
Purchases 2 - 2
Produced piglets - 283 283
Gain/loss from change in fair value 16 314 330
Sales (17) (492) (509)
Transfer between groups 23 (23) -
Exchange adjustments 1 1 2
C L O S I N G B A L A N C E - VA L U E S A S O F 3 0 J U N E 131 267 398
2018
Opening balance as of 1 January 118 196 314
Movements:
Purchases 2 - 2
Produced piglets 2 326 328
Gain/loss from change in fair value (4) 204 200
Sales (15) (496) (511)
Transfer between groups 11 (11) -
Exchange adjustments - - -
C L O S I N G B A L A N C E - V A L U E S A S O F 3 0 J U N E 114 219 333
B I O L O G I C A L A S S E T SD K K M I L L I O N H 1 2 0 1 9 H 1 2 0 1 8
Arable, crop production
Opening balance as of 1 January 66 53
Purchases 101 91
Gain/(loss) from change in fair value (5) 13
Harvest (2) -
Exchange adjustments (2) 2
C L O S I N G B A L A N C E 158 159
Numbers of hectares harvested 337 2,615
Numbers of hectares seeded as of closing balance 31,715 28,083
The value for produced piglets are calculated as the value of weaners at standard rates. Fair value gains comprise changes as a consequence of biological growth and price changes. Disposals from sales and transfer amounts are calculated using the fair value per unit at the time of the sales or transfer. Transfer between groups covers pigs transferred to own breeding as young females.
Page 23G O O D V A L L E Y • Q 2 2 0 1 9 I N T E R I M R E P O R T
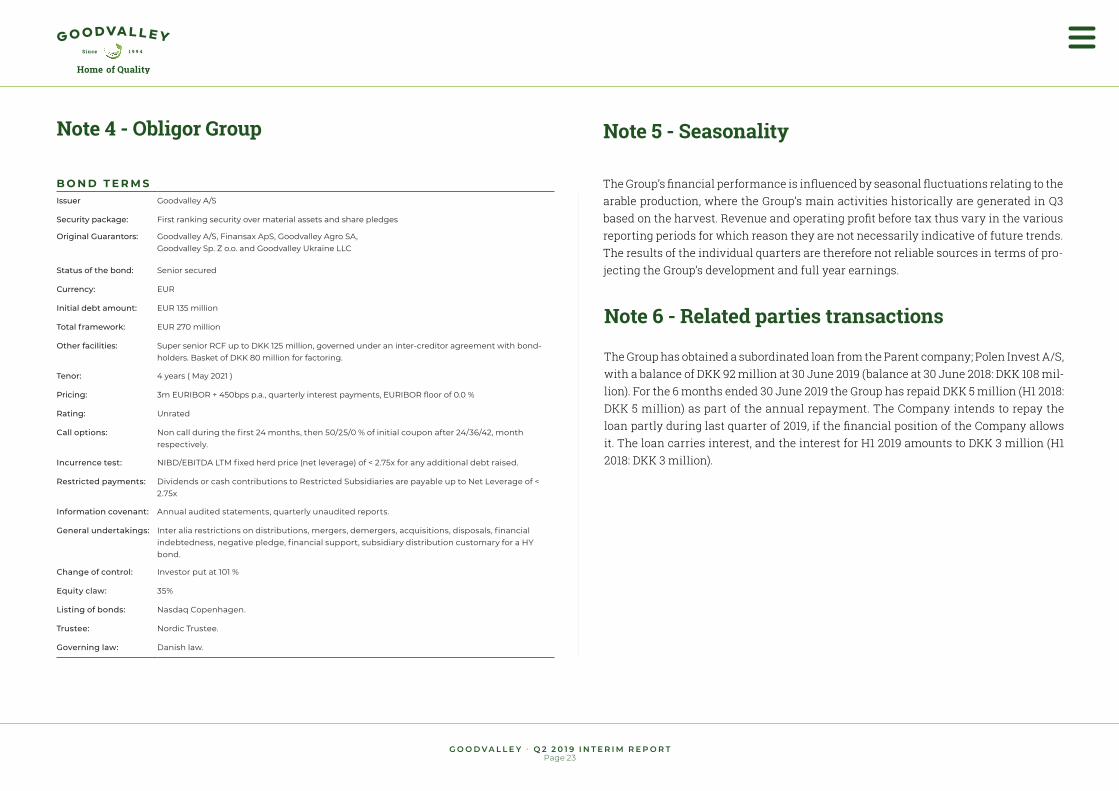
Note 4 - Obligor Group
B O N D T E R M SIssuer Goodvalley A/S
Security package: First ranking security over material assets and share pledges
Original Guarantors: Goodvalley A/S, Finansax ApS, Goodvalley Agro SA, Goodvalley Sp. Z o.o. and Goodvalley Ukraine LLC
Status of the bond: Senior secured
Currency: EUR
Initial debt amount: EUR 135 million
Total framework: EUR 270 million
Other facilities: Super senior RCF up to DKK 125 million, governed under an inter-creditor agreement with bond-holders. Basket of DKK 80 million for factoring.
Tenor: 4 years ( May 2021 )
Pricing: 3m EURIBOR + 450bps p.a., quarterly interest payments, EURIBOR floor of 0.0 %
Rating: Unrated
Call options: Non call during the first 24 months, then 50/25/0 % of initial coupon after 24/36/42, month respectively.
Incurrence test: NIBD/EBITDA LTM fixed herd price (net leverage) of < 2.75x for any additional debt raised.
Restricted payments: Dividends or cash contributions to Restricted Subsidiaries are payable up to Net Leverage of < 2.75x
Information covenant: Annual audited statements, quarterly unaudited reports.
General undertakings: Inter alia restrictions on distributions, mergers, demergers, acquisitions, disposals, financial indebtedness, negative pledge, financial support, subsidiary distribution customary for a HY bond.
Change of control: Investor put at 101 %
Equity claw: 35%
Listing of bonds: Nasdaq Copenhagen.
Trustee: Nordic Trustee.
Governing law: Danish law.
The Group has obtained a subordinated loan from the Parent company; Polen Invest A/S, with a balance of DKK 92 million at 30 June 2019 (balance at 30 June 2018: DKK 108 mil-lion). For the 6 months ended 30 June 2019 the Group has repaid DKK 5 million (H1 2018: DKK 5 million) as part of the annual repayment. The Company intends to repay the loan partly during last quarter of 2019, if the financial position of the Company allows it. The loan carries interest, and the interest for H1 2019 amounts to DKK 3 million (H1 2018: DKK 3 million).
Note 6 - Related parties transactions
The Group’s financial performance is influenced by seasonal fluctuations relating to the arable production, where the Group’s main activities historically are generated in Q3 based on the harvest. Revenue and operating profit before tax thus vary in the various reporting periods for which reason they are not necessarily indicative of future trends. The results of the individual quarters are therefore not reliable sources in terms of pro-jecting the Group’s development and full year earnings.
Note 5 - Seasonality
Page 24G O O D V A L L E Y • Q 2 2 0 1 9 I N T E R I M R E P O R T
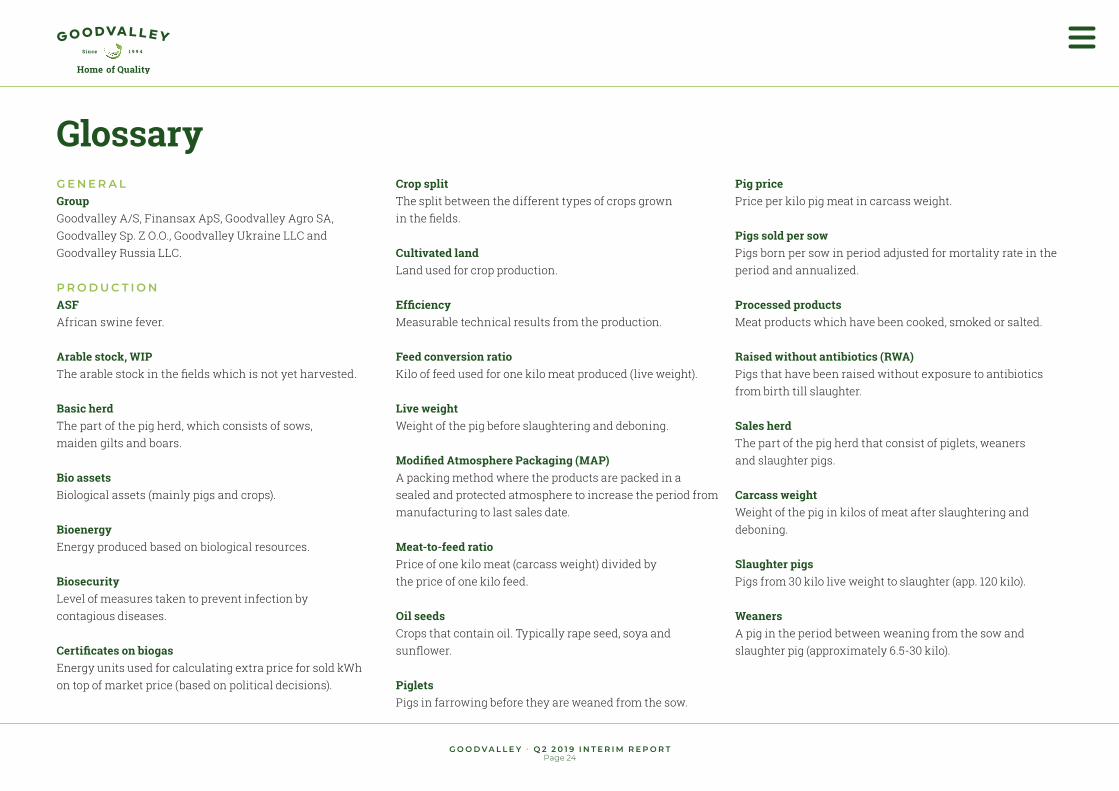
G E N E R A LGroupGoodvalley A/S, Finansax ApS, Goodvalley Agro SA, Goodvalley Sp. Z O.O., Goodvalley Ukraine LLC and Goodvalley Russia LLC.
P R O D U C T I O NASFAfrican swine fever.
Arable stock, WIPThe arable stock in the fields which is not yet harvested.
Basic herdThe part of the pig herd, which consists of sows, maiden gilts and boars.
Bio assetsBiological assets (mainly pigs and crops).
BioenergyEnergy produced based on biological resources.
BiosecurityLevel of measures taken to prevent infection by contagious diseases.
Certificates on biogasEnergy units used for calculating extra price for sold kWh on top of market price (based on political decisions).
Crop splitThe split between the different types of crops grown in the fields.
Cultivated landLand used for crop production.
EfficiencyMeasurable technical results from the production.
Feed conversion ratioKilo of feed used for one kilo meat produced (live weight).
Live weightWeight of the pig before slaughtering and deboning.
Modified Atmosphere Pack aging (MAP)A packing method where the products are packed in a sealed and protected atmosphere to increase the period from manufacturing to last sales date.
Meat-to-feed ratioPrice of one kilo meat (carcass weight) divided by the price of one kilo feed. Oil seedsCrops that contain oil. Typically rape seed, soya and sunflower. PigletsPigs in farrowing before they are weaned from the sow.
Pig price Price per kilo pig meat in carcass weight.
Pigs sold per sowPigs born per sow in period adjusted for mortality rate in the period and annualized.
Processed productsMeat products which have been cooked, smoked or salted.
Raised without antibiotics (RWA)Pigs that have been raised without exposure to antibiotics from birth till slaughter.
Sales herdThe part of the pig herd that consist of piglets, weaners and slaughter pigs.
Carcass weightWeight of the pig in kilos of meat after slaughtering and deboning.
Slaughter pigsPigs from 30 kilo live weight to slaughter (app. 120 kilo).
WeanersA pig in the period between weaning from the sow and slaughter pig (approximately 6.5-30 kilo).
Glossary
We work for a better tomorrow
This annual report was released through Nasdaq Copenhagen as company announcement no. 12/2019.
All trademarks such as trade names and other names and designations highlighted in this report are trademarks protected and owned by Goodvalley A/S.
© 2019 Goodvalley A/S