Interim report Q1 2019 · Q1 2018 Q3 2018 Q1 2019 DKKm 0 20 40 60 80 100 Q1 2017 Q3 2017 Q1 2018 Q3...
22
Interim report Q1 2019
Transcript of Interim report Q1 2019 · Q1 2018 Q3 2018 Q1 2019 DKKm 0 20 40 60 80 100 Q1 2017 Q3 2017 Q1 2018 Q3...
Interim report Q1 2019
Management report3 Q1 2019 highlights
4 Key figures and financial ratios
5 Developments in Q1 2019
8 Outlook
9 Risk
10 Hyperinflation in Argentina
11 Management statement
21 Hartmann at a glance
Financial statements13 Statement of comprehensive income
14 Statement of cash flows
15 Balance sheet
16 Statement of changes in equity
17 Notes
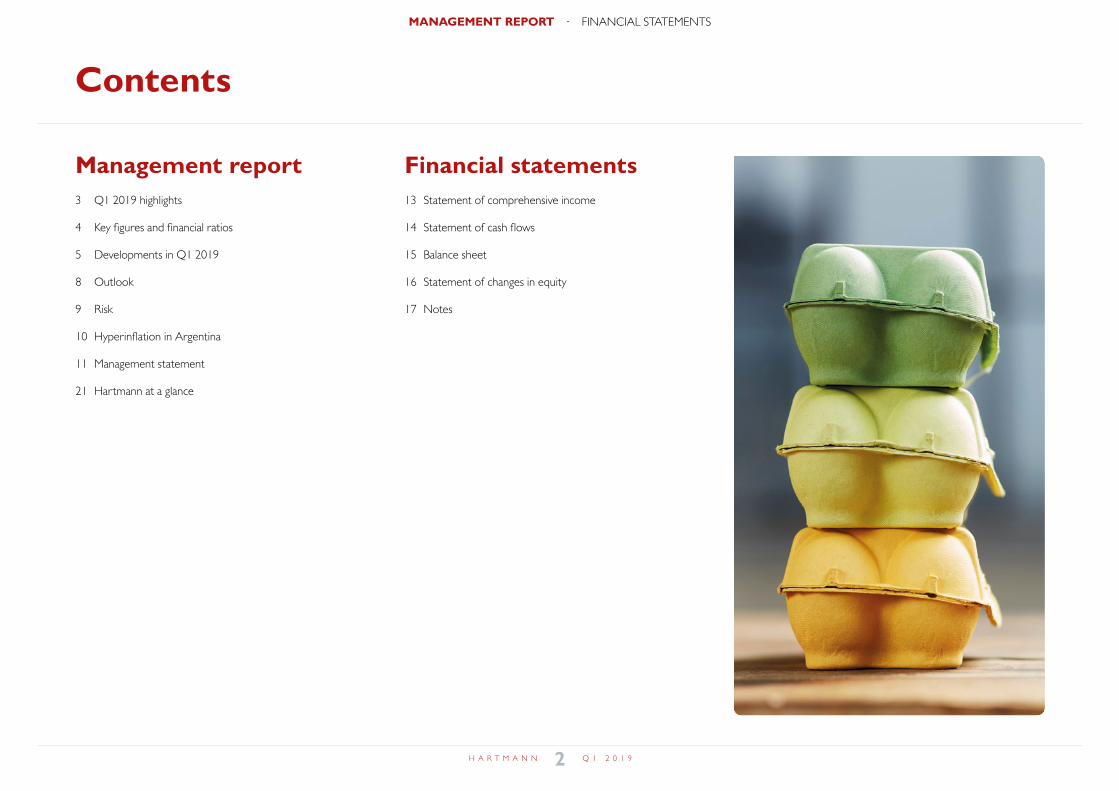
Contents
2H A R T M A N N Q 1 2 0 1 9
MANAGEMENT REPORT · FINANCIAL STATEMENTS
indholdsfortegnelse
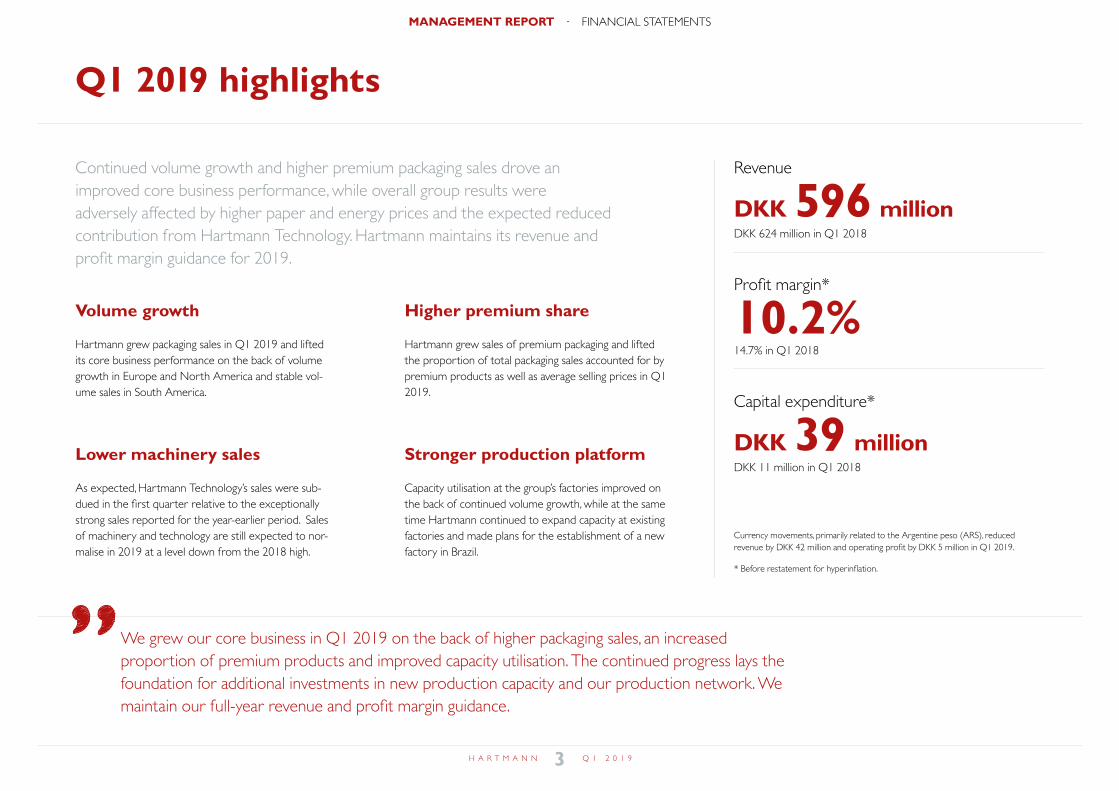
Q1 2019 highlights
Continued volume growth and higher premium packaging sales drove an improved core business performance, while overall group results were adversely affected by higher paper and energy prices and the expected reduced contribution from Hartmann Technology. Hartmann maintains its revenue and profit margin guidance for 2019.
Volume growth
Hartmann grew packaging sales in Q1 2019 and lifted its core business performance on the back of volume growth in Europe and North America and stable vol-ume sales in South America.
Lower machinery sales
As expected, Hartmann Technology’s sales were sub-dued in the first quarter relative to the exceptionally strong sales reported for the year-earlier period. Sales of machinery and technology are still expected to nor-malise in 2019 at a level down from the 2018 high.
Higher premium share
Hartmann grew sales of premium packaging and lifted the proportion of total packaging sales accounted for by premium products as well as average selling prices in Q1 2019.
Stronger production platform
Capacity utilisation at the group’s factories improved on the back of continued volume growth, while at the same time Hartmann continued to expand capacity at existing factories and made plans for the establishment of a new factory in Brazil.
Revenue
DKK 624 million in Q1 2018
DKK 596 million
Capital expenditure*
DKK 39 million
Profit margin*
14.7% in Q1 2018
10.2%
DKK 11 million in Q1 2018
Currency movements, primarily related to the Argentine peso (ARS), reduced revenue by DKK 42 million and operating profit by DKK 5 million in Q1 2019.
* Before restatement for hyperinflation.
We grew our core business in Q1 2019 on the back of higher packaging sales, an increased proportion of premium products and improved capacity utilisation. The continued progress lays the foundation for additional investments in new production capacity and our production network. We maintain our full-year revenue and profit margin guidance.
3H A R T M A N N Q 1 2 0 1 9
MANAGEMENT REPORT · FINANCIAL STATEMENTS
kort fortalt
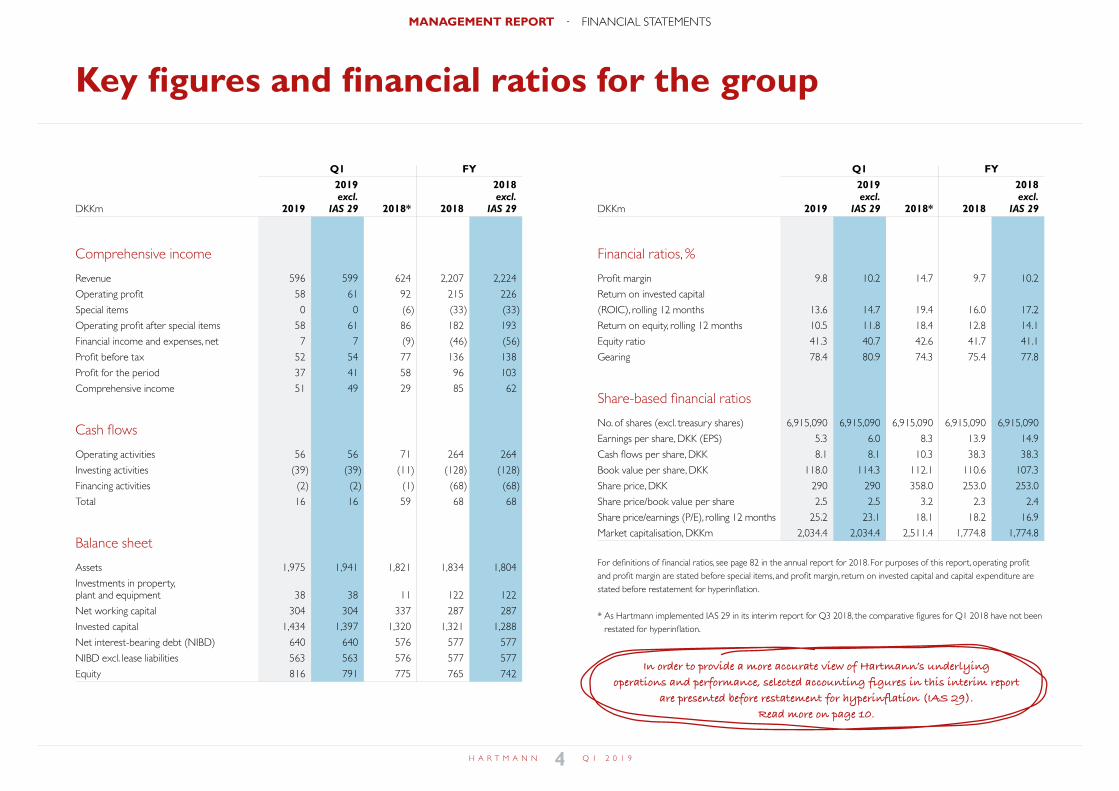
Q1 FY 2019 2018 excl. excl. DKKm 2019 IAS 29 2018* 2018 IAS 29
Comprehensive income
Revenue 596 599 624 2,207 2,224
Operating profit 58 61 92 215 226
Special items 0 0 (6) (33) (33)
Operating profit after special items 58 61 86 182 193
Financial income and expenses, net 7 7 (9) (46) (56)
Profit before tax 52 54 77 136 138
Profit for the period 37 41 58 96 103
Comprehensive income 51 49 29 85 62
Cash flows
Operating activities 56 56 71 264 264
Investing activities (39) (39) (11) (128) (128)
Financing activities (2) (2) (1) (68) (68)
Total 16 16 59 68 68
Balance sheet
Assets 1,975 1,941 1,821 1,834 1,804
Investments in property, plant and equipment 38 38 11 122 122
Net working capital 304 304 337 287 287
Invested capital 1,434 1,397 1,320 1,321 1,288
Net interest-bearing debt (NIBD) 640 640 576 577 577
NIBD excl. lease liabilities 563 563 576 577 577
Equity 816 791 775 765 742
Q1 FY 2019 2018 excl. excl. DKKm 2019 IAS 29 2018* 2018 IAS 29
Financial ratios, %
Profit margin 9.8 10.2 14.7 9.7 10.2
Return on invested capital
(ROIC), rolling 12 months 13.6 14.7 19.4 16.0 17.2
Return on equity, rolling 12 months 10.5 11.8 18.4 12.8 14.1
Equity ratio 41.3 40.7 42.6 41.7 41.1
Gearing 78.4 80.9 74.3 75.4 77.8
Share-based financial ratios
No. of shares (excl. treasury shares) 6,915,090 6,915,090 6,915,090 6,915,090 6,915,090
Earnings per share, DKK (EPS) 5.3 6.0 8.3 13.9 14.9
Cash flows per share, DKK 8.1 8.1 10.3 38.3 38.3
Book value per share, DKK 118.0 114.3 112.1 110.6 107.3
Share price, DKK 290 290 358.0 253.0 253.0
Share price/book value per share 2.5 2.5 3.2 2.3 2.4
Share price/earnings (P/E), rolling 12 months 25.2 23.1 18.1 18.2 16.9
Market capitalisation, DKKm 2,034.4 2,034.4 2,511.4 1,774.8 1,774.8
For definitions of financial ratios, see page 82 in the annual report for 2018. For purposes of this report, operating profit and profit margin are stated before special items, and profit margin, return on invested capital and capital expenditure are stated before restatement for hyperinflation.
* As Hartmann implemented IAS 29 in its interim report for Q3 2018, the comparative figures for Q1 2018 have not been restated for hyperinflation.
Key figures and financial ratios for the group
In order to provide a more accurate view of Hartmann’s underlying operations and performance, selected accounting figures in this interim report
are presented before restatement for hyperinflation (IAS 29). Read more on page 10.
4H A R T M A N N Q 1 2 0 1 9
MANAGEMENT REPORT · FINANCIAL STATEMENTS
hoved nøgletal
Q12017
DKKm
Q32017
Q12018
Q32018
Q12019
0
150
300
450
600
750
%
0
4
8
12
16
20
Q12017
Q32017
Q12018
Q32018
Q12019
DKKm
0
20
40
60
80
100
Q12017
Q32017
Q12018
Q32018
Q12019
Developments in Q1 2019
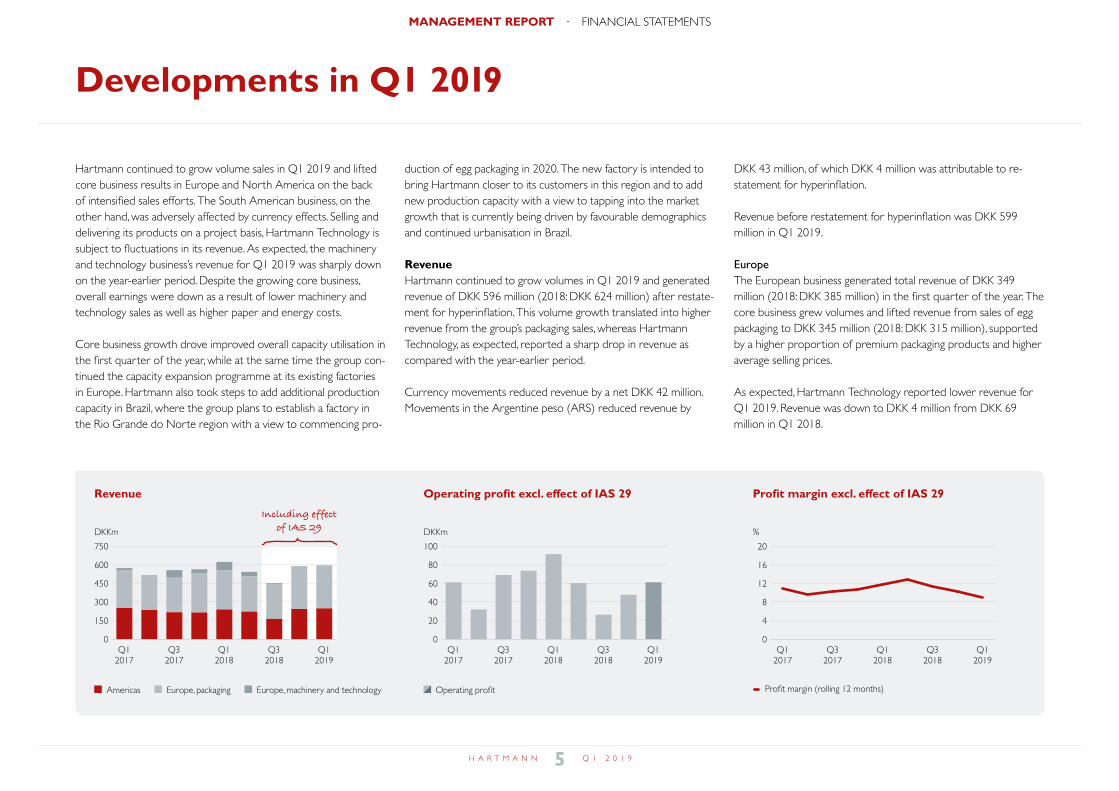
Hartmann continued to grow volume sales in Q1 2019 and lifted core business results in Europe and North America on the back of intensified sales efforts. The South American business, on the other hand, was adversely affected by currency effects. Selling and delivering its products on a project basis, Hartmann Technology is subject to fluctuations in its revenue. As expected, the machinery and technology business’s revenue for Q1 2019 was sharply down on the year-earlier period. Despite the growing core business, overall earnings were down as a result of lower machinery and technology sales as well as higher paper and energy costs.
Core business growth drove improved overall capacity utilisation in the first quarter of the year, while at the same time the group con-tinued the capacity expansion programme at its existing factories in Europe. Hartmann also took steps to add additional production capacity in Brazil, where the group plans to establish a factory in the Rio Grande do Norte region with a view to commencing pro-
duction of egg packaging in 2020. The new factory is intended to bring Hartmann closer to its customers in this region and to add new production capacity with a view to tapping into the market growth that is currently being driven by favourable demographics and continued urbanisation in Brazil.
RevenueHartmann continued to grow volumes in Q1 2019 and generated revenue of DKK 596 million (2018: DKK 624 million) after restate-ment for hyperinflation. This volume growth translated into higher revenue from the group’s packaging sales, whereas Hartmann Technology, as expected, reported a sharp drop in revenue as compared with the year-earlier period.
Currency movements reduced revenue by a net DKK 42 million. Movements in the Argentine peso (ARS) reduced revenue by
DKK 43 million, of which DKK 4 million was attributable to re-statement for hyperinflation.
Revenue before restatement for hyperinflation was DKK 599 million in Q1 2019.
EuropeThe European business generated total revenue of DKK 349 million (2018: DKK 385 million) in the first quarter of the year. The core business grew volumes and lifted revenue from sales of egg packaging to DKK 345 million (2018: DKK 315 million), supported by a higher proportion of premium packaging products and higher average selling prices.
As expected, Hartmann Technology reported lower revenue for Q1 2019. Revenue was down to DKK 4 million from DKK 69 million in Q1 2018.
Americas Europe, packaging Europe, machinery and technology Operating profit Profit margin (rolling 12 months)
Including effect of IAS 29
Revenue Operating profit excl. effect of IAS 29 Profit margin excl. effect of IAS 29
5H A R T M A N N Q 1 2 0 1 9
MANAGEMENT REPORT · FINANCIAL STATEMENTS
udviklingen
AmericasThe business in the Americas grew sales of egg and fruit packaging in the first quarter of the year and lifted revenue to DKK 248 million (2018: DKK 239 million) in the face of significant adverse currency effects and a moderate negative effect of restatement for hyperinflation in Argentina.
The North American business reported volume and revenue growth driven by increased sales of both standard and premium products and positive currency effects in Q1 2019.
In South America, packaging sales were stable in the first quarter, but revenue declined due to significant adverse currency effects and restatement for hyperinflation. In Argentina, volume sales of egg and fruit packaging continued uphill, while sales of egg packag-ing in Brazil were slightly down due to lower egg prices causing a shift in sales from retail packaging to cheaper packaging types.
Q1 2019 revenue from the Americas came to DKK 250 million before restatement for hyperinflation.
Operating profitOperating profit for the first quarter came to DKK 61 million (2018: DKK 92 million) before restatement for hyperinflation, for a profit margin of 10.2% (2018: 14.7%). The decline was driven by the lower contribution from Hartmann Technology in combination with higher paper and energy prices and currency movements. These factors were not outweighed by volume growth and higher average selling prices.
Currency fluctuations reduced operating profit before restate-ment for hyperinflation by a net DKK 5 million in Q1 2019.
Movements in ARS affected operating profit by a negative DKK 7 million.
After restatement for hyperinflation, Q1 operating profit came to DKK 58 million, for a profit margin of 9.8%.
EuropeThe European business reported operating profit down to DKK 34 million (2018: DKK 61 million), for a profit margin of 9.7% (2018: 16.0%), due to a sharp decline in Hartmann Technology’s revenue compared with Q1 2018, during which period the main part of 2018 revenue from sales of machinery and technology was generated. Operating profit was also impacted by higher paper and energy prices, whereas volume and revenue growth in the core business and higher average selling prices supported the Q1 2019 operating performance in Europe.
AmericasOperating profit from the Americas totalled DKK 34 million before restatement for hyperinflation (2018: DKK 35 million), for a profit margin of 13.5% (2018: 14.6%).
In North America, operating profit grew on the back of volume growth, a higher proportion of premium packaging, improved capacity utilisation and favourable currency effects. Raw materials and production costs were relatively stable in Q1 2019.
The South American business reported a decline in operating profit before restatement for hyperinflation due to significant adverse currency movements in Argentina and a lower revenue contribution from the Brazilian activities. Moreover, production costs increased as a result of higher paper and raw materials prices.
After restatement for hyperinflation, Q1 operating profit from the Americas came to DKK 31 million, for a profit margin of 12.6%.
Corporate functionsCosts related to corporate functions came to DKK 7 million in the first quarter of 2019 (2018: DKK 5 million).
Special itemsNo special items were recognised in Q1 2019 (2018: net expense of DKK 6 million).
Financial income and expensesFinancial income and expenses for Q1 2019 were a net expense of DKK 7 million (2018: net expense of DKK 9 million).
Profit for the periodQ1 2019 profit before tax was DKK 52 million (2018: DKK 77 million).
Tax on the profit for the period was an expense of DKK 15 million (2018: expense of DKK 19 million), giving an effective tax rate of 29% (2018: 25%). The higher effective tax rate was attributable to hyperinflation restatement.
The profit for the period was DKK 37 million after tax (2018: DKK 58 million).
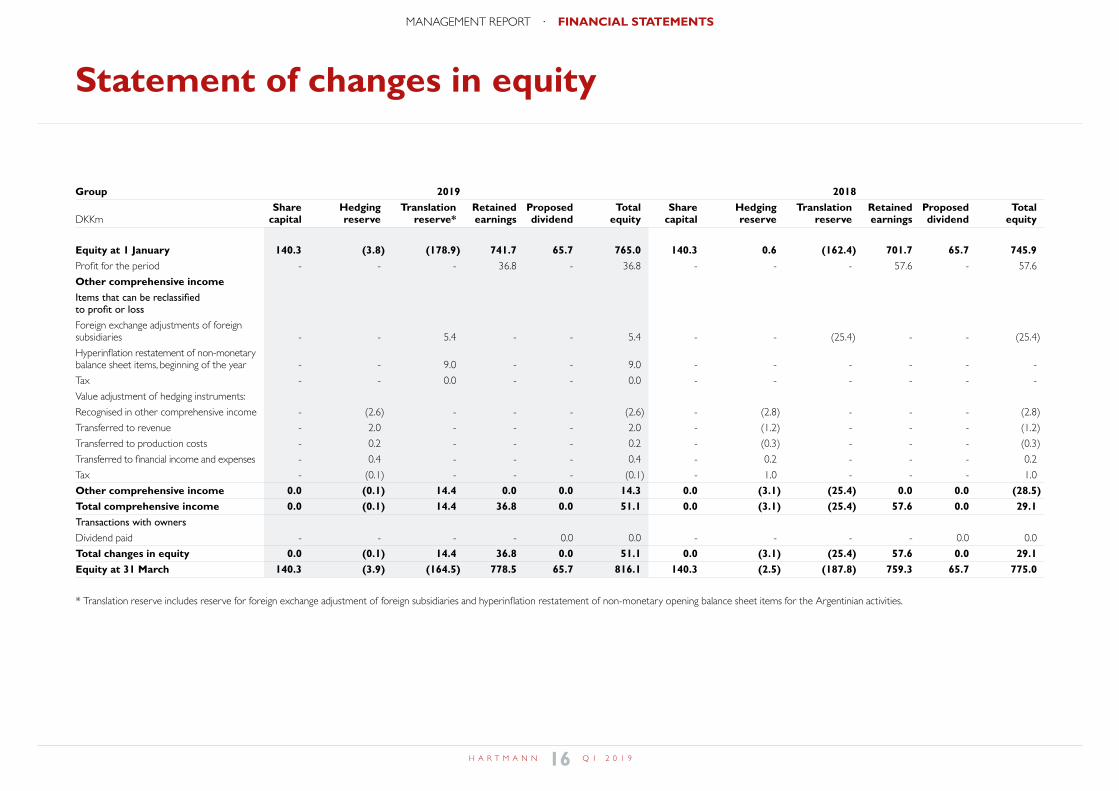
Comprehensive incomeComprehensive income was up to DKK 51 million in Q1 2019 (2018: DKK 29 million). Comprehensive income for Q1 2018 was impacted by significant foreign exchange adjustments of subsidiaries.
Developments in Q1 2019
6H A R T M A N N Q 1 2 0 1 9
MANAGEMENT REPORT · FINANCIAL STATEMENTS
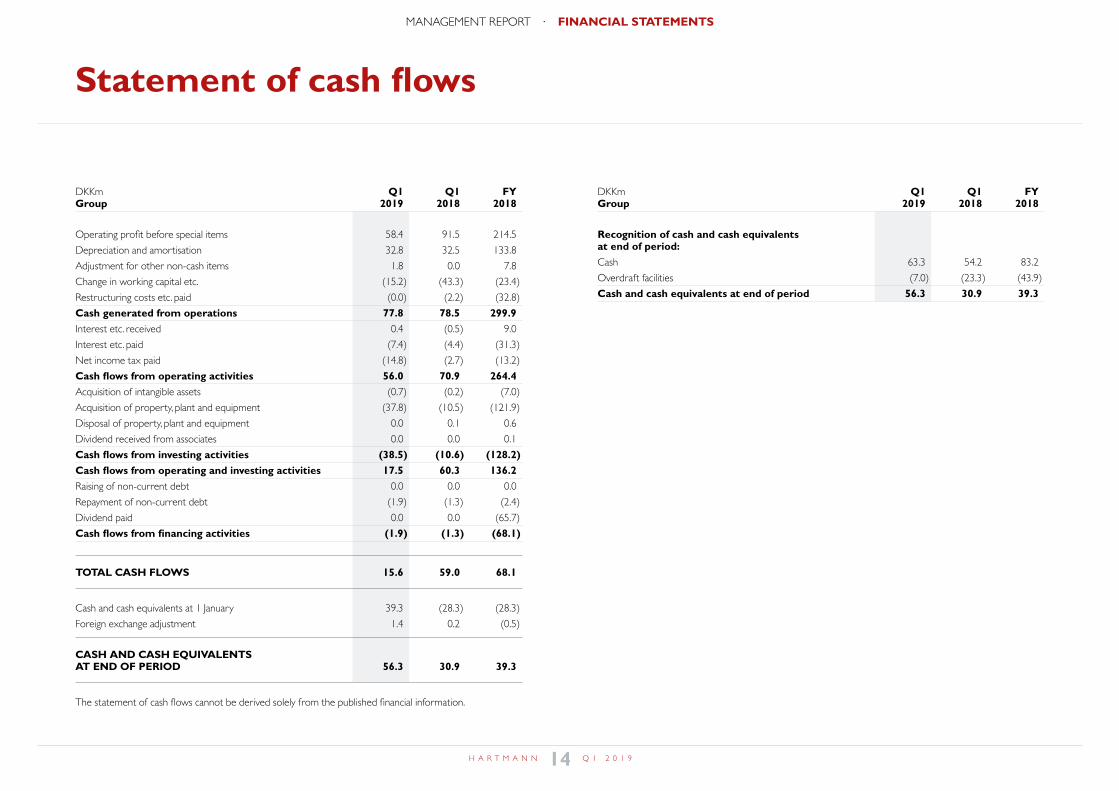
Cash flowsReflecting lower Q1 earnings, total cash flows from operating activities were a net inflow of DKK 56 million for the first quarter (2018: net inflow of DKK 71 million).
Cash flows from investing activities amounted to a net outflow of DKK 39 million (2018: net outflow of DKK 11 million), reflecting the group’s ongoing efforts to expand production capacity.
Cash flows from operating and investing activities amounted to a net inflow of DKK 18 million for Q1 2019 (2018: net inflow of DKK 60 million).
Cash flows from financing activities were a net outflow of DKK 2 million in Q1 2019 (2018: net outflow of DKK 1 million).
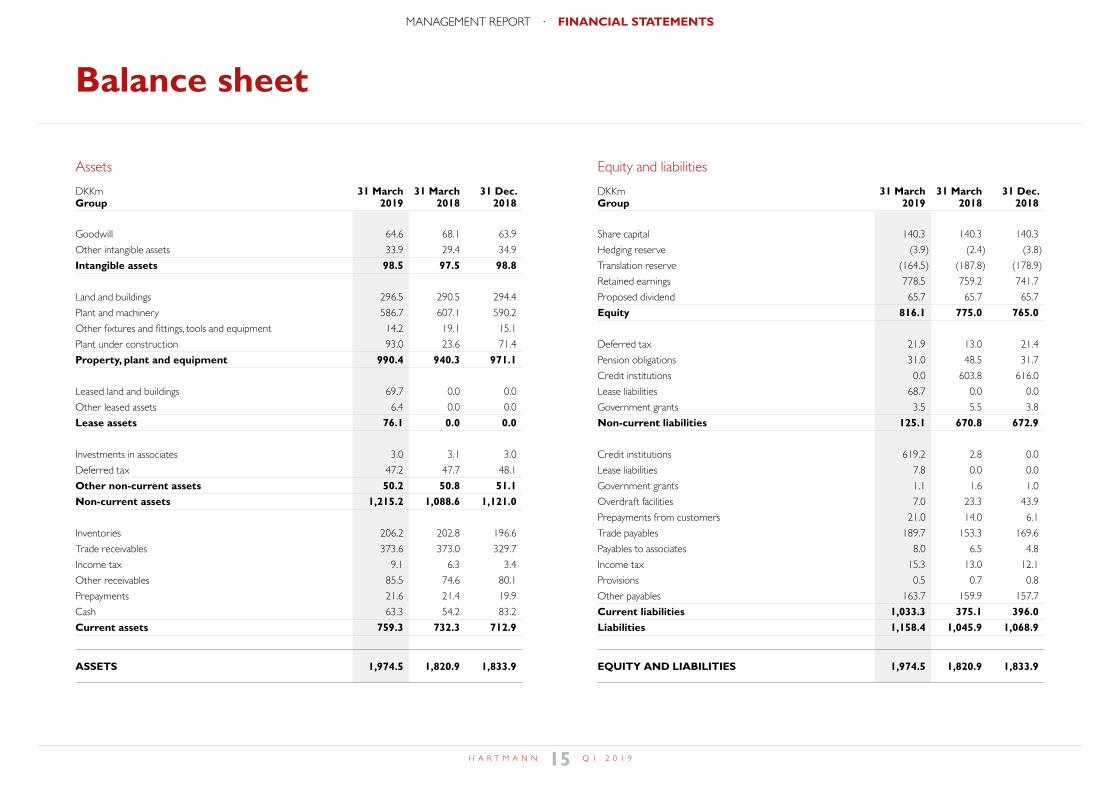
Funding The group’s net interest-bearing debt at 31 March 2019 was DKK 640 million (2018: DKK 576 million). The increase was mainly attributable to the implementation of IFRS 16, which increased net interest-bearing debt by DKK 75 million due to the recognition and capitalisation of leases at 1 January 2019, see note 1.
Financial resources amounted to DKK 387 million at 31 March 2019 (2018: DKK 354 million), comprising cash and cash equiva-lents and undrawn loan and overdraft facilities.
In the first quarter of 2019, Hartmann entered into an agreement to refinance its existing credit facility from December 2014. The existing loan agreement will expire in January 2020 and will be repaid in the second quarter of 2019. The new long-term facility is a loan of DKK 750 million expiring in March 2022 with an option
to extend by up to three years. Hartmann’s loans are subject to customary financial covenants.
ROICThe return on invested capital was 14.7% (2018: 19.4%) before restatement for hyperinflation and 13.6% after restatement for hyperinflation.
EquityEquity at 31 March 2019 stood at DKK 816 million (2018: DKK 775 million), for an equity ratio of 41.3% (2018: 42.6%). The finan-cial gearing ratio at 31 March 2019 was 78.4% (2018: 74.3%).
Events after the balance sheet dateNo events have occurred in the period from the balance sheet date until the date of release of this interim report that would materially affect an evaluation of the interim report.
Developments in Q1 2019
7H A R T M A N N Q 1 2 0 1 9
MANAGEMENT REPORT · FINANCIAL STATEMENTS
Forward-looking statements
The forward-looking statements in this interim report reflect Hartmann’s current expectations for future events and financial results. Such statements are inherently subject to uncertainty, and actual results may therefore differ from expectations. Factors which may cause the actual results to deviate from expectations include general economic developments and developments in the financial markets, changes or amendments to legislation and regulation in Hartmann’s markets, changes in demand for products, competition and the prices of raw materials. See also the risk section in this interim report and note 33 to the financial statements in the annual report for 2018.
Outlook
Based on continued volume growth in the core business and normalised, lower sales of machinery and technology in Hartmann Technology compared with 2018, Hartmann maintains its 2019 guidance of revenue in the DKK 2.2-2.4 billion range after restate-ment for hyperinflation.
The profit margin is still expected to be 9-11% before restatement for hyperinflation. Earnings are expected to benefit from efficien-cy-improving measures and improved capacity utilisation, while the lower contribution from Hartmann Technology, higher paper and energy costs and negative currency effects are expected to have an adverse impact.
Reflecting the decision to establish a new factory in Brazil, capital expenditure is expected to amount to DKK 250 million before re-statement for hyperinflation in 2019 against the previous forecast of approximately DKK 200 million.
AssumptionsOur guidance is based on the exchange rates prevailing at the date of release of this interim report and does not factor in any acqui-sitions. Due to seasonal fluctuations in Hartmann’s packaging sales, revenue and operating profit in the core business are generally higher in Q1 and Q4 than in Q2 and Q3.
Guidance
2019
Revenue DKK 2.2-2.4 billion
Profit margin* 9-11%
Capital expenditure* DKK ~250 million
* Before restatement for hyperinflation.
8H A R T M A N N Q 1 2 0 1 9
MANAGEMENT REPORT · FINANCIAL STATEMENTS
forventninger
This interim report contains descriptions of risks which continually affect Hartmann’s operations and performance. For a full descrip-tion of the risks affecting Hartmann, see the risk section and note 33 in the annual report for 2018.
Raw materialsHartmann is exposed to changes in purchase prices of the raw materials used in our production. In particular, we are exposed to fluctuations in the purchase price of recycled paper and energy (electricity and gas), which are the most important raw materials used in our production.
There is limited scope for reducing sensitivity to developments in the price of recycled paper if supplies of the required volumes are to be secured and maintained.
Hartmann regularly signs fixed-price agreements with energy suppliers, typically for six or 12 months, covering a substantial part of our energy consumption. However, it is not possible to sign fixed-price agreements with energy suppliers in all the countries in which we operate.
Product portfolioHartmann’s portfolio of moulded-fibre products comprises retail and transport packaging for eggs as well as fruit packaging. Retail packaging for eggs is sold as premium and standard products. The
Risk
group’s revenue and earnings may vary considerably due to chang-es in sales across product categories given that there are significant price differences between premium and standard products and between retail, transport and fruit packaging.
Hartmann works continually to balance sales of individual mould-ed-fibre packaging categories with a view to meeting customer demand and optimising earnings.
CurrencyHartmann’s currency risks consist of transaction risk and transla-tion risk.
Hartmann is exposed to transaction risks due to cross-border transactions leading to contractual cash flows in foreign currency. The USD/CAD exchange rate exposure constitutes the group’s single largest transaction risk. This exposure results from the main part of sales generated in the North American business being invoiced in USD, while costs are mainly incurred in CAD. Other significant transaction risks relate to the currencies CHF, EUR, GBP, HRK, HUF and PLN.
Hartmann hedges its transaction risks to the effect that primary currencies are continuously hedged for a period of not less than nine and not more than 12 months.
Due to our foreign subsidiaries, Hartmann is exposed to currency translation risks insofar as a part of the group’s earnings and net assets relates to these foreign subsidiaries and is therefore translat-ed and included in the consolidated financial statements, which are presented in DKK. In addition, the group is exposed to currency translation risks in connection with the granting of intra-group loans to foreign subsidiaries. In terms of net position, foreign subsidiaries reporting in the currencies ARS, BRL, CAD, HRK, HUF, ILS and USD and intra-group loans denominated in USD represent Hartmann’s greatest translation exposure.
Translation risks associated with the translation of earnings and net assets in the group’s foreign subsidiaries into DKK are not hedged as they have no direct impact on cash resources or underlying cash flows.
Translation risks associated with intra-group loans are hedged if they are deemed to potentially have a material impact on consoli-dated profits.
9H A R T M A N N Q 1 2 0 1 9
MANAGEMENT REPORT · FINANCIAL STATEMENTS
risikoforhold
0
50
100
150
200
250
300
350
400
0
0.1
0.2
0.3
0.4
0.5
0.6
0.7
0.8
% ARS/DKK
2015 2016 2017 2018 2019
Revenueexcl. IAS 29
DKKm
Priceindex
Re-translation
Revenue0
10
20
30
40
50
60599 +1 -4
596
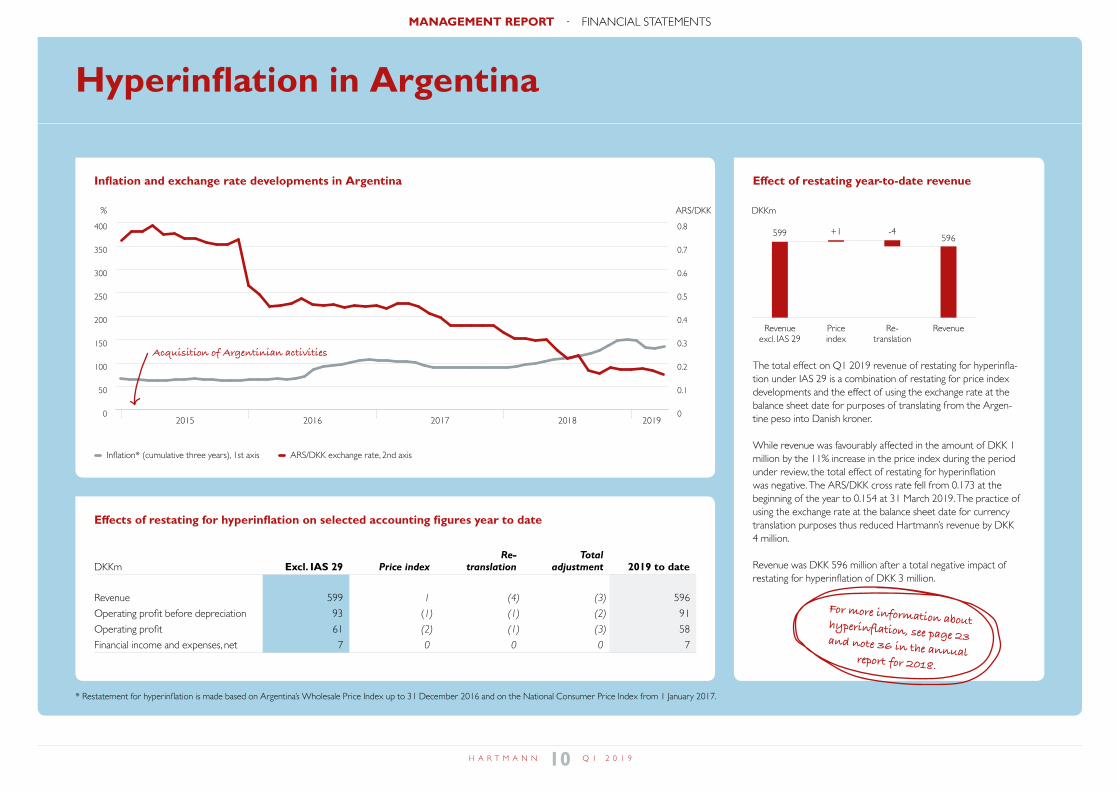
The total effect on Q1 2019 revenue of restating for hyperinfla-tion under IAS 29 is a combination of restating for price index developments and the effect of using the exchange rate at the balance sheet date for purposes of translating from the Argen-tine peso into Danish kroner.
While revenue was favourably affected in the amount of DKK 1 million by the 11% increase in the price index during the period under review, the total effect of restating for hyperinflation was negative. The ARS/DKK cross rate fell from 0.173 at the beginning of the year to 0.154 at 31 March 2019. The practice of using the exchange rate at the balance sheet date for currency translation purposes thus reduced Hartmann’s revenue by DKK 4 million.
Revenue was DKK 596 million after a total negative impact of restating for hyperinflation of DKK 3 million.
Inflation and exchange rate developments in Argentina Effect of restating year-to-date revenue
Acquisition of Argentinian activities
Inflation* (cumulative three years), 1st axis ARS/DKK exchange rate, 2nd axis
Hyperinflation in Argentina
Effects of restating for hyperinflation on selected accounting figures year to date
Re- Total DKKm Excl. IAS 29 Price index translation adjustment 2019 to date
Revenue 599 1 (4) (3) 596
Operating profit before depreciation 93 (1) (1) (2) 91
Operating profit 61 (2) (1) (3) 58
Financial income and expenses, net 7 0 0 0 7
* Restatement for hyperinflation is made based on Argentina’s Wholesale Price Index up to 31 December 2016 and on the National Consumer Price Index from 1 January 2017.
For more information about hyperinflation, see page 23 and note 36 in the annual report for 2018.
10H A R T M A N N Q 1 2 0 1 9
MANAGEMENT REPORT · FINANCIAL STATEMENTS
hyperinflation
Management statement
Today, the board of directors and the executive board have discussed and approved the interim report of Brødrene Hartmann A/S for the three months ended 31 March 2019.
The interim report, which has been neither audited nor reviewed by the company’s auditors, has been prepared in accordance with IAS 34 ‘Interim financial reporting’ as adopted by the EU and Danish disclosure requirements for interim reports of listed companies.
In our opinion, the interim financial statements give a true and fair view of the group’s assets, liabilities and financial position at 31 March 2019 and of the results of the group’s operations and cash flows for the three months ended 31 March 2019.
We are of the opinion that the management report includes a fair review of the development in the group’s operations and financial matters, the results for the period and the financial position of the consolidated entities as a whole as well as a description of the principal risks and uncertainties facing the group.
Gentofte, 7 May 2019
Executive board:
Torben Rosenkrantz-Theil Flemming Lorents SteenCEO CFO
Board of directors:
Agnete Raaschou-Nielsen Steen Parsholt Andy HansenChairman Vice chairman
Jan Klarskov Henriksen Jan Madsen Karen Angelo Hækkerup
Marianne Schelde Palle Skade Andersen
11H A R T M A N N Q 1 2 0 1 9
MANAGEMENT REPORT · FINANCIAL STATEMENTS
ledelsespåtegning
13 Statement of comprehensive income
14 Statement of cash flows
15 Balance sheet
16 Statement of changes in equity
17 Notes
Financial statements
12H A R T M A N N Q 1 2 0 1 9
MANAGEMENT REPORT · FINANCIAL STATEMENTS
regnskab
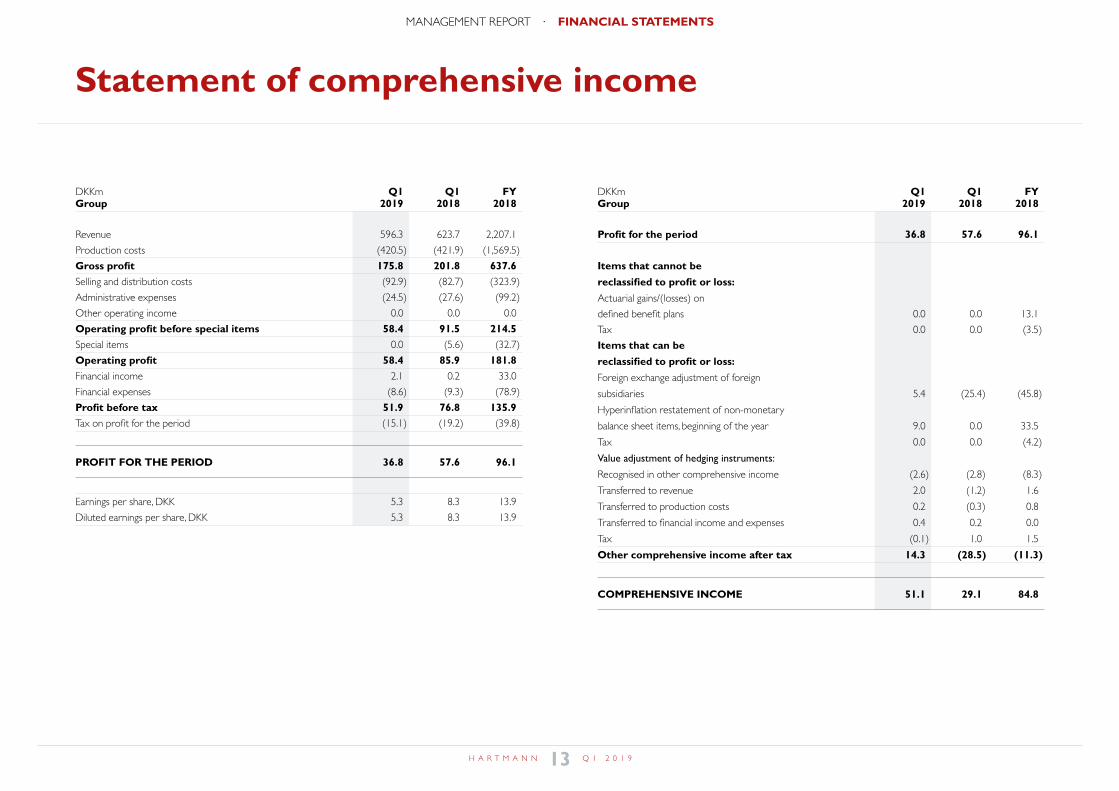
Statement of comprehensive income
DKKm Q1 Q1 FY Group 2019 2018 2018
Revenue 596.3 623.7 2,207.1
Production costs (420.5) (421.9) (1,569.5)
Gross profit 175.8 201.8 637.6Selling and distribution costs (92.9) (82.7) (323.9)
Administrative expenses (24.5) (27.6) (99.2)
Other operating income 0.0 0.0 0.0
Operating profit before special items 58.4 91.5 214.5Special items 0.0 (5.6) (32.7)
Operating profit 58.4 85.9 181.8Financial income 2.1 0.2 33.0
Financial expenses (8.6) (9.3) (78.9)
Profit before tax 51.9 76.8 135.9Tax on profit for the period (15.1) (19.2) (39.8)
PROFIT FOR THE PERIOD 36.8 57.6 96.1
Earnings per share, DKK 5.3 8.3 13.9
Diluted earnings per share, DKK 5.3 8.3 13.9
DKKm Q1 Q1 FY Group 2019 2018 2018
Profit for the period 36.8 57.6 96.1 Items that cannot be
reclassified to profit or loss:
Actuarial gains/(losses) on
defined benefit plans 0.0 0.0 13.1
Tax 0.0 0.0 (3.5)
Items that can be
reclassified to profit or loss:
Foreign exchange adjustment of foreign
subsidiaries 5.4 (25.4) (45.8)
Hyperinflation restatement of non-monetary
balance sheet items, beginning of the year 9.0 0.0 33.5
Tax 0.0 0.0 (4.2)
Value adjustment of hedging instruments:
Recognised in other comprehensive income (2.6) (2.8) (8.3)
Transferred to revenue 2.0 (1.2) 1.6
Transferred to production costs 0.2 (0.3) 0.8
Transferred to financial income and expenses 0.4 0.2 0.0
Tax (0.1) 1.0 1.5
Other comprehensive income after tax 14.3 (28.5) (11.3)
COMPREHENSIVE INCOME 51.1 29.1 84.8
13H A R T M A N N Q 1 2 0 1 9
MANAGEMENT REPORT · FINANCIAL STATEMENTS
totalindkomst
Statement of cash flows
DKKm Q1 Q1 FY Group 2019 2018 2018
Recognition of cash and cash equivalents at end of period:Cash 63.3 54.2 83.2
Overdraft facilities (7.0) (23.3) (43.9)
Cash and cash equivalents at end of period 56.3 30.9 39.3
DKKm Q1 Q1 FY Group 2019 2018 2018
Operating profit before special items 58.4 91.5 214.5
Depreciation and amortisation 32.8 32.5 133.8
Adjustment for other non-cash items 1.8 0.0 7.8
Change in working capital etc. (15.2) (43.3) (23.4)
Restructuring costs etc. paid (0.0) (2.2) (32.8)
Cash generated from operations 77.8 78.5 299.9Interest etc. received 0.4 (0.5) 9.0
Interest etc. paid (7.4) (4.4) (31.3)
Net income tax paid (14.8) (2.7) (13.2)
Cash flows from operating activities 56.0 70.9 264.4Acquisition of intangible assets (0.7) (0.2) (7.0)
Acquisition of property, plant and equipment (37.8) (10.5) (121.9)
Disposal of property, plant and equipment 0.0 0.1 0.6
Dividend received from associates 0.0 0.0 0.1
Cash flows from investing activities (38.5) (10.6) (128.2)Cash flows from operating and investing activities 17.5 60.3 136.2Raising of non-current debt 0.0 0.0 0.0
Repayment of non-current debt (1.9) (1.3) (2.4)
Dividend paid 0.0 0.0 (65.7)
Cash flows from financing activities (1.9) (1.3) (68.1)
TOTAL CASH FLOWS 15.6 59.0 68.1
Cash and cash equivalents at 1 January 39.3 (28.3) (28.3)
Foreign exchange adjustment 1.4 0.2 (0.5)
CASH AND CASH EQUIVALENTS AT END OF PERIOD 56.3 30.9 39.3
The statement of cash flows cannot be derived solely from the published financial information.
14H A R T M A N N Q 1 2 0 1 9
MANAGEMENT REPORT · FINANCIAL STATEMENTS
pengestrømsopgørelse
Balance sheet
Assets
DKKm 31 March 31 March 31 Dec. Group 2019 2018 2018
Goodwill 64.6 68.1 63.9
Other intangible assets 33.9 29.4 34.9
Intangible assets 98.5 97.5 98.8
Land and buildings 296.5 290.5 294.4
Plant and machinery 586.7 607.1 590.2
Other fixtures and fittings, tools and equipment 14.2 19.1 15.1
Plant under construction 93.0 23.6 71.4
Property, plant and equipment 990.4 940.3 971.1
Leased land and buildings 69.7 0.0 0.0
Other leased assets 6.4 0.0 0.0
Lease assets 76.1 0.0 0.0
Investments in associates 3.0 3.1 3.0
Deferred tax 47.2 47.7 48.1
Other non-current assets 50.2 50.8 51.1Non-current assets 1,215.2 1,088.6 1,121.0
Inventories 206.2 202.8 196.6
Trade receivables 373.6 373.0 329.7
Income tax 9.1 6.3 3.4
Other receivables 85.5 74.6 80.1
Prepayments 21.6 21.4 19.9
Cash 63.3 54.2 83.2
Current assets 759.3 732.3 712.9
ASSETS 1,974.5 1,820.9 1,833.9
Equity and liabilities
DKKm 31 March 31 March 31 Dec. Group 2019 2018 2018
Share capital 140.3 140.3 140.3
Hedging reserve (3.9) (2.4) (3.8)
Translation reserve (164.5) (187.8) (178.9)
Retained earnings 778.5 759.2 741.7
Proposed dividend 65.7 65.7 65.7
Equity 816.1 775.0 765.0
Deferred tax 21.9 13.0 21.4
Pension obligations 31.0 48.5 31.7
Credit institutions 0.0 603.8 616.0
Lease liabilities 68.7 0.0 0.0
Government grants 3.5 5.5 3.8
Non-current liabilities 125.1 670.8 672.9
Credit institutions 619.2 2.8 0.0
Lease liabilities 7.8 0.0 0.0
Government grants 1.1 1.6 1.0
Overdraft facilities 7.0 23.3 43.9
Prepayments from customers 21.0 14.0 6.1
Trade payables 189.7 153.3 169.6
Payables to associates 8.0 6.5 4.8
Income tax 15.3 13.0 12.1
Provisions 0.5 0.7 0.8
Other payables 163.7 159.9 157.7
Current liabilities 1,033.3 375.1 396.0Liabilities 1,158.4 1,045.9 1,068.9
EQUITY AND LIABILITIES 1,974.5 1,820.9 1,833.9
15H A R T M A N N Q 1 2 0 1 9
MANAGEMENT REPORT · FINANCIAL STATEMENTS
balance
Statement of changes in equity
Group 2019 2018 Share Hedging Translation Retained Proposed Total Share Hedging Translation Retained Proposed Total DKKm capital reserve reserve* earnings dividend equity capital reserve reserve earnings dividend equity
Equity at 1 January 140.3 (3.8) (178.9) 741.7 65.7 765.0 140.3 0.6 (162.4) 701.7 65.7 745.9Profit for the period - - - 36.8 - 36.8 - - - 57.6 - 57.6
Other comprehensive incomeItems that can be reclassified to profit or loss
Foreign exchange adjustments of foreign subsidiaries - - 5.4 - - 5.4 - - (25.4) - - (25.4)
Hyperinflation restatement of non-monetary balance sheet items, beginning of the year - - 9.0 - - 9.0 - - - - - -
Tax - - 0.0 - - 0.0 - - - - - -
Value adjustment of hedging instruments:
Recognised in other comprehensive income - (2.6) - - - (2.6) - (2.8) - - - (2.8)
Transferred to revenue - 2.0 - - - 2.0 - (1.2) - - - (1.2)
Transferred to production costs - 0.2 - - - 0.2 - (0.3) - - - (0.3)
Transferred to financial income and expenses - 0.4 - - - 0.4 - 0.2 - - - 0.2
Tax - (0.1) - - - (0.1) - 1.0 - - - 1.0
Other comprehensive income 0.0 (0.1) 14.4 0.0 0.0 14.3 0.0 (3.1) (25.4) 0.0 0.0 (28.5)Total comprehensive income 0.0 (0.1) 14.4 36.8 0.0 51.1 0.0 (3.1) (25.4) 57.6 0.0 29.1Transactions with owners
Dividend paid - - - - 0.0 0.0 - - - - 0.0 0.0
Total changes in equity 0.0 (0.1) 14.4 36.8 0.0 51.1 0.0 (3.1) (25.4) 57.6 0.0 29.1Equity at 31 March 140.3 (3.9) (164.5) 778.5 65.7 816.1 140.3 (2.5) (187.8) 759.3 65.7 775.0
* Translation reserve includes reserve for foreign exchange adjustment of foreign subsidiaries and hyperinflation restatement of non-monetary opening balance sheet items for the Argentinian activities.
16H A R T M A N N Q 1 2 0 1 9
MANAGEMENT REPORT · FINANCIAL STATEMENTS
egenkapitalopgørelse
Notes
01 Accounting policies
The consolidated interim financial statements have been prepared in accordance with IAS 34 ‘Interim Financial Reporting’ as adopted by the EU and Danish disclosure requirements for listed companies. Interim financial statements have not been prepared for the parent company. The interim financial statements are presented in Danish kroner (DKK), which is the presentation currency used for the group’s operations and the functional currency of the parent company.
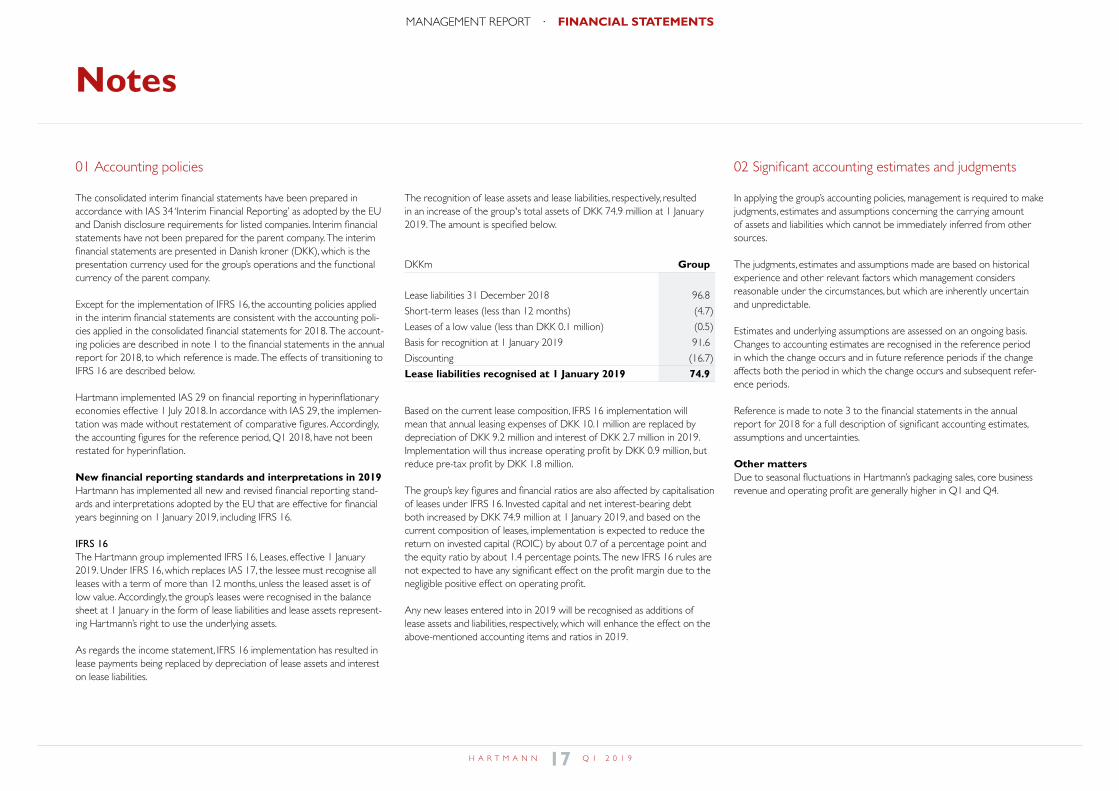
Except for the implementation of IFRS 16, the accounting policies applied in the interim financial statements are consistent with the accounting poli-cies applied in the consolidated financial statements for 2018. The account-ing policies are described in note 1 to the financial statements in the annual report for 2018, to which reference is made. The effects of transitioning to IFRS 16 are described below.
Hartmann implemented IAS 29 on financial reporting in hyperinflationary economies effective 1 July 2018. In accordance with IAS 29, the implemen-tation was made without restatement of comparative figures. Accordingly, the accounting figures for the reference period, Q1 2018, have not been restated for hyperinflation.
New financial reporting standards and interpretations in 2019Hartmann has implemented all new and revised financial reporting stand-ards and interpretations adopted by the EU that are effective for financial years beginning on 1 January 2019, including IFRS 16.
IFRS 16The Hartmann group implemented IFRS 16, Leases, effective 1 January 2019. Under IFRS 16, which replaces IAS 17, the lessee must recognise all leases with a term of more than 12 months, unless the leased asset is of low value. Accordingly, the group’s leases were recognised in the balance sheet at 1 January in the form of lease liabilities and lease assets represent-ing Hartmann’s right to use the underlying assets.
As regards the income statement, IFRS 16 implementation has resulted in lease payments being replaced by depreciation of lease assets and interest on lease liabilities.
The recognition of lease assets and lease liabilities, respectively, resulted in an increase of the group's total assets of DKK 74.9 million at 1 January 2019. The amount is specified below.
DKKm Group
Lease liabilities 31 December 2018 96.8
Short-term leases (less than 12 months) (4.7)
Leases of a low value (less than DKK 0.1 million) (0.5)
Basis for recognition at 1 January 2019 91.6
Discounting (16.7)
Lease liabilities recognised at 1 January 2019 74.9
Based on the current lease composition, IFRS 16 implementation will mean that annual leasing expenses of DKK 10.1 million are replaced by depreciation of DKK 9.2 million and interest of DKK 2.7 million in 2019. Implementation will thus increase operating profit by DKK 0.9 million, but reduce pre-tax profit by DKK 1.8 million.
The group’s key figures and financial ratios are also affected by capitalisation of leases under IFRS 16. Invested capital and net interest-bearing debt both increased by DKK 74.9 million at 1 January 2019, and based on the current composition of leases, implementation is expected to reduce the return on invested capital (ROIC) by about 0.7 of a percentage point and the equity ratio by about 1.4 percentage points. The new IFRS 16 rules are not expected to have any significant effect on the profit margin due to the negligible positive effect on operating profit.
Any new leases entered into in 2019 will be recognised as additions of lease assets and liabilities, respectively, which will enhance the effect on the above-mentioned accounting items and ratios in 2019.
02 Significant accounting estimates and judgments
In applying the group’s accounting policies, management is required to make judgments, estimates and assumptions concerning the carrying amount of assets and liabilities which cannot be immediately inferred from other sources.
The judgments, estimates and assumptions made are based on historical experience and other relevant factors which management considers reasonable under the circumstances, but which are inherently uncertain and unpredictable.
Estimates and underlying assumptions are assessed on an ongoing basis. Changes to accounting estimates are recognised in the reference period in which the change occurs and in future reference periods if the change affects both the period in which the change occurs and subsequent refer-ence periods.
Reference is made to note 3 to the financial statements in the annual report for 2018 for a full description of significant accounting estimates, assumptions and uncertainties.
Other mattersDue to seasonal fluctuations in Hartmann’s packaging sales, core business revenue and operating profit are generally higher in Q1 and Q4.
17H A R T M A N N Q 1 2 0 1 9
MANAGEMENT REPORT · FINANCIAL STATEMENTS
noter
Notes
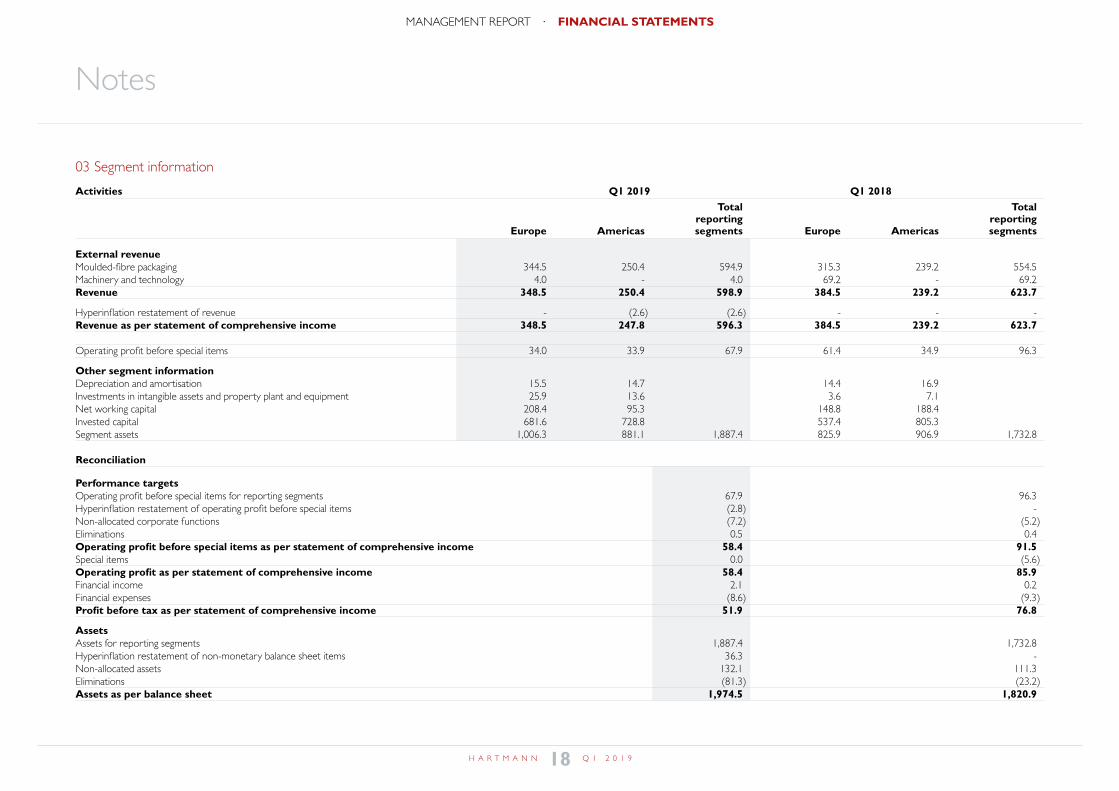
03 Segment information
Activities Q1 2019 Q1 2018 Total Total reporting reporting Europe Americas segments Europe Americas segments
External revenueMoulded-fibre packaging 344.5 250.4 594.9 315.3 239.2 554.5Machinery and technology 4.0 - 4.0 69.2 - 69.2Revenue 348.5 250.4 598.9 384.5 239.2 623.7
Hyperinflation restatement of revenue - (2.6) (2.6) - - -Revenue as per statement of comprehensive income 348.5 247.8 596.3 384.5 239.2 623.7
Operating profit before special items 34.0 33.9 67.9 61.4 34.9 96.3
Other segment informationDepreciation and amortisation 15.5 14.7 14.4 16.9 Investments in intangible assets and property plant and equipment 25.9 13.6 3.6 7.1 Net working capital 208.4 95.3 148.8 188.4 Invested capital 681.6 728.8 537.4 805.3 Segment assets 1,006.3 881.1 1,887.4 825.9 906.9 1,732.8
Reconciliation
Performance targetsOperating profit before special items for reporting segments 67.9 96.3Hyperinflation restatement of operating profit before special items (2.8) -Non-allocated corporate functions (7.2) (5.2)Eliminations 0.5 0.4Operating profit before special items as per statement of comprehensive income 58.4 91.5Special items 0.0 (5.6)Operating profit as per statement of comprehensive income 58.4 85.9Financial income 2.1 0.2Financial expenses (8.6) (9.3)Profit before tax as per statement of comprehensive income 51.9 76.8
AssetsAssets for reporting segments 1,887.4 1,732.8Hyperinflation restatement of non-monetary balance sheet items 36.3 -Non-allocated assets 132.1 111.3Eliminations (81.3) (23.2)Assets as per balance sheet 1,974.5 1,820.9
18H A R T M A N N Q 1 2 0 1 9
MANAGEMENT REPORT · FINANCIAL STATEMENTS
Notes
03 Segment information – continued
Accounting policies
The reporting of business segments is in accordance with the internal reporting to the executive board and the board of directors. The executive board and the board of directors constitute Hart-mann’s chief operating decision maker.
Hartmann’s activities are segmented on the basis of the geographical location of the reporting units.
No operating segments have been aggregated to represent the reporting segments.
With the exception that the restatements made in pursuance of IAS 29 are not included in the management reporting, the internal management reporting is consistent with the group’s account-ing policies. The effects of restating for hyperinflation are shown as separate reconciling items in this note.
Business decisions on resource allocation and performance evaluation for each of the segments are made on the basis of the operating profits of the individual segments before special items. De-cisions relating to financing and taxation are made on the basis of information regarding Hartmann as a whole and are not allocated to the reporting segments. Intra-segmental transactions are priced on an arm’s length basis.
Segment income and expenses as well as segment assets and liabilities comprise those items that in the internal management reporting are directly attributed to each individual segment and those items that are indirectly allocated to the individual segment on a reliable basis. Profits in associates, financial income and expenses, income taxes, investments in associates, tax assets and tax liabilities and cash and bank debt are not allocated to reporting segments.
The reporting segments are:
• Europe – comprising production and sales of moulded-fibre packaging. The products are man-ufactured at factories in Europe (including Israel) and are primarily sold to egg producers, egg packing businesses, retail chains and buyers of industrial packaging. The segment also comprises sales of machinery and technology to manufacturers of moulded-fibre packaging in selected markets.
• Americas – comprising production and sales of moulded-fibre packaging. The products are primarily manufactured at the North and South American factories and sold to egg and fruit producers, egg and fruit packing businesses and retail chains.
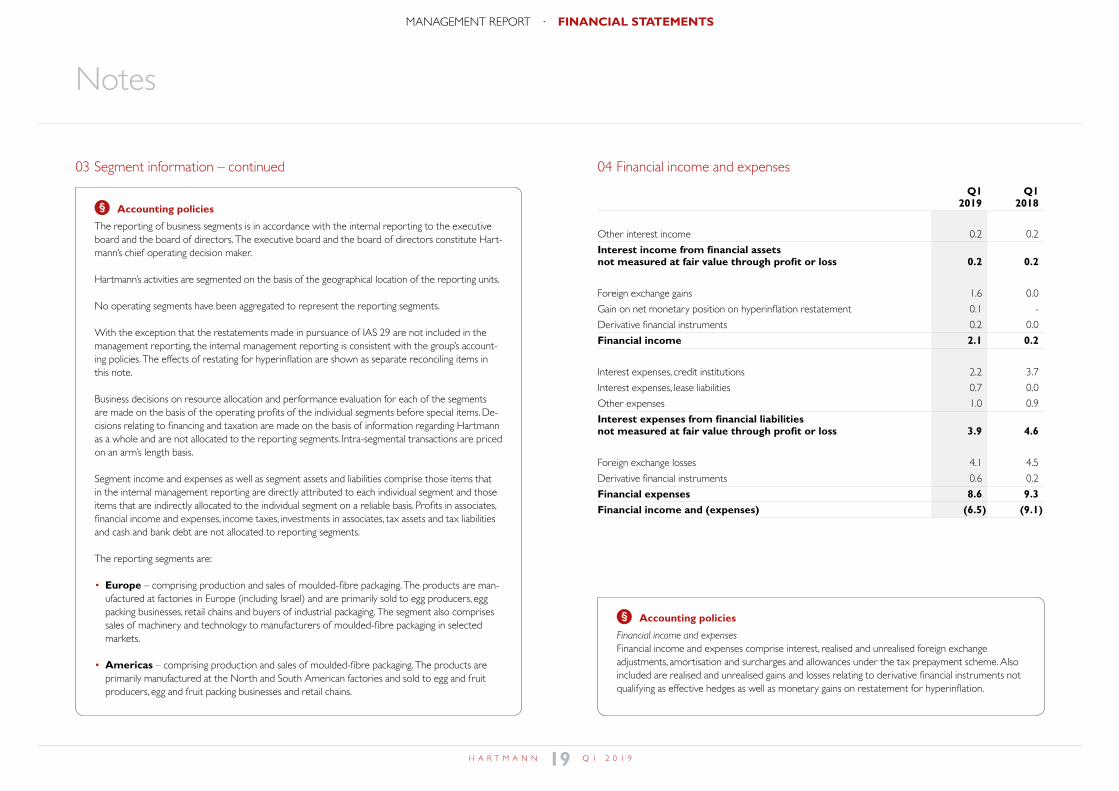
04 Financial income and expenses
Q1 Q1 2019 2018
Other interest income 0.2 0.2
Interest income from financial assets not measured at fair value through profit or loss 0.2 0.2
Foreign exchange gains 1.6 0.0
Gain on net monetary position on hyperinflation restatement 0.1 -
Derivative financial instruments 0.2 0.0
Financial income 2.1 0.2
Interest expenses, credit institutions 2.2 3.7
Interest expenses, lease liabilities 0.7 0.0
Other expenses 1.0 0.9
Interest expenses from financial liabilities not measured at fair value through profit or loss 3.9 4.6
Foreign exchange losses 4.1 4.5
Derivative financial instruments 0.6 0.2
Financial expenses 8.6 9.3Financial income and (expenses) (6.5) (9.1)
Accounting policies
Financial income and expensesFinancial income and expenses comprise interest, realised and unrealised foreign exchange adjustments, amortisation and surcharges and allowances under the tax prepayment scheme. Also included are realised and unrealised gains and losses relating to derivative financial instruments not qualifying as effective hedges as well as monetary gains on restatement for hyperinflation.
19H A R T M A N N Q 1 2 0 1 9
MANAGEMENT REPORT · FINANCIAL STATEMENTS
Notes
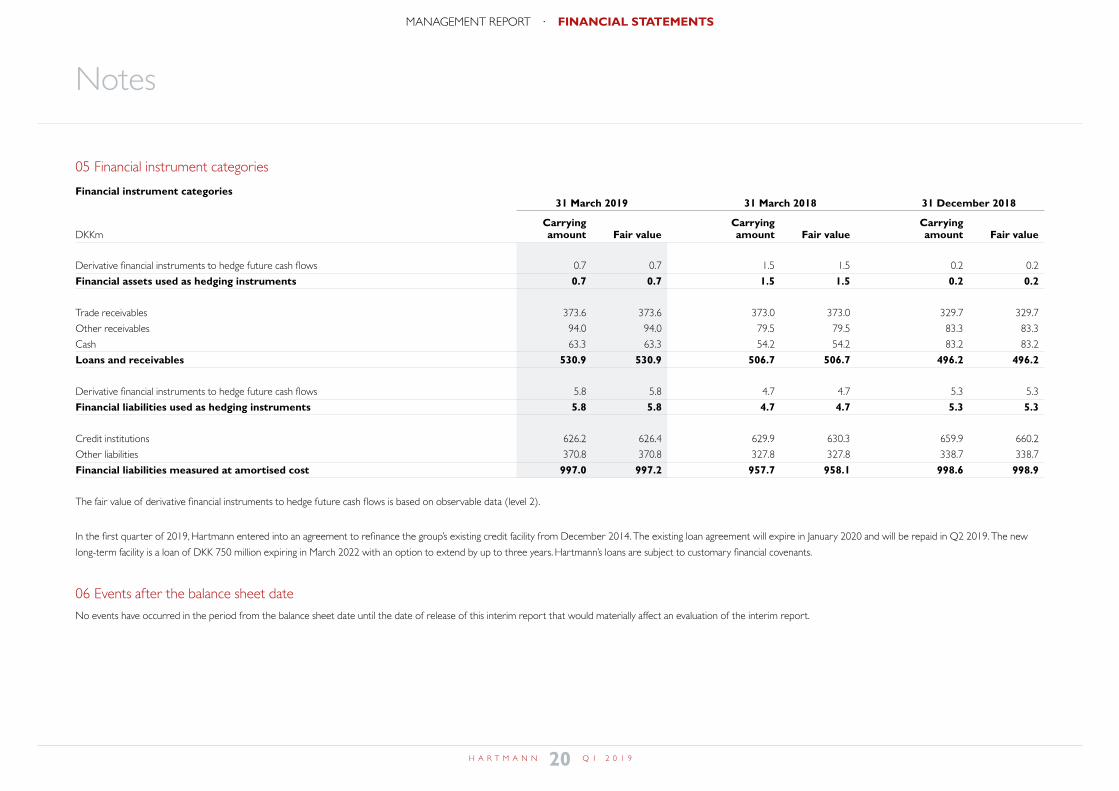
05 Financial instrument categories
Financial instrument categories 31 March 2019 31 March 2018 31 December 2018
Carrying Carrying Carrying DKKm amount Fair value amount Fair value amount Fair value
Derivative financial instruments to hedge future cash flows 0.7 0.7 1.5 1.5 0.2 0.2
Financial assets used as hedging instruments 0.7 0.7 1.5 1.5 0.2 0.2
Trade receivables 373.6 373.6 373.0 373.0 329.7 329.7
Other receivables 94.0 94.0 79.5 79.5 83.3 83.3
Cash 63.3 63.3 54.2 54.2 83.2 83.2
Loans and receivables 530.9 530.9 506.7 506.7 496.2 496.2
Derivative financial instruments to hedge future cash flows 5.8 5.8 4.7 4.7 5.3 5.3
Financial liabilities used as hedging instruments 5.8 5.8 4.7 4.7 5.3 5.3
Credit institutions 626.2 626.4 629.9 630.3 659.9 660.2
Other liabilities 370.8 370.8 327.8 327.8 338.7 338.7
Financial liabilities measured at amortised cost 997.0 997.2 957.7 958.1 998.6 998.9
The fair value of derivative financial instruments to hedge future cash flows is based on observable data (level 2).
In the first quarter of 2019, Hartmann entered into an agreement to refinance the group’s existing credit facility from December 2014. The existing loan agreement will expire in January 2020 and will be repaid in Q2 2019. The new
long-term facility is a loan of DKK 750 million expiring in March 2022 with an option to extend by up to three years. Hartmann’s loans are subject to customary financial covenants.
06 Events after the balance sheet dateNo events have occurred in the period from the balance sheet date until the date of release of this interim report that would materially affect an evaluation of the interim report.
20H A R T M A N N Q 1 2 0 1 9
MANAGEMENT REPORT · FINANCIAL STATEMENTS
Hartmann is the world’s leading manufacturer of moulded-fibre egg packaging, a market-leading manufacturer of fruit packaging in South America and one of the world’s largest manufacturers of technology for the production of moulded-fibre packaging. Founded in 1917, Hartmann’s market position builds on its strong technology know-how and extensive experience of sustainable moulded-fibre production dating back to 1936.
SustainabilitySustainability and protection of the environment are integral components of Hartmann’s business model and strategy. All Hart-mann’s products are based on recycled paper, which is a renewable and biodegradable resource. Working closely with our customers to accommodate demand for sustainable products in the retail industry, Hartmann was the first manufacturer to offer both FSC-certified and CO2-neutral retail packaging.
MarketsHartmann’s key markets are Europe, South America and North America, where the group has strong market positions. Hartmann is a market leader in Europe and in South America, where our product portfolio also includes fruit packaging. Hartmann claims a growing share of the North American market and also sells machinery and technology in selected markets.
Products and customersHartmann sells egg and fruit packaging to manufacturers, distribu-tors and retail chains, which are increasingly demanding sustainable packaging solutions and specialised marketing expertise. Our ver-satile product portfolio is customised to accommodate customer and consumer needs in each individual market. Hartmann sells machinery and technology to manufacturers of moulded-fibre packaging in selected markets.
ProductionHartmann’s production platform consists of 12 factories in Europe, Israel and North and South America. Our deep technology know-how and extensive experience in manufacturing moulded-fibre packaging empower us to develop and maintain our production platform. Each year, the group’s 2,000 employees manufacture billions of moulded-fibre packaging units and machinery and tech-nology for the manufacturing of packaging.
The Hartmann shareHartmann’s shares have been listed on Nasdaq Copenhagen since 1982. We have one class of shares, and each share carries one vote. Financial reports and company announcements may be obtained by subscribing to Hartmann’s news service at investor.hartmann-packaging.com.
Hartmann at a glance
Financial calendar 2019
13 August 2019 Interim report Q2 2019
13 November 2019 Interim report Q3 2019
21H A R T M A N N Q 1 2 0 1 9
MANAGEMENT REPORT · FINANCIAL STATEMENTS
kort om hartmann
This interim report was released in Danish and English through Nasdaq Copenhagen as company announcement no. 6/2019. In case of discrepancies between the two versions, or in case of doubt, the Danish version prevails.
All trademarks such as trade names and other names and desig-nations highlighted in this report are trademarks protected and owned by Brødrene Hartmann A/S.
© 2019 Brødrene Hartmann A/S
Brødrene Hartmann A/SØrnegårdsvej 18DK-2820 Gentofte
Tel: (+45) 45 97 00 00E-mail: [email protected]: hartmann-packaging.com
Company reg. (CVR) no. 63 04 96 11