Owner’s Manual 55”/60” Class 1080p LED LCD TV (54.6/59.5 ...

1eWork Scandinavia AB Interim Report Q1 2015
First quarter 2015 compared to 2014
• Netsalesincreasedby32percenttoSEK1,458million(1,104).
• Operatingprofitroseby29percenttoSEK17.2million(13.4).
• Orderintakeup40percenttoSEK1,850million(1,325).
• ProfitaftertaxpershareafterdilutionwasSEK0.78(0.62).
• Forthefirsttime,netsalespassedSEK5billionannualized(rolling12months).
• Thehighprofitgrowthisdueprimarilytoanincreasednumberofconsultantsonnewassignments.
• Theconsultantmarketremainedstrong,withhighdemandforconsultantsfornewassignments.
Interim ReportJanuary - March 2015
Reshaping Consulting
Operating profit (right)Net sales (left)
201320122011
SEK million SEK million
2014 2015
0
300
600
900
1,200
1,500
0
4
8
12
16
20
Q1Q4Q3Q2Q1Q4Q3Q2Q1Q4Q3Q2Q1Q4Q3Q2Q1
Net sales and operating profit
0
500
1,000
1,500
2,000
2,500
3,000
20142013201220112014201320122011201420132012201120152014201320122011
Q4Q3Q2Q1
SEK million
Order intake

2eWork Scandinavia AB Interim Report Q1 2015
eWork made a good start to 2015. Sales were up by 32 percent, and profits by nearly as much. The consulting market overall was strong, and firm de-mand for consultants and new assignments made a notable contribution to growth.
Onceagain,thefirstquarterwasanotherverypositive
periodforeWork.Thebaseofourbusinessperformed
well,andweaddedagrowingcohortofconsultants
on new assignments. Accordingly, the positive de-
mandgrowth,whichwereportedinthesecondhalf-
year2014,continuedintheperiod.
Intheperiod,wepassedSEK5billionofannualized
netsales(rolling12months)forthefirsttime.Thisisa
milestone,andareminderthatwe’veestablishedour-
selvesasoneofthegenuinetop-tierconsultantpro-
vidersintheNordics.When,fiveyearsago,wesetthe
targetofachievingthesevolumesbyyear-end2015,
therewerefewcommentatorswhobelievedus.
Outsourcing clients’ consultant delivery has been a
keygrowthopportunityinrecentyears.Thishasbeen
a contributor to the strong market positioning that
we’re now benefitting from in current positive mar-
ketconditions.Nowthebaseofourbusinessisgrow-
ingagain,andwe’reappointingmoreconsultantson
new,attractiveassignments.Thisisfeedingthroughto
profitability,andourearningsperformanceimproved
intheperiodataboutthesamerateasnetsales.
A year has now passed since we started our major
partnership with Tieto. We’ve achieved the challeng-
ingquality,pricingandefficiencytargetssetwhenthis
dealbegan.Accordingly,we’vesucceeded in refining
the outsourcing model that we brought to the con-
sultantmarketin2012,andIdaresay,we’retheonly
playertohavematchedthesechallengingstandards,
evenonverylarge-scaleundertakings.
Inthequarter,wedecidedtostartupanoperationin
Poland,ourfirstnon-Nordicbusiness.Thisisanexciting
initiative,whichhas reallyattractedclients’attention.
Workonsettingupthisbusinessisgoingasplanned.
The progress of our Nordic subsidiaries continued
the trends of recent quarters. Denmark is still posi-
tive,contributingnearly10percentofGroupoperat-
ing profit. Norway rallied somewhat after a number
of quarters of poor progress on a slow market. Net
saleswereupby16percent,andearningswentback
into the black. One positive news item was that we
re-securedourassignment foramajorNordicclient
inNorway,whichwehadpreviouslypartneredwith.
OurFinnishbusinessfocusedprimarilyondeveloping
itsmajorMSPdealforTieto.Theassignmentisgoing
well,althoughitsstart-upwasresourceintensive,with
asmalllossreportedoverall.
This was a great quarter—our continued successes,
growth and strong performance demonstrate that
eWorkisassertingitselfwellinthecompetition,and
westillhavegoodpotentialforlong-termgrowthin
theNordics.
Stockholm,Sweden,22April2015
ZoranCovic,PresidentandCEO
CEO’s commentary

3eWork Scandinavia AB Interim Report Q1 2015
SEK millionJan-Mar
2015Jan-Mar
2014Rolling 4 quarters
Apr 2014-Mar 2015Full year
2014
Netsales 1,457 1104 5068 4714
Operatingprofit 17.2 13.4 56.2 52.3
Profitbeforetax 17.2 13.6 56.6 52.9
Profitaftertax 13.4 10.5 44.2 41.3
Cashflow,operatingactivities –66.0 –100.2 54.6 20.4
Operatingmargin,% 1.2 1.2 1.1 1.1
Equity/assetsratio,% 8.6 11.1 8.6 8.7
Earningspersharebeforedilution,SEK 0.79 0.62 2.60 2.43
Earningspershareafterdilution,SEK 0.78 0.62 2.59 2.43
Maxno.ofconsultantsonassignment 4,950 3759
Averagenumberofemployees 163 148 160 157
Salesperemployee,SEKthousand 8,952 7457 31,674 30,027
First quarter 2015MarketTheNordicconsultingmarketwasstronginthefirst
quarteroftheyear.Demandforconsultantsfornew
assignments grew in several skills segments where
eWork is active. Accordingly, the positive progress
fromthesecondhalf-year2014continued.
Simultaneously, the interest in MSP deals remains
high. In these structures, the client migrates ongo-
ingconsultantdeliveriesfrommultipleprovidersonto
one.Asaresultofthistrend,eWorkexpectsthebro-
ker segment to keep taking a growing share of the
consultantmarket.
In the period, news of planned staff and consultant
downsizing in the telecom sector attracted some
attention. For eWork, this has no immediate conse-
quences,althoughthenumberofnewappointments
isexpectedtoreduceinthisskillssegmentoncecur-
rentassignmentsterminate.Therehasbeennosimilar
downturntendencyintheITsectoroverall,orforen-
gineeringconsultants.
eWork’sdemandindicators,suchasthenumberofcli-
entenquiriesreceived,applicationsfromconsultants,
the share of stated skills segments etc., indicated a
generaldemand increase inyear-on-year terms.The
number of applicants per assignment decreased
somewhat, but the supply of consultants available
fornewassignmentsremainedfavourable.Adecreas-
ingnumberofapplicantsisasignofgenerallyhigher
capacityutilization. eWork regards theSwedishand
Danishmarketsasstrong.InNorway,thesituationsta-
bilizedsomewhatafterapoor2014.TheFinnishmar-
ketwasstable,withsomesignsofincreasedactivity
ontheclientside.
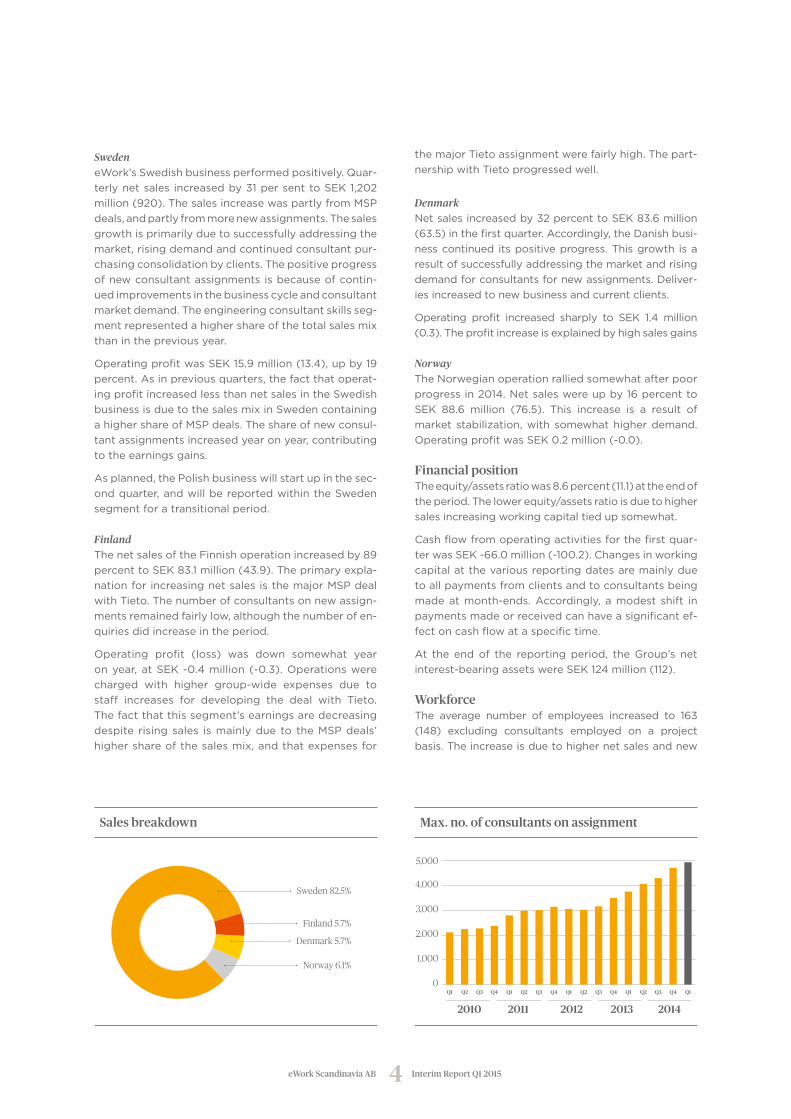
The Group’s net salesTheGroup’snet sales for thefirstquarter increased
by 32 percent to SEK 1,457 million (1,103.7), with all
segmentscontributing to the increase.Swedenpro-
duced the highest growth in absolute terms, while
Finlandhad thehighestpercentagegrowth.Growth
is sourced fromnewMSPdeals andnewconsultant
assignments.
The Group’s profitTheGroup’soperatingprofitforthefirstquarterwas
upby29percenttoSEK17.2million(13.4).Profitaf-
ter financial items was SEK 17.2 million (13.6). Profit
aftertaxforthequarteramountedtoSEK13.4million
(10.5).
The profit increase is a consequence of increasing
net sales, especially the growth of new consultant
appointments. The Group’s positive operating profit
mainly stems from the Swedish business, although
Denmark also contributed SEK 1.4 million after de-
ductingGroup-wideexpenses.
Order intakeGrouporderintakeroseby40percentyearonyear,
toSEK1,850million(1,325).Thishighincreaseinorder
intakecomesfromnewMSPdeals,andincreasedde-
mandfornewappointments.
Thenumberofconsultantsonassignment increased
by32percent,peakingat4,950(3,759).
4eWork Scandinavia AB Interim Report Q1 2015
Sweden
eWork’sSwedishbusinessperformedpositively.Quar-
terlynetsales increasedby31persenttoSEK1,202
million(920).ThesalesincreasewaspartlyfromMSP
deals,andpartlyfrommorenewassignments.Thesales
growthisprimarilyduetosuccessfullyaddressingthe
market,risingdemandandcontinuedconsultantpur-
chasingconsolidationbyclients.Thepositiveprogress
ofnewconsultantassignmentsisbecauseofcontin-
uedimprovementsinthebusinesscycleandconsultant
marketdemand.Theengineeringconsultantskillsseg-
mentrepresentedahighershareofthetotalsalesmix
thaninthepreviousyear.
OperatingprofitwasSEK15.9million(13.4),upby19
percent.Asinpreviousquarters,thefactthatoperat-
ingprofitincreasedlessthannetsalesintheSwedish
businessisduetothesalesmixinSwedencontaining
ahighershareofMSPdeals.Theshareofnewconsul-
tantassignmentsincreasedyearonyear,contributing
totheearningsgains.
Asplanned,thePolishbusinesswillstartupinthesec-
ondquarter,andwillbereportedwithintheSweden
segmentforatransitionalperiod.
Finland
ThenetsalesoftheFinnishoperationincreasedby89
percenttoSEK83.1million(43.9).Theprimaryexpla-
nationforincreasingnetsalesisthemajorMSPdeal
withTieto.Thenumberofconsultantsonnewassign-
mentsremainedfairlylow,althoughthenumberofen-
quiriesdidincreaseintheperiod.
Operating profit (loss) was down somewhat year
onyear,atSEK-0.4million(-0.3).Operationswere
charged with higher group-wide expenses due to
staff increases for developing the deal with Tieto.
Thefactthatthissegment’searningsaredecreasing
despite risingsales ismainlyduetotheMSPdeals’
highershareofthesalesmix,andthatexpensesfor
themajorTietoassignmentwerefairlyhigh.Thepart-
nershipwithTietoprogressedwell.
Denmark
Netsalesincreasedby32percenttoSEK83.6million
(63.5)inthefirstquarter.Accordingly,theDanishbusi-
nesscontinued itspositiveprogress.Thisgrowth isa
resultofsuccessfullyaddressingthemarketandrising
demandforconsultantsfornewassignments.Deliver-
iesincreasedtonewbusinessandcurrentclients.
Operating profit increased sharply to SEK 1.4 million
(0.3).Theprofitincreaseisexplainedbyhighsalesgains
Norway
TheNorwegianoperationralliedsomewhatafterpoor
progressin2014.Netsaleswereupby16percentto
SEK 88.6 million (76.5). This increase is a result of
marketstabilization,withsomewhathigherdemand.
OperatingprofitwasSEK0.2million(-0.0).
Financial position Theequity/assetsratiowas8.6percent(11.1)attheendof
theperiod.Thelowerequity/assetsratioisduetohigher
salesincreasingworkingcapitaltiedupsomewhat.
Cashflowfromoperatingactivitiesforthefirstquar-
terwasSEK-66.0million(-100.2).Changesinworking
capitalatthevariousreportingdatesaremainlydue
toallpaymentsfromclientsandtoconsultantsbeing
madeatmonth-ends.Accordingly, amodest shift in
paymentsmadeorreceivedcanhaveasignificantef-
fectoncashflowataspecifictime.
At the end of the reporting period, the Group’s net
interest-bearingassetswereSEK124million(112).
WorkforceThe average number of employees increased to 163
(148) excluding consultants employed on a project
basis.Theincreaseisduetohighernetsalesandnew
Norway 6.1%
Denmark 5.7%
Finland 5.7%
Sweden 82.5%
Sales breakdown
0
1,000
2,000
3,000
4,000
5,000
Q1Q4Q3Q2Q1Q4Q3Q2Q1Q4Q3Q2Q1Q4Q3Q2Q1
2013201220112010 2014
Max. no. of consultants on assignment

5eWork Scandinavia AB Interim Report Q1 2015
hirings relating to the large-scale MSP assignments
signedin2014.
Parent CompanyThe Parent Company’s net sales for the first quarter
were SEK 1,205 million (922). Profit before financial
itemswasSEK 15.9million (13.4)andprofitafter tax
wasSEK12.2million(10.6).
TheParentCompany’sequityattheendofthequarter
wasSEK139million(139)attheendofthequarterand
theequity/assets ratiowas9.8percent (12.9).Other-
wise,whereappropriate,theabovecommentsregard-
ingtheGroup’sfinancialpositionalsoapplytothePar-
entCompany.
Share price and turnover
eWork Weekly share turnoverIndex
SEK Share turnover, thousands
0
10
20
30
40
50
60
2015201420132012201120100
300
600
900
1,200
1,500
1,800
Asof31March2015No.ofshares
Votesandequity
Staffan Salén and family through companies 1 4,668,855 27.5%Försäkringsbolaget Avanza Pension 3,066,619 18.1%
Investment AB Öresund 1,700,473 10.0%
Anders Ström Core Holdings Ltd. 1,132,705 6.7%PSG Small Cap 582,423 3.4%Handelsbanken Fonder AB RE JPMEL 550,042 3.2%Ruthberg, Claes 500,000 2.9%Pettersson, Jan 349,000 2.1%Erik Åfors through companies 2 277,291 1.6%Polhavet AB 250,000 1.5%Total 10 largest 13,077,408 77.0%Other 3,906,567 23.0%Total 16,983,975 100.0%
Shareholders, eWork’s ten largest owners
Material risks and uncertainty factorseWork’s material business risks, for the Group and
ParentCompany,consistofreduceddemandforcon-
sultingservices,difficultiesinattractingandretaining
skilledstaff,creditrisks,andtoalesserextent,curren-
cyrisks.TheCompanyisnotawareofanynewmate-
rialbusinessrisksintheforthcomingsixmonths.Fora
moredetailedreviewofmaterialrisksanduncertainty
factors,pleaserefertoeWork’sAnnualReport.
Subsequent eventsNosignificanteventshaveoccurredafterthereport-
ingperiod.
OutlookeWorkisreiteratingitsjudgementoftheoutlookfor
2015asstatedintheYear-endReportfor2014:
eWorkjudgesthatdemandontheconsultingmarket
willremainstrongin2015andthattheconsultingmar-
ketasawholewillgrow.Thiswouldimplyincreased
new consultant appointments and growing demand
for eWork’s standard contracts. eWork also expects
the consolidation trend to continue, both through
take-overcontractsandoutsourcingdeals.
eWork expects to keep outgrowing the underlying
consultantmarketbywinningnewstandardcontracts
andtakeovercontracts.ThismeansthateWorkjudges
thatithasgoodpotentialtoachievegoodsalesand
profitgrowthforthefullyear2015.
eWorkalsoexpectsthatitwillbepossibletosecure
newMSPdeals,whichifso,willmakeafurthercontri-
bution togrowth,albeitwithaneutralprofit impact
fortheyear.
Reporting calendar24July2015 InterimReportApril-June2015
22October2015 InterimReportJuly-September2015
Contacts for more informationZoranCovic,PresidentandCEO
+46(0)850605500,+46(0)706656517
MagnusEriksson,CFO,
+46(0)850605500,+46(0)733828480
ZoranCovic,PresidentandCEO
Stockholm,Sweden,22April2015
ThisReporthasnotbeenreviewedbythecompany’s
Auditor.
The information disclosed in this Interim Report is
mandatoryforeWorkScandinaviaAB(publ)topublish
pursuant to theSwedishSecuritiesMarketsAct. This
informationwillbesubmittedforpublicationat10:00
a.m.(CET)on22April2015.
1 Staffan Salén and family through companies; Salénia AB and Westindia AB.
2 Erik Åfors through companies; Ingo Invest AB.

6eWork Scandinavia AB Interim Report Q1 2015
Consolidated Statement of Comprehensive Income—Summary
SEK thousand NoteJan-Mar
2015Jan-Mar
2014Rolling 4 quarters
Apr 2014-Mar 2015Full year
2014
Operating income
Netsales 1 1,457,386 1,103,689 5,067,905 4,714,208
Otheroperatingincome 181 – 976 795
Total operating income 1,457,567 1,103,689 5,068,881 4,715,003
Operating costs
Costofconsultantsonassignment –1,388,348 –1,046,017 –4,820,425 –4,478,094
Otherexternalcosts –14,119 –10,761 –51,388 –48,030
Personnelcosts –37,673 –33,250 –140,185 –135,762
Depreciation,amortisationandimpair-mentofproperty,plant&equipmentandintangiblenon-currentassets –181 –243 –733 –795
Total operating costs –1,440,321 –1,090,271 –5,012,731 –4,662,681
Operating profit 17,246 13,418 56,150 52,322
Profit/loss from financial items
Netfinancialitems –16 141 401 558
Profit (loss) after financial items 17,230 13,559 56,551 52,880
Tax –3,878 –3,074 –12,350 –11,546
Profit for the period 13,352 10,485 44,201 41,334
Other comprehensive income/costs
Items that have been reclassified, or are reclassifiable, to profit or loss
Translationdifferencesontranslationofforeignoperationsfortheperiod –290 330 593 1,213
Other comprehensive income/costs for the period –290 330 593 1,213
COmPrehensive inCOme fOr The PeriOd 13,062 10,815 44,794 42,547
earnings per share
beforedilution(SEK) 0.79 0.62 2.60 2.43
afterdilution(SEK) 0.78 0.62 2.59 2.43
Numberofsharesoutstandingatendofthereportingperiod:
beforedilution(thousands) 16,984 16,984 16,984 16,984
afterdilution(thousands) 17,041 16,984 17,041 16,995
Averagenumberofoutstandingshares:
beforedilution(thousands) 16,984 16,984 16,984 16,984
afterdilution(thousands) 17,014 16,984 16,992 16,984

7eWork Scandinavia AB Interim Report Q1 2015
Consolidated Statement of Financial Position—Summary
SEK thousand 31 March 2015 31 March 2014 31 December 2014
AsseTs
non-current assets
Intangiblenon-currentassets 469 664 529
Property,plantandequipment 1,585 1,164 1,018
Non-currentreceivables 446 430 453
Deferredtaxasset 3,073 2,957 3,127
Total non-current assets 5,573 5,215 5,127
Current assets
Accountsreceivable—trade 1,453,954 1,088,647 1,229,172
Taxreceivables 5,062 3,625 4,681
Prepaidexpensesandaccruedincome 26,611 15,260 11,792
Otherreceivables 11,999 5,677 9,561
Cashandcashequivalents 123,661 111,711 190,506
Total current assets 1,621,287 1,224,920 1,445,712
TOTAl AsseTs 1,626,860 1,230,135 1,450,839
equiTy And liAbiliTies
equity
Sharecapital 2,207 2,207 2,207
Otherpaid-upcapital 62,526 62,416 62,526
Reserves –4,610 –5,203 –4,320
Retainedearningsincludingprofitfortheperiod 79,351 77,610 65,999
Total equity 139,474 137,030 126,412
Current liabilities
Accountspayable—trade 1,429,639 1,057,210 1,277,426
Otherliabilities 26,257 14,866 16,227
Accruedexpensesanddeferredincome 31,490 21,029 30,774
Total current liabilities 1,487,386 1,093,105 1,324,427
TOTAl equiTy And liAbiliTies 1,626,860 1,230,135 1,450,839

8eWork Scandinavia AB Interim Report Q1 2015
Consolidated Statement of Changes in Equity—Summary
SEK thousand Share capitalOther paid-
up capitalTranslation
reserve
Retained earn-ings incl. profit for the period Total equity
Opening equity, 1 Jan 2014 2,207 62,416 –5,533 67,125 126,215
Comprehensive income for the period
Profitfortheperiod 10,485 10,485
Othercomprehensiveincome/costs
fortheperiod 330 330
Comprehensive income for the period 330 10,485 10,815
Closing equity, 31 mar 2014 2,207 62,416 –5,203 77,610 137,030
Opening equity, 1 Apr 2014 2,207 62,416 –5,203 77,610 137,030
Comprehensive income for the period
Profitfortheperiod 30,849 30,849
Othercomprehensiveincome/costs
fortheperiod 883 883
Comprehensive income for the period 883 30,849 31,732
Transactions with the Group’s share-holders
Dividends –42,460 –42,460
Premiumsdepositedonissuingshare
warrants 110 110
Closing equity, 31 dec 2014 2,207 62,526 –4,320 65,999 126,412
Opening equity, 1 Jan 2015 2,207 62,526 –4,320 65,999 126,412
Comprehensive income for the period
Profitfortheperiod 13,352 13,352
Othercomprehensiveincome/costs
fortheperiod –290 –290
Comprehensive income for the period –290 13,352 13,062
Closing equity, 31 mar 2015 2,207 62,526 –4,610 79,351 139,474

9eWork Scandinavia AB Interim Report Q1 2015
Consolidated Statement of Cash Flows—Summary
SEK thousandJan-Mar
2015Jan-Mar
2014Rolling 4 quarters
Apr 2014-Mar 2015Full year
2014
Operating activities
Cashflowfromoperatingactivitiesbeforechangesinworkingcapital 13,138 6,704 43,393 36,959
Cashflowfromchangesinworkingcapital –79,140 –106,943 11,211 –16,592
Cash flow from operating activities –66,002 –100,239 54,604 20,367
Cashflowfrominvestingactivities –693 40 –983 –250
Cashflowfromfinancingactivities 0 0 –42,350 –42,350
Cash flow for the period –66,695 –100,199 11,271 –22,233
Cashandcashequivalentsatbeginningofperiod 190,506 211,616 111,711 211,616
Exchangeratedifference –150 294 679 1,123
Cash and cash equivalents at end of period 123,661 111,711 123,661 190,506

10eWork Scandinavia AB Interim Report Q1 2015
Key performance data per share
Jan-Mar2015
Jan-Mar 2014
Rolling 4 quartersApr 2014-Mar 2015
Full year 2014
Earningspersharebeforedilution 0.79 0.62 2.60 2.43
Earningspershareafterdilution 0.78 0.62 2.59 2.43
Equitypersharebeforedilution 8.2 8.1 8.2 7.4
Equitypershareafterdilution 8.2 8.1 8.2 7.4
Cashflowfromoperatingactivitiespersharebeforedilution –3.9 –5.9 3.2 1.2
Cashflowfromoperatingactivitiespershareafterdilution –3.9 –5.9 3.2 1.2
Numberofsharesoutstandingatendofthereportingperiodbeforedilution(thousands) 16,984 16,984 16,984 16,984
Numberofsharesoutstandingatendofthereportingperiodafterdilution(thousands) 17,041 16,984 17,041 16,995
Averagenumberofoutstandingsharesbeforedilution(thousands) 16,984 16,984 16,984 16,984
Averagenumberofoutstandingsharesafterdilution(thousands) 17,014 16,984 16,992 16,984
Key performance dataJan-Mar
2015Jan-Mar
2014Rolling 4 quarters
Apr 2014-Mar 2015Full year
2014
Salesgrowth,% 32.0 15.7 29.4 20.1
Operatingmargin,% 1.2 1.2 1.1 1.1
Returnonequity,% 38.6 31.8 38.6 32.7
Equitypershare 8.2 8.1 8.2 7.4
Cashflowfromoperatingactivitiespershare –3.9 –5.9 3.2 1.2
Equity/assetsratio,% 8.6 11.1 8.6 8.7
Acidtestratio,% 109 112 109 109
Averagenumberofemployees 163 148 160 157
Salesperemployee 8,952 7,457 31,674 30,027

11eWork Scandinavia AB Interim Report Q1 2015
Parent Company Income Statement
SEK thousandJan-Mar
2015Jan-Mar
2014Rolling 4 quarters
Apr 2014-Mar 2015Full year
2014
Operating income
Netsales 1,202,020 919,737 4,186,375 3,904,092
Otheroperatingincome 2,807 2,106 10,235 9,534
Total operating income 1,204,827 921,843 4,196,610 3,913,626
Operating costs
Costofconsultantsonassignment –1,147,915 –874,292 –3,993,074 –3,719,451
Otherexternalcosts –12,001 –9,421 –44,204 –41,624
Personnelcosts –28,840 –24,577 –105,670 –101,407
Depreciation,amortisationandimpairmentof
property,plant&equipmentandintangible
non-currentassets –147 –164 –604 –621
Total operating costs –1,188,903 –908,454 –4,143,552 –3,863,103
Operating profit 15,924 13,389 53,058 50,523
Profit/loss from financial items
Otherinterestincomeandsimilaritems 20 270 997 1,247
Interestexpenseandsimilaritems –196 –3 –310 –117
Profit after financial items 15,748 13,656 53,745 51,653
Tax –3,526 –3,064 –12,209 –11,747
Profit for the period * 12,222 10,592 41,536 39,906
* Profit for the period corresponds to comprehensive income for the period.

12eWork Scandinavia AB Interim Report Q1 2015
Parent Company Balance Sheet
Parent Company pledged assets and contingent liabilities
SEK thousand 31 March 2015 31 March 2014 31 December 2014
AsseTs
non-current assets
Intangiblenon-currentassets 469 664 529
Property,plantandequipment 1,058 774 611
Financial non-current assets
ParticipationsinGroupcompanies 19,392 19,392 19,392
Total financial non-current assets 19,392 19,392 19,392
Total non-current assets 20,919 20,830 20,532
Current assets
Accountsreceivable—trade 1,262,732 960,738 1,085,270
ReceivablesfromGroupcompanies 13,489 10,092 10,797
Taxreceivables 4,613 3,085 3,885
Otherreceivables 404 126 405
Prepaidexpensesandaccruedincome 14,221 9,056 6,722
Cashandbankbalances 94,784 74,404 162,171
Total current assets 1,390,243 1,057,501 1,269,250
TOTAl AsseTs 1,411,162 1,078,331 1,289,782
equiTy And liAbiliTies
equity
Restricted equity
Sharecapital(16,983,975shareswithparvalueofSEK0.13) 2,208 2,207 2,208
Statutoryreserve 6,355 6,355 6,355
Total restricted equity 8,563 8,562 8,563
Non-restricted equity
Sharepremiumreserve 56,566 56,455 56,566
Retainedearnings 61,140 63,694 21,234
Profitfortheperiod 12,222 10,592 39,906
Total non-restricted equity 129,928 130,741 117,706
Total equity 138,491 139,303 126,269
untaxed reserves -
Current liabilities
Accountspayable—trade 1,230,501 913,016 1,133,697
Otherliabilities 24,879 11,998 14,686
Accruedexpensesanddeferredincome 17,291 14,014 15,130
Total current liabilities 1,272,671 939,028 1,163,513
TOTAl equiTy And liAbiliTies 1,411,162 1,078,331 1,289,782
SEK thousand 31 March 2015 31 March 2014 31 December 2014
Pledged assets none none none
Contingent liabilities
Rentguarantees 923 923 923

13eWork Scandinavia AB Interim Report Q1 2015
Accounting principlesThe Interim Report for the Group has been prepared in accordance with IAS 34 Interim Financial Reporting and the appropriate provisions of the Swedish Annual Accounts Act. The Interim Report for the Parent Company has been prepared in accordance with the Swedish Annual Accounts Act. The same accounting principles and basis of calculation have been applied as in the Annual Report for 2014.
Note on the financial statements
1nOTe The Group’s operating segments
first quarter 2015 compared to 2014
Sweden Finland Denmark Norway Total
SEK thousandJan-Mar
2015Jan-Mar
2014Jan-Mar
2015Jan-Mar
2014Jan-Mar
2015Jan-Mar
2014Jan-Mar
2015Jan-Mar
2014Jan-Mar
2015Jan-Mar
2014
Incomefromclients 1,202,020 919,737 83,106 43,876 83,641 63,543 88,619 76,533 1,457,386 1,103,689
Profitpersegment 28,130 23,025 756 554 2,240 986 1,155 594 32,281 25,159
Group-wideexpenses –12,206 –9,636 –1,116 –816 –807 –665 –906 –624 –15,035 –11,741
Operating profit/loss 15,924 13,389 –360 –262 1,433 321 249 –30 17,246 13,418
Netfinancialitems - - - - - - - - –16 141
Profit/loss for the period before tax 17,230 13,559
eWork’s Business ConcepteWork’s business concept is to cost-efficiently provide the client with consultants who have the right specialist competence for each assignment, and to manage the related administration, quality assur-ance and follow-up. Correspondingly, consultants that sell their services via eWork are provided with stimulating and profitable assignments.
eWork’s Business modeleWork’s business model is based on the consultant broker model, which means eWork serves as an independent third party, matching consultants to the consultant purchaser’s assignment. It offers con-sultant purchasers effective purchasing processes, systems support and an independent, competitive selection that optimises access to, and management of, consultants. Consultants are not employed by eWork, but instead, eWork delivers a consultant network, where in practice, all the market’s consultants that operate in an in-demand specialism can join. eWork serves as contract counterparty for the client and consultant in a consulting assignment, dealing with all administration relating to the assignment.
eWork Scandinavia AB (publ). (corporate ID no. 556587-8708)Klarabergsgatan 60 • 111 21 Stockholm • Sweden • +46 (0)8 506 05500 • www.ework.se • e-mail: [email protected]
eWork Scandinavia AB is a complete consultant supplier with over 4,500 consultants on assignment within the fields of IT, telecoms, technology, and business development. eWork offers an
objective selection of specialists from the largest consultant network on the market with over 65,000 consultants, offering clients better pricing, quality and time efficiency. eWork has framework agreements
with more than 140 clients among the Nordic region’s leading companies active in most sectors.
The Company’s share is listed on NASDAQ OMX Stockholm.
Reshaping Consulting