Interim Report January–March 2012 - Securitas · 2014-12-03 · 2 Securitas AB Interim Report,...
23
Securitas AB Interim Report January–March 2012 Contents January–March summary ....... 2 Group development ............. 3 Development in the Group’s business segments .............. 4 Cash flow .......................... 8 Capital employed and financing ...................... 9 Acquisitions ..................... 10 Other significant events ....... 12 Risks and uncertainties ........ 12 Parent Company operations ....................... 13 Accounting principles ......... 14 Consolidated financial statements ...................... 15 Segment overview ............. 19 Notes ............................. 20 Parent Company ................ 22 Definitions ....................... 22 Financial information .......... 23 COMMENTS FROM THE PRESIDENT AND CEO The real sales growth including acquisitions continued to be strong and reached 9 percent for the first quarter, while the organic sales growth was slow at 1 percent. Some contract losses and reductions in existing customer contracts, but also our own cancellations of low margin contracts, impacted the quarter. The price increase negotiations takes time due to our need to achieve balance between price adjustments and wage cost increases. The operating margin was 0.3 percent behind previous year mainly for these reasons. I am confident that we will be able to achieve price increases on par with wage costs increases in the Group in 2012, supported among others by a so far successful price campaign in France and by an agreement of a revised collective bargaining agreement in Spain. We will continue to be restrictive on acquisitions until we have restored the financial target of free cash flow to net debt of 0.20. In spite of that, we made one major and important acquisition of the technology company Chillida in Spain. With this acquisition we create a technology hub that will strengthen our operations in Spain and Portugal, and allow us to offer higher value solutions to our customers. We have had a relatively weak start of the year, however I remain optimistic about 2012, supported by the actions taken and the acquisitions made in 2011, the ongoing work on managing the price/wage balance and by the pipeline of won or expected projects in quarters to come, even if the macro economic environment remains unpredictable. Alf Göransson President and Chief Executive Officer JANUARY–MARCH 2012 • Total sales MSEK 16 264 (14 775) • Organic sales growth 1 percent (3) • Operating margin 4.5 percent (4.8) • Earnings per share SEK 0.97 (1.01) • Free cash flow/net debt 0.12 (0.13)
Transcript of Interim Report January–March 2012 - Securitas · 2014-12-03 · 2 Securitas AB Interim Report,...

Securitas ABInterim ReportJanuary–March 2012
ContentsJanuary–March summary . . . . . . . 2Group development . . . . . . . . . . . . . 3 Development in the Group’s business segments . . . . . . . . . . . . . . 4 Cash flow . . . . . . . . . . . . . . . . . . . . . . . . . . 8 Capital employed and financing . . . . . . . . . . . . . . . . . . . . . . 9 Acquisitions . . . . . . . . . . . . . . . . . . . . . 10Other significant events . . . . . . . 12Risks and uncertainties . . . . . . . . 12 Parent Company operations . . . . . . . . . . . . . . . . . . . . . . . 13Accounting principles . . . . . . . . . 14Consolidated financial statements . . . . . . . . . . . . . . . . . . . . . . 15Segment overview . . . . . . . . . . . . . 19Notes . . . . . . . . . . . . . . . . . . . . . . . . . . . . . 20Parent Company . . . . . . . . . . . . . . . . 22Definitions . . . . . . . . . . . . . . . . . . . . . . . 22Financial information . . . . . . . . . . 23
COMMENTS FROM THE PRESIDENT AND CEO
The real sales growth including acquisitions continued to be strong and reached 9 percent for the first quarter, while the organic sales growth was slow at 1 percent. Some contract losses and reductions in existing customer contracts, but also our own cancellations of low margin contracts, impacted the quarter. The price increase negotiations takes time due to our need to achieve balance between price adjustments and wage cost increases. The operating margin was 0.3 percent behind previous year mainly for these reasons.
I am confident that we will be able to achieve price increases on par with wage costs increases in the Group in 2012, supported among others by a so far successful price campaign in France and by an agreement of a revised collective bargaining agreement in Spain.
We will continue to be restrictive on acquisitions until we have restored the financial target of free cash flow to net debt of 0.20. In spite of that, we made one major and important acquisition of the technology company Chillida in Spain. With this acquisition we create a technology hub that will strengthen our operations in Spain and Portugal, and allow us to offer higher value solutions to our customers.
We have had a relatively weak start of the year, however I remain optimistic about 2012, supported by the actions taken and the acquisitions made in 2011, the ongoing work on managing the price/wage balance and by the pipeline of won or expected projects in quarters to come, even if the macro economic environment remains unpredictable.
Alf GöranssonPresident and Chief Executive Officer
jANuARy–MARCH 2012
•Total sales MSEK 16 264 (14 775)
•Organic sales growth 1 percent (3)
•Operating margin 4.5 percent (4.8)
•Earnings per share SEK 0.97 (1.01)
•Free cash flow/net debt 0.12 (0.13)

2
Securitas AB Interim Report, January–March 2012
January–March summary
FINANCIAL SuMMARy
MSEK Q1 2012 Q1 2011Total
change, % Fy 2011Total
change, %
Sales 16 264 14 775 10 64 057 4
Organic sales growth, % 1 3 3
Real sales growth, including acquisitions, % 9 10 11
Operating income before amortization 734 712 3 3 385 –9
Operating margin, % 4.5 4.8 5.3
Real change, % 1 –3 –3
Income before taxes 508 527 –4 2 480 –16
Real change, % –6 –9 –11
Net income 357 370 –4 1 739 –16
Earnings per share (SEK) 0.97 1.01 –4 4.75 –17
ORGANIC SALES GROWTH AND OPERATING MARGIN DEVELOPMENT PER BuSINESS SEGMENT
%
Organic sales growth Operating margin
Q1 Q1
2012 2011* 2012 2011*
Security Services North America 1 4 4.6 5.3
Security Services Europe 0 1 3.9 3.9
Mobile and Monitoring 3 2 10.4 10.5
Security Services Ibero-America 2 7 4.8 5.4
Group 1 3 4.5 4.8
* Comparatives have been restated due to operations moved between the segments Security Services Europe, Mobile and Monitoring and Security Services Ibero-America. Refer to note 7 for restated segment information per quarter and accumulated 2011.

8 000
10 000
12 000
14 000
16 000
18 000
–4
–2
0
2
4
6
Q1 Q2 Q3 Q4 Q1
%MSEK
Organic sales growth, %
20112012
Group quarterly sales developmentGroup quarterly sales development
500
600
700
800
900
1 000
3.5
4.0
4.5
5.0
5.5
6.0
Q1 Q2 Q3 Q4 Q1
%MSEK
Operating margin, %
20112012
Group quarterly operating income development
Group quarterly operating income development
3
Securitas AB Interim Report, January–March 2012
Group development
jANuARy–MARCH 2012
Sales and market developmentSales amounted to MSEK 16 264 (14 775) and organic sales growth was 1 percent (3). Although supported by the leap day, the organic sales growth was below last year. This was reflected in all business segments, except in Mobile and Monitoring, and the main reason was previously lost or terminated contracts. In Security Services North America, the impact from negative net change in the contract portfolio hampered the organic sales growth. In Security Services Europe, the majority of the countries showed positive organic sales growth, but the negative effect from the contract losses in Belgium last year remained. Mobile and Monitoring had a better performance than last year. In Security Services Ibero-America the organic sales growth was negatively impacted by the development in Spain and Portugal, although in Latin America the organic sales growth was 25 percent.
Real sales growth, including acquisitions and adjusted for changes in exchange rates, was 9 percent (10).
Operating income before amortizationOperating income before amortization was MSEK 734 (712) which, adjusted for changes in exchange rates, represented an increase of 1 percent. The Group’s operating margin was 4.5 percent (4.8). The main reason for the decline compared to last year relates to Security Services North America, where a slow start of 2012 was reflected in the operating margin development. The operating margin in Security Services Europe as well as in Mobile and Monitoring was stable. In Security Services Ibero-America, the operating margin decreased due to the development in Spain and Portugal, while in Latin America the operating margin improved.
The price adjustments in the Group were slightly behind wage cost increases in the first quarter.
Operating income after amortizationAmortization of acquisition related intangible assets amounted to MSEK –64 (–44).
Acquisition related costs impacted the quarter by MSEK –28 (–32).
Financial income and expensesFinancial income and expenses amounted to MSEK –134 (–109). The finance net has been negatively impacted by the increase in net debt that took place mainly during last year.
Income before taxes Income before taxes was MSEK 508 (527). The real change was –6 percent.
Taxes, net income and earnings per shareThe Group’s tax rate was 29.8 percent (29.9).
Net income was MSEK 357 (370). Earnings per share amounted to SEK 0.97 (1.01).

1 000
2 000
3 000
4 000
5 000
6 000
–4
–2
0
2
4
6
Q1 Q2 Q3 Q4 Q1
%MSEK
Organic sales growth, %
20112012
Quarterly sales developmentQuarterly sales development
210
240
270
300
330
360
4.0
4.5
5.0
5.5
6.0
6.5
Q1 Q2 Q3 Q4 Q1
%MSEK
Operating margin, %
20112012
Quarterly operating income developmentQuarterly operating income development
Share of Group quarterly sales
Security Services North America 35%
Share of Group quarterly operating income
Security Services North America 36%
4
Securitas AB Interim Report, January–March 2012
Development in the Group’s business segments
SECuRITy SERVICES NORTH AMERICASecurity Services North America provides specialized security services in the uSA, Canada and Mexico and comprises 20 business units: one organization for national and global accounts, ten geographicalregionsandsixspecialtycustomersegments–manufacturing,federal government services, defense and aerospace, energy, healthcare and aviation – in the uSA, plus Canada, Mexico and Pinkerton Consulting & Investigations. In total, there are approximately 108 000 employees, about 600 branch managers and 97 geographical areas.
Security Services North America january–March january–December
MSEK 2012 2011 2011
Total sales 5 675 5 230 22 356
Organic sales growth, % 1 4 4
Operating income before amortization 263 275 1 270
Operating margin, % 4.6 5.3 5.7
Real change, % –8 8 2
January–March 2012Organic sales growth was 1 percent (4) in the quarter. The leap day had a positive impact in the quarter, while the negative organic sales growth in the customer segments defense and aerospace, federal government services and Pinkerton Consulting & Investigations hampered the organic sales growth. The loss of the large contract with an automotive customer in the US was offset by the large airport security contract started in Canada. The new sales rate in the quarter was relatively strong due to newly won contracts, such as a major contract won by the federal government services customer segment, starting up as of the second quarter. The sales of specialized security solutions as part of total sales amounted to 9 percent (6).
The operating margin was 4.6 percent (5.3), thus giving the first quarter of the year a slow start. The lower top line growth especially from the customer segments defense and aerospace, federal government services and Pinkerton Consulting & Investigations, had a negative impact on the operating margin. In the airport security contract in Canada, start up costs affected the operating margin with –0.1 percent, but the contract is expected to contribute in quarters to come.
The U.S. dollar exchange rate has strengthened and thus had a positive effect on the operating result in Swedish kronor. The real change was –8 percent in the quarter.
The client retention rate was 89 percent which is slightly lower compared to last year. The employee turnover rate in the U.S. was 45 percent (41).

2 000
3 000
4 000
5 000
6 000
7 000
–6
–4
–2
0
2
4
Q1 Q2 Q3 Q4 Q1
%MSEK
Organic sales growth, %
20112012
Quarterly sales developmentQuarterly sales development
50
100
150
200
250
300
0
1
2
3
4
5
Q1 Q2 Q3 Q4 Q1
%MSEK
Operating margin, %
20112012
Quarterly operating income developmentQuarterly operating income development
Share of Group quarterly sales
Security Services Europe 41%
Share of Group quarterly operating income
Security Services Europe 35%
5
Securitas AB Interim Report, January–March 2012
Development in the Group’s business segments
SECuRITy SERVICES EuROPESecuritas’ European guarding operations comprise Security Services Europe, which provides specialized security services for large and medium-sized customers in 27 countries and airport security in 14 countries. The organization has a combined total of more than 108 000 employeesandover700branchmanagers.
Security Services Europe january–March january–December
MSEK 2012 2011* 2011*
Total sales 6 662 6 022 26 112
Organic sales growth, % 0 1 0
Operating income before amortization 257 233 999
Operating margin, % 3.9 3.9 3.8
Real change, % 10 –13 –21
* Comparatives have been restated due to operations moved between the segments Security Services Europe, Mobile and Monitoring and Security Services Ibero-America. Refer to note 7 for restated segment information per quarter and accumulated 2011.
January–March 2012Organic sales growth was 0 percent (1) in the period where most countries had positive organic sales growth. The leap day had a positive impact in the quarter, while contract losses of Brussels Airport and the European Commission in Belgium last year impacted negatively. Securitas was awarded a five year contract with the European Parliament worth approximately MEUR 20 annually, starting in April. The security contract with Stockholm Arlanda Airport was retained and is worth approximately MSEK 600 over a three year period.
The operating margin was 3.9 percent (3.9). The majority of the countries show an improvement in operating margin. Belgium still suffers from previous contract losses. In the United Kingdom the result showed a good development, from negative last year to positive this year, in line with our acquisition plan.
The euro exchange rate had only a small negative impact on the operating income in Swedish kronor. The real change was 10 percent in the period.
The client retention rate was stable at 91 percent. The employee turnover rate was 27 percent (28**).
** The employee turnover rate of 2011 has changed due to the move of Portugal and Spain into Security Services Ibero-America.

1 100
1 200
1 300
1 400
1 500
1 600
–4
–2
0
2
4
6
Q1 Q2 Q3 Q4 Q1
%MSEK
Organic sales growth, %
20112012
Quarterly sales development
Quarterly operating income development
Share of Group quarterly sales
Mobile and Monitoring 10%
Share of Group quarterly operating income
Mobile and Monitoring 22%
120
140
160
180
200
220
9
10
11
12
13
14
Q1 Q2 Q3 Q4 Q1
%MSEK
Operating margin, %
20112012
Quarterly operating income development
6
Securitas AB Interim Report, January–March 2012
Development in the Group’s business segments
MOBILE AND MONITORINGMobile provides mobile security services for small and medium-sized businesses and residential sites, while Monitoring provides electronic alarm surveillance services. Mobile operates in 11 countriesacrossEuropeandhasapproximately9500employeesand215branchmanagersin 31areas.Monitoring,alsocalledSecuritasAlertServices,operatesin10countriesacrossEurope and has approximately 900 employees.
Mobile and Monitoring january–March january–December
MSEK 2012 2011* 2011*
Total sales 1 553 1 443 6 112
Organic sales growth, % 3 2 3
Operating income before amortization 162 152 732
Operating margin, % 10.4 10.5 12.0
Real change, % 6 –3 2
* Comparatives have been restated due to operations moved between the segments Security Services Europe, Mobile and Monitoring and Security Services Ibero-America. Refer to note 7 for restated segment information per quarter and accumulated 2011.
January–March 2012Organic sales growth was 3 percent (2). The majority of countries in the Mobile operation had positive organic sales growth. Two positive outliers were Belgium and Germany, showing strong organic sales growth also based on high extra sales. The United Kingdom suffered from previously lost contracts and had a negative organic sales growth. In France, the top line growth was positive however supported by acquisitions in 2011. In the Monitoring operation, all countries had positive organic sales growth, except in France where the sales growth was supported mainly by acquisitions in 2011. The organic sales growth is primarily driven by countries such as the Netherlands, Norway and Sweden. The operating margin was 10.4 percent (10.5). Delayed synergies from acquisitions in the Mobile operation impacted the business segment negatively, while the Monitoring operation improved margins compared to last year.
The real change in operating income in the business segment was 6 percent.
1 500
1 700
1 900
2 100
2 300
2 500
0
3
6
9
12
15
Q1 Q2 Q3 Q4 Q1
%MSEK
Organic sales growth, %
20112012
Quarterly sales development
60
80
100
120
140
160
3
4
5
6
7
8
Q1 Q2 Q3 Q4 Q1
%MSEK
Operating margin, %
20112012
Quarterly operating income developmentQuarterly operating income development
Share of Group quarterly sales
Security Services Ibero-America 14%
Share of Group quarterly operating income
Security Services Ibero-America 15%
7
Securitas AB Interim Report, January–March 2012
Development in the Group’s business segments
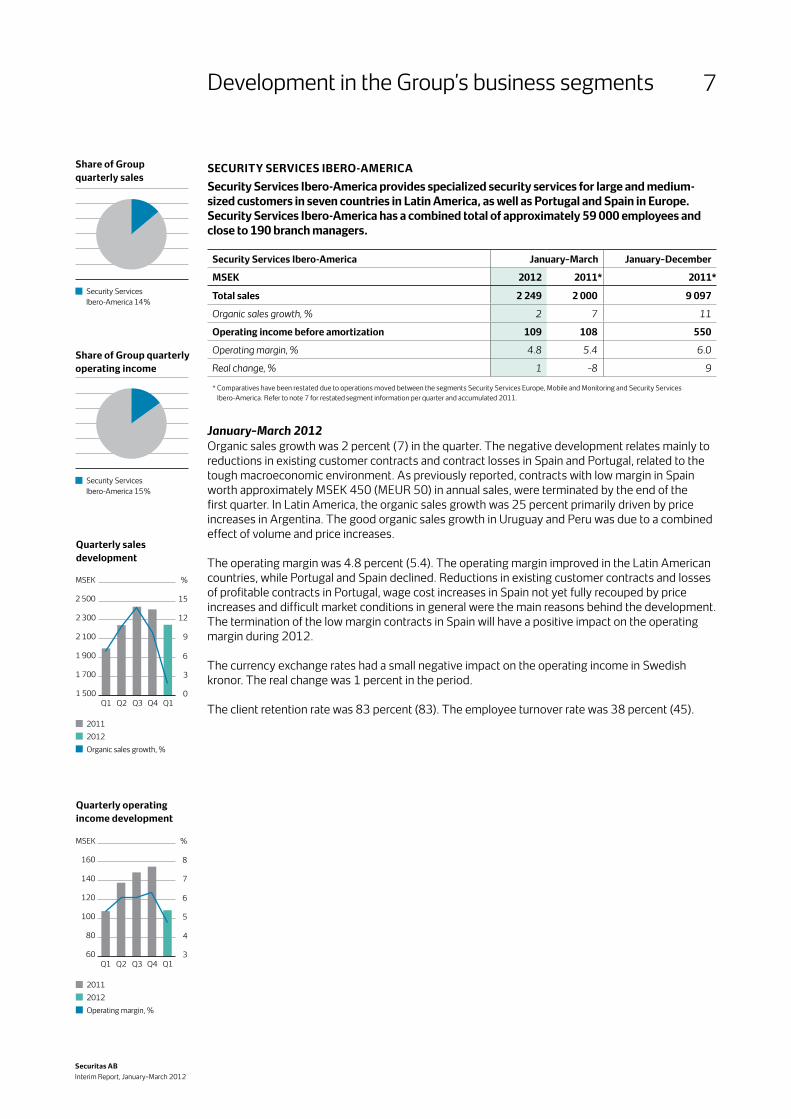
SECuRITy SERVICES IBERO-AMERICASecurity Services Ibero-America provides specialized security services for large and medium-sized customers in seven countries in Latin America, as well as Portugal and Spain in Europe. Security Services Ibero-America has a combined total of approximately 59 000 employees and close to 190 branch managers.
Security Services Ibero-America january–March january–December
MSEK 2012 2011* 2011*
Total sales 2 249 2 000 9 097
Organic sales growth, % 2 7 11
Operating income before amortization 109 108 550
Operating margin, % 4.8 5.4 6.0
Real change, % 1 –8 9
* Comparatives have been restated due to operations moved between the segments Security Services Europe, Mobile and Monitoring and Security Services Ibero-America. Refer to note 7 for restated segment information per quarter and accumulated 2011.
January–March 2012Organic sales growth was 2 percent (7) in the quarter. The negative development relates mainly to reductions in existing customer contracts and contract losses in Spain and Portugal, related to the tough macroeconomic environment. As previously reported, contracts with low margin in Spain worth approximately MSEK 450 (MEUR 50) in annual sales, were terminated by the end of the first quarter. In Latin America, the organic sales growth was 25 percent primarily driven by price increases in Argentina. The good organic sales growth in Uruguay and Peru was due to a combined effect of volume and price increases.
The operating margin was 4.8 percent (5.4). The operating margin improved in the Latin American countries, while Portugal and Spain declined. Reductions in existing customer contracts and losses of profitable contracts in Portugal, wage cost increases in Spain not yet fully recouped by price increases and difficult market conditions in general were the main reasons behind the development. The termination of the low margin contracts in Spain will have a positive impact on the operating margin during 2012.
The currency exchange rates had a small negative impact on the operating income in Swedish kronor. The real change was 1 percent in the period.
The client retention rate was 83 percent (83). The employee turnover rate was 38 percent (45).

–600
–400
–200
0
200
400
600
800
1 000
Q1 Q2 Q3 Q4 Q1
MSEK
20112012
Quarterly free cash flowQuarterly free cash flow
8
Securitas AB Interim Report, January–March 2012
Cash flow
January–March 2012Operating income before amortization amounted to MSEK 734 (712). Net investments in non-current tangible and intangible assets amounted to MSEK –13 (2).
Changes in accounts receivable were MSEK –41 (–258). Changes in other operating capital employed were MSEK –502 (–647).
Cash flow from operating activities amounted to MSEK 178 (–191), equivalent to 24 percent (–27) of operating income before amortization.
Financial income and expenses paid amounted to MSEK –79 (–61). Current taxes paid amounted to MSEK –107 (–109).
Free cash flow was MSEK –8 (–361), equivalent to –2 percent (–78) of adjusted income.
Cash flow from investing activities, acquisitions, was MSEK –181 (–137).
Cash flow from items affecting comparability was MSEK –15 (–7).
Cash flow from financing activities was MSEK 2 185 (1 319).
Cash flow for the period was MSEK 1 981 (814).

0.04
0.06
0.08
0.10
0.12
0.14
0.16
Q1 2011
Q2 2011
Q3 2011
Q4 2011
Q1 2012
Free cash flow/Net debtFree cash flow/net debt
Net debt development
MSEKjan 1, 2012 –10 349Free cash flow –8Acquisitions –181IAC payments –15Change in net debt –204Translation and revaluation 188Mar 31, 2012 –10 365
9
Securitas AB Interim Report, January–March 2012
Capital employed and financing
Capital employed as of March 31, 2012The Group’s operating capital employed was MSEK 3 546 (3 145 as of December 31, 2011) corresponding to 5 percent of sales (5 as of December 31, 2011) adjusted for the full year sales figures of acquired units.
Acquisitions decreased operating capital employed by MSEK –28 during the period.
Acquisitions increased consolidated goodwill by MSEK 70. Adjusted for negative translation differences of MSEK –332, total goodwill for the Group amounted to MSEK 14 465 (14 727 as of December 31, 2011).
Acquisitions have increased acquisition related intangible assets by MSEK 102. After amortization of MSEK –64 and negative translation differences of MSEK –25, acquisition related intangible assets amounted to MSEK 1 587 (1 574 as of December 31, 2011).
The Group’s total capital employed was MSEK 19 706 (19 554 as of December 31, 2011). The translation of foreign capital employed to Swedish kronor decreased the Group’s capital employed by MSEK –413.
The return on capital employed was 17 percent (17 as of December 31, 2011).
Financing as of March 31, 2012The Group’s net debt amounted to MSEK 10 365 (10 349 as of December 31, 2011). Acquisitions and acquisition related payments increased the Group’s net debt by MSEK 181, of which purchase price payments accounted for MSEK 154, assumed net debt for MSEK –7 and acquisition related costs paid accounted for MSEK 34. The Group’s net debt decreased by MSEK –184 due to the translation of net debt in foreign currency to Swedish kronor.
The free cash flow to net debt ratio amounted to 0.12 (0.13).
The main capital market instruments drawn as of the end of March 2012 were twelve bonds issued under the Group’s Euro Medium Term Note Program. These comprised of the 6.50 percent MEUR 500 Eurobond maturing in 2013. A MSEK 400 domestic three year bond was issued in January 2012 with a coupon of 3.45 percent. In February 2012, a MEUR 350 five year Eurobond was issued with a coupon of 2.75 percent.
There are nine floating rate notes (FRN’s). Five of these FRN’s are denominated in SEK, totalling MSEK 3 600 and maturing between the fourth quarter 2012 and the first quarter 2015. Another three FRN’s are denominated in USD, one for MUSD 40, one for MUSD 62 and one for MUSD 50. The MUSD 50 matures in the fourth quarter 2018 and the remaining MUSD 102 of these loans mature in 2015. There is also a MEUR 45 FRN maturing in 2014.
In addition to the above, Securitas has access to committed bank financing through a Revolving Credit Facility (RCF) which was signed with 12 Swedish and international banks in January 2011. The RCF comprises two respective tranches of MUSD 550 and MEUR 420 (MUSD 1 100 in total), and matures in 2016. At the end of the first quarter there was a total of MUSD 150 drawn on the facility, leaving MUSD 950 equivalent available and undrawn. There is MUSD 30 in outstanding Letters of Credit issued under another RCF maturing in June 2012.
The Group also has access to uncommitted bank borrowings and a MSEK 5 000 Swedish Commercial Paper Program for short-term borrowing needs.
Securitas has ample liquidity headroom under the committed credit facilities in line with established policies, which combined with the strong free cash flow generation means that the future liquidity requirements for the Company’s operations are met.
Further information on the credit facilities as of March 31, 2012 is provided in note 8.
In April 2012, Standard and Poor’s retained their rating for Securitas at BBB+ / A2. They did, however, revise their rating outlook from stable to negative. Standard and Poor’s regard the Group’s liquidity position as strong.
The interest cover ratio amounted to 5.8 (7.2).
Shareholders’ equity amounted to MSEK 9 341 (9 205 as of December 31, 2011). The translation of foreign assets and liabilities into Swedish kronor decreased shareholders’ equity by MSEK –229 after taking into account net investment hedging of MSEK –40 and MSEK –189 before net investment hedging. Refer to the statement of comprehensive income on page 15 for further information.
The total number of outstanding shares amounted to 365 058 897 as of March 31, 2012.

10
Securitas AB Interim Report, January–March 2012
Acquisitions
ACQuISITIONS jANuARy–MARCH 2012 (MSEK)
CompanyBusiness segment 1)
Included from
Acquired share 2)
Annual sales 3)
Enter -prise
value 4) Goodwill
Acq. related
intangible assets
Opening balance 14 727 1 574MPL Beveiligingsdiensten, the Netherlands
Security Services Europe / Mobile and Monitoring Jan 1 100 97 46 14 48
Protect, Croatia 7) 8) Security Services Europe Jan 4 85 73 38 23 23
Other acquisitions 5) 7) 136 63 33 31
Total acquisitions january–March 2012 306 147 70 6) 102Amortization of acquisition related intangible assets - –64
Exchange rate differences –332 –25
Closing balance 14 465 1 5871) Refers to business segment with main responsibility for the acquisition. 2) Refers to voting rights for acquisitions in the form of share purchase agreements. For asset deals no voting rights are stated.3) Estimated annual sales. 4) Purchase price paid plus acquired net debt, but excluding any deferred considerations.5) Related to other acquisitions for the period and updated previous year acquisition calculations for the following entities: Security
Consultants Group, the USA, Pinkerton C&I India, India, Adept Security, Services Sweden, PSS, Services Norway, Siemens Monitoring (contract portfolio), Services Denmark, Assistance Sécurité Gardiennage, Services France, Pole Protection Provence, VIF, Europinter, ECSAS Gardiennage, APSG and NEO, Mobile France, Chubb Security Personnel, Services UK, WOP Protect, Switzerland, Pesti, Austria, Cobelguard, Services Belgium, Alarmvision (contract portfolio), Alert Services Belgium, Sector Alarm (contract portfolio), Alert Services the Netherlands, Trezor (contract portfolio), Alert Services Poland, Sistem FTO, Serbia, Adria Ipon Security, Bosnia and Herzegovina, Zvonimir Security, Croatia, Pandyr, Uruguay, Ubiq, Peru, Seguricorp, Chile, SGT Seguridad and Alfa Seguridad, Ecuador. Related also to deferred considerations paid in the USA, Latvia, Turkey, Argentina, Chile and Thailand.
6) Goodwill that is expected to be tax deductible amounts to MSEK 8.7) Deferred considerations have been recognized mainly based on an assessment of the future profitability development in the acquired
entities for an agreed period. The net of new deferred considerations and payments made from previously recognized deferred considerations in the Group was MSEK 22. Total deferred considerations, short-term and long-term, in the Group’s balance sheet amount to MSEK 627.
8) No non-controlling interests have been accounted for since Securitas has an option to buy the remaining shares and the seller has an option to sell the remaining shares. Consequently, 100 percent of the company is consolidated.
All acquisition calculations are finalized no later than one year after the acquisition is made. Transactions with non-controlling interests are specified in the statement of changes in share-holders’ equity on page 17. Transaction costs and revaluation of deferred considerations can be found in note 4 on page 20.
MPL Beveiligingsdiensten, the NetherlandsSecuritas has acquired all shares in the security services company MPL Beveiligingsdiensten in the Netherlands. MPL Beveiligingsdiensten has approximately 180 employees, and is operating both within specialized guarding and mobile services.
Protect, CroatiaSecuritas has acquired 85 percent of the shares in the security services company Protect in Croatia. There is an agreement to acquire the remaining 15 percent of the shares in 2013. Protect has approximately 600 employees. The company is mainly operating in guarding services.

11
Securitas AB Interim Report, January–March 2012
ACQuISITIONS AFTER THE FIRST QuARTER
Chillida Sistemas de Seguridad, Spain Securitas has acquired the technology security company Chillida Sistemas de Seguridad in Spain. Enterprise value is estimated to MSEK 205 (MEUR 23). In 2011, Chillida had annual sales of approximately MSEK 265 (MEUR 30) and approximately 200 employees. The company has operations in the entire country, with most of the employees located in Valencia and Madrid. Chilllida is focused in technology security operations like installations, monitoring and maintenance.
Trailback, ArgentinaSecuritas has acquired the technical solutions company Trailback, specialized in GPS solutions, in Argentina. Enterprise value is estimated to MSEK 34 (MARS 22). Trailback has developed a tailor-made solution based on GPS and provides services for tracking to a wide range of customer segments. The company has annual sales of approximately MSEK 14 (MARS 9) and 44 employees.
PT Environmental Indokarya, IndonesiaSecuritas has acquired the security services company PT Environmental Indokarya in Indonesia. Enterprise value is estimated to MSEK 19 (MIDR 26 400). PT Environmental Indokarya has annual sales of approximately MSEK 37 (MIDR 51 400) and approximately 1 200 employees. The company is the major security services company in guarding services to embassies in Indonesia.
Acquisitions

12
Securitas AB Interim Report, January–March 2012
Risks and uncertainties
Risk management is necessary in order for Securitas to be able to fulfill its strategies and achieve its corporate objectives. Securitas’ risks fall into three main categories; contract risk, operational assignment risk and financial risks. Securitas approach to enterprise risk management is described in more detail in the Annual Report for 2011.
In the preparation of financial reports the Board of Directors and Group Management are required to make estimates and judgments. These estimates and judgments impact the statement of income and balance sheet as well as disclosures such as contingent liabilities. Actual results may differ from these estimates and judgments under different circumstances and conditions.
For the forthcoming nine-month period, the financial impact of certain previously recognized items affecting comparability, provisions and contingent liabilities, as described in the Annual Report for 2011 and if applicable above under the heading “Other significant events”, may vary from the current financial estimates and provisions made by management. This could affect the Group’s profitability and financial position.
Other significant events
For critical estimates and judgments and contingent liabilities refer to pages 86–87 and page 123 in the Annual Report 2011. If no significant events have occurred relating to the information in the Annual Report, no further comments are made in the Interim Report for the respective case.
Spain – overtime compensation The Spanish Supreme Court has issued a ruling that provides guidelines on the computation of overtime compensation. Based on such guidelines the management deems the current provisions as sufficient for the exposure.
For further information regarding the current provisions refer to pages 121–122 in the Annual Report 2011.

13
Securitas AB Interim Report, January–March 2012
Parent Company operations
The Group’s Parent Company, Securitas AB, is not involved in any operating activities. Securitas AB provides Group Management and support functions for the Group.
January–March 2012The Parent Company’s income amounted to MSEK 247 (244) and mainly relates to license fees and other income from subsidiaries. Financial income and expenses amounted to MSEK 127 (198). Income before taxes amounted to MSEK 265 (346). As of March 31, 2012The Parent Company’s non-current assets amounted to MSEK 39 849 (38 709 as of December 31, 2011) and mainly comprise shares in subsidiaries of MSEK 38 905 (37 853 as of December 31, 2011). Current assets amounted to MSEK 6 593 (8 111 as of December 31, 2011) of which liquid funds amounted to MSEK 1 772 (5 as of December 31, 2011). The increase of liquid funds is explained by the Eurobond loan issued in February 2012.
Shareholders’ equity amounted to MSEK 23 519 (23 343 as of December 31, 2011).
The Parent Company’s liabilities amounted to MSEK 22 923 (23 477 as of December 31, 2011) and mainly consist of interest-bearing debt.
For further information, refer to the Parent Company’s condensed financial statements on page 22.

14
Securitas AB Interim Report, January–March 2012
Accounting principles
This interim report has been prepared in accordance with IAS 34 Interim Financial Reporting and the Swedish Annual Accounts Act.
Securitas’ consolidated financial statements are prepared in accordance with International Financial Reporting Standards (IFRS) as endorsed by the European Union, the Swedish Annual Accounts Act and the Swedish Financial Reporting Board’s standard RFR 1 Supplementary Accounting Rules for Groups. The most important accounting principles under IFRS, which is the basis for the prepara-tion of this interim report, can be found in note 2 on pages 77 to 83 in the Annual Report for 2011. The accounting principles are also available on the Group’s website www.securitas.com under the section Investor Relations— Financials — Accounting Principles.
The Parent Company’s financial statements are prepared in accordance with the Swedish Annual Accounts Act and the Swedish Financial Reporting Board’s standard RFR 2 Accounting for Legal Entities. The most important accounting principles used by the Parent Company can be found in note 39 on page 129 in the Annual Report for 2011.
There have been no changes in the Group’s or the Parent Company’s accounting principles compared to the accounting principles described in note 2 and note 39 in the Annual Report for 2011.
Stockholm, May 7, 2012
Alf GöranssonPresident and Chief Executive Officer
This report has not been reviewed by the Company’s auditors.

15
Securitas AB Interim Report, January–March 2012
STATEMENT OF INCOMEMSEK jan–Mar 2012 jan–Mar 2011 jan–Dec 2011 jan–Dec 2010Sales 15 122.3 13 846.6 58 995.6 59 097.5Sales, acquired business 1 142.0 928.3 5 061.5 2 242.3Total sales 16 264.3 14 774.9 64 057.1 61 339.8Organic sales growth, % 1) 1 3 3 1Production expenses –13 544.1 –12 232.5 –52 977.4 –50 076.0Gross income 2 720.2 2 542.4 11 079.7 11 263.8Selling and administrative expenses –1 989.1 –1 832.3 –7 766.9 –7 551.3Other operating income 2) 3.1 2.8 74.3 12.7Share in income of associated companies 3) 0.2 –0.5 –2.4 –1.0Operating income before amortization 734.4 712.4 3 384.7 3 724.2Operating margin, % 4.5 4.8 5.3 6.1Amortization of acquisition related intangible assets –63.5 –44.3 –218.2 –164.3Acquisition related costs 4) –28.5 –31.6 –193.5 –89.6Operating income after amortization 642.4 636.5 2 973.0 3 470.3Financial income and expenses 5) –134.5 –109.3 –493.0 –502.3Income before taxes 507.9 527.2 2 480.0 2 968.0Net margin, % 3.1 3.6 3.9 4.8Current taxes –134.8 –136.6 –680.1 –735.7Deferred taxes –16.6 –21.0 –61.3 –151.5Net income for the period 356.5 369.6 1 738.6 2 080.8
Whereof attributable to:Equity holders of the Parent Company 355.9 368.6 1 735.7 2 083.1Non-controlling interests 0.6 1.0 2.9 –2.3
Earnings per share before dilution (SEK) 0.97 1.01 4.75 5.71Earnings per share after dilution (SEK) 0.97 1.01 4.75 5.71
STATEMENT OF COMPREHENSIVE INCOMEMSEK jan–Mar 2012 jan–Mar 2011 jan–Dec 2011 jan–Dec 2010Net income for the period 356.5 369.6 1 738.6 2 080.8
Other comprehensive incomeActuarial gains and losses and effects of minimum funding requirement net of tax 87.3 23.2 –270.3 –117.9Cash flow hedges net of tax 1.7 5.7 3.2 53.2Net investment hedges –40.2 –97.7 36.1 361.0Translation differences –189.1 –331.3 –129.2 –1 232.2Other comprehensive income for the period 6) –140.3 –400.1 –360.2 –935.9Total comprehensive income for the period 216.2 –30.5 1 378.4 1 144.9
Whereof attributable to:Equity holders of the Parent Company 215.5 –31.6 1 376.1 1 147.6Non-controlling interests 0.7 1.1 2.3 –2.7
Notes 1– 6 refer to pages 20–21.
Consolidated financial statements

16
Securitas AB Interim Report, January–March 2012
STATEMENT OF CASH FLOWOperatingcashflowMSEK jan–Mar 2012 jan–Mar 2011 jan–Dec 2011 jan–Dec 2010Operating income before amortization 734.4 712.4 3 384.7 3 724.2Investments in non-current tangible and intangible assets –249.0 –216.7 –1 009.8 –901.9Reversal of depreciation 235.3 218.6 902.0 900.7Change in accounts receivable –40.6 –258.5 –722.6 –768.4Change in other operating capital employed –501.7 –647.1 –446.9 312.8Cash flow from operating activities 178.4 –191.3 2 107.4 3 267.4Cash flow from operating activities, % 24 –27 62 88Financial income and expenses paid –79.2 –61.3 –475.1 –521.7Current taxes paid –106.8 –108.4 –763.9 –735.1Free cash flow –7.6 –361.0 868.4 2 010.6Free cash flow, % –2 –78 39 81Cash flow from investing activities, acquisitions –181.0 –137.2 –1 882.0 –1 359.0Cash flow from items affecting comparability –14.9 –7.3 –23.7 –62.5Cash flow from financing activities 2 184.9 1 319.9 968.9 –424.5Cash flow for the period 1 981.4 814.4 –68.4 164.6
CashflowMSEK jan–Mar 2012 jan–Mar 2011 jan–Dec 2011 jan–Dec 2010Cash flow from operations 192.7 –184.6 1 674.5 2 784.7Cash flow from investing activities –396.2 –320.9 –2 711.8 –2 195.6Cash flow from financing activities 2 184.9 1 319.9 968.9 –424.5Cash flow for the period 1 981.4 814.4 –68.4 164.6
Change in net debt MSEK jan–Mar 2012 jan–Mar 2011 jan–Dec 2011 jan–Dec 2010Opening balance –10 348.8 –8 208.9 –8 208.9 –8 387.7Cash flow for the period 1 981.4 814.4 –68.4 164.6Change in loans –2 184.9 –1 319.9 –2 064.1 –670.7Change in net debt before revaluation and translation differences –203.5 –505.5 –2 132.5 –506.1Revaluation of financial instruments 5) 3.3 10.2 7.5 67.6Translation differences 183.6 319.8 –14.9 617.3Change in net debt –16.6 –175.5 –2 139.9 178.8Closing balance –10 365.4 –8 384.4 –10 348.8 –8 208.9
Note 5 refers to page 20.
Consolidated financial statements

17
Securitas AB Interim Report, January–March 2012
CAPITAL EMPLOyED AND FINANCINGMSEK Mar 31, 2012 Dec 31, 2011 Mar 31, 2011 Dec 31, 2010Operating capital employed 3 545.6 3 144.6 3 250.8 2 586.5Operating capital employed as % of sales 5 5 5 4Return on operating capital employed, % 102 118 124 143Goodwill 14 465.3 14 727.4 12 808.8 13 338.8Acquisition related intangible assets 1 587.4 1 574.1 1 051.2 1 096.5Shares in associated companies 108.1 108.2 114.5 125.6Capital employed 19 706.4 19 554.3 17 225.3 17 147.4Return on capital employed, % 17 17 21 22Net debt –10 365.4 –10 348.8 –8 384.4 –8 208.9Shareholders’ equity 9 341.0 9 205.5 8 840.9 8 938.5Net debt equity ratio/multiple 1.11 1.12 0.95 0.92
BALANCE SHEETMSEK Mar 31, 2012 Dec 31, 2011 Mar 31, 2011 Dec 31, 2010ASSETSNon-current assetsGoodwill 14 465.3 14 727.4 12 808.8 13 338.8Acquisition related intangible assets 1 587.4 1 574.1 1 051.2 1 096.5Other intangible assets 344.7 330.5 273.3 272.4Tangible non-current assets 2 348.6 2 361.8 2 230.9 2 283.9Shares in associated companies 108.1 108.2 114.5 125.6Non-interest bearing financial non-current assets 2 009.3 2 045.3 1 666.1 1 737.7Interest bearing financial non-current assets 178.5 189.5 160.5 205.7Total non-current assets 21 041.9 21 336.8 18 305.3 19 060.6Current assetsNon-interest bearing current assets 13 198.2 12 802.6 11 513.5 11 169.5Other interest bearing current assets 33.5 19.6 49.9 68.3Liquid funds 4 464.0 2 507.4 3 343.5 2 586.9Total current assets 17 695.7 15 329.6 14 906.9 13 824.7TOTAL ASSETS 38 737.6 36 666.4 33 212.2 32 885.3
MSEK Mar 31, 2012 Dec 31, 2011 Mar 31, 2011 Dec 31, 2010SHAREHOLDERS’ EQuITy AND LIABILITIESShareholders’ equityAttributable to equity holders of the Parent Company 9 341.4 9 202.9 8 836.7 8 935.4Non-controlling interests –0.4 2.6 4.2 3.1Total shareholders’ equity 9 341.0 9 205.5 8 840.9 8 938.5Equity ratio, % 24 25 27 27Long-term liabilitiesNon-interest bearing long-term liabilities 525.7 532.1 312.5 282.3Interest bearing long-term liabilities 12 543.4 8 576.8 7 046.6 7 202.6Non-interest bearing provisions 2 879.4 3 122.6 2 341.2 2 564.8Total long-term liabilities 15 948.5 12 231.5 9 700.3 10 049.7Current liabilitiesNon-interest bearing current liabilities and provisions 10 950.1 10 740.9 9 779.3 10 029.9Interest bearing current liabilities 2 498.0 4 488.5 4 891.7 3 867.2Total current liabilities 13 448.1 15 229.4 14 671.0 13 897.1TOTAL SHAREHOLDERS’ EQuITy AND LIABILITIES 38 737.6 36 666.4 33 212.2 32 885.3
CHANGES IN SHAREHOLDERS’ EQuITyMar 31, 2012 Dec 31, 2011 Mar 31, 2011
Attributable to equity
holders of the Parent Company
Non- controlling
interests Total
Attributable to equity
holders of the Parent Company
Non- controlling
interests Total
Attributable to equity
holders of the Parent Company
Non- controlling
interests TotalMSEKOpening balance january 1, 2012/2011 9 202.9 2.6 9 205.5 8 935.4 3.1 8 938.5 8 935.4 3.1 8 938.5Total comprehensive income for the period 215.5 0.7 216.2 1 376.1 2.3 1 378.4 –31.6 1.1 –30.5Transactions with non-controlling interests –24.9 –3.7 –28.6 - –2.8 –2.8 - - -Share based incentive scheme –52.1 - –52.11) –13.4 - –13.4 –67.1 - –67.1Dividend paid to the shareholders of the Parent Company - - - –1 095.2 - –1 095.2 - - -Closing balance March 31/December 31, 2012/2011 9 341.4 –0.4 9 341.0 9 202.9 2.6 9 205.5 8 836.7 4.2 8 840.9
1) Refers to a swap agreement in Securitas AB shares, hedging the share portion of Securitas share based incentive scheme 2011.
Consolidated financial statements
18
Securitas AB Interim Report, January–March 2012
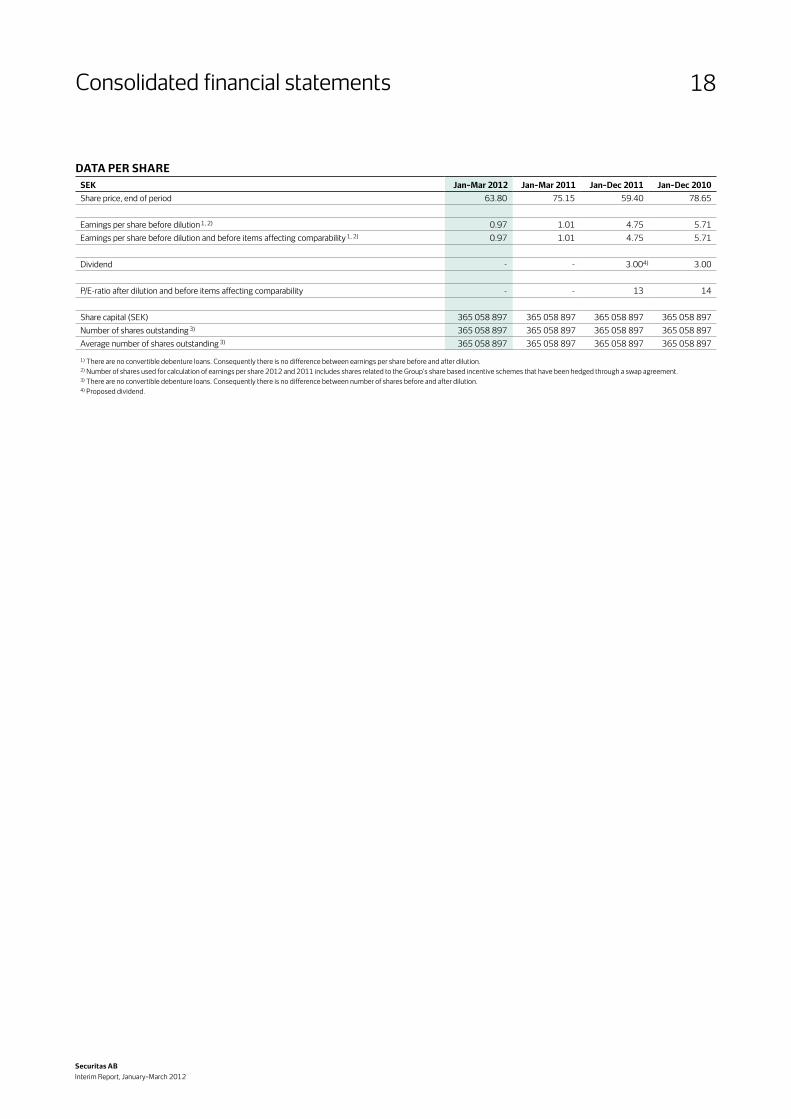
DATA PER SHARESEK jan–Mar 2012 jan–Mar 2011 jan–Dec 2011 jan–Dec 2010Share price, end of period 63.80 75.15 59.40 78.65
Earnings per share before dilution 1, 2) 0.97 1.01 4.75 5.71Earnings per share before dilution and before items affecting comparability 1, 2) 0.97 1.01 4.75 5.71
Dividend - - 3.004) 3.00
P/E-ratio after dilution and before items affecting comparability - - 13 14
Share capital (SEK) 365 058 897 365 058 897 365 058 897 365 058 897Number of shares outstanding 3) 365 058 897 365 058 897 365 058 897 365 058 897Average number of shares outstanding 3) 365 058 897 365 058 897 365 058 897 365 058 897
1) There are no convertible debenture loans. Consequently there is no difference between earnings per share before and after dilution.2) Number of shares used for calculation of earnings per share 2012 and 2011 includes shares related to the Group's share based incentive schemes that have been hedged through a swap agreement.3) There are no convertible debenture loans. Consequently there is no difference between number of shares before and after dilution.4) Proposed dividend.
Consolidated financial statements

19
Securitas AB Interim Report, January–March 2012
jANuARy–MARCH 2012
MSEK
Security Services
North America
Security Services
Europe
Mobile and
Monitoring
Security Services
Ibero-America Other Eliminations GroupSales, external 5 675 6 640 1 493 2 249 207 - 16 264Sales, intra-group - 22 60 - - –82 -Total sales 5 675 6 662 1 553 2 249 207 –82 16 264Organic sales growth, % 1 0 3 2 - - 1Operating income before amortization 263 257 162 109 –57 - 734of which share in income of associated companies - - - - 0 - 0Operating margin, % 4.6 3.9 10.4 4.8 - - 4.5Amortization of acquisition related intangible assets –8 –23 –13 –17 –3 - –64Acquisition related costs –3 –13 –4 –7 –1 - –28Operating income after amortization 252 221 145 85 –61 - 642Financial income and expenses - - - - - - –134Income before taxes - - - - - - 508
jANuARy–MARCH 2011
MSEK
Security Services
North America
Security Services Europe 1)
Mobile and
Monitoring 1)
Security Services
Ibero-America 1) Other Eliminations GroupSales, external 5 230 6 002 1 387 2 000 156 - 14 775Sales, intra-group - 20 56 - - –76 -Total sales 5 230 6 022 1 443 2 000 156 –76 14 775Organic sales growth, % 4 1 2 7 - - 3Operating income before amortization 275 233 152 108 –56 - 712of which share in income of associated companies - - - - 0 - 0Operating margin, % 5.3 3.9 10.5 5.4 - - 4.8Amortization of acquisition related intangible assets –6 –13 –11 –12 –2 - –44Acquisition related costs –2 –26 –2 –1 –1 - –32Operating income after amortization 267 194 139 95 –59 - 636Financial income and expenses - - - - - - –109Income before taxes - - - - - - 527
1) Comparatives have been restated due to operations moved between the segments Security Services Europe, Mobile and Monitoring and Security Services Ibero-America. Refer to note 7 for restated
segment information per quarter and accumulated 2011.
Segment overview January–March 2012 and 2011

20
Securitas AB Interim Report, January–March 2012
Note 1 Organic sales growthThe calculation of organic sales growth (and the specification of currency changes on operating income and income before taxes) is specified below:
Sales, MSEKjan–Mar jan–Mar jan–Mar
2012 2011 %Total sales 16 264 14 775 10Acquisitions/divestitures –1 142 –16Currency change from 2011 –221 -Organic sales 14 901 14 759 1
Operating income, MSEK jan–Mar jan–Mar jan–Mar
2012 2011 %Operating income 734 712 3Currency change from 2011 –12 -Currency adjusted operating income 722 712 1
Income before taxes, MSEK jan–Mar jan–Mar jan–Mar
2012 2011 %Income before taxes 508 527 –4Currency change from 2011 –11 -Currency adjusted income before taxes 497 527 –6
Note 2 Other operating incomeOther operating income in the first quarter 2012 and 2011 consists in its entirety of trade mark fees from Securitas Direct AB.
Note 3 Share in income of associated companiesSecuritas recognizes share in income of associated companies depending on the purpose of the investment. · Associated companies that have been acquired to contribute to the operations (operational) are included in operating income before amortization.· Associated companies that have been acquired as part of the financing of the Group (financial investments) are included in income before taxes as a separate line within
the finance net. Currently, Securitas has no associated companies recognized as financial investments.
Associated companies classified as operational:
MSEK jan–Mar 2012 jan–Mar 2011 jan–Dec 2011 jan–Dec 2010Walsons Services PVT Ltd –0.3 –0.7 –4.3 –1.8Long Hai Security 0.5 0.2 1.9 0.8Shareinincomeofassociatedcompaniesincludedinoperating incomebeforeamortization 0.2 –0.5 –2.4 –1.0
Note 4 Acquisition related costs
MSEK jan–Mar 2012 jan–Mar 2011 jan–Dec 2011 jan–Dec 2010Restructuring and integration costs –18.0 –15.3 –135.3 –48.3Transaction costs –3.6 –17.8 –65.1 –41.3Revaluation of deferred considerations –6.9 1.5 6.9 -Acquisition related costs –28.5 –31.6 –193.5 –89.6
Note 5 Revaluation of financial instruments
MSEK jan–Mar 2012 jan–Mar 2011 jan–Dec 2011 jan–Dec 2010Recognized in the statement of incomeRevaluation of financial instruments 1.0 2.5 3.1 –4.5Deferred tax –0.3 –0.7 –0.8 1.2Impact on net income 0.7 1.8 2.3 –3.3
Recognized in the statement of comprehensive incomeCash flow hedges 2.3 7.7 4.4 72.1Deferred tax –0.6 –2.0 –1.2 –18.9Cash flow hedges net of tax 1.7 5.7 3.2 53.2
Total revaluation before tax 3.3 10.2 7.5 67.6Total deferred tax –0.9 –2.7 –2.0 –17.7Total revaluation after tax 2.4 7.5 5.5 49.9
The amount disclosed in the specification of change in net debt is the total revaluation before tax.
Notes
21
Securitas AB Interim Report, January–March 2012
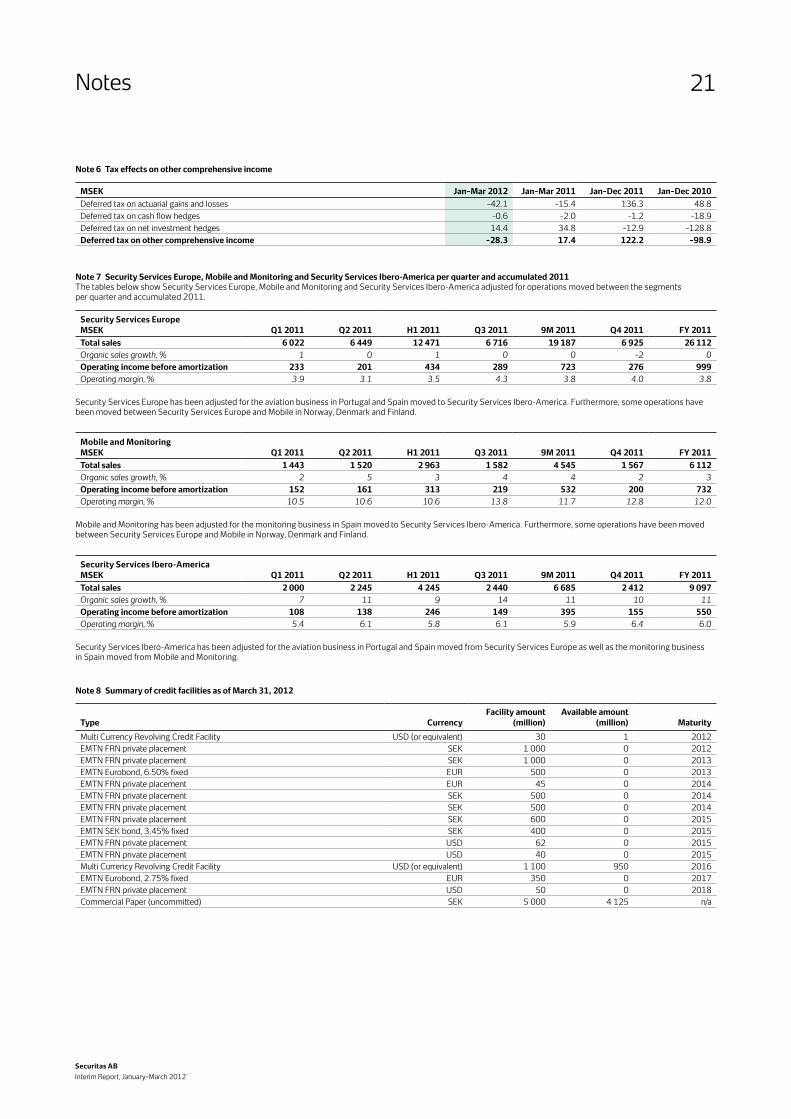
Note 6 Tax effects on other comprehensive income
MSEK jan–Mar 2012 jan–Mar 2011 jan–Dec 2011 jan–Dec 2010Deferred tax on actuarial gains and losses –42.1 –15.4 136.3 48.8Deferred tax on cash flow hedges –0.6 –2.0 –1.2 –18.9Deferred tax on net investment hedges 14.4 34.8 –12.9 –128.8Deferred tax on other comprehensive income –28.3 17.4 122.2 –98.9
Note 7 Security Services Europe, Mobile and Monitoring and Security Services Ibero-America per quarter and accumulated 2011The tables below show Security Services Europe, Mobile and Monitoring and Security Services Ibero-America adjusted for operations moved between the segments per quarter and accumulated 2011.
Security Services Europe MSEK Q1 2011 Q2 2011 H1 2011 Q3 2011 9M 2011 Q4 2011 Fy 2011Total sales 6 022 6 449 12 471 6 716 19 187 6 925 26 112Organic sales growth, % 1 0 1 0 0 –2 0Operating income before amortization 233 201 434 289 723 276 999Operating margin, % 3.9 3.1 3.5 4.3 3.8 4.0 3.8
Security Services Europe has been adjusted for the aviation business in Portugal and Spain moved to Security Services Ibero-America. Furthermore, some operations have been moved between Security Services Europe and Mobile in Norway, Denmark and Finland.
Mobile and Monitoring MSEK Q1 2011 Q2 2011 H1 2011 Q3 2011 9M 2011 Q4 2011 Fy 2011Total sales 1 443 1 520 2 963 1 582 4 545 1 567 6 112Organic sales growth, % 2 5 3 4 4 2 3Operating income before amortization 152 161 313 219 532 200 732Operating margin, % 10.5 10.6 10.6 13.8 11.7 12.8 12.0
Mobile and Monitoring has been adjusted for the monitoring business in Spain moved to Security Services Ibero-America. Furthermore, some operations have been moved between Security Services Europe and Mobile in Norway, Denmark and Finland.
Security Services Ibero-America MSEK Q1 2011 Q2 2011 H1 2011 Q3 2011 9M 2011 Q4 2011 Fy 2011Total sales 2 000 2 245 4 245 2 440 6 685 2 412 9 097Organic sales growth, % 7 11 9 14 11 10 11Operating income before amortization 108 138 246 149 395 155 550Operating margin, % 5.4 6.1 5.8 6.1 5.9 6.4 6.0
Security Services Ibero-America has been adjusted for the aviation business in Portugal and Spain moved from Security Services Europe as well as the monitoring business in Spain moved from Mobile and Monitoring.
Note 8 Summary of credit facilities as of March 31, 2012
Type Currency Facility amount
(million)Available amount
(million) MaturityMulti Currency Revolving Credit Facility USD (or equivalent) 30 1 2012EMTN FRN private placement SEK 1 000 0 2012EMTN FRN private placement SEK 1 000 0 2013EMTN Eurobond, 6.50% fixed EUR 500 0 2013EMTN FRN private placement EUR 45 0 2014EMTN FRN private placement SEK 500 0 2014EMTN FRN private placement SEK 500 0 2014EMTN FRN private placement SEK 600 0 2015EMTN SEK bond, 3.45% fixed SEK 400 0 2015EMTN FRN private placement USD 62 0 2015EMTN FRN private placement USD 40 0 2015Multi Currency Revolving Credit Facility USD (or equivalent) 1 100 950 2016EMTN Eurobond, 2.75% fixed EUR 350 0 2017EMTN FRN private placement USD 50 0 2018Commercial Paper (uncommitted) SEK 5 000 4 125 n/a
Notes

22
Securitas AB Interim Report, January–March 2012
STATEMENT OF INCOMEMSEK jan–Mar 2012 jan–Mar 2011License fees and other income 247.3 244.4Gross income 247.3 244.4Administrative expenses –109.3 –96.7Operating income 138.0 147.7Financial income and expenses 127.1 197.8Income before taxes 265.1 345.5Taxes –4.8 –7.5Net income for the period 260.3 338.0
BALANCE SHEETMSEK Mar 31, 2012 Dec 31, 2011ASSETSNon-current assetsShares in subsidiaries 38 905.0 37 852.7Shares in associated companies 112.1 112.1Other non-interest bearing non-current assets 281.1 197.3Interest bearing financial non-current assets 550.8 547.2Total non-current assets 39 849.0 38 709.3Current assetsNon-interest bearing current assets 698.0 4 947.3Other interest bearing current assets 4 123.2 3 158.6Liquid funds 1 771.5 5.4Total current assets 6 592.7 8 111.3TOTAL ASSETS 46 441.7 46 820.6
SHAREHOLDERS’ EQuITy AND LIABILITIESShareholders’ equityRestricted equity 7 727.7 7 727.7Non-restricted equity 15 791.6 15 615.7Total shareholders’ equity 23 519.3 23 343.4Long-term liabilitiesNon-interest bearing long-term liabilities/provisions 140.9 128.4Interest bearing long-term liabilities 12 400.8 8 430.2Total long-term liabilities 12 541.7 8 558.6Current liabilitiesNon-interest bearing current liabilities 1 114.6 755.9Interest bearing current liabilities 9 266.1 14 162.7Total current liabilities 10 380.7 14 918.6TOTAL SHAREHOLDERS’ EQuITy AND LIABILITIES 46 441.7 46 820.6
Parent Company
DefinitionsInterest coverage ratioOperating income before amortization (rolling 12 months) plus interest income (rolling 12 months) in relation to interest expenses (rolling 12 months).
Free cash flow, %Free cash flow as a percentage of adjusted income (operating income before amortization adjusted for financial income and expenses, excluding revaluation of financial instruments, and current taxes).
Free cash flow in relation to net debtFree cash flow (rolling 12 months) in relation to closing balance net debt.
Operating capital employed as % of total salesOperating capital employed as a percentage of total sales adjusted for the full-year sales of acquired entities.
Return on operating capital employed, %Operating income before amortization (rolling 12 months) plus items affecting comparability (rolling 12 months) as a percentage of the average balance of operating capital employed.
Return on capital employed, %Operating income before amortization (rolling 12 months) plus items affecting comparability (rolling 12 months) as a percentage of closing balance of capital employed.
Net debt equity ratio, multipleNet debt in relation to shareholders’ equity.

23
Securitas AB Interim Report, January–March 2012
PRESENTATION OF THE INTERIM REPORT
Analysts and media are invited to participate in a telephone conference on May 7, 2012 at 14:00 p.m.(CET) where Securitas CEO Alf Göransson will present the report and answer questions. The telephone conference will also be audio cast live via Securitas web. No information meeting will take place at Securitas headquarters at Lindhagensplan in Stockholm.
To participate in the telephone conference, please dial in five minutes prior to the start of the conference call:
The United States: + 1 866 458 4087Sweden: + 46 (0) 8 505 598 53United Kingdom: + 44 (0) 203 043 2436
To follow the audio cast of the telephone conference via the web, please follow the link www.securitas.com/webcasts.
A recorded version of the audio cast will be available at www.securitas.com/webcasts after the telephone conference.
FOR FuRTHER INFORMATION, PLEASE CONTACT:
Micaela Sjökvist, Head of Investor Relations, + 46 10 470 3013Gisela Lindstrand, Senior Vice President Corporate Communications and Public Affairs, + 46 10 470 3011
FINANCIAL INFORMATION CALENDAR
Securitas will release financial information for 2012 as follows:
January–June 2012: August 8, 2012
January–September 2012: November 7, 2012
January–December 2012: February 8, 2013
Securitas ABP.O. Box 12307 SE-102 28 Stockholm SwedenTel +46 10 470 3000Fax +46 10 470 3122www.securitas.comVisiting address: Lindhagensplan 70
Corporate registration number 556302–7241
Securitas is a global knowledge leader in security. From a broad range of services of specialized guarding, technology solutions and consulting and inves-tigations, we customize offerings that are suited to the individual customer’s needs, in order to deliver the most effective security solutions. Everywhere from small stores to airports, our 300 000 employees are making a difference.
Securitas AB discloses the information provided herein pursuant to the Securities Markets Act and/or the Financial Instruments Trading Act. The information was submitted for publication at 13.00 p.m. (CET) on Monday, May 7, 2012.
Financial information