INTERIM REPORT JANUARY-MARCH 2015 - Saab …¥kan Buskhe President and CEO 24 April 2015 INTERIM...
19
Håkan Buskhe President and CEO 24 April 2015 INTERIM REPORT JANUARY-MARCH 2015 Magnus Örnberg EVP and CFO SAAB NAVIGATING THE NORDICS
Transcript of INTERIM REPORT JANUARY-MARCH 2015 - Saab …¥kan Buskhe President and CEO 24 April 2015 INTERIM...

Håkan Buskhe President and CEO
24 April 2015
INTERIM REPORT JANUARY-MARCH 2015
Magnus Örnberg EVP and CFO
SAAB NAVIGATING THE NORDICS
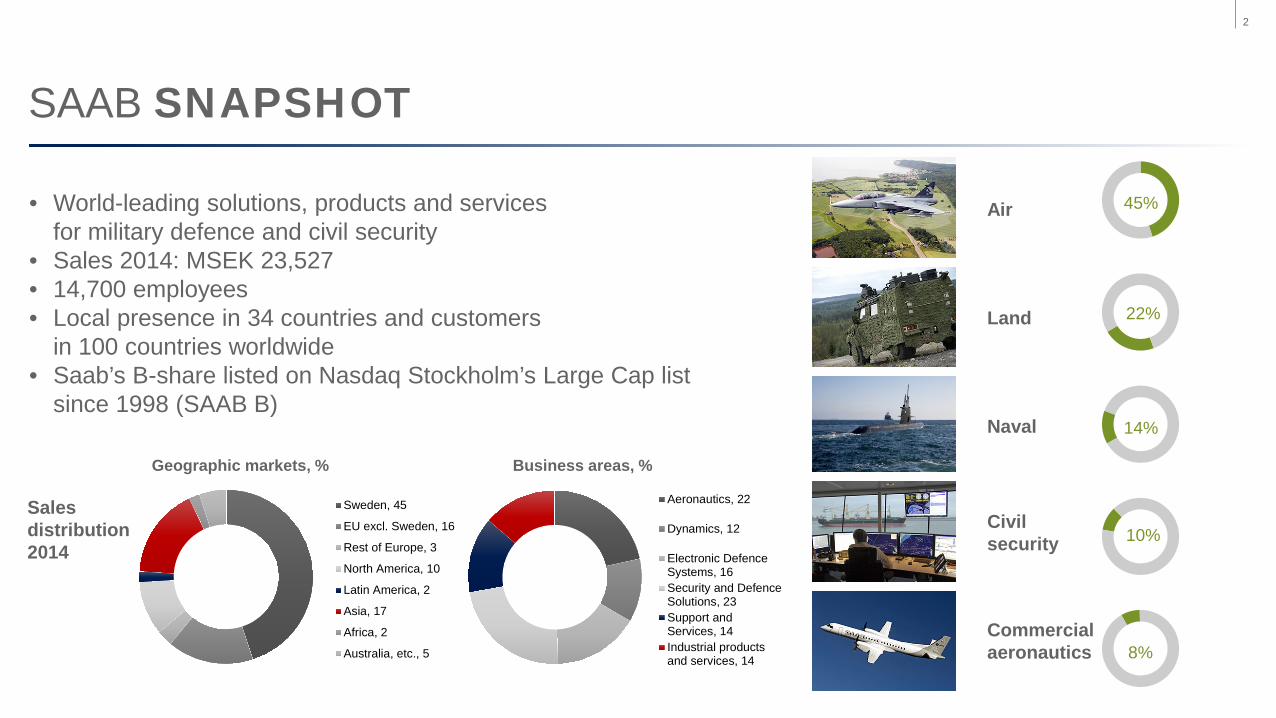
SAAB SNAPSHOT
• World-leading solutions, products and services for military defence and civil security
• Sales 2014: MSEK 23,527 • 14,700 employees • Local presence in 34 countries and customers
in 100 countries worldwide • Saab’s B-share listed on Nasdaq Stockholm’s Large Cap list
since 1998 (SAAB B)
Sales distribution 2014
Sweden, 45
EU excl. Sweden, 16
Rest of Europe, 3
North America, 10
Latin America, 2
Asia, 17
Africa, 2
Australia, etc., 5
Geographic markets, % Business areas, %
Aeronautics, 22
Dynamics, 12
Electronic DefenceSystems, 16Security and DefenceSolutions, 23Support andServices, 14Industrial productsand services, 14
Air
Land
Naval
Civil security
Commercial aeronautics
10%
8%
45%
22%
14%
2

AT THE FOREFRONT OF CHANGE
1941 First B17 delivered
1979 First RBS 15 ordered
1990 First laser simulator BT 46
1961 Viggen introduced
1955 Draken first flight
2002 First contract NLAW
1993 First Gripen delivered
2005 Neuron contract
2006 Saab 2000 A&EW
2008 First flight Gripen Demo
2014 Carl-Gustaf M4 launch
2011 RBS 70 NG launch
3
1990 Saab Automobile independent company
1937 Saab founded
2000 Celsius acquired
2005 Grintek acquired
2007 SeaEye Marine acquired
2012 HITT acquired
2014 TKMS Kockums acquired
1894 Alfred Nobel acquires Bofors
1646 Bofors founded
1948 First Carl-Gustaf order
1998 StriC in operation
1950- Development of fighter radar
1970- Development of Giraffe radar family
1980- Development of Arthur
1990- Sea Giraffe AMB launched
2006 Ericsson Microwave Systems acquired
1987 Celsius
1989 Kockums AB
1999 HDW
2005 ThyssenKrupp
1679 Örlogsvarvet Karlskrona
1840 Kockums Malmö
1977 Svenska Varv

SAAB’S BROAD OFFERING
4

SAAB – ORGANISATION
AERONAUTICS DYNAMICS ELECTRONIC DEFENCE SYSTEMS
SECURITY AND DEFENCE SOLUTIONS
SUPPORT AND SERVICES
INDUSTRIAL PRODUCTS AND SERVICES
BUSINESS AREAS MARKET AREAS
Nordic & Baltic
Latin America
Europe, Middle East
& Africa
Asia Pacific
North America
CEO
GROUP FUNCTIONS
5

GLOBAL DEFENCE MATERIEL MARKET
North America 36%
Latin America 3%
Nordic & Baltic 1%
EMEA3) 27%
Russia1) 4%
China1) 12%
APAC2) 17%
1.0%
2.2%
1.5%
3.0%
1.5%
6.0%
2.7% X%
X%
Share of global defence procurement market, 2016-2020 (constant USD)
Compound annual growth rate, 2016-2020 (constant USD) Source: IHS Group, December 2014
1)Defence market not approached by Saab 2)Excl. China 3)Excl. Russia
6

2015 STARTED ACCORDING TO PLAN
• Order bookings on a good level
• Defence market remains challenging
• Swedish Government announced intention to acquire two A26 submarines
• T-X development according to plan
• Successful deployment of Remote Tower at Örnsköldsvik airport in Sweden
• Contract with Brazil on weapon acquisition for Gripen NG
7

FINANCIAL KEY DATA
MSEK
Jan-Mar
2015 Jan-Mar
2014 Change Full year
2014
Order bookings 4,800 4,078 18% 22,602
Order backlog 59,811 58,608 2% 60,128
Sales 5,389 5,280 2% 23,527
Operating income 210 270 -22% 1,659
Operating margin 3.9% 5.1% 7.1%
Net income 90 176 -49% 1,168
Free cash flow -941 -316 -1,094
8

ORDER BACKLOG
Order backlog duration, SEK bn 31 Mar 2015 31 Dec 2014 31 Mar 2014 2015: 15.1 2015: 17.8 2014: 15.4 2016: 11.1 2016: 10.2 2015: 10.7 2017: 6.2 2017: 5.7 2016: 7.8 2018: 4.6 2018: 5.6 2017: 5.1 After 2018: 22.8 After 2018: 20.8 After 2017: 19.6 Total: 59.8 Total: 60.1 Total: 58.6
0
10 000
20 000
30 000
40 000
50 000
60 000
70 000
'05 '06 '07 '08 '09 '10 '11 '12 '13 '14 Q1'15
MSE
K
Order backlog development
60%
40%
Order backlog distribution
SwedenRoW
9
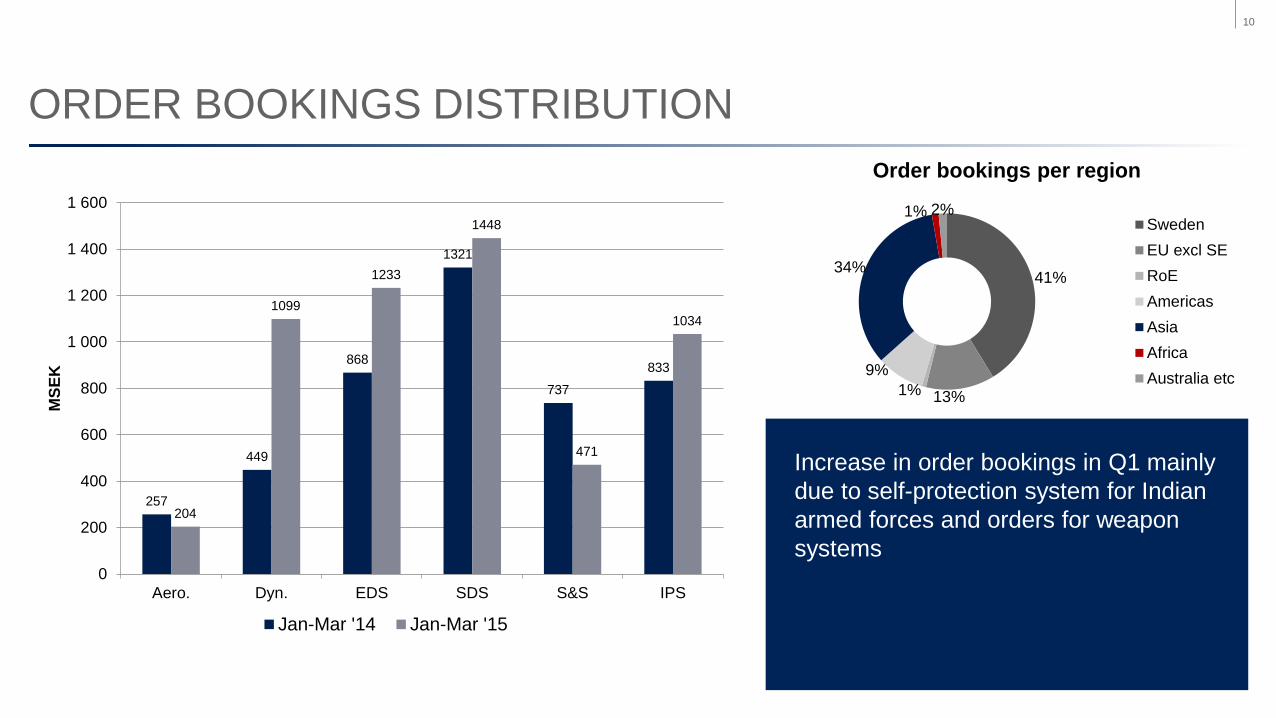
ORDER BOOKINGS DISTRIBUTION
Increase in order bookings in Q1 mainly due to self-protection system for Indian armed forces and orders for weapon systems
257
449
868
1321
737
833
204
1099
1233
1448
471
1034
0
200
400
600
800
1 000
1 200
1 400
1 600
Aero. Dyn. EDS SDS S&S IPS
MSE
K
Jan-Mar '14 Jan-Mar '15
41%
13% 1% 9%
34%
1% 2%
Order bookings per region
SwedenEU excl SERoEAmericasAsiaAfricaAustralia etc
10

SALES 1 328
716
852
1 156
839 787
1 098
628
875
1 292
929 866
0
200
400
600
800
1 000
1 200
1 400
Aero. Dyn. EDS SDS S&S IPS
MSE
K
Jan-Mar '14 Jan-Mar '15
49%
17%
2%
10%
2%
16% 2% 4%
Sales per region Sweden
EU excl SE
RoE
North America
Latin America
Asia
Africa
Australia etc
Aeronautics decrease due to transition from development to production
Increase in SDS mainly related to underwater business
S&S good pace in small and mid-sized projects
11

OPERATING INCOME
107
28
-25
-12
87
12
54
-28
29
64
83
34
-40
-20
0
20
40
60
80
100
120
Aero. Dyn. EDS SDS S&S IPS
MSE
K
Jan-Mar '14 Jan-Mar '15
8.1% 4.9% 3.9% -4.5% -2.9% 3.3% -1.0% 5.0% 10.4% 8.9% 1.5% 3.9%
12

CASH FLOW
Jan-Mar 2015 MSEK Cash flow from operating activities before changes in working capital
340
Change in working capital -920 Investing activities -225 Operational cash flow -805
Tax and other financial items -133 Acquisitions and sale of subsidiaries
-3
Free cash flow -941
-1200
-1000
-800
-600
-400
-200
0
200
400
600
Cash flow from
operating activities before
changes in working capital
Change in working capital
Investing activities
Tax and other
financial item
Acq. and sale of
subsidiaries
13

STRATEGY FOR INNOVATIVE SOLUTIONS
• Come closer to customers in key markets
• Develop innovative solutions in priority product areas with good potential
• Continue to improve efficiency
• Continuously develop leaders and employees while continuing to build a culture that encourages performance, engagement and diversity
14

1995 2000 2005 2010 2015 2020+ 1990
HUNGARIAN AIR FORCE Leased 12 Gripen C and 2 Gripen D
SOUTH AFRICAN AIR FORCE Purchased 17 Gripen C and 9 Gripen D
SWEDISH AIR FORCE Purchased 105 Gripen A and 13 Gripen B
Purchased 75 Gripen C and 25 Gripen D
Purchased 60 Gripen E
Thai Air Force Purchased 8 Gripen C and 4 Gripen D
UK Empire Test Pilot School Leased 1 Gripen D
Czech Republic Air Force Leased 12 Gripen C and 2 Gripen D
Brazilian Air Force Purchased 28 Gripen NG and 8 Gripen F
Slovakian Air Force Selected Gripen
GRIPEN’S WORLDWIDE CUSTOMERS
15 COMPANY RESTRICTED | NOT EXPORT CONTROLLED | NOT CLASSIFIED
© Saab

FINANCIAL GOALS Sales
Average organic sales growth of 5% per year over a business cycle. In 2014, organic sales declined by -3% (-2).
Operating margin
Average operating margin (EBIT) of at least 10% per year over a business cycle. In 2014, the operating margin (EBIT) was 7.1% (5.7).
Equity/assets ratio
The equity/assets ratio will exceed 30%. At year-end 2014, the equity/assets ratio was 38.5% (44.0).
Dividend
The long-term dividend goal is to distribute 20–40% of net income to the shareholders over a business cycle.
0
5
10
15
20
25
'10 '11 '12 '13 '14
SE
K b
n
0%
10%
20%
30%
40%
50%
'10 '11 '12 '13 '140%2%4%6%8%
10%12%14%
'10 '11 '12 '13 '140
1
2
3
4
5
'10 '11 '12 '13 '14
SE
K
16

PROFITABLE GROWTH
0
10
20
30
40
50
60
70
80
90
100
2008 2009 2010 2011 2012 2013 2014 2015
SEK
bn
Order backlog development
Incl. order for Gripen to Brazil
0
5
10
15
20
25
30
2008 2009 2010 2011 2012 2013 2014
SEK
bn
Sales
17

OUTLOOK STATEMENT 2015
• In 2015, we estimate sales to increase more than Saab’s long-term goal: annual organic sales growth of 5 per cent.
• The operating margin 2015 excluding material non-recurring items is expected to be in line with the operating margin in 2014. In 2015, increased internally funded research and development efforts within Aeronautics will have a negative impact on the operating margin.
18