INTERIM REPORT FOR 2006 SEASON · Figure 13 Series of plans showing the distribution of Teigncombe...
32
THE DARTMOOR ARCHAEOLOGY AND BRACKEN PROJECT INTERIM REPORT FOR 2006 SEASON
Transcript of INTERIM REPORT FOR 2006 SEASON · Figure 13 Series of plans showing the distribution of Teigncombe...

THE DARTMOOR
ARCHAEOLOGY AND BRACKEN PROJECT
INTERIM REPORT FOR 2006 SEASON

2
First published in Great Britain in 2007 by
Sandy Gerrard
Brynarfon Farm
Garnant
Ammanford
Carmarthenshire
Wales
SA18 1JU
Copyright © Sandy Gerrard
List of Figures Front Cover The team showing off the one that did not get away. This bracken plant measured a staggering 3.61m
high.
Figure 1 Location map showing the relative positions of the round houses
Table 1 Summary of information relating to the two Teigncombe round houses
Figure 2 Chart showing in ascending order the number of plants per square metre at Trowlesworthy and
Teigncombe
Figure 3 Chart showing the average height of bracken plants at Trowlesworthy and Teigncombe
Figure 4 Chart showing the total height of stipes within each square metre at Trowlesworthy and Teigncombe
Figure 5 Series of plans showing the distribution of Teigncombe II bracken plants taller than 3m, 3.1m, 3.2m and
over 3.3m high
Figure 6 Series of plans showing the distribution of Teigncombe II bracken plants taller than 2.7m, 2.8m and 2.9m
Figure 7 Series of plans showing the distribution of Teigncombe II bracken plants taller than 2.4m, 2.5m and 2.6m
Figure 8 Series of plans showing the distribution of Teigncombe II bracken plants taller than 2.1m, 2.2m and 2.3m
Figure 9 Series of plans showing the distribution of Teigncombe I bracken plants taller than 2.1m, 2.2m and 2.3m
Figure 10 Series of plans showing the distribution of Teigncombe II bracken plants taller than 1.8m, 1.9m and 2m
Figure 11 Series of plans showing the distribution of Teigncombe I bracken plants taller than 1.8m, 1.9m and 2m
Figure 12 Series of plans showing the distribution of Teigncombe II bracken plants taller than 1.5m, 1.6m and 1.7m
Figure 13 Series of plans showing the distribution of Teigncombe I bracken plants taller than 1.5m, 1.6m and 1.7m
Figure 14 Series of plans showing the distribution of Teigncombe II bracken plants shorter than 0.4m, 0.5m, 0.6m
and 0.7m
Figure 15 Series of plans showing the distribution of Teigncombe I bracken plants shorter than 0.4m, 0.5m, 0.6m
and 0.7m
Figure 16 Series of plans showing the distribution of Teigncombe II bracken plants shorter than 0.8m, 0.9m and 1m
Figure 17 Series of plans showing the distribution of Teigncombe I bracken plants shorter than 0.8m, 0.9m and 1m
Figure 18 Series of plans showing the distribution of Teigncombe II bracken plants shorter than 1.1m, 1.2m and
1.3m
Figure 19 Series of plans showing the distribution of Teigncombe I bracken plants shorter than 1.1m, 1.2m and 1.3m
Figure 20 Series of plans showing the distribution of Teigncombe II bracken plants shorter than 1.4m, 1.5m and
1.6m
Figure 21 Series of plans showing the distribution of Teigncombe I bracken plants shorter than 1.4m, 1.5m and
1.6m
Figure 22 Distribution of all Teigncombe II bracken plants
Figure 23 Graphs illustrating the height profile of plants expressed in percentages
Figure 24 Series of photographs illustrate the progress of bracken plant removal
Contents Introduction ……………………………………………………………………….............. 3
Teigncombe II …………………………………………………………………………..... 3
The Methodology ……………………………………………………………………….… 5
The Results ………………………………………………………………………………... 5
The Disappearing Bracken……………………………………………………………….... 28
Future ……………………………………………………………………………………… 30
Summary …………. ………………………………………………………………………. 31
Conclusion ……………………………………………………………………………….... 31
Acknowledgements …………………………………………………………………........... 32
References …………………………………………………………………………………. 32

3
Introduction
After 6 years of digging at Teigncombe the excavation of the round house was completed in
August 2005. Our work had generated a substantial quantity of information, only some of which had
been processed to generate the interim reports. Well over 100 drawings, 1500 artefacts, 289 soil
samples, 4,000 photographs, and tens of thousands items of data needed to be catalogued, examined
and analysed, The primary aim of the project has always been the examination of the impact of
bracken rhizomes on archaeological deposits and whilst the complexity of the site combined with the
relatively large number of artefacts belonging to five main periods is welcome and indeed has
considerably helped our research, it does mean that the post-excavation element of the project is going
to take considerably longer than was envisaged at the start. To date most of the photographs have been
catalogued, many context records completed and cross correlated, about half of the drawings completed
and most of the rhizome and stipe statistical analysis finished. Much however remains to be completed
and bringing together all the separate strands of data into a single easily manageable and accessible
body of information is going to take much more work.
As I have indicated previously, volunteer projects tend to develop a momentum of their own
and it is in many ways more difficult to stop them than to start or even re-start them. However, the
substantial post-excavation backlog means that further excavation is not an option until this back-log is
cleared. Apart from the obvious legal and professional reasons, the opportunity to complete the
analysis will allow us to establish whether further excavation work is needed for us to fulfil our goals.
Also this hiatus will allow time for further non-destructive work to help inform our developing strategy
and provide an opportunity to attract the resources needed for such an important piece of research. For
these reasons the 2006 and 2007 seasons at Teigncombe have and will concentrate on recording the
archaeology and bracken within a further site which has been identified as possibly providing important
insights into aspects of rhizome growth not available for study at Teigncombe I. For ease of
identification this house is hereafter referred to as Teigncombe II [Figure 1].
Teigncombe II
Teigncombe II stands 235m north of Teigncombe I at NGR SX 66772 86784 [Figure 1]. The house is
slightly smaller than Teigncombe I at 8.7m in diameter, but significantly (for our purposes) has not
been inundated with hillwash. This is significant because at Teigncombe I it was not possible to
examine the impact of the current bracken rhizome infestation on sensitive archaeological deposits
because the unusually deep deposits meant that the rhizome mat and sensitive archaeology were at
rather different depths. However, it was clear that a pre-hillwash accumulation infestation had
previously had an impact. Unfortunately because this evidence was ephemeral and therefore impossible
to quantify accurately this aspect of the research work at Teigncombe I was not wholly successful and
in many ways has highlighted the need for further work. For current management considerations it is
clearly important that a more typical site is selected so that we can establish the precise character of
damage being caused by current bracken growth. The same criteria for site selection apply as before,
apart from the one of choosing a site with a deep stratigraphy. From an archaeological viewpoint there
are considerable advantages in selecting a site within the same dispersed settlement. Our work will
enhance our understanding of this settlement and allow us to place into a broader context, the results
from the remarkable Teigncombe I. It has been suggested that our particularly painstaking approach to
the excavation of Teigncombe I has influenced the information retrieval rates and to a certain extent
only an excavation by the same group on a similar house within the same settlement will resolve this
issue and perhaps provide some guidance on how this type of site should be investigated in the future.
On the other hand Teigncombe I may have been a particularly unusual site and the excavation of one of
its neighbours could help to emphasise its importance and certainly provide further clues to its role
within the settlement. The initial selection process carried out in 1998 was based on finding a round
house with a bracken infestation, on private land, with little or preferably no other bracken in the

4
Figure 1. Teigncombe II is situated 235m north of Teigncombe I and forms part of the same dispersed
settlement. Both sites lie within modern enclosed farmland denoted by the light grey field boundaries.

5
vicinity, with good access and a supportive owner. In 1998, Teigncombe I was selected because it met
all of these criteria, but with hindsight, the deep stratigraphy whilst offering certain opportunities meant
that one of the core aims of the project – examining the impact of a live rhizome mat on archaeological
deposits could not be achieved. Teigncombe II did meet most of the 1998 criteria, falling down on the
presence of bracken beyond the house itself, a less than clear ownership situation and the presence of
trees. However, with the fresh need to find a house with more typical stratigraphy and a change in
ownership the house now appears to satisfy the current research needs of the project. The 2006
fieldwork season was primarily designed to establish whether the house would be a suitable candidate
for the next stage of our research.
At Teigncombe I the bracken survey was limited largely to the interior of the house itself with
only a relatively small number of plants on the western side being recorded because their relationship
to the house could not be established prior to excavation. At Teigncombe II the house itself is more
clearly defined because it has not seen the substantial post occupation inundation of soil. Despite this,
the decision was taken to include the dense stands of bracken situated adjacent to the house. The
reason for this was that it was felt that it might be useful to compare and contrast the effect and
character of the rhizomes on both the internal and external deposits. It might for example be possible
to establish whether rhizomes were more or less of a problem inside structures or in the open spaces
between structures. This type of information could be very useful for efficiently targeting bracken
control and management.
The Methodology
The position of 3623 bracken plants were recorded utilising planetables whose position was
subsequently correlated with the site grid. A maximum of three tables were employed at one time,
each operating from one of a total of 9 survey stations. The recording process involved plotting the
position of each plant onto the planetable and allocating it a number. Details of the height of the plant
were then entered onto a pro-forma. After the fieldwork was completed the data from the nine sheets
was superimposed over graph paper with the site grid marked up. The grid reference for each plant
was then calculated and entered by Bill Radcliffe onto a spreadsheet together with height information.
The resulting illustrations presented in this report were generated from this spreadsheet.
The Results
The survey generated a large amount of data which can be utilised in three main ways. The first
is to utilise it to compare and contrast the results with Teigncombe I, the second is to inform an
excavation strategy and the third is to enlighten analysis of the underlying rhizome mat should
excavation be possible in the future. Clearly we can only use it for the first purpose at this stage.
Figure 22 illustrates the distribution of all the bracken plants recorded. It is clear that the distribution is
not even with a number of very marked clusters and some areas with few plants. This uneven
distribution is reminiscent of the situation at Teigncombe I where dense clusters in the northern part of
the building were replaced with extremely low densities in the south east. At Teigncombe I the paucity
of plants in the south east was the result of relatively recent hillwash accumulations. Clearly this is not
the answer at Teigncombe II where perhaps tree cover is responsible. Nevertheless, the obvious
variations in the densities of plants will influence the character and distribution of the rhizome mat
below and in turn its impact on the archaeological deposits and features. Within the house, the greatest
density of plants stood within the vicinity of the eastern wall, with a further cluster extending south
west. The area with least plants is adjacent to the western wall. Outside the house the bracken
distribution is one of dispersed nucleations with patches, some of which are possibly linear in
appearance. The clustering of plants is interesting because it suggests that the rhizome distribution will
also be uneven. This in turn suggests that rhizome damage will not be uniform.

6
Table 1 highlights some basic comparative statistical information which at a glance provides an
overview of the similarities and differences between the two.
Table 1 Summary of information relating to the Teigncombe Round Houses
TEIGNCOMBE I TEIGNCOMBE II
Location SX 66802 86551 SX 66772 86784
Height above sea level 375m 367m
Aspect 55 degrees 90 degrees
Internal diameter of house 9m 8.7m
Area of house 64.60m² 59.41m²
Average wall width 1.4m 1.6m
Maximum height (pre excavation) 1.3 1.2m
Walling type Double orthostatic Double orthostatic
Door Faces 95 degrees Faces 180 degrees
Number of plants 2219 969
Density 34.60 plants per m² 16.31 plants per m²
Maximum density per m² 71 plants per m² 33 plants per m²
Average height 1.43m 1.62m
Total height 3,314m 1,566m
Average length of rhizome per
Plant
5.01m Unknown
Total length of rhizomes 7,596.91m 4,854m (extrapolated)
Both houses are situated relatively close to each other at similar heights above sea level, are of similar
size and are both of double orthostatic construction. When it comes to the character of the bracken
infestation the situation is rather different. Whilst there were 2219 plants within Teigncombe I, only
969 were recorded within Teigncombe II. This translates into an average density of 34.6 plants per m²
in Teigncombe I and only 16.31 plants per m² in Teigncombe II. Broadly speaking this equates to a
density of about half of that within Teigncombe I. Is this density more typical of what might be
expected on the moor as a whole? Work by the National Trust at Trowlesworthy may provide an
answer to this important question. The National Trust as part of a programme of bracken control at
Trowlesworthy Warren carried out pre treatment and post treatment monitoring and recording of a wide
variety of sample areas. This information allows us to compare the density of bracken between the two
Teigncombe sites and a range of 1m² squares scattered around Trowlesworthy Warren. Figure 2
clearly indicates that the bracken densities found at Teigncombe fall within the range recorded at
Trowlesworthy. This graph has been created by plotting the number of plants within each 1m² at
Trowlesworthy in ascending order, to which has been added the average and maximum figures
encountered at Teigncombe. Both figures for Teigncombe II are towards the lower end of the range as
is the average figure for Teigncombe I. Only the maximum figure for Teigncombe I is towards the
upper end of the range. It is therefore fair to conclude that in terms of number of plants per square
metre, Teigncombe II is considerably less than the average found at Trowlesworthy and whilst
Teigncombe I did have densities, which at their greatest, approached the levels found at
Trowlesworthy, however on the whole the average density was less. Unfortunately we are not in a
position to know for certain whether the Trowlesworthy densities are typical of those found elsewhere
on archaeological sites on Dartmoor. At this time, my own feeling (and sadly it is no more than this) is
that the Trowlesworthy densities are typical of those found on the exposed western side of Dartmoor,
whilst the Teigncombe ones are more typical of those found on the more sheltered eastern side.

7
Figure 2 Graph showing in ascending order the number of plants per square metre at Trowlesworthy
with the Teigncombe figures superimposed
Figure 3 illustrates the average height of bracken plants at Trowlesworthy Warren (arranged in
ascending order) and the average heights at the two Teigncombe houses. It is clear that the height of
plants at Teigncombe is considerably higher than at Trowlesworthy. This marked difference in height
confirms that the bracken at the two locations is very different in character. The most likely
explanation is that the difference relates to aspect, with the plants at Teigncombe being taller because
they are situated on an east facing slope and therefore protected from the prevailing winds. It would
therefore appear that on the more exposed slopes at Trowlesworthy the rhizomes send up more stipes of
a shorter height whilst at Teigncombe there are fewer, but higher stipes. Given this situation it might be
useful to establish in very broad terms whether the total height of stipe within each square metre is a
more useful way of comparing the amount of bracken. Figure 4 presents the results of this analysis.
Teigncombe I is clearly towards the upper part of the distribution whilst Teigncombe II is slightly
below the middle. Given that there is a relationship between the amount of bracken above the ground
and the rhizomes below it may therefore be concluded that Teigncombe I is likely to have had a well
above average density of rhizomes, whilst Teigncombe II is slightly below average. The lower figure
at Teigncombe II can best be explained by the presence of trees. I believe this analysis confirms that
on the grounds of the expected density of rhizomes, Teigncombe II makes a very good candidate for
further research. It’s likely magnitude of rhizome infestation, which is probably average, combined
with the presence of tree cover could provide a useful contrast to Teigncombe I where extremes of deep
stratigraphy and a resultant greater density of rhizomes make it less typical and arguably less useful in
our efforts to understand the impact of current infestations.

8
Figure 3 Chart showing the average height of bracken plants at Trowlesworthy and Teigncombe. The
average height of the plants at Teigncombe were considerably higher than any encountered in the many
sample areas at Trowlesworthy.
Figure 4 Chart showing the total height of bracken plants per metre square at Trowlesworthy
(indicated by line) and at the two Teigncombe houses (TI and TII). The considerable variation in
bracken densities indicates that rhizome density is also likely to vary. The high density of plants at
many sites at Trowlesworthy means that despite the plants themselves being on average much smaller,
the total height of plants at 4 sites even exceeded the very high figures found at Teigncombe I.

9
Figure 5. This series of illustrations highlights the clustering of particularly tall bracken plants. Three
of the four tallest plants stand within the house relatively close to the wall. The most pronounced
cluster is situated within the north eastern part of the house. This situation is reminiscent of
Teigncombe I, where the highest clusters were all within the northern part of the house.

10
Figure 6 The linear cluster of plants taller than 2.8m to the east of the house is of interest and probably
reflects the presence of a substantial rhizome below trending from north east to south west. A pair of
very tall plants (both greater than 3.3m high) within the house and to the south are not associated with
any other tall plants. This anomaly is the result of these two plants utilising the rowan tree branches in
a saprophytic relationship to effectively climb much higher than would otherwise be possible. The
relationship between trees and bracken is one of the possible further research avenues that Teigncombe
II offers. In particular, it would be useful to compare and quantify the degrees of damage caused by the
roots and rhizomes in the same environment. At Teigncombe I, tree roots were encountered, but these
had rotted significantly making it impossible to accurately quantify their effect on the stratigraphy. At
Teigncombe II the presence of trees means that direct comparison of root and rhizome damage should
be possible.

11
Figure 7 The four discrete clusters of plants greater than 2.6m high continues to expand and become
more dense. This confirms that taller plants tend to cluster together, providing further confirmation
that the degree of impact on archaeological deposits is likely to be variable. Within the house itself a
significant cluster of plants taller than 2.4m was recorded adjacent to the north eastern wall. This is a
pattern similar (albeit at a lower height) to that at Teigncombe I. Specific micro-climate factors are
probably responsible and serve to highlight the varying impact that bracken rhizomes are likely to have.
Again, it would appear that most damage is likely to occur in the area adjacent to the wall.

12
TEIGNCOMBE II
Figure 8 The distribution of plants greater than 2.3m within the house is limited to the north east.
There are however a small number of plants between 2.1m and 2.39m in the centre of the house. The
2.3m illustration is particularly significant as it represents the first occasion on which it is possible to
compare the distribution between the two Teigncombe houses. In Teigncombe I there are only three
plants taller than 2.3m whilst at Teigncombe II there are 62 within the house and a further 343 in the
immediate vicinity. Only excavation will be able to demonstrate whether taller plants lead to an
increase in rhizome activity and consequential damage.

13
TEIGNCOMBE I
Figure 9. Distribution of bracken plants at Teigncombe I taller than 2.1m, 2.2m and 2.3m. This series
of illustrations highlights the very obvious difference between the two houses and the very marked
clustering of tall plants into three areas.
14
TEIGNCOMBE II
Figure 10. A large number of plants (877) stand between 1.8m and 2.09m high. Most lie in areas
with taller plants, but within the house some of the areas not previously populated, now are. However
there are still several 1m² squares containing no plants. Outside the house, the pattern apparent in the
overall distribution represented in Figure 22 is now visible.

15
TEIGNCOMBE I
Figure 11 Distribution of bracken plants taller than 2m, 1.9m and 1.8m at Teigncombe I. The contrast
between this distribution and the one at Teigncombe II is marked. The Teigncombe I distribution is
highly clustered with no plants in the south eastern quadrant, a marked linear cluster adjacent to the
north eastern wall and strong clustering within the north western quadrant. These differences suggest
that the rhizome mat within Teigncombe II is likely to be rather different in character to that
encountered at Teigncombe I.

16
TEIGNCOMBE II
Figure 12 Within the house there is a total of 258 plants standing between 1.5m and 1.79m high. The
north eastern cluster is still very apparent despite the fact that very few plants within this size range
were found in this area. The main growth area within the house is in the southern half of the structure
where a large number of plants belong within this height range. There are still however very few plants
in a distinct triangle leading inward from the western wall of the house. The contrast with the very
high density triangular shaped area immediately to the east is very marked. These distinct contrasts are
likely to be reflected in the character and consequently impact of the underlying rhizome mat.

17
TEIGNCOMBE I
Figure 13 The distribution of bracken plants falling within this range at Teigncombe I has similarities
to that found at Teigncombe II. The extremely dense clustering around the wall edge is found in one
place adjacent to the eastern wall at Teigncombe II. However, more significantly, the speckled pattern
of clustering is a feature of both, although it is much less pronounced at Teigncombe II where there are
far fewer plants.
18
TEIGNCOMBE II
Figure 14 The distribution of the shortest plants at Teigncombe II is essentially dispersed with some
suggestions of a linear pattern. The shortest plants appear to predominate in those areas without
clusters of tall plants.

19
TEIGNCOMBE I
Figure 15 The distribution of the shortest plants at Teigncombe I is relatively dispersed, but with very
clear linear patterning. The only notable cluster occurs in the south eastern quadrant of the house
where there are no tall plants.

20
TEIGNCOMBE II
Figure 16 There is clear linear patterning in these Teigncombe II distributions. Many of the plants can
be resolved into linear clusters, perhaps indicating the positions of particular rhizomes. Of special
interest is the cluster to the south east of the house.

21
TEIGNCOMBE I
Figure 17 The distribution of bracken plants between 0.81m and 1m and less than 1m high at
Teigncombe I is very evenly dispersed with only limited clustering adjacent to the south eastern wall.
The difference between this distribution and that at Teigncombe II is noticeable, but probably not very
significant.

22
TEIGNCOMBE II
Figure 18 The linear clustering is now very apparent throughout the survey area at Teigncombe II.
The shape of these clusters very strongly suggests that they are reflecting the location of underlying
rhizomes. Could this distribution be the result of underlying archaeological, geomorphological or
geological factors?

23
TEIGNCOMBE I
Figure 19 The comparable distribution at Teigncombe I is much more even and there is no trace of the
clearly defined linear clusters visible at Teigncombe II.

24
TEIGNCOMBE II
Figure 20 The linear clustering visible in earlier maps is no longer as clearly defined at Teigncombe II
in plants shorter than 1.6m high. Within the interior of the house the distribution is now relatively
dispersed with only two small areas with no plants. Of interest, are the patches north and south of the
house with few plants which contain large numbers of particularly tall plants.

25
TEIGNCOMBE I
Figure 21 The patch in the south eastern quadrant of Teigncombe I with very few plants is clearly
defined and there is a notable cluster of plants adjacent to the wall in the same part of the building.
Otherwise the distribution is dispersed and about twice as dense as at Teigncombe II.

26
Figure 22 Distribution of all bracken plants recorded at Teigncombe II. The obvious clustering
indicates that the damage being caused to the underlying archaeology is very unlikely to be even. The
impact of tree cover is particularly marked, with the areas of less dense growth adjacent to the northern
and western walls coinciding with tree canopies.

27
Figure 23 This series of graphs illustrates the height profile of plants expressed in percentages for ease
of comparison. The figure along the horizontal axis represents the height of the plants and the vertical
axis the percentage of plants of that height. These graphs highlight the differences in the character pf
the plants between the houses. In particular, at Teigncombe I there are a significant number of plants
between 1.3m and 1.6m high, whilst at Teigncombe II the largest percentage of tall plants are between
1.7m and 2m high. The plants at Teigncombe I have a smaller overall height range and a greater
percentage within the central part of the range, whilst at both sites there is a similar percentage of very
small and very tall plants.

28
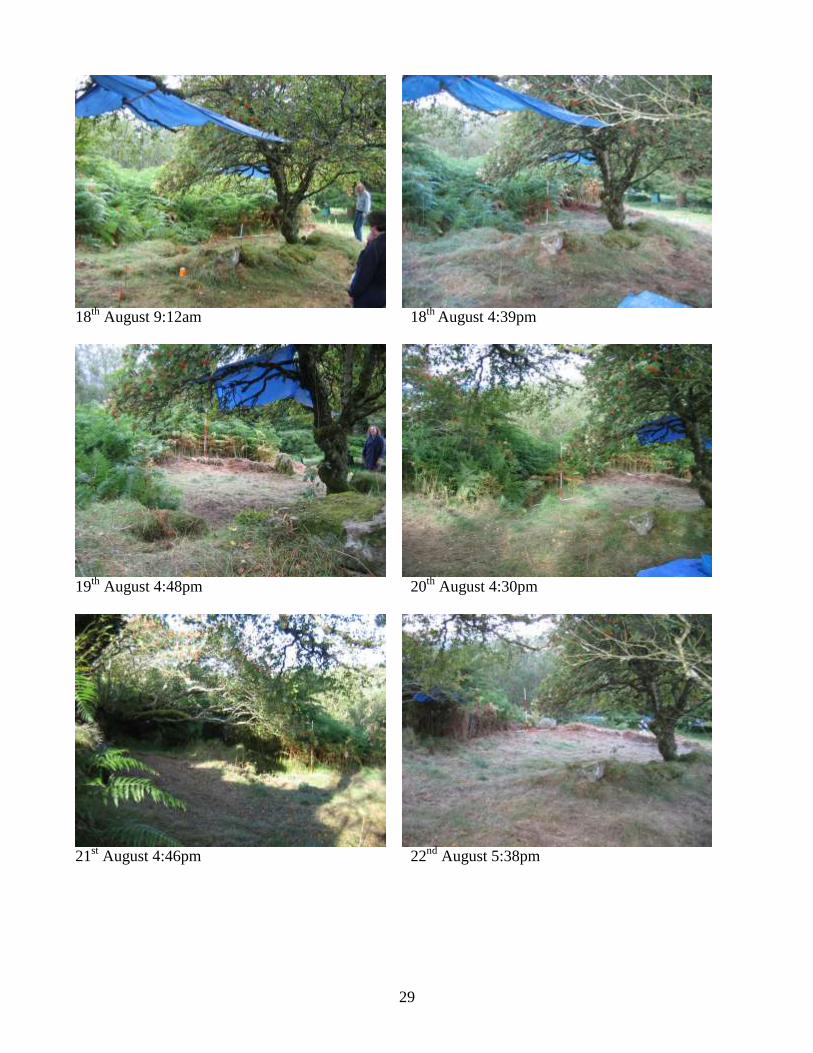
The disappearing bracken [View of the house from the west]
The series of photographs below illustrate the progress made by the team in revealing the house which
at the start was almost entirely obscured by bracken. They are all taken from the west looking towards
the house. For ease of reference the rowan tree is in all of the photographs.
14
th August 8:53am 14
th August 11.45am
15
th August 9.19am 15
th August 4:17pm
16
th August 4:37pm 17
th August 4:02pm
29
18
th August 9:12am 18
th August 4:39pm
19
th August 4:48pm 20
th August 4:30pm
21
st August 4:46pm 22
nd August 5:38pm

30
23
rd August 4:34pm 24
th August 4:58pm
Future
The stipe survey at Teigncombe II confirmed that the site represents a good candidate for future
research on the basis of the likely amount and disposition of rhizomes. We need however to be as sure
as possible that the site is also likely to have average stratigraphy. Before we can accurately access the
likely character of the stratigraphy we need to carry out a detailed contour survey of the house and its
immediate environs. Therefore the major priority for the 2007 season will be producing a contour
survey and detailed earthwork plan of the site. Utilising this information and comparing it with data
from excavated examples it is envisaged that it will be possible to generate a reasonably accurate
estimate of the likely depth of deposits.
This work will hopefully not take two weeks to carry out and with the remainder of the
available time it is hoped to commence a detailed survey of the surrounding area with particular
emphasis on establishing how much of the prehistoric archaeology has survived in the area which has
seen most intensive medieval and post-medieval activity.
In 2007, weather permitting, part of our effort will be directed towards assessing the survival of
archaeological remains within the historically enclosed field at Teigncombe. The survival of
prehistoric archaeology within enclosed areas has always been recognized, but there has been an
assumption that what survives has been so heavily altered and truncated so as to represent a lesser
resource than the easier to appreciate and understand remains on the open moor. Survey work will be
carried out in the vicinity to establish the character of the surviving archaeology and to compare it with
that surviving on the adjacent moor. This spin off from the bracken project work is designed to enhance
our detailed understanding of Teigncombe and provide an insight into the impact of intensive historic
activity. It is possible that despite more damage as a result of intensive activity that the archaeology at
lower altitude was much more substantial and therefore robust in the first place. Our current
understanding of prehistoric Dartmoor is necessarily dominated by the archaeology surviving on the
moorland, for a full understanding of the picture we need to see if the lower altitudes have anything to
tell us. At Teigncombe many of the existing fields are clearly influenced in their alignment and shape
by earlier prehistoric fields and therefore the area represents a wonderful opportunity to examine the
surviving character of archaeology at lower altitudes. Many of the more prosperous settlements would
have been situated in the areas where the best fields are today and in particular the chances of
prehistoric settlement sites being situated on the site of the later historic farmsteads are extremely high.

31
Summary
The primary results from the 2006 season were the identification of:
1. A significant number of plants standing more than 2.3m high.
2. Discrete clusters of plants of similar size
3. The impact of tree growth on bracken appears to result in fewer plants growing beneath the canopy,
whilst at the same time encouraging a few plants to reach considerable heights by providing support
and protection.
4. Considerable variations in the density and character of the plants.
5. Linear clusters indicating the position of buried rhizomes.
6. The two Teigncombe houses have a great deal in common, but the character of the bracken
infestation in each house is significantly different. In broad terms the bracken density at Teigncombe II
is about half of that at Teigncombe I. The stipe survey indicates that the intensity of rhizome mat
encountered at Teigncombe I is unlikely to exist at Teigncombe II.
7. Comparisons with work carried out by the National Trust at Trowlesworthy indicate that the
character of the bracken infestation at Teigncombe is different in character and suggest that the nature
of any rhizome damage may vary from site to site. This finding may have significance in targeting
bracken control measures. Eventually it may be possible to identify the type of infestation which is
most damaging for archaeological deposits.
Conclusion
The plotting and recording of over 3,600 bracken plants is a time consuming and to some an apparently
odd way to spend a couple of weeks. I hope that the results of this work fully justify the effort. For the
first time we now have a valuable direct comparison to the first stipe survey carried out at Teigncombe
an unbelievable seven years ago. The results of the present survey illustrate that despite their close
proximity and many other similarities the character of the bracken growth at the two Teigncombe
houses is very different. At Teigncombe I the tallest plants reached what we thought at the time was an
astonishing 2.3m, but at Teigncombe II over 11% of the plants are of this magnitude or higher. What
impact might these plants be having on the underlying archaeology? Will the smaller number of plants
within the house mean that overall the damage is less? Work at Teigncombe I suggests that a well
developed rhizome mat will exist between 0.10m and 0.40m below the surface and if this coincides
with sensitive archaeological deposits then damage will have happened and perhaps more significantly
will be continuing. Further fieldwork at Teigncombe II during 2007 combined with a programme of
documentary research will be directed towards establishing the likelihood of the rhizome mat
coinciding with important archaeological deposits. The results of this analysis which will be presented
in the interim report for 2007 will inform our assessment concerning the archaeological suitability of
Teigncombe II as a candidate for the next phase of our research.

32
Acknowledgements
Thanks must go to Mr and Mrs Edmondson for letting ACE invade their land for the usual two weeks
in August, it was lovely to arrive and find that all the Bracken except in and around the roundhouse had
been cut down making our job so much easier. Devon Archaeological Society let us borrow essential
equipment, especially the all important latrine tent for which we are all most grateful. Mac and Wendy
Howard brought their the large frame Mess Tent which we would have been lost without as rain fell in
various forms practically every day we were there. Thanks also to Benny Venn and Catherine Norman
for lending ACE their gas cooker enabling a plentiful supply of hot drinks and for those of us mad
enough to stay overnight something to cook on. A splendid Tardis of a tool tent was provided by Anne
and Tim Whitbourn, an essential piece of kit which was kept tidy by Anne for the duration, a daunting
task! Anne and Tim also provided lots of things to make life more comfortable from midge coils to
biscuits.
Janet Daynes and Gordon Fisher did the usual organisational bit collecting tools, sorting the
logistics and in Sandy’s absence bossed people around a lot! Thanks to everyone that helped out over
the two weeks, whatever jobs that needed doing got done without complaint, even digging the latrine
pit. Surveying bracken is not necessarily everyone’s cup of tea, “Its not proper archaeology though is
it?” I hear, well yes it is, it was a crucial piece of work that has informed our research. What’s more
we had a lot of fun doing it!
This year’s team included many familiar faces and some new ones and included: Janet Daynes,
Gordon Fisher, Anne and Tim Whitbourn, Judi Clarke, Graham Carne, Chloe Clifford, John Spyder
Parry, Malcolm and Wendy Howard, Jim O’Brien, Lorinda Legge, Bill Radcliffe, Judith Farmer,
Judith Cannell, Sue Watts, Bob Bruce and Andrew Parton.
References
Fergusson, G. and Holley, S., “Bracken control measures, Trowlesworthy Warren, Dartmoor”,
published by The National Trust, July 2003.
Gerrard, S., “The Dartmoor Archaeology and Bracken Project, Interim reports for 1999 – 2004”