Interim report 2017 Q3 - Schouw · Earnings per share (of DKK 10) 11.03 32.74 24.77 45.82 56.56...
34
2017 Interim report 2017 Q3 Company announcement No. 11/2017 13 November 2017 · 34 pages Table of contents Financial highlights ................................ 2 Interim report .......................................... 3 Management statement ........................... 8 Our businesses......................................... 9 Income statement .................................. 23 Balance sheet ......................................... 24 Cash flow statement .............................. 25 Statement of changes in equity ............. 26 Notes to the financial statements ......... 27 Highlights Schouw & Co.’s consolidated revenue grew by 12% in the third quarter of 2017 to DKK 4,835 million EBIT was up by 3% to DKK 362 million Acquisitions made in 2017 added 7% to revenue and 8% to EBIT Cash flows from operating activities were up by DKK 327 million to DKK 689 million Important capacity-increasing investments in Norway and Malaysia completed BioMar’s acquisition of Alimentsa has now closed and the company has been consolidated Schouw & Co. now expects full-year 2017 revenue of about DKK 16.9 billion The Group maintains its guidance of full-year EBIT in the DKK 1,065-1,135 mil- lion range Statement by Jens Bjerg Sørensen, President of Schouw & Co.: “At Schouw & Co., we are committed to future-proofing the strategic platforms of our businesses, and we are investing in capacity, innovation and developing our organisations for the long term. In recent years, we have invested heavily in com- pany acquisitions, growth and expansion and are now firmly positioned and ready for the future. Our businesses operate in competitive growth markets with natural fluctuations in available capacity over time. There are indications of excess capacity occurring in the near future, which would make markets even more competitive and put prices, terms and conditions under pressure. However, we are confident that the long-term perspectives remain intact and that the investments we’ve made to future-proof each of our businesses will produce opportunities for profitable long-term growth.” This is a translation of Schouw & Co.’s Interim Report for the nine months ended 30 September 2017. The original Danish text shall be controlling for all purposes, and in case of discrepancy, the Danish wording shall be applicable.
Transcript of Interim report 2017 Q3 - Schouw · Earnings per share (of DKK 10) 11.03 32.74 24.77 45.82 56.56...
2017 Interim report 2017 Q3 Company announcement No. 11/2017 13 November 2017 · 34 pages Table of contents Financial highlights ................................ 2 Interim report .......................................... 3 Management statement ........................... 8 Our businesses ......................................... 9 Income statement .................................. 23 Balance sheet ......................................... 24 Cash flow statement .............................. 25 Statement of changes in equity ............. 26 Notes to the financial statements ......... 27
Highlights Schouw & Co.’s consolidated revenue grew by 12% in the third quarter of 2017
to DKK 4,835 million EBIT was up by 3% to DKK 362 million
Acquisitions made in 2017 added 7% to revenue and 8% to EBIT Cash flows from operating activities were up by DKK 327 million to DKK 689
million Important capacity-increasing investments in Norway and Malaysia completed BioMar’s acquisition of Alimentsa has now closed and the company has been
consolidated
Schouw & Co. now expects full-year 2017 revenue of about DKK 16.9 billion The Group maintains its guidance of full-year EBIT in the DKK 1,065-1,135 mil-
lion range Statement by Jens Bjerg Sørensen, President of Schouw & Co.: “At Schouw & Co., we are committed to future-proofing the strategic platforms of our businesses, and we are investing in capacity, innovation and developing our organisations for the long term. In recent years, we have invested heavily in com-pany acquisitions, growth and expansion and are now firmly positioned and ready for the future. Our businesses operate in competitive growth markets with natural fluctuations in available capacity over time. There are indications of excess capacity occurring in the near future, which would make markets even more competitive and put prices, terms and conditions under pressure. However, we are confident that the long-term perspectives remain intact and that the investments we’ve made to future-proof each of our businesses will produce opportunities for profitable long-term growth.”
This is a translation of Schouw & Co.’s Interim Report for the nine months ended 30 September 2017. The original Danish text shall be controlling for all purposes, and in case of discrepancy, the Danish wording shall be applicable.
Interim Report – third quarter of 2017 Schouw & Co. 2
GROUP SUMMARY (DKK MILLION) Q3
2017Q3
2016YTD
2017YTD
20162016Total
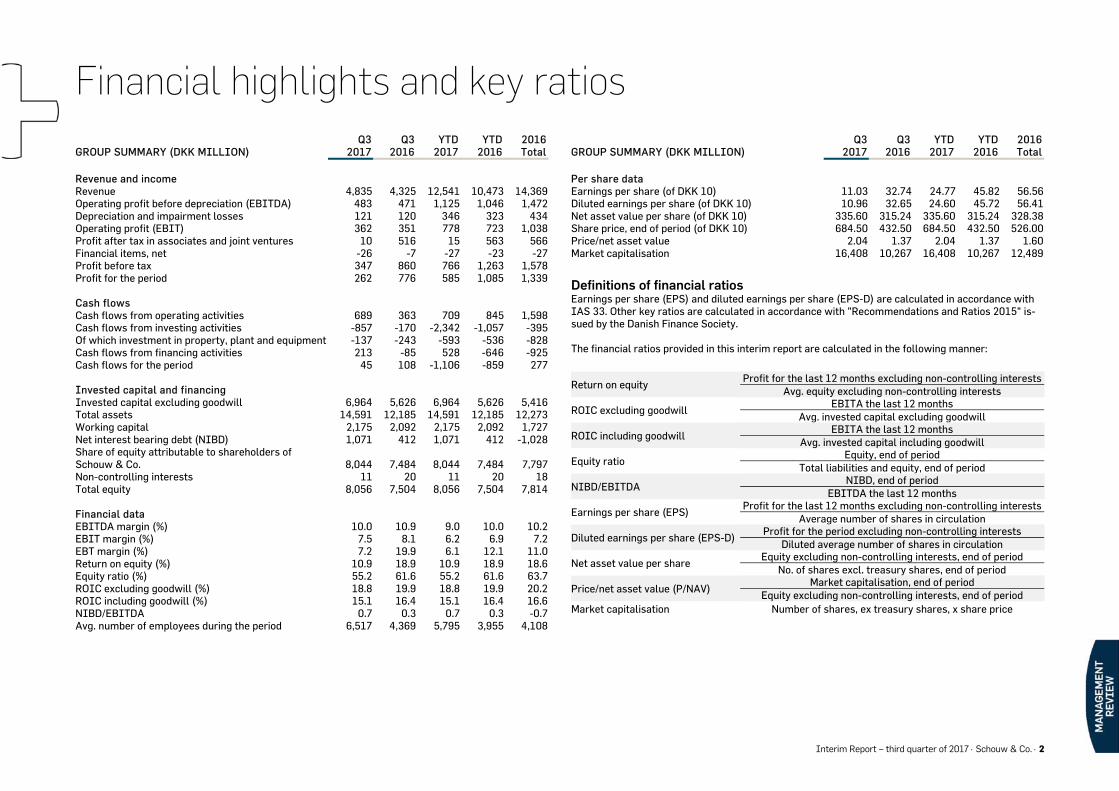
Revenue and income Revenue 4,835 4,325 12,541 10,473 14,369Operating profit before depreciation (EBITDA) 483 471 1,125 1,046 1,472Depreciation and impairment losses 121 120 346 323 434Operating profit (EBIT) 362 351 778 723 1,038Profit after tax in associates and joint ventures 10 516 15 563 566Financial items, net -26 -7 -27 -23 -27Profit before tax 347 860 766 1,263 1,578Profit for the period 262 776 585 1,085 1,339 Cash flows Cash flows from operating activities 689 363 709 845 1,598Cash flows from investing activities -857 -170 -2,342 -1,057 -395Of which investment in property, plant and equipment -137 -243 -593 -536 -828Cash flows from financing activities 213 -85 528 -646 -925Cash flows for the period 45 108 -1,106 -859 277 Invested capital and financing Invested capital excluding goodwill 6,964 5,626 6,964 5,626 5,416Total assets 14,591 12,185 14,591 12,185 12,273Working capital 2,175 2,092 2,175 2,092 1,727Net interest bearing debt (NIBD) 1,071 412 1,071 412 -1,028Share of equity attributable to shareholders of Schouw & Co. 8,044 7,484 8,044 7,484 7,797Non-controlling interests 11 20 11 20 18Total equity 8,056 7,504 8,056 7,504 7,814 Financial data EBITDA margin (%) 10.0 10.9 9.0 10.0 10.2EBIT margin (%) 7.5 8.1 6.2 6.9 7.2EBT margin (%) 7.2 19.9 6.1 12.1 11.0Return on equity (%) 10.9 18.9 10.9 18.9 18.6Equity ratio (%) 55.2 61.6 55.2 61.6 63.7ROIC excluding goodwill (%) 18.8 19.9 18.8 19.9 20.2ROIC including goodwill (%) 15.1 16.4 15.1 16.4 16.6NIBD/EBITDA 0.7 0.3 0.7 0.3 -0.7Avg. number of employees during the period 6,517 4,369 5,795 3,955 4,108
GROUP SUMMARY (DKK MILLION) Q3
2017Q3
2016 YTD
2017 YTD
20162016 Total
Per share data Earnings per share (of DKK 10) 11.03 32.74 24.77 45.82 56.56Diluted earnings per share (of DKK 10) 10.96 32.65 24.60 45.72 56.41Net asset value per share (of DKK 10) 335.60 315.24 335.60 315.24 328.38Share price, end of period (of DKK 10) 684.50 432.50 684.50 432.50 526.00Price/net asset value 2.04 1.37 2.04 1.37 1.60Market capitalisation 16,408 10,267 16,408 10,267 12,489
Definitions of financial ratios Earnings per share (EPS) and diluted earnings per share (EPS-D) are calculated in accordance with IAS 33. Other key ratios are calculated in accordance with "Recommendations and Ratios 2015" is-sued by the Danish Finance Society. The financial ratios provided in this interim report are calculated in the following manner:
Return on equity
Profit for the last 12 months excluding non-controlling interests Avg. equity excluding non-controlling interests
ROIC excluding goodwill EBITA the last 12 months
Avg. invested capital excluding goodwill
ROIC including goodwill EBITA the last 12 months
Avg. invested capital including goodwill
Equity ratio Equity, end of period
Total liabilities and equity, end of period
NIBD/EBITDA NIBD, end of period
EBITDA the last 12 months
Earnings per share (EPS) Profit for the last 12 months excluding non-controlling interests
Average number of shares in circulation
Diluted earnings per share (EPS-D) Profit for the period excluding non-controlling interests
Diluted average number of shares in circulation
Net asset value per share Equity excluding non-controlling interests, end of period
No. of shares excl. treasury shares, end of period
Price/net asset value (P/NAV) Market capitalisation, end of period
Equity excluding non-controlling interests, end of period Market capitalisation Number of shares, ex treasury shares, x share price
Financial highlights and key ratios
Interim Report – third quarter of 2017 Schouw & Co. 3
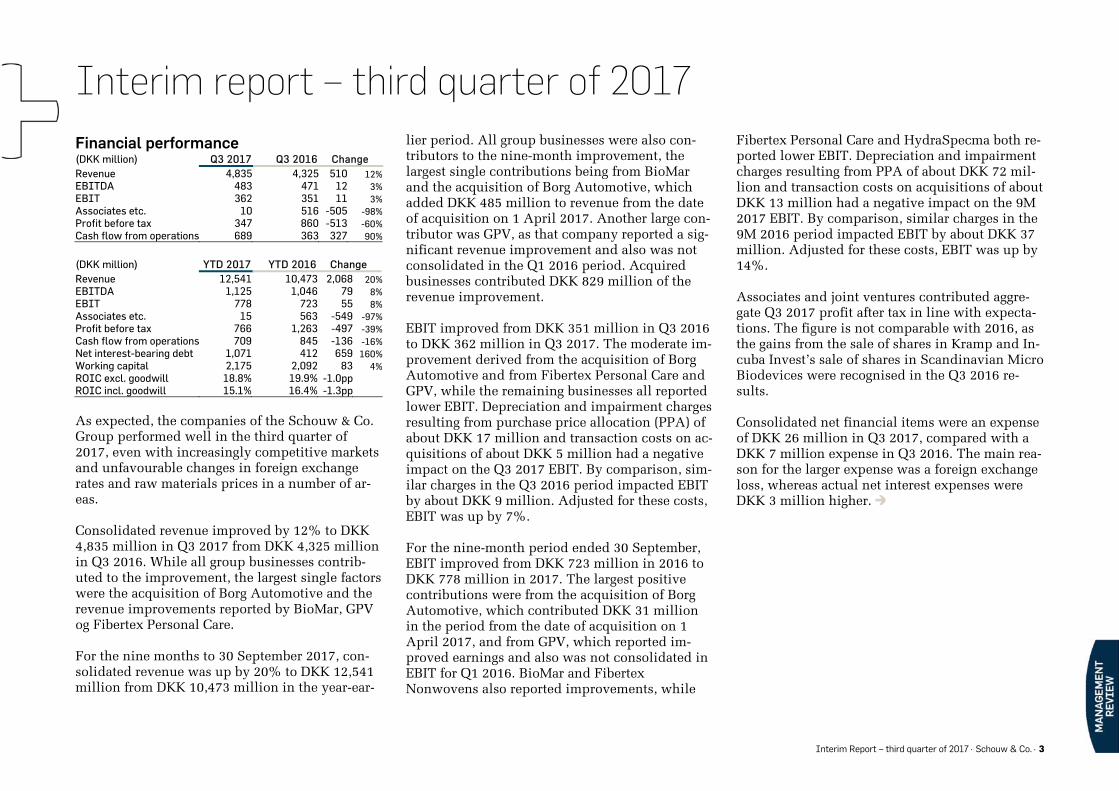
Financial performance (DKK million) Q3 2017 Q3 2016 Change Revenue 4,835 4,325 510 12%EBITDA 483 471 12 3%EBIT 362 351 11 3%Associates etc. 10 516 -505 -98%Profit before tax 347 860 -513 -60%Cash flow from operations 689 363 327 90%
(DKK million) YTD 2017 YTD 2016 Change Revenue 12,541 10,473 2,068 20%EBITDA 1,125 1,046 79 8%EBIT 778 723 55 8%Associates etc. 15 563 -549 -97%Profit before tax 766 1,263 -497 -39%Cash flow from operations 709 845 -136 -16%Net interest-bearing debt 1,071 412 659 160%Working capital 2,175 2,092 83 4%ROIC excl. goodwill 18.8% 19.9% -1.0ppROIC incl. goodwill 15.1% 16.4% -1.3pp As expected, the companies of the Schouw & Co. Group performed well in the third quarter of 2017, even with increasingly competitive markets and unfavourable changes in foreign exchange rates and raw materials prices in a number of ar-eas. Consolidated revenue improved by 12% to DKK 4,835 million in Q3 2017 from DKK 4,325 million in Q3 2016. While all group businesses contrib-uted to the improvement, the largest single factors were the acquisition of Borg Automotive and the revenue improvements reported by BioMar, GPV og Fibertex Personal Care. For the nine months to 30 September 2017, con-solidated revenue was up by 20% to DKK 12,541 million from DKK 10,473 million in the year-ear-
lier period. All group businesses were also con-tributors to the nine-month improvement, the largest single contributions being from BioMar and the acquisition of Borg Automotive, which added DKK 485 million to revenue from the date of acquisition on 1 April 2017. Another large con-tributor was GPV, as that company reported a sig-nificant revenue improvement and also was not consolidated in the Q1 2016 period. Acquired businesses contributed DKK 829 million of the revenue improvement. EBIT improved from DKK 351 million in Q3 2016 to DKK 362 million in Q3 2017. The moderate im-provement derived from the acquisition of Borg Automotive and from Fibertex Personal Care and GPV, while the remaining businesses all reported lower EBIT. Depreciation and impairment charges resulting from purchase price allocation (PPA) of about DKK 17 million and transaction costs on ac-quisitions of about DKK 5 million had a negative impact on the Q3 2017 EBIT. By comparison, sim-ilar charges in the Q3 2016 period impacted EBIT by about DKK 9 million. Adjusted for these costs, EBIT was up by 7%. For the nine-month period ended 30 September, EBIT improved from DKK 723 million in 2016 to DKK 778 million in 2017. The largest positive contributions were from the acquisition of Borg Automotive, which contributed DKK 31 million in the period from the date of acquisition on 1 April 2017, and from GPV, which reported im-proved earnings and also was not consolidated in EBIT for Q1 2016. BioMar and Fibertex Nonwovens also reported improvements, while
Fibertex Personal Care and HydraSpecma both re-ported lower EBIT. Depreciation and impairment charges resulting from PPA of about DKK 72 mil-lion and transaction costs on acquisitions of about DKK 13 million had a negative impact on the 9M 2017 EBIT. By comparison, similar charges in the 9M 2016 period impacted EBIT by about DKK 37 million. Adjusted for these costs, EBIT was up by 14%. Associates and joint ventures contributed aggre-gate Q3 2017 profit after tax in line with expecta-tions. The figure is not comparable with 2016, as the gains from the sale of shares in Kramp and In-cuba Invest’s sale of shares in Scandinavian Micro Biodevices were recognised in the Q3 2016 re-sults. Consolidated net financial items were an expense of DKK 26 million in Q3 2017, compared with a DKK 7 million expense in Q3 2016. The main rea-son for the larger expense was a foreign exchange loss, whereas actual net interest expenses were DKK 3 million higher.
Interim report – third quarter of 2017

Interim Report – third quarter of 2017 Schouw & Co. 4
Liquidity and capital resources The consolidated operating activities generated a cash inflow of DKK 689 million in Q3 2017, com-pared with DKK 363 million in Q3 2016. The change was mainly due to a substantial drop in BioMar’s working capital during the course of the third quarter of 2017. Cash flows for investing activities in Q3 2017 amounted to DKK 857 million and were mainly used to acquire the shares in Alimentsa. By com-parison, cash flows for investing activities in Q3 2016 amounted to DKK 170 million. The consolidated net interest-bearing debt amounted to DKK 1,071 million at 30 September 2017, compared to DKK 927 million at 30 June 2017. By comparison, the Group had consolidated net interest-bearing debt of DKK 412 million at 30 September 2016. Consolidated working capital fell from DKK 2,353 million at 30 June 2017 to DKK 2,175 million at 30 September 2017, mainly due to a reduction in BioMar. By comparison, working capital amounted to DKK 2,092 million at 30 September 2016. Group developments The consolidated performance of the third quarter of 2017 was one of continued revenue improve-ments. Earningswise, however, the quarter was a challenging period of generally unfavourable changes in foreign exchange rates and raw materi-als prices. Moreover, the group businesses have incurred costs related to a number of initiatives intended to support the continued development
of the Group, but which make only limited contri-butions to near-term earnings. The companies of the Schouw & Co. Group have invested heavily in recent years to capitalise on the opportunities available for organic expansion. All businesses are currently investing in capacity-increasing assets, but two of the largest invest-ments were recently completed in the third quar-ter: In Norway, construction of BioMar’s new produc-tion line at the existing factory in Karmøy was completed in July, and the new production line (annual capacity 140,000 tonnes) is now opera-tional. The project represents a total investment of about DKK 300 million. In 2016, Fibertex Personal Care began construc-tion of a new production site at Sendayan some 25 km south of the existing factory at Nilai out-side Kuala Lumpur, Malaysia. The new site may eventually have as many as four production lines, and installation of the first line was completed in July 2017. The new production line, Fibertex Per-sonal Care’s eighth line and the company’s fifth in Malaysia, was run in during the third quarter and began commercial production from the start of the fourth quarter. The total investment in this first phase amounted to about DKK 400 million. In addition to the investment in organic expan-sion, BioMar agreed on 2 June 2017 to buy a 70% stake in Ecuadorian shrimp feed producer Ali-mentsa at a price of about DKK 800 million (enter-prise value for 70% of the business). The previous
owners have stayed on as non-controlling share-holders. The transaction received the approval of the relevant authorities on 31 August and closed on 13 September 2017. Shrimp makes up the larg-est single segment in global aquaculture, and Ec-uador’s annual production of some 450,000 tonnes makes it the world’s fifth-largest shrimp farming country. As Alimentsa produces 10-15% of the feed used for shrimp farming, the acquisi-tion gives BioMar a powerful entry into the shrimp feed market. The following is a brief review of other business developments in the portfolio companies in the third quarter of 2017. See the individual company reviews on the following pages for more infor-mation. B I O M A R reported strong growth in volumes sold with the largest improvement taking place in the salmon business, but developments in foreign ex-change rates and prices of raw materials have curbed the revenue increase. The Q3 2017 EBIT declined relative to last year, mainly due to more competitive markets. F I B E R T E X P E R S O N A L C A R E reported a consid-erable revenue improvement driven mainly by an increase in revenue from Innowo Print. EBIT also improved, mainly due to the Danish operation where Q3 2016 was adversely affected by a planned closure and upgrade of a production line.
Interim report – third quarter of 2017
Interim Report – third quarter of 2017 Schouw & Co. 5
F I B E R T E X N O N W O V E N S reported a broadly based revenue improvement with all production sites contributing. The Q3 2017 EBIT declined rel-ative to last year, mainly due to extremely chal-lenging developments in raw materials prices. H Y D R A S P E C M A grew its revenue based on im-provements in a number of business segments, but the marine, defence and offshore segments continue to feel the effects of slumping market de-mand. In addition, the wind power segment has reported softening activity in overseas markets. EBIT fell by a considerable margin year on year, in part due to costs of planned business develop-ment and planned structural changes. B O R G A U T O M O T I V E reported revenue in line with the year-earlier period when the company was not consolidated. EBIT was also in line with last year when adjusted for depreciation and im-pairment charges related to the purchase price al-location made in connection with the acquisition. G P V reported a significant revenue improvement that was mainly based on organic growth and the acquisition of BHE, an electronics manufacturing services company, earlier in the year. EBIT was also up, even with the costs incurred during the period in relation to the integration of the BHE ac-quisition and other business activity expansion.
Schouw & Co. shares and shares held in treasury Schouw & Co.’s share capital comprises 25,500,000 shares with a nominal value of DKK 10 each for a total nominal share capital of DKK 255,000,000. Each share carries one vote. Schouw & Co. shares fell by 2% during the third quarter of 2017, from DKK 698.50 at 30 June 2017 to DKK 684.50 at 30 September 2017. Priced at DKK 526.00 per share at 31 December 2016, the shares have risen by 30% in 2017. At 30 June 2017, the company held 1,642,930 treasury shares, equal to 6.44% of the share capi-tal. Schouw & Co. used 113,000 shares in the third quarter of 2017 in connection with options exercised under the Group’s share incentive scheme. Accordingly, at 30 September 2017, the company held 1,529,930 treasury shares, equal to 6.00% of the share capital. The market value of the holding of treasury shares was DKK 1,047 million at 30 September 2017. The portfolio of treasury shares is recognised at DKK 0. Events after the balance sheet date Other than as set out elsewhere in this interim re-port, Schouw & Co. is not aware of events occur-ring after 30 September 2017 which are expected to have a material impact on the Group's financial position or outlook.
Special risks The overall risk factors the Schouw & Co. Group faces are discussed in the 2016 Annual Report. The current assessment of special risks is largely unchanged from the assessment applied in the preparation of the 2016 Annual Report.
Interim report – third quarter of 2017
Interim Report – third quarter of 2017 Schouw & Co. 6
Most of the segments the Schouw & Co. Group companies are involved in generally have good momentum. The healthy activity and the sound investment climate have naturally provided the setting for a number of capacity-increasing invest-ments made both by the Group’s businesses and by providers of competing products and services. Such movements in supply and demand do not necessarily always occur in a balanced setting, and several major areas are currently seeing more competitive markets. This applies in particular to BioMar and Fibertex Personal Care. At the same time, a number of business areas have experi-enced adverse changes in foreign exchange rates and raw materials prices that are putting their earnings under pressure. As a result, the Group’s healthy revenue perfor-mance is not, in some areas, matched by propor-tionate earnings improvements. However, the Group’s businesses stand well positioned to take on the market challenges, and maintaining com-petitive strength is a key priority. Accordingly, Schouw & Co. intends to allocate substantial re-sources to preparing the portfolio companies for the future – even if allocated costs and invest-ments may not necessarily contribute to improv-ing earnings in the short term. The following brief comments provide full-year revenue and EBIT guidance for the individual portfolio companies. See the individual company reviews on the following pages for more infor-mation.
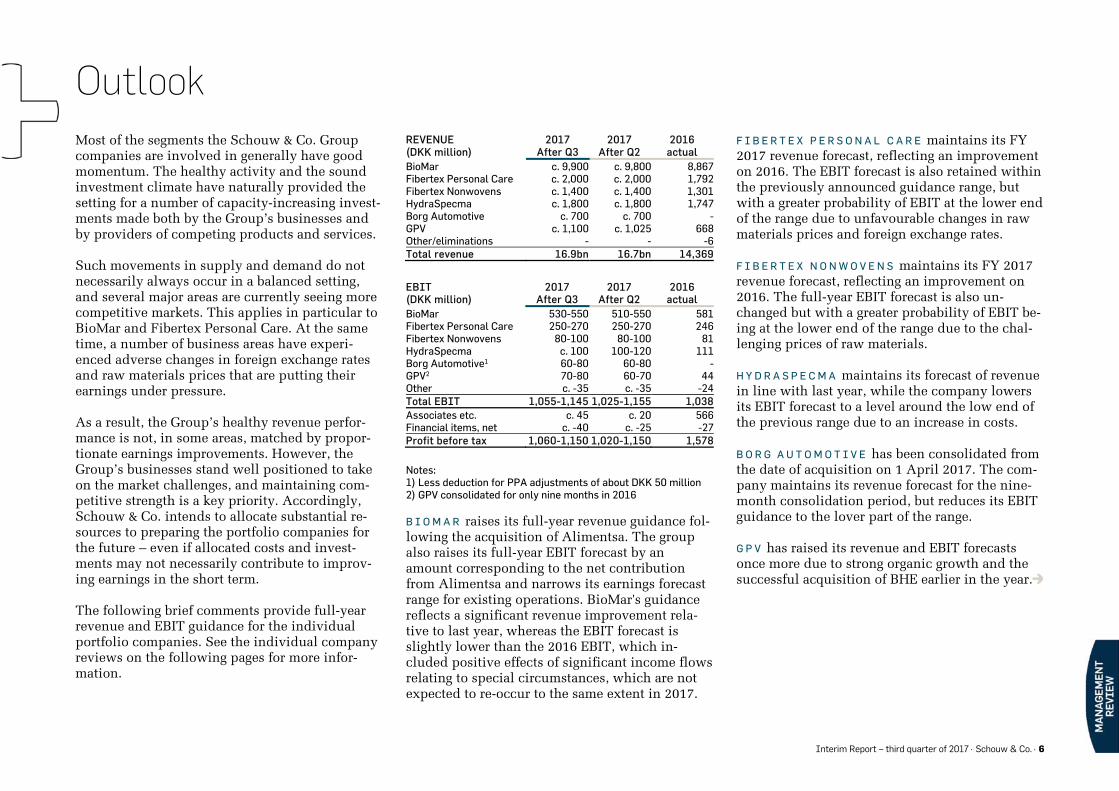
REVENUE (DKK million)
2017 After Q3
2017 After Q2
2016 actual
BioMar c. 9,900 c. 9,800 8,867Fibertex Personal Care c. 2,000 c. 2,000 1,792Fibertex Nonwovens c. 1,400 c. 1,400 1,301HydraSpecma c. 1,800 c. 1,800 1,747Borg Automotive c. 700 c. 700 -GPV c. 1,100 c. 1,025 668Other/eliminations - - -6Total revenue 16.9bn 16.7bn 14,369 EBIT (DKK million)
2017 After Q3
2017 After Q2
2016 actual
BioMar 530-550 510-550 581Fibertex Personal Care 250-270 250-270 246Fibertex Nonwovens 80-100 80-100 81HydraSpecma c. 100 100-120 111Borg Automotive1 60-80 60-80 -GPV2 70-80 60-70 44Other c. -35 c. -35 -24Total EBIT 1,055-1,145 1,025-1,155 1,038Associates etc. c. 45 c. 20 566Financial items, net c. -40 c. -25 -27Profit before tax 1,060-1,150 1,020-1,150 1,578
Notes: 1) Less deduction for PPA adjustments of about DKK 50 million 2) GPV consolidated for only nine months in 2016 B I O M A R raises its full-year revenue guidance fol-lowing the acquisition of Alimentsa. The group also raises its full-year EBIT forecast by an amount corresponding to the net contribution from Alimentsa and narrows its earnings forecast range for existing operations. BioMar's guidance reflects a significant revenue improvement rela-tive to last year, whereas the EBIT forecast is slightly lower than the 2016 EBIT, which in-cluded positive effects of significant income flows relating to special circumstances, which are not expected to re-occur to the same extent in 2017.
F I B E R T E X P E R S O N A L C A R E maintains its FY 2017 revenue forecast, reflecting an improvement on 2016. The EBIT forecast is also retained within the previously announced guidance range, but with a greater probability of EBIT at the lower end of the range due to unfavourable changes in raw materials prices and foreign exchange rates. F I B E R T E X N O N W O V E N S maintains its FY 2017 revenue forecast, reflecting an improvement on 2016. The full-year EBIT forecast is also un-changed but with a greater probability of EBIT be-ing at the lower end of the range due to the chal-lenging prices of raw materials. H Y D R A S P E C M A maintains its forecast of revenue in line with last year, while the company lowers its EBIT forecast to a level around the low end of the previous range due to an increase in costs. B O R G A U T O M O T I V E has been consolidated from the date of acquisition on 1 April 2017. The com-pany maintains its revenue forecast for the nine-month consolidation period, but reduces its EBIT guidance to the lover part of the range. G P V has raised its revenue and EBIT forecasts once more due to strong organic growth and the successful acquisition of BHE earlier in the year.
Outlook
Interim Report – third quarter of 2017 Schouw & Co. 7
The Group’s overall guidance Overall, the Schouw & Co. Group now projects full-year 2017 consolidated revenue of about DKK 16.9 billion against the previous forecast of about DKK 16.7 billion. Schouw & Co. applies a profit forecast range for each individual business, and based on a simple aggregation of these ranges, the Group revises its consolidated full-year 2017 EBIT guidance to the range of DKK 1,055-1,145 million, including the effects of the Alimentsa acquisition, from the pre-vious range of DKK 1,025-1,155 million. In a weighted assessment, consolidated EBIT will most likely be in the range of DKK 1,065-1,135 million, which is unchanged from the past two quarters. Associates and joint ventures, which are recog-nised at a share of profit after tax, are now ex-pected to contribute combined profit of about DKK 45 million, up from the previous forecast of DKK 20 million. The change is predominantly due to the Chilean fish farming company Sal-mones Austral, which is recognised as an associ-ate effective from the third quarter of 2017, as BioMar has increased its ownership interest to 22.9%. Further, the result reflects that BioMar’s non-consolidated activities in China and Turkey have an increasing importance. Due to recent negative foreign exchange rate de-velopments, consolidated net financials are re-vised from a DKK 25 million expense to a DKK 40 million expense, mainly due to changes in ex-change rates of the Turkish lira (TRY), Malaysian
ringgit (MYR) and USD. As always, the forecast is subject to any positive or negative effects of any further exchange rate fluctuations. Roundings and presentation The amounts appearing in this interim report have generally been rounded to one decimal place using standard rounding principles. Accordingly, some additions may not add up. Accounting policies The interim report is presented in accordance with IAS 34 “Interim financial reporting” as adopted by the EU and Danish disclosure require-ments for consolidated and parent company fi-nancial statements of listed companies. Schouw & Co. has implemented the standards and interpretations which are effective from 2017. None of those standards and interpretations have had an effect on recognition and measurement in 2017. See the 2016 Annual Report for a full description of the accounting policies. Judgments and estimates The preparation of interim financial statements requires management to make accounting judg-ments and estimates that affect recognised assets, liabilities, income and expenses. Actual results may differ from these judgments.
Financial calendar for 2018 28 February 2018 Deadline for submission of proposals to be con-sidered at the annual general meeting 8 March 2018 Release of Annual Report 2017 12 April 2018 Annual general meeting 17 April 2018 Expected distribution of dividend 3 May 2018 Release of Q1 2018 interim report 17 August 2018 Release of H1 2018 interim report 8 November 2018 Release of Q3 2018 interim report The company provides detailed information about contacts and times of conference calls held in connection with the release of its interim reports through company announcements and postings on its website, www.schouw.dk.

Interim Report – third quarter of 2017 Schouw & Co. 8
The Board of Directors and Executive Management today considered and ap-proved the interim report for the period 1 January to 30 September 2017. The interim report, which has been neither audited nor reviewed by the com-pany’s auditors, was prepared in accordance with IAS 34 ‘Interim Financial Reporting’ as adopted by the EU and Danish disclosure requirements for listed companies. In our opinion, the interim financial statements give a true and fair view of the Group’s assets and liabilities and financial position at 30 September 2017 and of the results of the Group’s operations and cash flows for the period 1 January–30 September 2017. Furthermore, in our opinion the management's report includes a fair review of the development and performance of the business, the results for the pe-riod and the Group’s financial position in general and describes the principal risks and uncertainties that it faces. Aarhus, 13 November 2017
Executive Management Jens Bjerg Sørensen Peter Kjær President Board of Directors Jørn Ankær Thomsen Jørgen Wisborg Erling Eskildsen Chairman Deputy Chairman Niels Kristian Agner Kjeld Johannesen Agnete Raaschou-Nielsen Hans Martin Smith
Aktieselskabet Schouw & Co. Chr. Filtenborgs Plads 1 DK-8000 Aarhus C, Denmark T +45 86 11 22 22 www.schouw.dk [email protected] Company reg. (CVR) no. 63965812
Management statement
Interim Report – third quarter of 2017 Schouw & Co. 9

All amounts in DKK million Interim Report – third quarter of 2017 Schouw & Co. 10
BioMar is the world’s third-largest manufacturer of quality feed for the fish farming industry. The company’s operations are divided into three divi-sions: the Salmon division for the salmon opera-tions based in northern (Norway and Scotland) and southern (Chile) waters, an EMEA division for all operations not covered by the Salmon divi-sion and an Emerging Markets division for new territories and other business development activi-ties. BioMar’s acquisition of a 70% stake in Ecuado-rian shrimp feed producer Alimentsa closed in September 2017 after approval was obtained from the relevant authorities, and the company has now been consolidated. Alimentsa forms a part of the Emerging Markets division, which now en-compasses activities in Costa Rica, China and Ec-uador. Financial performance BioMar increased overall volumes sold by 10% in the third quarter relative to Q3 2016. The largest improvement was in the salmon business, in which BioMar increased its share of an extremely competitive market. Both Norway and Scotland reported strong market developments. Fish farming conditions have gen-erally been favourable, and biological conditions have improved over recent years, although they also gradually became more challenging during the quarter. The Chilean market is returning to normal following last year’s severe decline caused by the natural phenomenon of severe algal blooms in the spring of 2016. The EMEA division in-creased its sales volume to markets in northern
Europe. While volumes to southern Europe de-clined, the joint venture operations in Turkey in-creased sales volumes as the new factory, which began commercial operations in 2016, gradually increased its production output. That operation is not recognised in BioMar’s consolidated revenue and EBIT. The same applies to the joint venture operations in China, which forms a part of the Emerging Markets division. Consolidated revenue was up by 3.5% from DKK 2,945 million in Q3 2016 to DKK 3,048 million in Q3 2017. The revenue improvement was based on the higher volumes and the Alimentsa acquisi-tion, which contributed revenue of DKK 37 mil-lion in September, whereas foreign exchange ad-justments and raw materials prices had a negative effect on revenue. EBIT fell to DKK 213 million in Q3 2017 from DKK 233 million in Q3 2016, mainly due to in-creased market competition. When adjusted for acquisition costs and depreciation and impair-ment charges resulting from PPA, the Alimentsa acquisition has had no notable effect on Q3 earn-ings. Working capital fell from DKK 750 million at 30 September 2016 to DKK 447 million at 30 Sep-tember 2017, in part due to a drop in trade receiv-ables. ROIC excluding goodwill improved to 35.6% at 30 September 2017 from 30.2% at 30 September 2016. Business development BioMar agreed on 2 June 2017 to buy a 70% stake in Ecuadorian shrimp feed producer Alimentsa.
The selling shareholders have stayed on as non-controlling shareholders. The transaction received the approval of the relevant authorities on 31 Au-gust and closed on 13 September 2017. As the agreement includes an option for BioMar to take over the outstanding shares at a later date, the company has been fully consolidated, with the outstanding obligation being recognised in the balance sheet. In Norway, construction of a new production line at the existing factory in Karmøy ended in July, and the new production line (annual capacity 140,000 tonnes) is now operational. The project also involves expansion of warehouse and other efficiency-enhancing facilities, which are cur-rently being completed. In China, BioMar is constructing a new fish feed factory in Wuxi near Shanghai in a joint venture with Chinese partner Tongwei Co. Ltd. The fac-tory will have an annual capacity of about 50,000 tonnes and is expected to start operations in the second quarter of 2018. On 24 March 2017, BioMar announced an almost DKK 300 million investment in a new feed factory in Australia. Preparations at the factory are pro-gressing to plan, and BioMar continues to expect the new facility will be ready by the end of 2019 with an annual capacity of about 110,000 tonnes. BioMar increased its ownership interest in the Chilean fish farming company Salmones Austral to 22.9% in the third quarter of 2017, and the company is now recognised as an associate.
BioMar

All amounts in DKK million Interim Report – third quarter of 2017 Schouw & Co. 11
Outlook BioMar maintains its guidance of a significant revenue increase relative to 2016, despite unfa-vourable developments in foreign exchange rates and lower raw materials prices. The reported rev-enue for the first nine months of the year com-bined with contracts signed for the remainder of the year support this guidance. In addition, Ali-mentsa is expected to contribute about DKK 160 million to the full-year revenue for 2017. Against this background, BioMar now guides for revenue of about DKK 9.9 billion from the previous fore-cast of about DKK 9.8 billion. Full-year EBIT will inherently be lifted by the in-crease in sales, but will also be affected by unfa-vourable developments in foreign exchange rates and extremely competitive markets. In addition, the Alimentsa acquisition is expected to contrib-ute about DKK 20 million to EBIT, net of PPA-re-lated depreciation and impairment charges of DKK 8 million. Overall, BioMar now forecasts EBIT in the DKK 530-550 million range instead of the previous forecast range of DKK 510-550 mil-lion, which did not include the contribution from Alimentsa.
Q3
2017Q3
2016YTD
2017YTD
20162016Total
Volume (1,000 t) 360 326 832 696 966Revenue (DKK million) 3,048 2,945 7,318 6,377 8,867 - of which Salmon north 1,696 1,582 3,964 3,159 4,593 - of which Salmon south 462 531 1,468 1,389 1,903 - of which EMEA and Emerging 890 832 1,886 1,829 2,371
Q3
2017Q3
2016 YTD
2017 YTD
2016 2016 Total
INCOME STATEMENT Revenue 3,047.8 2,944.7 7,317.5 6,376.6 8,867.5Gross profit 401.6 401.4 880.9 812.8 1,133.2EBITDA 252.2 267.8 494.7 469.2 722.4Depreciation and impairment 39.4 35.0 108.3 103.4 141.4Operating profit (EBIT) 212.8 232.8 386.4 365.8 581.0Profit after tax from ass. and joint ventures 11.4 2.7 15.7 10.7 12.6Financial items, net -6.0 -5.2 19.2 -9.2 -16.4Profit before tax 218.3 230.2 421.3 367.3 577.1Tax for the period -48.6 -60.6 -89.2 -104.9 -148.4Profit for the period 169.7 169.7 332.1 262.3 428.7 CASH FLOWS Cash flows from operating activities 516.4 161.6 337.7 338.9 884.2Cash flows from investing activities -766.4 -80.4 -985.2 -230.1 -375.6Cash flows from financing activities 297.9 -39.1 521.7 -273.2 -633.7 BALANCE SHEET Intangible assets * 1,289.6 395.3 1,289.6 395.3 405.9Property, plant and equipment 1,247.4 990.3 1,247.4 990.3 1,049.3Other non-current assets 488.5 316.6 488.5 316.6 374.1Cash and cash equivalents 497.9 557.3 497.9 557.3 329.5Other current assets 3,135.2 3,170.2 3,135.2 3,170.2 3,408.6Total assets 6,658.6 5,429.7 6,658.6 5,429.7 5,567.4 Equity 2,401.1 2,122.0 2,401.1 2,122.0 2,347.7Interest-bearing debt 1,176.7 788.9 1,176.7 788.9 668.6Other creditors 3,080.8 2,518.8 3,080.8 2,518.8 2,551.1Total liabilities and equity 6,658.6 5,429.7 6,658.6 5,429.7 5,567.4 Average number of employees 993 877 943 883 887 FINANCIAL KEY FIGURES EBITDA margin 8.3% 9.1% 6.8% 7.4% 8.1%EBIT margin 7.0% 7.9% 5.3% 5.7% 6.6%ROIC excl. goodwill 35.6% 30.2% 35.6% 30.2% 35.8%ROIC incl. goodwill 23.3% 20.7% 23.3% 20.7% 24.4%Working capital 447.2 749.6 447.2 749.6 413.7Net interest-bearing debt 615.4 161.4 615.4 161.4 -234.1 * Excluding goodwill on consolidation in Schouw & Co. of DKK 430.2 million
BioMar

All amounts in DKK million Interim Report – third quarter of 2017 Schouw & Co. 12
Fibertex Personal Care is one of the world's larg-est manufacturers of spunbond/spunmelt nonwo-ven fabrics for the personal care industry. Its products are key components in baby diapers, sanitary towels and incontinence products. The company has production facilities in Denmark and Malaysia and mainly sells its products in Eu-rope and South-east Asia to customers represent-ing multinational brands for the consumer goods market. Its operations also include Innowo Print, a market leader in direct printing on nonwoven textiles for the personal care industry. Innowo Print has pro-duction facilities in Germany and Malaysia. Financial performance Fibertex Personal Care reported a 14% revenue increase to DKK 505 million in Q3 2017, up from DKK 444 million in Q3 2016. The improvement was mainly driven by an increase in revenue re-ported by Innowo Print. EBIT for Q3 2017 was DKK 70 million (Q3 2016: DKK 57 million), the increase driven mainly by improvements to the Danish operations, whose Q3 2016 EBIT was adversely affected by the planned closure and upgrade of a production line. Fibertex Personal Care increased its working capi-tal from DKK 276 million at 30 September 2016 to DKK 334 million at 30 September 2017, due to an increase in trade receivables and inventories. ROIC excluding goodwill fell from 22.5% at 30 September 2016 to 15.4% at 30 September 2017. The lower return was mainly due to an increase
in invested capital resulting from investments in a new factory unit in Malaysia, a new print line in Germany and a technology upgrade in Denmark, and these new investments have as yet only made moderate contributions to earnings. Business development Fibertex Personal Care regularly allocates re-sources for its extensive product development and product optimisation efforts. The company is working to develop softer products for improved skin comfort and to produce thinner and more lightweight materials while at the same time im-proving their ability to conduct and encapsulate liquids. The company is also working to improve its in-house processes to ensure customers have a highly reliable supply and a degree of flexibility in their sourcing of nonwovens. In 2016, Fibertex Personal Care launched an in-vestment to build another factory unit in Malaysia with a view to increasing the company’s total out-put capacity in the country. The project includes a new production site at Sendayan, some 25 km south of the existing factory at Nilai, outside Kuala Lumpur. The new site may eventually have as many as four production lines and thus pro-vides a suitable base for future expansion. Installation of the new production line was com-pleted in July. After it was commissioned and run in to begin manufacturing a number of both new and existing products, the line was ready to start operating early in the fourth quarter of 2017. This will be Fibertex Personal Care’s eighth production line and the company’s fifth in Malaysia. Not only
will it help grow capacity for the company’s cur-rent product range: it will also facilitate the pro-duction of super-soft products, a category in very high demand in Asian markets. Fibertex Personal Care is also investing heavily to expand its print facilities. In 2016, Fibertex Per-sonal Care added print facilities at the existing nonwovens plant at Nilai in order to accommo-date the growing demand for these products in Asian markets, and at the end of March 2017, Innowo Print in Germany added a new print line in response to the continuing growth in demand in Europe. Work is also currently ongoing to set up an additional print line in Malaysia, which is expected to be operational in the first quarter of 2018. In addition to expanding its print capacity in Ma-laysia, Fibertex Personal Care began building a print facility in North Carolina, USA, in the third quarter of 2017. This facility will cover the North and South American markets, which are expected to generate positive growth rates in the coming years. The US factory is expected to be ready for commercial operations at the end of 2018, and the overall investment will amount to about DKK 85 million.
Fibertex Personal Care
All amounts in DKK million Interim Report – third quarter of 2017 Schouw & Co. 13
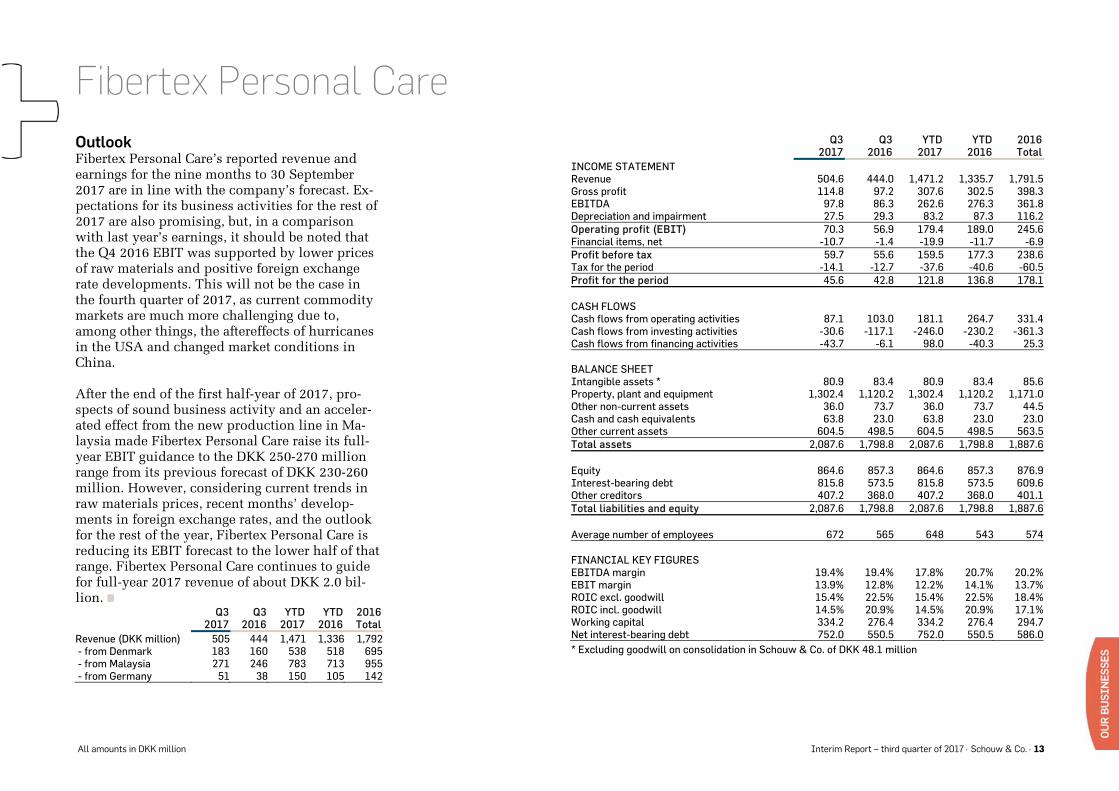
Outlook Fibertex Personal Care’s reported revenue and earnings for the nine months to 30 September 2017 are in line with the company’s forecast. Ex-pectations for its business activities for the rest of 2017 are also promising, but, in a comparison with last year’s earnings, it should be noted that the Q4 2016 EBIT was supported by lower prices of raw materials and positive foreign exchange rate developments. This will not be the case in the fourth quarter of 2017, as current commodity markets are much more challenging due to, among other things, the aftereffects of hurricanes in the USA and changed market conditions in China. After the end of the first half-year of 2017, pro-spects of sound business activity and an acceler-ated effect from the new production line in Ma-laysia made Fibertex Personal Care raise its full-year EBIT guidance to the DKK 250-270 million range from its previous forecast of DKK 230-260 million. However, considering current trends in raw materials prices, recent months’ develop-ments in foreign exchange rates, and the outlook for the rest of the year, Fibertex Personal Care is reducing its EBIT forecast to the lower half of that range. Fibertex Personal Care continues to guide for full-year 2017 revenue of about DKK 2.0 bil-lion.
Q3
2017Q3
2016YTD
2017YTD
20162016Total
Revenue (DKK million) 505 444 1,471 1,336 1,792 - from Denmark 183 160 538 518 695 - from Malaysia 271 246 783 713 955 - from Germany 51 38 150 105 142
Q3
2017Q3
2016 YTD
2017 YTD
2016 2016 Total
INCOME STATEMENT Revenue 504.6 444.0 1,471.2 1,335.7 1,791.5Gross profit 114.8 97.2 307.6 302.5 398.3EBITDA 97.8 86.3 262.6 276.3 361.8Depreciation and impairment 27.5 29.3 83.2 87.3 116.2Operating profit (EBIT) 70.3 56.9 179.4 189.0 245.6Financial items, net -10.7 -1.4 -19.9 -11.7 -6.9Profit before tax 59.7 55.6 159.5 177.3 238.6Tax for the period -14.1 -12.7 -37.6 -40.6 -60.5Profit for the period 45.6 42.8 121.8 136.8 178.1 CASH FLOWS Cash flows from operating activities 87.1 103.0 181.1 264.7 331.4Cash flows from investing activities -30.6 -117.1 -246.0 -230.2 -361.3Cash flows from financing activities -43.7 -6.1 98.0 -40.3 25.3 BALANCE SHEET Intangible assets * 80.9 83.4 80.9 83.4 85.6Property, plant and equipment 1,302.4 1,120.2 1,302.4 1,120.2 1,171.0Other non-current assets 36.0 73.7 36.0 73.7 44.5Cash and cash equivalents 63.8 23.0 63.8 23.0 23.0Other current assets 604.5 498.5 604.5 498.5 563.5Total assets 2,087.6 1,798.8 2,087.6 1,798.8 1,887.6 Equity 864.6 857.3 864.6 857.3 876.9Interest-bearing debt 815.8 573.5 815.8 573.5 609.6Other creditors 407.2 368.0 407.2 368.0 401.1Total liabilities and equity 2,087.6 1,798.8 2,087.6 1,798.8 1,887.6 Average number of employees 672 565 648 543 574 FINANCIAL KEY FIGURES EBITDA margin 19.4% 19.4% 17.8% 20.7% 20.2%EBIT margin 13.9% 12.8% 12.2% 14.1% 13.7%ROIC excl. goodwill 15.4% 22.5% 15.4% 22.5% 18.4%ROIC incl. goodwill 14.5% 20.9% 14.5% 20.9% 17.1%Working capital 334.2 276.4 334.2 276.4 294.7Net interest-bearing debt 752.0 550.5 752.0 550.5 586.0 * Excluding goodwill on consolidation in Schouw & Co. of DKK 48.1 million
Fibertex Personal Care

All amounts in DKK million Interim Report – third quarter of 2017 Schouw & Co. 14
Fibertex Nonwovens is among Europe's leading manufacturers of nonwovens, i.e. non-woven tex-tiles used for a large number of industrial pur-poses. The company's core markets are in Europe and North America and its secondary markets are in Africa and Asia. Financial performance Fibertex Nonwovens reported a 7% revenue in-crease to DKK 336 million in Q3 2017, up from DKK 314 million in Q3 2016. As in recent quar-ters, this revenue improvement was broadly based, with all production sites contributing. Q3 2017 EBIT was DKK 15 million (Q3 2016: DKK 17 million). The performance reflects high capac-ity utilisation at the European factories and im-proved performance in the USA, but which was offset by extremely challenging trends in raw ma-terials prices. The higher level of business activity drove work-ing capital to DKK 415 million at 30 September 2017, up from DKK 375 million at 30 September 2016. ROIC excluding goodwill increased from 7.4% at 30 September 2016 to 7.7% at 30 Septem-ber 2017. Business development Fibertex Nonwovens reported a generally positive performance in 2017, with growing sales to the automotive industry, an improved product mix that included higher sales of advanced products, and European sales of products for the construc-tion industry and for infrastructure projects that improved relative to last year. In addition, the
company grew its business activity in Asia, re-porting sales to major infrastructure projects, for example. The sales subsidiaries set up in India and China in 2016 supported this performance. In recent years, Fibertex Nonwovens has consoli-dated its position as a leading manufacturer of in-dustrial nonwovens. In terms of development and innovation, the company has built a solid portfo-lio of new projects, including products for the au-tomotive and composite industries and for filtra-tion and acoustic purposes. To capitalise on its growth potential, Fibertex Nonwovens expanded capacity by adding two new production lines in 2016, one in the Czech Republic and one in South Africa, and the company has made capex invest-ments in 2017 to further increase capacity and up-grade production lines to grow revenue and in-crease the proportion of value-added products of-fered. The main focus on the North American market in 2016 was to build up the market and prepare the manufacturing facility in the USA for a future in-crease in local production for the North American customer base. Fibertex Nonwovens’ US subsidi-ary reaped the results of these efforts in 2017, re-porting a revenue increase and improved earn-ings. The company has also built a strong cus-tomer portfolio, and setting up in the USA is con-sidered an important long-term investment in an attractive market expected to see significant growth. Market conditions in South Africa have been challenging in recent years, as weak economic ac-
tivity and low commodity prices constrained in-frastructure and mining projects, both in South Africa and in neighbouring countries. On the other hand, the South African factory has driven up business activity in the course of 2017, in part based on growing sales in local markets and, since 2016, on greater integration with the company’s global sales organisation, which is intended to im-prove sales from South Africa to relevant export markets. Outlook Fibertex Nonwovens expects stable business ac-tivity in the fourth quarter of 2017 combined with stable conditions in most markets and business segments. The main challenge is rising prices of the main commodities in 2017, which have trig-gered price increases in all product areas and made already competitive markets even more challenging. Commodity prices remain volatile but are expected to stabilise at a higher level. This will likely produce a negative effect on profits in the short term, until a satisfactory balance be-tween raw materials prices and selling prices can be restored. Fibertex Nonwovens’ operations have enjoyed the benefits in 2017 of the production lines upgraded in 2016 and the new capacity established in the Czech Republic and South Africa. South Africa will remain a weak-activity market, but a greater integration with the global sales organisation is expected to improve year-on-year earnings.
Fibertex Nonwovens
All amounts in DKK million Interim Report – third quarter of 2017 Schouw & Co. 15
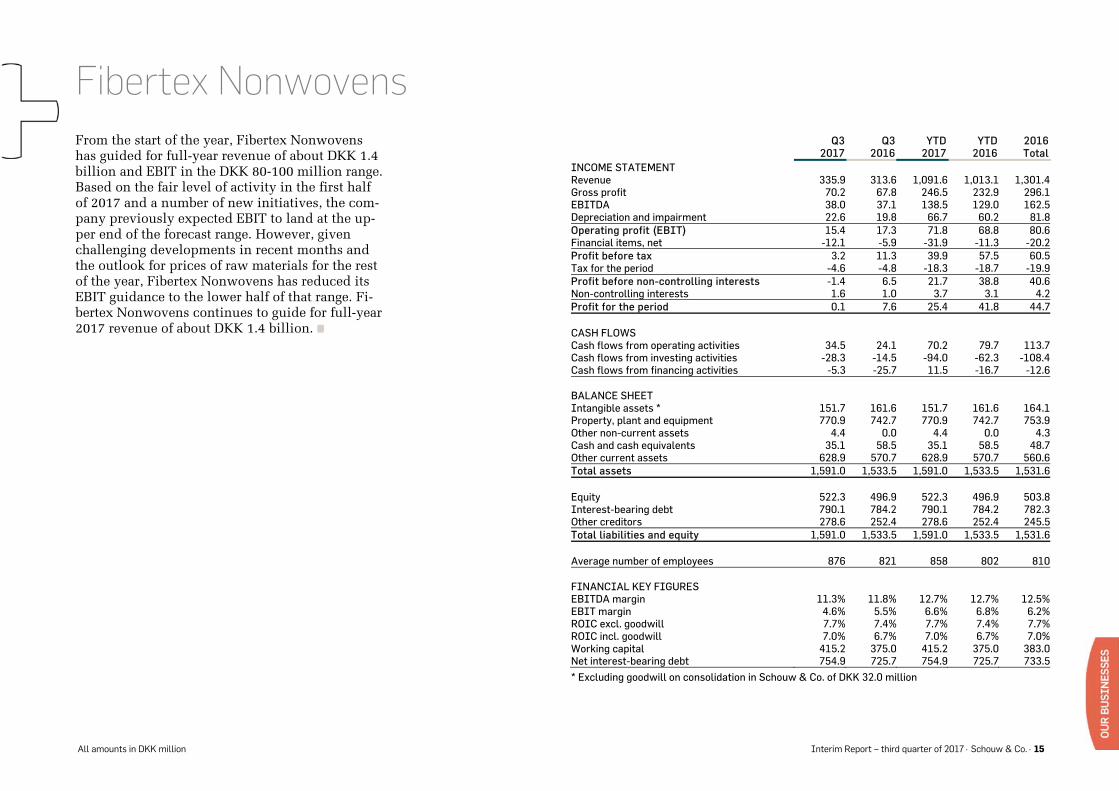
From the start of the year, Fibertex Nonwovens has guided for full-year revenue of about DKK 1.4 billion and EBIT in the DKK 80-100 million range. Based on the fair level of activity in the first half of 2017 and a number of new initiatives, the com-pany previously expected EBIT to land at the up-per end of the forecast range. However, given challenging developments in recent months and the outlook for prices of raw materials for the rest of the year, Fibertex Nonwovens has reduced its EBIT guidance to the lower half of that range. Fi-bertex Nonwovens continues to guide for full-year 2017 revenue of about DKK 1.4 billion.
Q3
2017Q3
2016 YTD
2017YTD
20162016 Total
INCOME STATEMENT Revenue 335.9 313.6 1,091.6 1,013.1 1,301.4Gross profit 70.2 67.8 246.5 232.9 296.1EBITDA 38.0 37.1 138.5 129.0 162.5Depreciation and impairment 22.6 19.8 66.7 60.2 81.8Operating profit (EBIT) 15.4 17.3 71.8 68.8 80.6Financial items, net -12.1 -5.9 -31.9 -11.3 -20.2Profit before tax 3.2 11.3 39.9 57.5 60.5Tax for the period -4.6 -4.8 -18.3 -18.7 -19.9Profit before non-controlling interests -1.4 6.5 21.7 38.8 40.6Non-controlling interests 1.6 1.0 3.7 3.1 4.2Profit for the period 0.1 7.6 25.4 41.8 44.7 CASH FLOWS Cash flows from operating activities 34.5 24.1 70.2 79.7 113.7Cash flows from investing activities -28.3 -14.5 -94.0 -62.3 -108.4Cash flows from financing activities -5.3 -25.7 11.5 -16.7 -12.6 BALANCE SHEET Intangible assets * 151.7 161.6 151.7 161.6 164.1Property, plant and equipment 770.9 742.7 770.9 742.7 753.9Other non-current assets 4.4 0.0 4.4 0.0 4.3Cash and cash equivalents 35.1 58.5 35.1 58.5 48.7Other current assets 628.9 570.7 628.9 570.7 560.6Total assets 1,591.0 1,533.5 1,591.0 1,533.5 1,531.6 Equity 522.3 496.9 522.3 496.9 503.8Interest-bearing debt 790.1 784.2 790.1 784.2 782.3Other creditors 278.6 252.4 278.6 252.4 245.5Total liabilities and equity 1,591.0 1,533.5 1,591.0 1,533.5 1,531.6 Average number of employees 876 821 858 802 810 FINANCIAL KEY FIGURES EBITDA margin 11.3% 11.8% 12.7% 12.7% 12.5%EBIT margin 4.6% 5.5% 6.6% 6.8% 6.2%ROIC excl. goodwill 7.7% 7.4% 7.7% 7.4% 7.7%ROIC incl. goodwill 7.0% 6.7% 7.0% 6.7% 7.0%Working capital 415.2 375.0 415.2 375.0 383.0Net interest-bearing debt 754.9 725.7 754.9 725.7 733.5 * Excluding goodwill on consolidation in Schouw & Co. of DKK 32.0 million
Fibertex Nonwovens

All amounts in DKK million Interim Report – third quarter of 2017 Schouw & Co. 16
HydraSpecma is a specialised manufacturing, trading and engineering company whose core business is hydraulic components and systems development for industry and the aftermarket. The company is a hydraulics market leader in the Nordic region, which is the base of its core opera-tions, and also serves customers in other parts of Europe and in selected business segments in China, India, the USA and Brazil. Financial performance HydraSpecma reported a 6% revenue increase to DKK 409 million in Q3 2017, up from DKK 387 million in Q3 2016. The company has sustained its high level of business activity with OEM cus-tomers and industrial and aftermarket customers in the building and construction segments, mate-rials handling, mining, forestry and the automo-tive segment (lorries and buses), whereas the ma-rine, defence and offshore segments continue to feel the effects of slumping market demand. The wind power segment has reported softening activ-ity in overseas markets, while European markets have performed in line with expectations. The Q3 2017 EBIT amounted to DKK 18 million, compared with DKK 27 million in Q3 2016. EBIT was affected by depreciation charges of DKK 6 million in both quarterly periods, due to the PPA adjustments made in connection with the acquisi-tion of Specma in January 2016. An unexpectedly high level of business activity in certain product areas weighed on the Q3 2017 EBIT, causing HydraSpecma to incur additional costs in meeting customer demand, especially in Sweden. In addition, the company incurred costs
from planned structural changes and building an organisation capable of achieving future targets. The Q3 period was also affected by reduced earn-ings in the overseas units due to the continued slump in activity in the marine and wind power segments. Working capital rose from DKK 497 million at 30 September 2016 to DKK 531 million at 30 Sep-tember 2017. ROIC excluding goodwill fell from 18.2% at 30 September 2016 to 14.7% at 30 Sep-tember 2017, the main reason for the change in the reported return being that Specma had only been recognised for nine of the preceding 12 months at the end of the third quarter of 2016. Business development The acquisition of Specma in January 2016 has se-cured HydraSpecma of a strong base in the Nordic region and a solid platform for serving global cus-tomers. Since the merger, HydraSpecma has fo-cused especially on achieving procurement syner-gies, and these efforts are now being continued through its newly established Product Manage-ment Group. The company continues the work to build value from integration across the entire or-ganisation with a special focus on cross-selling, product assortment and on optimising production and logistics. HydraSpecma is reporting positive sales perfor-mances to several key customer groups, and will in the upcoming period be investing to further au-tomate and upgrade its production facilities with a view to meeting demand and cutting production costs.
At the end of 2016, HydraSpecma acquired the ac-tivities of Chinese company Etola Hydraulic Sys-tems (Tianjin) Co., and the activities were rolled into Hydra-Grene’s existing operations in China. As a result, this combined unit has encountered a number of practical and organisational changes that have taken longer to implement than origi-nally expected. However, the takeover has given HydraSpecma a stronger production platform close to strategic wind turbine customers in the Beijing region and a potential for growing sales to overseas customers. HydraSpecma also has pro-duction facilities in the Shanghai region. Like the rest of HydraSpecma, the China-based units col-laborate to achieve synergies in procurement, de-sign, product assortment and production optimi-sation. In its US operations, HydraSpecma has estab-lished warehousing facilities from which it serves US customers in the wind power segment. So far, shipments have involved complete units and components manufactured at HydraSpecma’s pro-duction sites in Europe, but during the fourth quarter of 2017, the company will begin to ship products manufactured at its Chinese sites as well.
HydraSpecma

All amounts in DKK million Interim Report – third quarter of 2017 Schouw & Co. 17
Outlook HydraSpecma expects to maintain the high level of business activity in most of its European mar-ket segments, with the exception of the offshore and marine segments, in which demand is ex-pected to remain subdued due to excess capacity. The Chinese market is expected to remain soft for the rest of the year, and sales to the wind power segment in India are negligible due to new regula-tions introduced in government wind power auc-tions. HydraSpecma maintains its guidance for a full-year 2017 revenue of about DKK 1.8 billion, but the company expects changes to the mix of seg-ment contributions. The company has launched a number of initiatives and made investments that will increase costs in the short term, but which have been necessary to align its operations to the change in the revenue mix, and which are an im-portant prerequisite for achieving future targets. Due to the higher costs and the lower level of business activity in China and India, Hy-draSpecma lowers its full-year EBIT forecast to about DKK 100 million (previously DKK 100-120 million). The EBIT forecast is net of DKK 23 mil-lion in PPA-related depreciation charges.
Q3
2017 Q3
2016YTD
2017YTD
20162016 Total
INCOME STATEMENT Revenue 408.9 387.5 1,341.9 1,306.5 1,746.9Gross profit 107.4 101.0 361.9 331.5 443.7EBITDA 33.1 42.0 120.7 129.8 169.9Depreciation and impairment 15.0 14.6 45.0 43.2 59.4Operating profit (EBIT) 18.0 27.4 75.7 86.6 110.6Financial items, net -5.2 -2.7 -17.1 -6.5 -7.8Profit before tax 12.8 24.7 58.7 80.1 102.8Tax for the period -2.4 -4.9 -13.0 -16.3 -22.3Profit before non-controlling interests 10.4 19.8 45.7 63.8 80.5Non-controlling interests 0.0 -0.3 1.4 -1.7 -1.4Profit for the period 10.5 19.5 47.1 62.1 79.1 CASH FLOWS Cash flows from operating activities -5.8 25.1 26.4 65.8 127.7Cash flows from investing activities -10.7 -18.4 -26.7 -521.5 -545.0Cash flows from financing activities 8.4 -10.9 9.4 489.9 445.5 BALANCE SHEET Intangible assets 298.8 316.4 298.8 316.4 315.7Property, plant and equipment 186.1 178.6 186.1 178.6 191.9Other non-current assets 10.4 4.5 10.4 4.5 6.7Cash and cash equivalents 88.3 76.8 88.3 76.8 36.0Other current assets 818.7 745.1 818.7 745.1 806.1Total assets 1,402.3 1,321.4 1,402.3 1,321.4 1,356.4 Equity 446.5 385.6 446.5 385.6 407.1Interest-bearing debt 599.3 600.4 599.3 600.4 594.4Other creditors 356.5 335.4 356.5 335.4 354.9Total liabilities and equity 1,402.3 1,321.4 1,402.3 1,321.4 1,356.4 Average number of employees 1,166 1,017 1,129 1,004 1,020 FINANCIAL KEY FIGURES EBITDA margin 8.1% 10.8% 9.0% 9.9% 9.7%EBIT margin 4.4% 7.1% 5.6% 6.6% 6.3%ROIC excl. goodwill 14.7% 18.2% 14.7% 18.2% 16.1%ROIC incl. goodwill 12.5% 15.6% 12.5% 15.6% 13.6%Working capital 531.3 497.0 531.3 497.0 462.9Net interest-bearing debt 511.0 523.5 511.0 523.5 497.0
HydraSpecma
All amounts in DKK million Interim Report – third quarter of 2017 Schouw & Co. 18
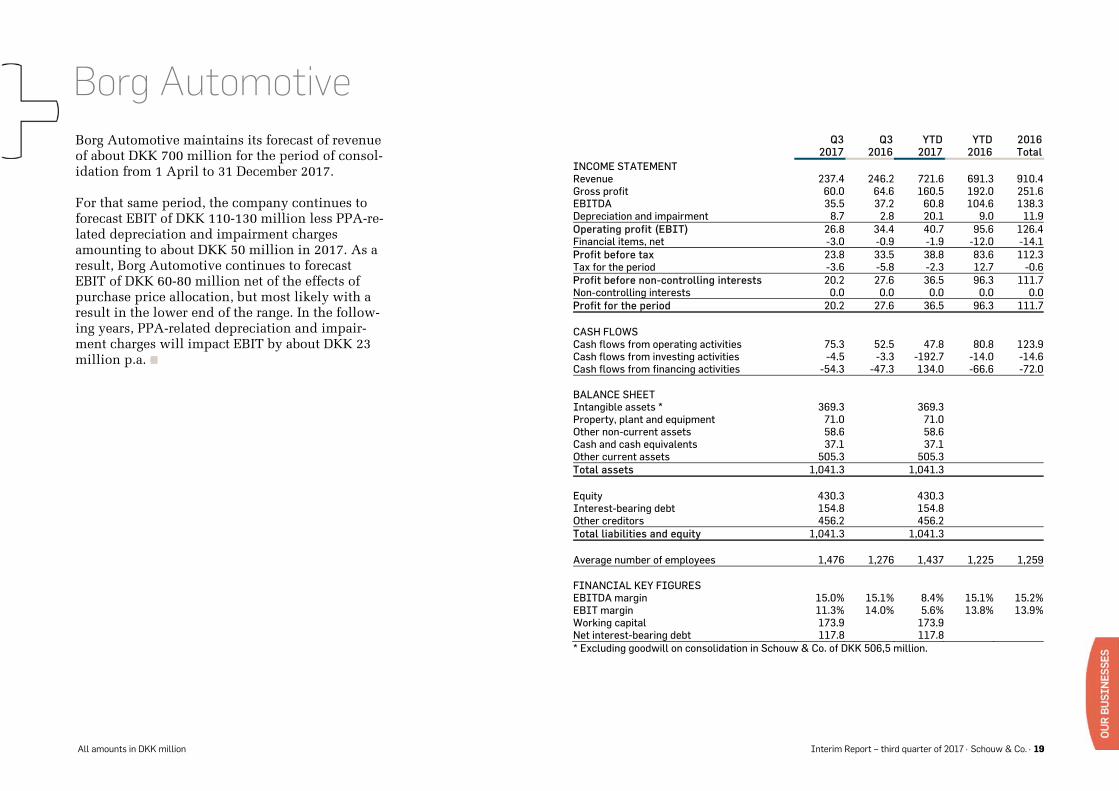
One of Europe’s largest remanufacturing compa-nies, Borg Automotive produces, sells and distrib-utes remanufactured automotive parts for the Eu-ropean market. Borg Automotive sells its products under three different brands: Lucas, Elstock and DRI, Elstock and DRI being proprietary brands. The company’s main products are starters, alter-nators, brake calipers, air-condition compressors, EGR valves, steering racks and pumps. Headquar-tered in Silkeborg, Denmark, Borg Automotive op-erates production facilities in Poland and the UK and a sales and development subsidiary in Bel-gium. As Schouw & Co. acquired Borg Automotive at 1 April 2017, the company was consolidated effec-tive from the second quarter of 2017. For ease of comparison, however, the YTD and FY 2016 in-come statement items shown in the financial highlights table also contain Q1 data. Balance sheet figures for prior periods are not directly comparable and have been left out of the table. Financial performance Borg Automotive reported Q3 2017 revenue of DKK 237 million, compared with DKK 246 mil-lion in Q3 2016 when the company was not con-solidated. The moderate fall is mainly considered to reflect quarterly timing differences. Comparable EBIT was DKK 32 million in Q3 2017 against DKK 34 million in Q3 2016. However, on recognition in Schouw & Co.’s Q3 2017 consoli-dated financial statements, EBIT is impacted by almost DKK 6 million in PPA-related depreciation
and impairment charges, which brings reported EBIT to DKK 27 million. EBIT for the nine months to September 30, 2017 was DKK 41 million, impacted by non-recurring costs of DKK 22 million that were incurred prior to the acquisition at 1 April 2017 and amortisa-tion and depreciation charges, etc. totalling DKK 43 million due to purchase price allocation. Ad-justed for these items, EBIT for the period was DKK 106 million, against DKK 96 million in the year-earlier period. Business development Borg Automotive reported positive growth in de-mand in the third quarter of 2017. Borg Automo-tive has two sales departments: based in Den-mark, Elstock sells to the independent aftermar-ket, while CPI, based in Belgium, sells to private label customers, including OES (Original Equip-ment Service) customers. Both sales departments have felt the positive trends in demand seen across the entire product range. Developing the product programme, optimising production and ensuring complementary opera-tions at the two production units in Poland and the UK is an ongoing priority at Borg Automotive. After Schouw & Co. took over the business, the company has accelerated its strategy work in or-der to explore the business opportunities availa-ble in the market. The financial leverage that comes with the long-term ownership is expected to provide a platform for both geographical and product expansion.
Over the past few years, Borg Automotive has generated stable organic growth in terms of both sales volume and revenue. Ongoing negotiations with major OES customers for additional long-term agreements support the outlook for continu-ing positive developments. Borg Automotive’s strong performance makes it relevant to ramp up capacity, and work continues to plan future production expansion in eastern Europe. The purpose of the upcoming expansion will be to build the capacity to manage a wider product range and a broader geographical foot-print, while also maintaining a level of service of the current customer base that is compliant with the ever-growing demand for speed of delivery, precision and quality. Outlook The market Borg Automotive serves has experi-enced considerable customer consolidation in re-cent years, as many other industries have. Obvi-ously, the consolidating businesses achieve higher procurement volumes, leading to a change in trade patterns. On the positive side, consolidation also facilitates higher sales volumes. Borg Automotive has a broad product portfolio and a strong pipeline that will continue to support positive sales develop-ments to the independent aftermarket, the private label market and to the OES segment.
Borg Automotive
All amounts in DKK million Interim Report – third quarter of 2017 Schouw & Co. 19
Borg Automotive maintains its forecast of revenue of about DKK 700 million for the period of consol-idation from 1 April to 31 December 2017. For that same period, the company continues to forecast EBIT of DKK 110-130 million less PPA-re-lated depreciation and impairment charges amounting to about DKK 50 million in 2017. As a result, Borg Automotive continues to forecast EBIT of DKK 60-80 million net of the effects of purchase price allocation, but most likely with a result in the lower end of the range. In the follow-ing years, PPA-related depreciation and impair-ment charges will impact EBIT by about DKK 23 million p.a.
Q3
2017Q3
2016YTD
2017YTD
20162016 Total
INCOME STATEMENT Revenue 237.4 246.2 721.6 691.3 910.4Gross profit 60.0 64.6 160.5 192.0 251.6EBITDA 35.5 37.2 60.8 104.6 138.3Depreciation and impairment 8.7 2.8 20.1 9.0 11.9Operating profit (EBIT) 26.8 34.4 40.7 95.6 126.4Financial items, net -3.0 -0.9 -1.9 -12.0 -14.1Profit before tax 23.8 33.5 38.8 83.6 112.3Tax for the period -3.6 -5.8 -2.3 12.7 -0.6Profit before non-controlling interests 20.2 27.6 36.5 96.3 111.7Non-controlling interests 0.0 0.0 0.0 0.0 0.0Profit for the period 20.2 27.6 36.5 96.3 111.7 CASH FLOWS Cash flows from operating activities 75.3 52.5 47.8 80.8 123.9Cash flows from investing activities -4.5 -3.3 -192.7 -14.0 -14.6Cash flows from financing activities -54.3 -47.3 134.0 -66.6 -72.0 BALANCE SHEET Intangible assets * 369.3 369.3 Property, plant and equipment 71.0 71.0 Other non-current assets 58.6 58.6 Cash and cash equivalents 37.1 37.1 Other current assets 505.3 505.3 Total assets 1,041.3 1,041.3 Equity 430.3 430.3 Interest-bearing debt 154.8 154.8 Other creditors 456.2 456.2 Total liabilities and equity 1,041.3 1,041.3 Average number of employees 1,476 1,276 1,437 1,225 1,259 FINANCIAL KEY FIGURES EBITDA margin 15.0% 15.1% 8.4% 15.1% 15.2%EBIT margin 11.3% 14.0% 5.6% 13.8% 13.9%Working capital 173.9 173.9 Net interest-bearing debt 117.8 117.8 * Excluding goodwill on consolidation in Schouw & Co. of DKK 506,5 million.
Borg Automotive
All amounts in DKK million Interim Report – third quarter of 2017 Schouw & Co. 20
GPV is Denmark’s largest EMS (Electronic Manu-facturing Services) company and a significant in-ternational player in its field. The company is a high-mix/low-medium (HMLM) volume manufac-turer. GPV's core products are both electronics and mechatronics (combination of electronics, software and mechanical technology). Headquar-tered in Denmark, GPV has production facilities in Denmark, Thailand and Mexico. Its customers are primarily major international businesses with a leading position in their partic-ular field and typically headquartered in Europe or North America. GPV sells its products to inter-national customer units in large parts of the world and ships to customers in more than 30 countries. GPV was acquired by Schouw & Co. at 1 April 2016, and was thus only consolidated as of the second quarter of 2016. For ease of comparison, however, the YTD and full-year 2016 income statement items shown in the financial highlights table also contain Q1 2016 data. Financial performance GPV continued its positive performance of the year in the third quarter, lifting revenue by 36% to DKK 305 million, up from DKK 225 million in Q3 2016. Contributing to the revenue performance was GPV’s acquisition of another EMS company, BHE A/S, which took effect on 1 March 2017.
EBIT rose to DKK 24 million in Q3 2017, up from DKK 20 million in Q3 2016, an improvement driven by an increase in business activity, even with costs incurred for business expansion pur-poses. Working capital amounted to DKK 269 million at 30 September 2017, compared with DKK 199 mil-lion at 30 September 2016. ROIC excluding good-will increased from 15.0% at 30 September 2016 to 18.0% at 30 September 2017, despite an in-crease in investments during the reporting period, which included the BHE acquisition, setting up in Mexico and major business activity expansion. Business development The HMLM volume segment of the technical elec-tronics and mechatronics market is highly de-manding in terms of testing skills and service ex-cellence. Meeting customer requirements for high quality standards and reliability of supply is a big priority for GPV, and the company is able to ab-sorb to a reasonable extent shifts in demand caused by market fluctuations. With a view to en-suring sufficient flexibility, GPV runs an invest-ment programme to increase automation and ex-pand SMT capacity at all three of its electronics factories – in Thailand, Denmark and Mexico – while also investing in its two mechatronics facil-ities in Thailand and Denmark. The electronics factory established recently in Guadalajara, Mexico, is a strategic location for
GPV in terms of manufacturing and shipping in the three major time zones of Asia, Europe and the Americas. Commissioned in the first quarter of 2017, the new factory will enable GPV to share in its existing customers’ growth in North Amer-ica and to expand its share of the HMLM volume technical electronics market. Acquiring BHE is consistent with GPV’s strategic 2020 growth plan, a key element of which is to take part in consolidating northern Europe’s EMS market. Integration of BHE’s operations with GPV’s existing platform is progressing to plan and will be completed in 2017. Outlook The trend of outsourcing production in the sec-tors in which GPV operates is expected to con-tinue, as customers increasingly focus on their core skills. This approach allows OEM customers to cut back on their capital expenditure and in-ventories while still retaining access to flexibility and, through GPV, an outsourcing partner capable of handling their manufacturability analysis, com-plex production, test designs, testing and logis-tics. The general market forecast for 2017 continues to indicate a positive trend in Europe. The same ap-plies to the US market, although market condi-tions there are more volatile, whereas markets in China and Russia are expected to weaken.
GPV

All amounts in DKK million Interim Report – third quarter of 2017 Schouw & Co. 21
The positive market trends seen in 2017 to date have resulted in longer delivery times for certain electronic components, which could impact GPV’s operations in the remainder of 2017 and the first half of 2018. The general market situation, new products, new cus-tomers and the BHE acquisition have all had a positive effect on the 2017 revenue guidance. BHE’s ordinary operations are expected to support the financial re-sults, but BHE's overall earnings contribution for 2017 is expected to be negative due to necessary integration costs. As a result, GPV is again raising its full-year revenue forecast, this time to the DKK 1,075-1,125 million range (from previously about DKK 1,000-1,050 million) and its EBIT guidance range to DKK 70-80 million (from previously DKK 60-70 million).
Q3
2017Q3
2016YTD
2017YTD
20162016Total
INCOME STATEMENT Revenue 304.9 225.0 852.3 652.2 876.8Gross profit 64.7 50.9 183.6 132.9 183.4EBITDA 31.2 25.4 81.5 60.5 84.2Depreciation and impairment 7.2 5.6 20.5 17.7 23.6Operating profit (EBIT) 24.0 19.8 61.0 42.9 60.6Financial items, net 1.9 0.1 4.5 -4.5 -7.2Profit before tax 25.9 19.9 65.5 38.3 53.5Tax for the period -5.4 -0.2 -13.5 1.4 6.7Profit before non-controlling interests 20.5 19.8 52.0 39.7 60.1Non-controlling interests 0.0 0.0 0.0 0.0 0.0Profit for the period 20.5 19.8 52.0 39.7 60.1 CASH FLOWS Cash flows from operating activities -22.4 19.6 -5.0 66.7 106.5Cash flows from investing activities -15.9 -10.2 -79.0 -16.3 -41.7Cash flows from financing activities 16.4 -2.0 55.0 -27.8 -27.7 BALANCE SHEET Intangible assets 18.7 0.0 18.7 0.0 0.0Property, plant and equipment 224.6 176.4 224.6 176.4 199.3Other non-current assets 23.1 17.4 23.1 17.4 24.6Cash and cash equivalents 17.6 39.0 17.6 39.0 51.5Other current assets 541.3 380.4 541.3 380.4 362.1Total assets 825.3 613.2 825.3 613.2 637.5 Equity 199.3 135.4 199.3 135.4 164.5Interest-bearing debt 348.3 296.7 348.3 296.7 291.2Other creditors 277.7 181.1 277.7 181.1 181.8Total liabilities and equity 825.3 613.2 825.3 613.2 637.5 Average number of employees 1,314 1,079 1,231 1,060 1,074 FINANCIAL KEY FIGURES EBITDA margin 10.2% 11.3% 9.6% 9.3% 9.6%EBIT margin 7.9% 8.8% 7.2% 6.6% 6.9%ROIC excl. goodwill 18.0% 15.0% 18.0% 15.0% 15.9%ROIC incl. goodwill 17.5% 15.0% 17.5% 15.0% 15.9%Working capital 269.5 198.9 269.5 198.9 181.4Net interest-bearing debt 330.8 257.7 330.8 257.7 239.7
GPV

All amounts in DKK million Interim Report – third quarter of 2017 Schouw & Co. 22

All amounts in DKK million Interim Report – third quarter of 2017 Schouw & Co. 23
Note Income statement Q3
2017Q3
2016YTD
2017YTD
20162016Total
1 Revenue 4,835.3 4,325.3 12,541.4 10,473.5 14,369.1
Cost of sales -4,017.0 -3,605.9 -10,471.9 -8,700.2 -11,952.3Gross profit 818.3 719.4 2,069.5 1,773.3 2,416.8
Other operating income 21.3 10.0 24.6 43.6 73.8Distribution costs -287.8 -230.5 -792.2 -658.8 -879.4
2 Administrative expenses -183.9 -147.9 -520.6 -434.9 -570.6Other operating expenses -6.0 -0.1 -2.8 -0.2 -2.1Operating profit (EBIT) 361.9 350.9 778.5 723.0 1,038.5
Profit after tax in associates 10.3 519.3 12.6 567.8 571.5Profit after tax in joint ventures 0.0 -3.5 2.1 -4.6 -5.1Financial income 9.6 9.5 71.2 23.2 33.3Financial expenses -35.3 -16.3 -98.6 -46.2 -59.9Profit before tax 346.5 859.9 765.8 1,263.2 1,578.3 Tax on profit -84.2 -83.5 -180.7 -178.1 -239.5Profit for the period 262.3 776.4 585.1 1,085.1 1,338.8
Attributable to Shareholders of Schouw & Co. 263.9 777.1 590.3 1,086.5 1,341.5
Non-controlling interests -1.6 -0.7 -5.2 -1.4 -2.7Profit for the period 262.3 776.4 585.1 1,085.1 1,338.8
8 Earnings per share (DKK) 11.03 32.74 24.77 45.82 56.568 Diluted earnings per share (DKK) 10.96 32.65 24.60 45.72 56.41
Comprehensive income Q3
2017 Q3
2016YTD
2017YTD
20162016 Total
Items that can be reclassified to the profit and loss statement: Exchange rate adjustment of foreign subsidiaries -78.4 -39.2 -207.6 -64.5 -16.0Hedging instruments recognised 6.3 -18.9 6.4 -11.7 -4.1Hedging instruments transferred to cost of sales 8.3 0.0 0.5 -0.8 -0.8Hedging instruments transferred to financials 0.4 -0.3 2.8 0.2 7.1Value adjustment of financial liabilities 58.3 0.0 58.3 0.0 0.0Other comprehensive income from ass. and joint ven-tures -0.1 22.5 -0.8 21.0 10.0Other adjustment on equity -0.2 -0.8 0.7 -5.5 -4.3Tax on other comprehensive income -3.4 5.0 -2.8 4.0 -0.2Other comprehensive income after tax -8.8 -31.7 -142.5 -57.3 -8.3 Profit for the period 262.3 776.4 585.1 1,085.1 1,338.8Total recognised comprehensive income 253.5 744.7 442.6 1,027.8 1,330.5 Attributable to Shareholders of Schouw & Co. 255.9 744.7 448.8 1,028.5 1,334.6Non-controlling interests -2.4 0.0 -6.2 -0.7 -4.1Total recognised comprehensive income 253.5 744.7 442.6 1,027.8 1,330.5
Statements of income and comprehensive income

All amounts in DKK million Interim Report – third quarter of 2017 Schouw & Co. 24
Note Assets 30/9 2017
31/12 2016
30/92016
31/122015
Goodwill 2,216.9 1,168.6 1,147.8 1,006.1 Completed development projects 17.3 7.7 24.5 0.0 Development projects in progress 2.8 0.0 2.9 0.0 Other intangible assets 988.7 305.2 291.7 169.9 Intangible assets 3,225.7 1,481.5 1,466.9 1,176.0 Land and buildings 1,649.0 1,420.6 1,400.7 1,260.2 Plant and machinery 1,519.1 1,328.0 1,124.7 1,152.3 Other fixtures, tools and equipment 135.5 93.5 125.6 65.4 Assets under construction, etc. 569.4 608.0 642.3 298.3 Property, plant and equipment 3,873.0 3,450.1 3,293.3 2,776.2 Equity investments in associates 330.1 62.6 61.5 570.3 Equity investments in joint ventures 162.1 171.2 115.2 109.1 Securities 5.3 121.3 115.3 83.9 Deferred tax 89.4 35.5 37.7 18.1
Receivables 99.9 138.9 156.4 177.7 Other non-current assets 686.8 529.5 486.1 959.1
Total non-current assets 7,785.5 5,461.1 5,246.3 4,911.3 Inventories 2,709.2 1,970.5 2,038.6 1,435.1
3 Receivables 3,448.8 3,103.7 3,308.0 2,752.7 Income tax receivable 85.7 55.3 8.3 5.9 Securities 0.0 0.0 1,034.5 0.1 Cash and cash equivalents 562.2 1,682.4 549.2 1,410.7 Total current assets 6,805.9 6,811.9 6,938.6 5,604.5 Total assets 14,591.4 12,273.0 12,184.9 10,515.8
Note Liabilities and equity 30/9 2017
31/12 2016
30/9 2016
31/12 2015
5 Share capital 255.0 255.0 255.0 255.0 Hedge transaction reserve -3.6 -10.7 -21.0 -12.4 Fair value adjustment reserve 58.3 0.0 0.0 0.0 Exchange adjustment reserve 33.8 240.4 197.9 263.1 Retained earnings 7,700.9 7,006.1 7,051.7 5,895.1 Proposed dividend 0.0 306.0 0.0 255.0
Share of equity attributable to the parent company 8,044.4 7,796.8 7,483.6 6,655.8
Non-controlling interests 11.4 17.6 20.0 20.7 Total equity 8,055.8 7,814.4 7,503.6 6,676.5 Deferred tax 340.8 188.6 202.2 147.9 Pensions and similar liabilities 386.8 100.4 103.8 106.3
6 Credit institutions 550.6 402.2 386.8 686.6 Non-current liabilities 1,278.2 691.2 692.8 940.8
6 Current portion of non-current debt 131.5 152.1 158.5 190.66 Credit institutions 1,014.6 168.8 485.8 109.4 Trade payables and other payables 3,973.3 3,339.4 3,246.4 2,567.1 Income tax 138.0 107.1 97.8 31.4 Current liabilities 5,257.4 3,767.4 3,988.5 2,898.5 Total liabilities 6,535.6 4,458.6 4,681.3 3,839.3 Total liabilities and equity 14,591.4 12,273.0 12,184.9 10,515.8
Notes without reference 7 & 9.
Balance sheet · assets and liabilities

All amounts in DKK million Interim Report – third quarter of 2017 Schouw & Co. 25
Note Q3
2017Q3
2016 YTD
2017 YTD
2016 2016Total
Profit before tax 346.5 859.9 765.8 1,263.2 1,578.3
Adjustment for operating items of a non-cash nature, etc.:
Depreciation and impairment losses 121.1 120.1 346.3 322.6 434.0 Other operating items, net 33.4 0.1 35.7 -37.3 13.7 Provisions -11.9 -0.3 1.4 -0.7 -1.1
Profit/(loss) after tax in associates and joint ventures -10.3 -515.8 -14.7 -563.2 -566.4
Financial income -9.6 -9.5 -71.2 -23.2 -33.3 Financial expenses 35.3 16.3 98.6 46.2 59.9
Cash flows from operating activities be-fore changes in working capital 504.5 470.8 1,161.9 1,007.6 1,485.1
Changes in working capital 212.8 -88.4 -212.8 -38.9 371.6 Cash flows from operating activities 717.3 382.4 949.1 968.7 1,856.7
Interest income received 13.1 3.1 26.0 14.5 25.2Interest expenses paid -27.3 -14.2 -69.6 -35.5 -54.5
Cash flows from ordinary activities 703.1 371.3 905.5 947.7 1,827.4 Income tax paid -13.6 -8.7 -196.9 -103.1 -229.3 Cash flows from operating activities 689.5 362.6 708.6 844.6 1,598.1
Purchase of intangible assets -1.3 -2.1 -7.3 -4.0 -18.8 Sale of intangible assets 0.0 0.0 0.1 0.0 0.0 Purchase of property, plant and equipment -137.1 -242.8 -592.8 -535.7 -828.3 Sale of property, plant and equipment 0.4 0.5 4.0 1.0 5.9
4 Acquisition of enterprises -734.5 0.0 -1,661.6 -551.0 -551.0
Acquisition/capital increase in ass. and joint ventures -63.5 0.0 -87.0 -13.3 -74.3
Divestment of associates 0.0 0.0 0.0 0.0 1,033.8 Received dividend from associates 0.0 63.5 0.0 64.3 64.3
Additions/disposals of other financial as-sets 79.1 11.2 2.3 -18.5 -27.1Cash flows from investing activities -856.9 -169.7 -2,342.3 -1,057.2 -395.5
Q3
2017Q3
2016YTD
2017YTD
2016 2016 Total
Debt financing: Repayment of non-current liabilities -28.0 -263.5 -83.6 -435.0 -488.7Proceeds from incurring non-current financial lia-bilities 22.3 9.1 198.6 32.4 103.5Increase (repayment) of bank overdrafts 186.7 169.9 629.6 -33.7 -332.3Shareholders: Capital contributions, etc. by non-controlling inter-ests 0.0 0.0 0.0 0.0 1.0Dividend paid 0.0 0.0 -285.6 -237.7 -237.7Purchase/sale of treasury shares, net 31.7 0.0 68.6 27.8 28.9Cash flows from financing activities 212.7 -84.5 527.6 -646.2 -925.3 Cash flows for the period 45.3 108.4 -1,106.1 -858.8 277.3Cash and cash equivalents at 1 Jul./Jan. 519.9 441.5 1,682.4 1,410.7 1,410.7Value adjustment of cash and cash equivalents -3.0 -0.7 -14.1 -2.7 -5.6Cash and cash equivalents at 30 Sep./Dec. 562.2 549.2 562.2 549.2 1,682.4
Cash flow statement

All amounts in DKK million Interim Report – third quarter of 2017 Schouw & Co. 26
Share capital
Hedge transaction
reserve
Fair valueadjustment
reserve
Exchange adjustment
reserveRetained earnings
Proposed dividend Total
Non- controlling
interests Total equity Equity at 1 January 2016 255.0 -12.4 0.0 263.1 5,895.1 255.0 6,655.8 20.7 6,676.5 Other comprehensive income Exchange rate adjustment of foreign subsidiaries 0.0 0.0 0.0 -65.2 0.0 0.0 -65.2 0.7 -64.5 Value adj. of hedging instruments recognised 0.0 -11.7 0.0 0.0 0.0 0.0 -11.7 0.0 -11.7 Hedging instruments transferred to cost of sales 0.0 -0.8 0.0 0.0 0.0 0.0 -0.8 0.0 -0.8 Hedging instruments transferred to financials 0.0 0.2 0.0 0.0 0.0 0.0 0.2 0.0 0.2 Other comprehensive income from associates and JVs 0.0 0.0 0.0 0.0 21.0 0.0 21.0 0.0 21.0 Other adjustment on equity 0.0 0.0 0.0 0.0 -5.5 0.0 -5.5 0.0 -5.5 Tax on other comprehensive income 0.0 3.7 0.0 0.0 0.3 0.0 4.0 0.0 4.0 Profit for the period 0.0 0.0 0.0 0.0 1,086.5 0.0 1,086.5 -1.4 1,085.1Total recognised comprehensive income 0.0 -8.6 0.0 -65.2 1,102.3 0.0 1,028.5 -0.7 1,027.8Transactions with the owners Share-based payment, net 0.0 0.0 0.0 0.0 9.2 0.0 9.2 0.0 9.2 Dividend distributed 0.0 0.0 0.0 0.0 17.3 -255.0 -237.7 0.0 -237.7 Treasury shares bought/sold 0.0 0.0 0.0 0.0 27.8 0.0 27.8 0.0 27.8Transactions with the owners 0.0 0.0 0.0 0.0 54.3 -255.0 -200.7 0.0 -200.7 Equity at 30 September 2016 255.0 -21.0 0.0 197.9 7,051.7 0.0 7,483.6 20.0 7,503.6 Equity at 1 January 2017 255.0 -10.7 0.0 240.4 7,006.1 306.0 7,796.8 17.6 7,814.4 Other comprehensive income Exchange rate adjustment of foreign subsidiaries 0.0 0.0 0.0 -206.6 0.0 0.0 -206.6 -1.0 -207.6 Value adj. of hedging instruments recognised 0.0 6.4 0.0 0.0 0.0 0.0 6.4 0.0 6.4 Hedging instruments transferred to cost of sales 0.0 0.5 0.0 0.0 0.0 0.0 0.5 0.0 0.5 Hedging instruments transferred to financials 0.0 2.8 0.0 0.0 0.0 0.0 2.8 0.0 2.8 Value adjustment of financial liabilities 0.0 0.0 58.3 0.0 0.0 0.0 58.3 0.0 58.3 Other comprehensive income from associates and JVs 0.0 0.0 0.0 0.0 -0.8 0.0 -0.8 0.0 -0.8 Other adjustment on equity 0.0 0.0 0.0 0.0 0.7 0.0 0.7 0.0 0.7 Tax on other comprehensive income 0.0 -2.6 0.0 0.0 -0.2 0.0 -2.8 0.0 -2.8 Profit for the period 0.0 0.0 0.0 0.0 590.3 0.0 590.3 -5.2 585.1Total recognised comprehensive income 0.0 7.1 58.3 -206.6 590.0 0.0 448.8 -6.2 442.6Transactions with the owners Share-based payment, net 0.0 0.0 0.0 0.0 15.8 0.0 15.8 0.0 15.8 Dividend distributed 0.0 0.0 0.0 0.0 20.4 -306.0 -285.6 0.0 -285.6 Treasury shares bought/sold 0.0 0.0 0.0 0.0 68.6 0.0 68.6 0.0 68.6Transactions with the owners 0.0 0.0 0.0 0.0 104.8 -306.0 -201.2 0.0 -201.2 Equity at 30 September 2017 255.0 -3.6 58.3 33.8 7,700.9 0.0 8,044.4 11.4 8,055.8
Statement of changes in equity

All amounts in DKK million Interim Report – third quarter of 2017 Schouw & Co. 27
1 S E G M E N T R E P O R T I N G
Total reportable segments YTD 2017 BioMarFibertex
Personal CareFibertex
Nonwovens HydraSpecma Borg GPV Total External revenue 7,317.5 1,454.9 1,088.0 1,341.9 484.9 851.9 12,539.1Intra-group revenue 0.0 16.3 3.6 0.0 0.0 0.4 20.3Segment revenue 7,317.5 1,471.2 1,091.6 1,341.9 484.9 852.3 12,559.4 Depreciation and impairment 108.3 83.2 66.7 45.0 17.1 20.5 340.8EBIT 386.4 179.4 71.8 75.7 31.5 61.0 805.8 Segment assets 7,088.8 2,135.7 1,623.0 1,402.3 1,547.8 825.3 14,622.9Including goodwill 1,322.6 99.1 119.0 150.1 507.5 18.7 2,217.0Equity investments in associates and joint ventures 418.8 0.0 0.0 2.5 0.0 0.0 421.3Segment liabilities 4,257.5 1,223.0 1,068.7 955.8 611.0 626.0 8,742.0Working capital 447.2 334.2 415.2 531.3 173.9 269.5 2,171.3NIBD 615.4 752.0 754.9 511.0 117.8 330.8 3,081.9 Cash flows from operating activities 337.7 181.1 70.2 26.4 91.7 -5.0 702.1Cash flows from investing activities -985.2 -246.0 -94.0 -26.7 -194.3 -79.0 -1,625.2Cash flows from financing activities 521.7 98.0 11.5 9.4 119.8 55.0 815.4Capital expenditure * 1,289.9 246.5 94.0 27.3 14.9 70.0 1,742.6 Average number of employees 943 648 858 1,129 973 1,231 5,782
Total reportable segments YTD 2016 BioMarFibertex
Personal CareFibertex
Nonwovens HydraSpecma Borg GPV Total External revenue 6,376.6 1,319.2 1,007.7 1,306.5 - 442.7 10,452.7Intra-group revenue 0.0 16.5 5.4 0.0 - 0.3 22.2Segment revenue 6,376.6 1,335.7 1,013.1 1,306.5 - 443.0 10,474.9 Depreciation and impairment 103.4 87.3 60.2 43.2 - 11.4 305.5EBIT 365.8 189.0 68.8 86.6 - 26.7 736.9 Segment assets 5,859.8 1,846.8 1,565.6 1,321.4 - 613.2 11,206.8Including goodwill 778.3 99.1 121.5 149.0 - 0.0 1,147.9Equity investments in associates and joint ventures 99.4 0.0 0.0 2.5 - 0.0 101.9Segment liabilities 3,307.7 941.5 1,036.6 935.8 - 477.8 6,699.4Working capital 749.6 276.4 375.0 497.0 - 198.9 2,096.9NIBD 161.4 550.5 725.7 523.5 - 257.7 2,218.8 Cash flows from operating activities 338.9 264.7 79.7 65.8 - 37.5 786.6Cash flows from investing activities -230.1 -230.2 -62.3 -521.5 - -12.0 -1,056.1Cash flows from financing activities -273.2 -40.3 -16.7 489.9 - -19.1 140.6Capital expenditure * 192.2 230.8 62.3 458.8 - 16.1 960.2
Average number of employees 883 543 802 1,004 - 712 3,944 * Capital expenditure consists of additions of intangible assets and property, plant and equipment, including additions on acquisition
Notes to the financial statements

All amounts in DKK million Interim Report – third quarter of 2017 Schouw & Co. 28
1 S E G M E N T R E P O R T I N G ( C O N T I N U E D )
Based on management control and financial management, Schouw & Co. has identified six reporting segments, which are BioMar, Fibertex Personal Care, Fibertex Nonwovens, HydraSpecma, Borg Auto-motive and GPV. All inter-segment transactions were made on an arm’s length basis. Reconciliation of consolidated revenue, EBIT, assets and liabilities
YTD 2017 Group
revenue EBIT Assets Liabilities Reporting segments 12,559.4 805.8 14,622.9 8,742.0Non-reporting segments 2.1 -4.0 99.5 37.1The parent company 6.5 -23.3 9,245.1 1,200.7Group elimination etc. -26.6 0.0 -9,376.1 -3,444.2Total 12,541.4 778.5 14,591.4 6,535.6
YTD 2016 Group
revenue EBIT Assets Liabilities Reporting segments 10,474.9 736.9 11,206.8 6,699.4Non-reporting segments 20.7 3.2 149.8 39.3The parent company 5.1 -17.1 8,310.8 827.1Group elimination etc. -27.2 0.0 -7,482.5 -2,884.5Total 10,473.5 723.0 12,184.9 4,681.3
The data on revenue by geography are based on customers' geographical location. The specification shows individual countries that account for more than 5% of the Group in terms of revenue or assets. As Schouw & Co.'s consolidated revenue is generated in some 100 different countries, a very large proportion of the revenue derives from the 'Other' category. Revenue by country:
Revenue by segment:
25%
12%
9%6%5%
43%
Norway
YTD 2017
Chile
Denmark
UK
Sweden
Other
25%
13%
8%6%6%
42%
YTD 2016
62%
12%
9%
12%
5%
YTD 2016
58%
12%
9%
10%
4%7%
BioMar
FPC
FIN
HydraSpecma
Borg
GPV
YTD 2017
Notes to the financial statements

All amounts in DKK million Interim Report – third quarter of 2017 Schouw & Co. 29
2 C O S T S
Share-based payment: Share option programme The company maintains an incentive programme for the Executive Management and senior manag-ers, including the executive managements of subsidiaries. The programme entitles participants to acquire shares in Schouw & Co. at a price based on the officially quoted price at around the date of grant plus a premium (2017 allocation: 3% p.a.) from the date of grant until the date of exercise.
Outstanding options Management Other TotalGranted in 2013 40,000 0 40,000Granted in 2014 55,000 50,000 105,000Granted in 2015 55,000 172,000 227,000Granted in 2016 55,000 199,000 254,000Outstanding options in total at 31 December 2016 205,000 421,000 626,000Granted in 2017 55,000 238,000 293,000Exercised (from the share options granted in 2013) -40,000 0 -40,000Exercised (from the share options granted in 2014) -15,000 -50,000 -65,000Exercised (from the share options granted in 2015) 0 -122,000 -122,000Outstanding options in total at 30 September 2017 205,000 487,000 692,000
The following assumptions were applied in calculating the fair value of outstanding share options at the date of grant: Presumptions for the fair value: 2017 grant 2016 grant 2015 grant 2014 grantExpected volatility 23.27% 31.50% 27.62% 26.12%Expected term 48 mths 48 mths 48 mths 48 mthsMost recent dividend per share ** DKK 10 DKK 8 DKK 6 DKK 5Risk-free interest rate -0.25% 0.10% 0.00% 0.65%
Other information regarding the options: Strike price in DKK * 671.93 450.88 379.50 297.50Fair value in DKK per option ** 68.45 69,65 40.99 30.87Fair value in total in DKK millions ** 20.1 17.7 9.3 6.9Can be exercised from March 2020 March 2019 March 2017 March 2016Can be exercised to March 2021 March 2020 March 2019 March 2018 *) On exercise after four years (at the latest possible date) **) At the date of grant
Options exercised in 2017: Exercised from
2015 grantExercised from
2014 grantExercised from
2013 grantExercised number of shares 122,000 65,000 40,000Average exercise price in DKK 349.16 277.96 197.71Average share price in DKK on exercise 667.34 661.31 698.00Group's cash proceeds in DKK million 42.6 18.1 7.9 The expected volatility is calculated as 12 months' historical volatility based on average prices. Exer-cise of the share options is subject to the holders being in continuing employment during the above-mentioned periods. If the share option holder leaves the company’s employ before a share option vests, the holder may in some cases have a right to exercise the share options early during a four-week period following Schouw & Co.’s next following profit announcement. In the event of early ex-ercise, the number of share options will be reduced proportionately.
Notes to the financial statements

Interim Report – third quarter of 2017 Schouw & Co. 30
3 R E C E I V A B L E S - C U R R E N T
30/9 2017 30/9 2016 Trade receivables 3,219.2 3,128.6Other current receivables 202.2 147.8Accruals and deferred income 27.4 31.6Receivables current 3,448.8 3,308.0 Trade receivables by portfolio company:
30/9 2017 30/9 2016Impairment losses on trade receivables Impairment losses at 1 January -158.2 -206.8Exchange adjustments 8.6 1.2Additions on company acquisitions -4.7 -1.5Reversed impairment losses 11.9 4.6Impairment losses for the period -12.3 -29.8Realised loss 0.5 37.9Impairment losses -154.2 -194.4
Due between (days) 30/9 2017 Not due 1-30 31-90 >91 TotalTrade receivables not considered to be impaired 2,702.0 239.7 67.5 27.5 3,036.7Trade receivables individually assessed to be impaired 117.8 44.1 18.5 156.3 336.7Trade receivables in total 2,819.8 283.8 86.0 183.8 3,373.4Impairment losses on trade receivables -11.3 -6.9 -7.0 -129.0 -154.2Trade receivables net 2,808.5 276.9 79.0 54.8 3,219.2 Proportion of the total receivables which is expected tobe settled 95.4%Impairment percentage 0.4% 2.4% 8.2% 70.2% 4.6%
Due between (days) 30/9 2016 Not due 1-30 31-90 >91 TotalTrade receivables not considered to be impaired 2,722.7 188.9 61.9 15.9 2,989.4Trade receivables individually assessed to be impaired 86.3 30.1 27.3 189.9 333.6Trade receivables in total 2,809.0 219.0 89.2 205.8 3,323.0Impairment losses on trade receivables -14.0 -2.0 -3.2 -175.2 -194.4Trade receivables net 2,795.0 217.0 86.0 30.6 3,128.6 Proportion of the total receivables which is expected tobe settled 94.1%Impairment percentage 0.5% 0.9% 3.6% 85.1% 5.9% A total of 10.0% (2016: 10.0%) of receivables at the balance sheet date were impaired to a greater or lesser extent. There is a continual follow-up on overdue debtors.
67%9%
7%
11%
6%
30/9 2016
58%
10%
7%
12%
6%7%
BioMar
FPC
FIN
HydraSpecma
Borg
GPV
30/9 2017
Notes to the financial statements

Interim Report – third quarter of 2017 Schouw & Co. 31
4 A C Q U I S I T I O N S Borg BHE Alimentsa YTD 2017 YTD 2016 Intangible assets 379.2 9.5 378.5 767.2 176.2Property, plant and equipment 65.3 1.0 169.3 235.6 256.7Financial assets 0.1 0.6 0.3 1.0 7.9Inventories 320.6 23.1 41.2 384.9 424.6Receivables 183.1 14.8 79.1 277.0 353.3Tax asset 60.5 0.0 7.5 67.9 14.7Cash and cash equivalents 20.5 0.0 33.3 53.8 89.8Credit institutions -218.3 -10.9 0.0 -229.1 -457.5Deferred tax -91.3 -1.4 -85.5 -178.2 -55.3Provisions -16.0 0.0 -339.2 -355.2 -4.3Trade payables -53.5 -12.2 -19.7 -85.4 -197.2Other liabilities -227.0 -4.3 -39.6 -270.9 -125.1Tax payable -13.2 0.0 0.0 -13.2 0.0Contingent liabilities 0.0 0.0 -32.4 -32.4 0.0Net assets acquired 410.0 20.2 192.8 623.0 483.8Goodwill 507.6 9.8 575.1 1,092.4 157.0Cost 917.6 30.0 767.9 1,715.4 640.8Of which cash and cash equivalents -20.5 0.0 -33.3 -53.8 -89.8Cash cost total 897.1 30.0 734.6 1,661.6 551.0 Effective 1 March 2017, GPV acquired BHE, an EMS company based in Horsens, Denmark, for a cash consideration of DKK 30.0 million. Acquiring BHE forms part of GPV’s growth strategy. Established in 1984, BHE has over a number of years generated annual revenue of about DKK 100 million, selling mainly to the Danish and German markets. In connection with PPA adjustments relating to the acquisition of BHE, goodwill was calculated at DKK 9.8 million. Acquisition costs amounted to DKK 0.7 million. Had BHE been recognised as from 1 January 2017, revenue would have been DKK 14 million higher, while EBIT would have been the same. At 1 April 2017, Schouw & Co. acquired the industrial company Borg Automotive of Silkeborg, Den-mark for a cash consideration of DKK 897.1 million. Borg Automotive remanufactures used auto parts such as starters, alternators, brake calipers and air-condition compressors and generates annual revenue of about DKK 1 billion. Founded in 1975, the company employs about 1,400 people, of whom some 1,200 work in Poland. In connection with PPA adjustments relating to the acquisition of Borg Automotive, goodwill was calculated at DKK 507.6 million. Goodwill represents non-identifiable assets.
The acquisition of Borg Automotive involved acquisition costs of DKK 5.0 million. Had Borg Automotive been recognised as from 1 January 2017, revenue would have been DKK 237 million higher and EBIT would have been DKK 13.9 million higher. Effective 1 September 2017, BioMar acquired a 70% stake in Ecuadorian shrimp feed producer Ali-mentsa for a cash consideration of DKK 734.6 million and with an option to buy the outstanding 30% of the shares at a later date. The parties have agreed on a firm model for pricing the outstanding shares in Alimentsa, and non-controlling interests have thus not been recognised. Acquiring Ali-mentsa forms part of BioMar’s growth strategy. Alimentsa is a producer of shrimp feed and generates annual revenue of about DKK 500 million. Founded in 1986, Alimentsa is headquartered in Ecuador’s largest city, Guayaquil, and employs some 160 people. In connection with PPA adjustments relating to the acquisition of Alimentsa, preliminary goodwill was calculated at DKK 575.1 million. Goodwill represents non-identifiable assets. The acquisition of Alimentsa involved acquisition costs of DKK 8.2 million. Had Alimentsa been recognised as from 1 January 2017, revenue would have been DKK 343 million higher and EBIT would have been DKK 45 million higher.
Notes to the financial statements
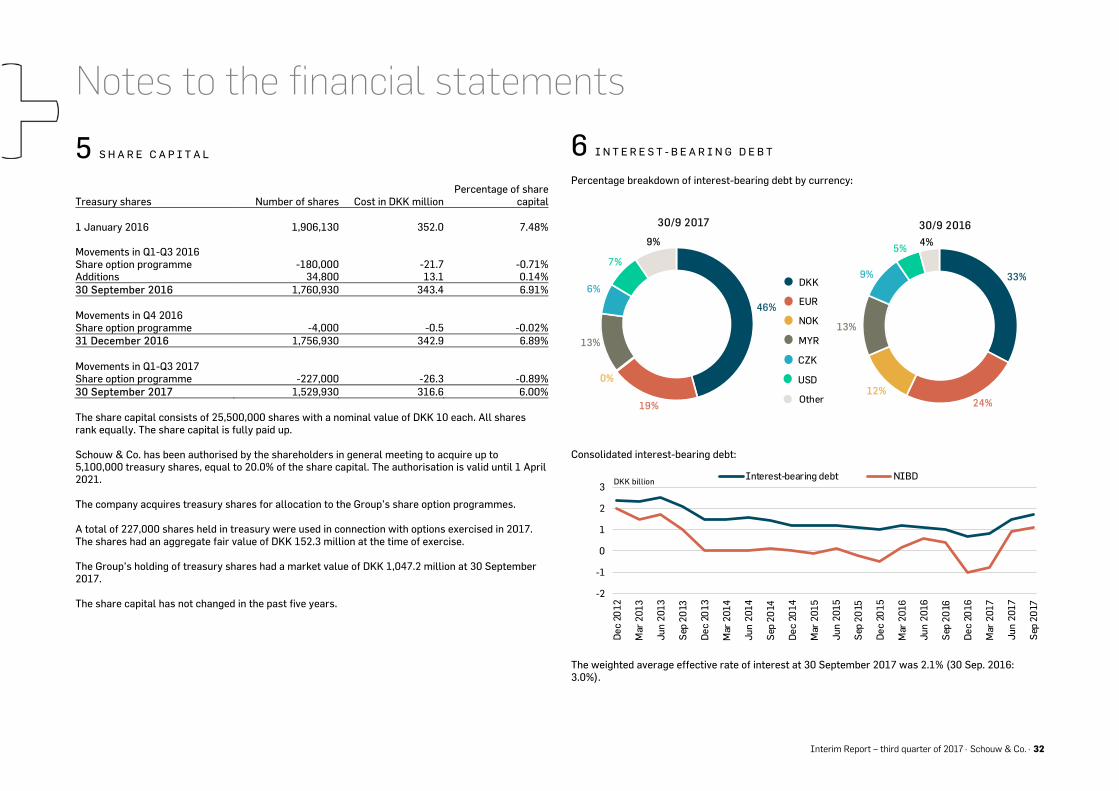
Interim Report – third quarter of 2017 Schouw & Co. 32
5 S H A R E C A P I T A L
Treasury shares Number of shares Cost in DKK millionPercentage of share
capital 1 January 2016 1,906,130 352.0 7.48% Movements in Q1-Q3 2016 Share option programme -180,000 -21.7 -0.71%Additions 34,800 13.1 0.14%30 September 2016 1,760,930 343.4 6.91% Movements in Q4 2016 Share option programme -4,000 -0.5 -0.02%31 December 2016 1,756,930 342.9 6.89% Movements in Q1-Q3 2017 Share option programme -227,000 -26.3 -0.89%30 September 2017 1,529,930 316.6 6.00% The share capital consists of 25,500,000 shares with a nominal value of DKK 10 each. All shares rank equally. The share capital is fully paid up. Schouw & Co. has been authorised by the shareholders in general meeting to acquire up to 5,100,000 treasury shares, equal to 20.0% of the share capital. The authorisation is valid until 1 April 2021. The company acquires treasury shares for allocation to the Group’s share option programmes. A total of 227,000 shares held in treasury were used in connection with options exercised in 2017. The shares had an aggregate fair value of DKK 152.3 million at the time of exercise. The Group’s holding of treasury shares had a market value of DKK 1,047.2 million at 30 September 2017. The share capital has not changed in the past five years.
6 I N T E R E S T - B E A R I N G D E B T
Percentage breakdown of interest-bearing debt by currency:
Consolidated interest-bearing debt:
The weighted average effective rate of interest at 30 September 2017 was 2.1% (30 Sep. 2016: 3.0%).
46%
19%
0%
13%
6%
7%
9%
30/9 2017
DKK
EUR
NOK
MYR
CZK
Other
USD
33%
24%12%
13%
9%
5%4%
30/9 2016
-2
-1
0
1
2
3
Dec
20
12
Mar
201
3
Jun
2013
Sep
20
13
Dec
20
13
Mar
201
4
Jun
2014
Sep
20
14
Dec
20
14
Mar
201
5
Jun
2015
Sep
20
15
Dec
20
15
Mar
201
6
Jun
2016
Sep
20
16
Dec
20
16
Mar
201
7
Jun
2017
Sep
20
17
Interest-bearing debt NIBDDKK billion
Notes to the financial statements

Interim Report – third quarter of 2017 Schouw & Co. 33
7 F A I R V A L U E O F C A T E G O R I E S O F F I N A N C I A L A S S E T S A N D
L I A B I L I T I E S
30/9 2017
31/12 2016
30/92016
Financial assets Securities measured at fair value through profit or loss – level 1 3.0 2.3 2.3Derivative financial instruments to hedge future cash flows – level 2 10.9 17.8 9.1Securities measured at fair value – level 3 2.3 119.0 1,147.5 Financial liabilities Derivative financial instruments to hedge future cash flows – level 2 17.1 34.4 34.5 Securities measured at fair value through other comprehensive income (level 3) amounted to DKK 119.0 million at the beginning of the year. The change for the reporting period was due to negative foreign exchange adjustments of DKK 13.6 million, negative reclassifications of DKK 145.6 million and a fair value adjustment of DKK 42.5 million. Foreign exchange adjustments, reclassifications and the fair value adjustment were mainly related to Salmones Austral, which was reclassified as an as-sociate in the third quarter of 2017. The fair value of listed securities (level 1) has increased by DKK 0.7 million in 2017. The Group uses interest rate swaps and forward currency contracts to hedge fluctuations in interest rate levels and foreign exchange rates. Forward exchange contracts and interest rate swaps are val-ued using generally accepted valuation techniques based on relevant observable swap curves and exchange rates (level 2). The fair values applied are calculated mainly by external sources on the ba-sis of discounted future cash flows. The fair value of derivative financial instruments is calculated by way of valuation models such as discounted cash flow models. Anticipated cash flows for individual contracts are based on observa-ble market data such as yield curves and exchange rates. In addition, fair values are based on non-observable market data, including exchange rate volatilities, or correlations between yield curve, ex-change rates and credit risks. Non-observable market data account for an insignificant part of the fair value of the derivative financial instruments at the end of the reporting period. Fair value hierarchy Level 1 Listed shares, stated at market value of shareholding. Level 2 Financial instruments valued by external credit institutions using generally accepted
valuation techniques on the basis of observable data. Level 3 Unlisted shares, stated at estimated value.
8 E A R N I N G S P E R S H A R E ( D K K ) Q3 2017 Q3 2016 YTD 2017 YTD 2016 Share of the profit for the period attributable to shareholders of Schouw & Co. 263.9 777.1 590.3 1,086.5 Average number of shares 25,500,000 25,500,000 25,500,000 25,500,000Average number of treasury shares -1,588,745 -1,760,930 -1,664,626 -1,789,639Average number of outstanding shares 23,911,255 23,739,070 23,835,374 23,710,361 Average dilutive effect of outstanding share op-tions * 155,243 63,370 161,905 53,051Diluted average number of outstanding shares 24,066,498 23,802,440 23,997,279 23,763,412 Earnings per share of DKK 10 11.03 32.74 24.77 45.82Diluted earnings per share of DKK 10 10.96 32.65 24.60 45.72 * See note 2 for information on options that may cause dilution.
Notes to the financial statements Notes to the financial statements Notes to the financial statements

Interim Report – third quarter of 2017 Schouw & Co. 34
9 R E L A T E D P A R T Y T R A N S A C T I O N S
Under Danish legislation, Givesco A/S, Svinget 24, DK-7323 Give, members of the Board of Directors, the Executive Management and senior management as well as their family members are considered to be related parties. Related parties also comprise companies in which the individuals mentioned above have material interests. Related parties also comprise subsidiaries, joint arrangements and associates, in which Schouw & Co. has control, significant influence or joint control of as well as members of the boards of directors, management boards and senior management of those compa-nies. Management's remuneration and share option programmes are set out in note 2.
YTD 2017 YTD 2016Joint Ventures: During the financial year, the Group sold goods of 18.6 8.3At 30 September the Group had a receivable of 2.0 15.7 Associates: During the financial year, the Group received management fee of 0.1 0.1During the financial year, the Group sold goods of 96.2 27.6During the financial year, the Group bougth goods of 62.9 11.4During the financial year, the Group received interest income of 0.0 0.2At 30 September the Group had a receivable of 181.4 2.4At 30 September the Group had debt of 101.2 0.0During the financial year, the Group received dividends of 0.0 64.3 During 2017, the Group traded with Incuba Invest, BioMar-Sagun, BioMar-Tongwei, LetSea, ATC Patagonia, Salmones Austral and Young Tech Co. Other than as set out above, no transactions were made during the year with related parties.
Notes to the financial statements