INTERIM REPORT 2017 - Greka Drilling Ltd interium report GDL.pdf · o 7 wells drilled in India for...
17
1 GREKA DRILLING INTERIM REPORT 2017
Transcript of INTERIM REPORT 2017 - Greka Drilling Ltd interium report GDL.pdf · o 7 wells drilled in India for...

1 GREKA DRILLING
INTERIM REPORT 2017

1 HIGHLIGHTS 2 CHAIRMAN’SSTATEMENT 4 CONSOLIDATED STATEMENT OF COMPREHENSIVE INCOME 5 CONSOLIDATED STATEMENT OF FINANCIAL POSITION 6 CONSOLIDATED STATEMENT OF CHANGES IN EQUITY 7 CONSOLIDATED STATEMENT OF CASH FLOWS 8 NOTES TO CONSOLIDATED INTERIM FINANCIAL STATEMENTS 14 DIRECTORS, COMPANY SECRETARY AND ADVISERS
CONTENTS

CHAIRMAN STATEMENT
T
1 GREKA DRILLING
HIGHLIGHTS
FINANCIAL HIGHLIGHTS
Revenue of US$3.6 million (H1 2016: US$2.6 million), an increase of 38%
Loss of US$1.1 million (H1 2016: loss of US$5.5 million)
US$2.7 million of cash (US$2.6 million is restricted) as at 30 June 2017
OPERATIONAL HIGHLIGHTS
12 wells were drilled in the first 6 months this year compared to 10 wells in the same period last year, of which:
o 5 wells drilled in China (PetroChina - 3; Green Dragon Gas –1;
other – 1), compared with 3 wells drilled in H1 2016 (all for
Green Dragon Gas)
o 7 wells drilled in India for Essar (2016 H1: 7 wells, all for Essar)
A total of 15,625 metres were drilled, compared to 12,458 metres in
the same period last year, an increase of 25%, of which:
o 7,964 metres were drilled in China (H1 2016: 4,128 metres)
o 7,661 metres were drilled in India (H1 2016: 8,330 metres)
CHAIRMAN STATEMENT
T
2 GREKA DRILLING
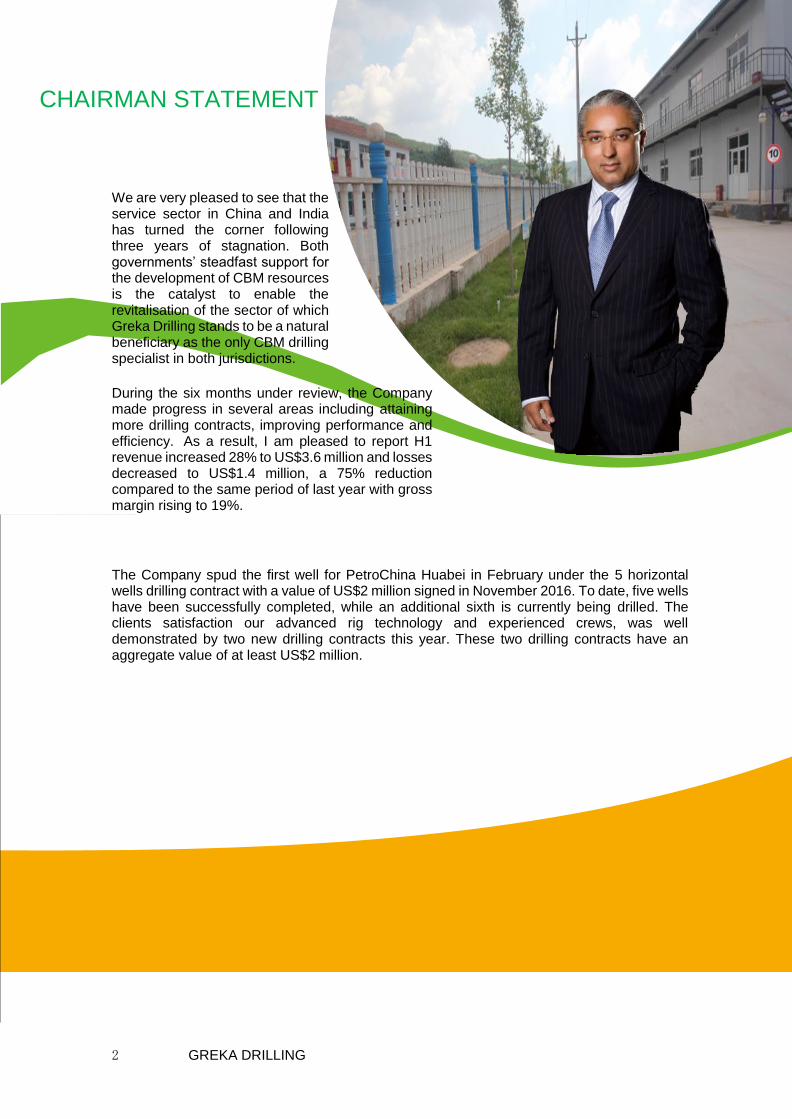
We are very pleased to see that the service sector in China and India has turned the corner following three years of stagnation. Both governments’ steadfast support for the development of CBM resources is the catalyst to enable the revitalisation of the sector of which Greka Drilling stands to be a natural beneficiary as the only CBM drilling specialist in both jurisdictions.
During the six months under review, the Company made progress in several areas including attaining more drilling contracts, improving performance and efficiency. As a result, I am pleased to report H1 revenue increased 28% to US$3.6 million and losses decreased to US$1.4 million, a 75% reduction compared to the same period of last year with gross margin rising to 19%.
The Company spud the first well for PetroChina Huabei in February under the 5 horizontal wells drilling contract with a value of US$2 million signed in November 2016. To date, five wells have been successfully completed, while an additional sixth is currently being drilled. The clients satisfaction our advanced rig technology and experienced crews, was well demonstrated by two new drilling contracts this year. These two drilling contracts have an aggregate value of at least US$2 million.

CHAIRMAN STATEMENT
T
3 GREKA DRILLING
Furthermore, in India, in addition to the completed 7 wells for Essar, the Company has been awarded a Letter of Award (LOA) for a three-year drilling contract by Oil & Natural Gas Corporation Limited (“ONGC”). Under this contract, the Company will drill 73 wells over the next three years using our state-of-the-art rig which has a proven track record of drilling in similar geological conditions. The project, which remains subject to contract and to the issue of a performance bond, will entail the provision of drilling and mud services along with the provision of associated equipment and is estimated to generate total revenues of US$15 million over the three-year period. We expect to spud the first well prior to year-end.
Among the significant number of state-owned drilling companies, Greka Drilling stands out as the only independent foreign drilling contractor sustainably providing services within the CBM sector in China and India to the state-owned CNPC and ONGC. The contracted drilling services are recognition of the niche drilling expertise within the Company.
I look forward to providing further updates of the Company’s continued
progress.
Randeep S. Grewal
Chairman
26 September 2017
CONSOLIDATED STATEMENT OF
COMPREHENSIVE INCOME
4 GREKA DRILLING
Six months
ended 30 June 2017
Six months ended 30 June
2016
Year ended 31 December 2016
US$’000 US$’000 US$’000
Note Unaudited Unaudited Audited
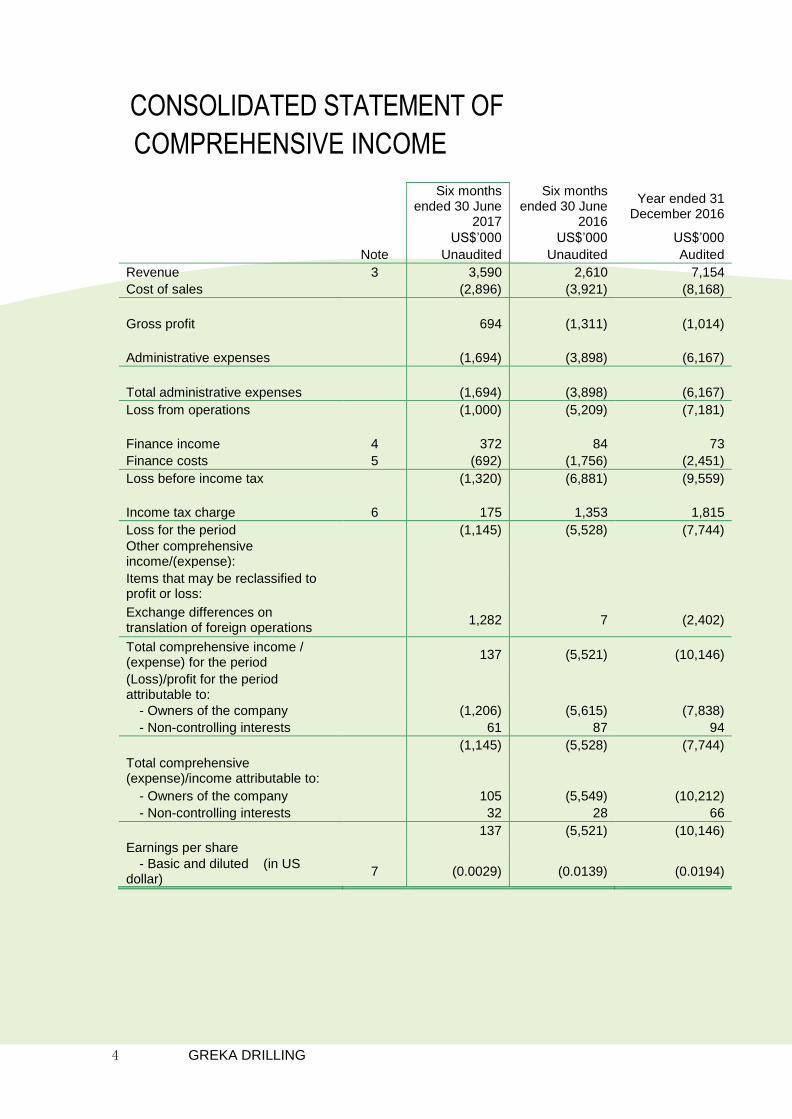
Revenue 3 3,590 2,610 7,154
Cost of sales (2,896) (3,921) (8,168)
Gross profit 694 (1,311) (1,014)
Administrative expenses (1,694) (3,898) (6,167)
Total administrative expenses (1,694) (3,898) (6,167)
Loss from operations (1,000) (5,209) (7,181)
Finance income 4 372 84 73
Finance costs 5 (692) (1,756) (2,451)
Loss before income tax (1,320) (6,881) (9,559)
Income tax charge 6 175 1,353 1,815
Loss for the period (1,145) (5,528) (7,744)
Other comprehensive income/(expense):
Items that may be reclassified to profit or loss:
Exchange differences on translation of foreign operations
1,282 7 (2,402)
Total comprehensive income / (expense) for the period
137 (5,521) (10,146)
(Loss)/profit for the period attributable to:
- Owners of the company (1,206) (5,615) (7,838)
- Non-controlling interests 61 87 94
(1,145) (5,528) (7,744)
Total comprehensive (expense)/income attributable to:
- Owners of the company 105 (5,549) (10,212)
- Non-controlling interests 32 28 66
137 (5,521) (10,146)
Earnings per share
- Basic and diluted (in US dollar)
7 (0.0029) (0.0139) (0.0194)
CONSOLIDATED STATEMENT OF
FINANCIAL POSITION
5 GREKA DRILLING
As at 30 June
2017 As at 31
December 2016
US$’000 S$’000
Note Unaudited Audited
Assets
Non-current assets
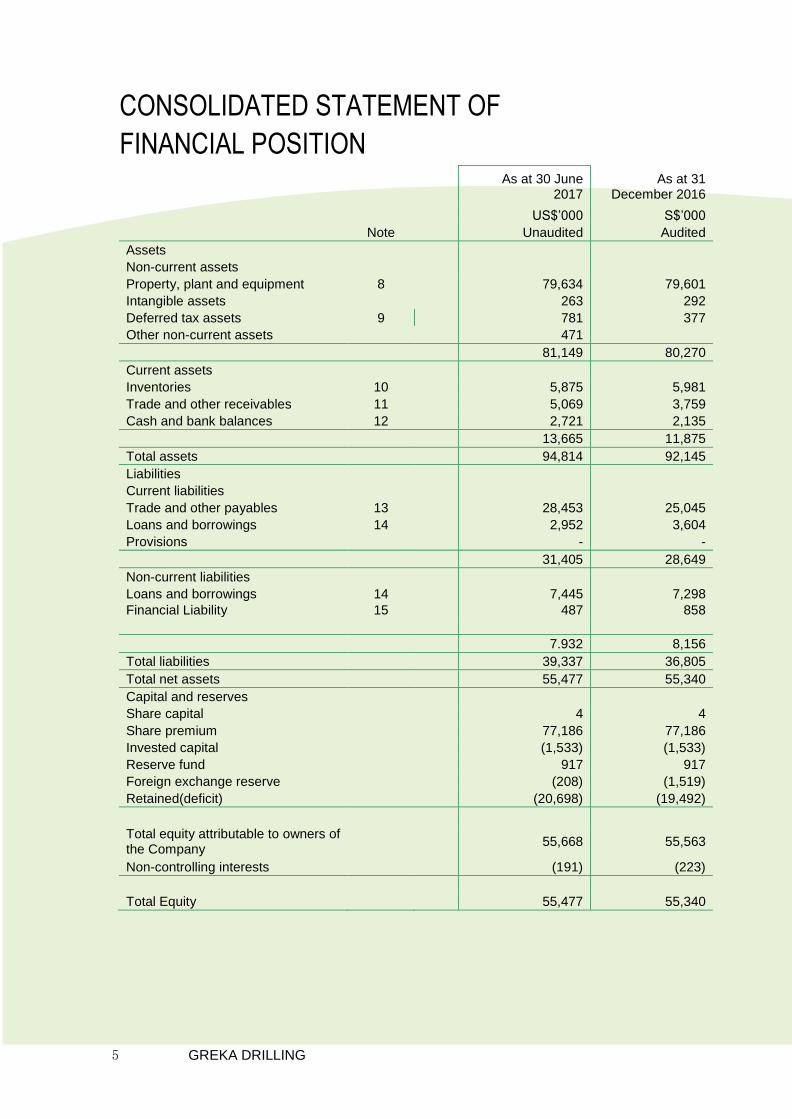
Property, plant and equipment 8 79,634 79,601
Intangible assets 263 292
Deferred tax assets 9 781 377
Other non-current assets 471
81,149 80,270
Current assets
Inventories 10 5,875 5,981
Trade and other receivables 11 5,069 3,759
Cash and bank balances 12 2,721 2,135
13,665 11,875
Total assets 94,814 92,145
Liabilities
Current liabilities
Trade and other payables 13 28,453 25,045
Loans and borrowings 14 2,952 3,604
Provisions - -
31,405 28,649
Non-current liabilities
Loans and borrowings 14 7,445 7,298
Financial Liability 15 487 858
7.932 8,156
Total liabilities 39,337 36,805
Total net assets 55,477 55,340
Capital and reserves
Share capital 4 4
Share premium 77,186 77,186
Invested capital (1,533) (1,533)
Reserve fund 917 917
Foreign exchange reserve (208) (1,519)
Retained(deficit) (20,698) (19,492)
Total equity attributable to owners of the Company
55,668 55,563
Non-controlling interests (191) (223)
Total Equity 55,477 55,340

Cc
6 GREKA DRILLING
CONSOLIDATED STATEMENT OF CHANGES IN EQUITY
Share capital
Share premium
Invested capital
Reserve fund
Foreign exchange
reserve Retained deficit
Equity attributable
to owners of the
Company
Non-controlling
interests Total
US$’000 US$’000 US$’000 US$’000 US$’000 US$’000 US$’000 US$’000 US$’000
At 01 January 2016 - audited 4 77,186 (1,533) 917 855 (11,654) 65,775 (289) 65,486
Loss for the period - - - - - (5,615) (5,615) 87 (5,528)
Other comprehensive income:
- Exchange difference on translation of foreign operations
- - - - 66 - 66 (59) 7
Total comprehensive income/(expense) for the period
- - - - 66 (5,615) (5,549) 28 (5,521)
At 30 June 2016 - unaudited 4 77,186 (1,533) 917 921 (17,269) 60,226 (261) 59,965
At 01 January 2017 - audited 4 77,186 (1,533) 917 (1,519) (19,492) 55,563 (223) 55,340
(Loss)/profit for the period - - - - - (1,206) (1,206) 61 (1,145)
Other comprehensive income/(expense):
-
-
- Exchange difference on translation of foreign operations - - - - 1,311 - 1,311 (29) 1,282
Total comprehensive income/(expense) for the period - - - - 1,311 (1,206) 105 32 137
At 30 June 2017– unaudited 4 77,186 (1,533) 917 (208) (20,698) 55,668 (191) 55,477

CONSOLIDATED STATEMENT OF
CASH FLOWS
7 GREKA DRILLING
6 months ended 30
June 2017
6 months ended 30
June 2016
Year ended 31 December
2016
US$’000 US$’000 US$’000
Unaudited Unaudited Audited
Operating activities:
(Loss)/profit before income tax (1,320) (6,881) (9,559)
Adjustments for:
Depreciation 1,908 1,619 2,445
Amortization of other intangible assets 36 38 71
Loss on disposal of property, plant and equipment
- - 152
Finance (loss)/gains 126 1,329 1,482
Finance income (372) (84) (73)
Finance costs 566 427 969
Operating cash flows before changes in working capital
944
(3,552)
(4,513)
Decrease/(increase) in inventories 106 835 1,157
(Increase)/decrease in trade and other receivables
(1,780) (192) 396
Increase/(decrease) in trade and other payables
649 6,301 (1,014)
Cash (utilized by)/generated from operations
(81)
3,392
(3,974)
Income tax payment (229) (43) (216)
Net cash from operating activities (310) 3,349 (4,190)
Investing activities:
Payments for purchase of property, plant and equipment
(8)
98
(318)
Payments for intangible assets -
Movement in restricted cash (2,657) (4,395) 2,068
Interest received - 1 59
Net cash (used in)/from investing activities (2,665) (4,296) 1,809
Financing activities
Proceeds from promissory note 5,000 8,000
Proceeds of short term loan 5,452 3,770 3,604
Repayment of short term loan (3,604) (5,852) (5,852)
Finance costs paid (161) (268) (738)
Net cash from/(used in) financing activities 1,687 2,650 5,014
Net/increase/(decrease) in cash and cash equivalents
(1,288) 1,703 2,633
Cash and cash equivalents at start of year 2,135 353 353
847 2,056 2,986
Effect of foreign exchange rate changes (783) (437) (851)
Cash and cash equivalents at end of year 64 1,619 2,135
8 GREKA DRILLING
NOTE TO CONSOLIDATED
INTERIM FINANCIAL STATEMENTS
1. GENERAL INFORMATION
The consolidated unaudited interim financial information set out in this report is based on the consolidated financial statements of Greka Drilling and its subsidiary companies (together referred to as the “Group”).
2. ACCOUNTING POLICIES
The condensed consolidated financial information should be read in conjunction with the
annual financial statements for the year ended 31 December 2016, which have been
prepared in accordance with International Financial Reporting Standards (IFRS) as adopted
by the European Union except for IAS 34. The financial statements of the Group for the 6
months ended 30 June 2017 were approved and authorized for issue by the Audit Committee
and the Board on 26 Sep 2017.
The interim financial statements have been prepared in accordance with the accounting
policies that are consistent with the December 2016 financial statements and the same
policies are expected to apply for the year ended 31 December 2017. The financial
information for the six months to 30 June 2017 does not constitute audited accounts of the
Company or the Group. The comparative financial information for the year ended 31
December 2016 in this interim report does not constitute statutory accounts for that year. The
auditors’ report on those accounts was unqualified and did not draw attention to any matters
by way of emphasis.
Basis of preparation
After making enquiries, the directors have a reasonable expectation that the Company and the Group have adequate resources to continue in operational existence for the foreseeable future. Accordingly, they continue to adopt the going concern basis in preparing the half-yearly consolidated financial statements.
The consolidated financial information is presented in United States dollars and all values are rounded to the nearest thousand dollars (US$’000) except when otherwise indicated.
The consolidated financial information has been prepared in accordance with the requirements of the AIM Rules for Companies and in accordance with IFRS as adopted by the European Union. The consolidated financial information have been prepared using the accounting policies which will be applied in the Group’s financial statements for the year ended 31 December 2016.
The preparation of consolidated financial information in conformity with IFRS requires the use of certain critical accounting estimates. It also requires management to exercise its judgment in the process of applying the Group’s accounting policies. The areas involving a higher degree of judgment or complexity or areas where assumptions and estimates are significant to the financial information are disclosed in note 2 to the financial information in the 31 December 2016 annual report. Actual results may differ from these estimates.
The estimates and underlying assumptions are reviewed on an ongoing basis. Revisions to accounting estimates are recognized in the period in which the estimate is revised if the revision only affects that period or in the period of revision and future periods if the revision affects both current and future periods.

9 GREKA DRILLING
NOTE TO CONSOLIDATED
INTERIM FINANCIAL STATEMENTS
3. REVENUE AND SEGMENTAL INFORMATION
The Group determines its operating segment based on the reports reviewed by the chief
operating decision-makers (“CODMs”) that are used to make strategic decisions.
The Group reports its operations as two reportable segments: the provision of contract
drilling services in the PRC and India. The division of contract drilling operations into two
reportable segments is attributable to how the CODMs manage the business. Intercompany
eliminations and corporate balances are included in the “other” column.
Drilling services revenue and management services revenue represent the net invoiced
value of contracted drilling services and management services provided to two major
customers, one in the PRC (who is a related party) and the other in India.
Six months ended
30 June 2017 Six months ended
30 June 2016 Year ended 31
December 2016
US$’000 US$’000 US$’000
Unaudited Unaudited Audited
China 2,536 1,959 3,241
India 1,054 651 3,913
3,590 2,610 7,154
As at 30 June 2017 As at 31 December 2016
US$’000 US$’000
Unaudited Audited
Segmental assets
China 90,833 86,613
India 19,416 19,699
Intercompany (15,435) (14,167)
94,814 92,145
Segmental liabilities
China 13,072 9,517
India 4,012 4,096
Intercompany 22,477 23,192
39,561 36,805

10 GREKA DRILLING
NOTE TO CONSOLIDATED
INTERIM FINANCIAL STATEMENTS
4. FINANCE INCOME
Six months ended
30 June 2017 Six months ended
30 June 2016 Year ended 31
December 2016
US$’000 US$’000 US$’000
Unaudited Unaudited Audited
Change in FV of derivative 372 83 14
Bank interest - 1 59
372 84 73
5. FINANCE COSTS
Six months ended
30 June 2017 Six months ended
30 June 2016 Year ended 31
December 2016
US$’000 US$’000 US$’000
Unaudited Unaudited Audited
Interest expense on short term loans
(418) (373) (800)
Foreign exchange loss (126) (1,329) (1,482)
Amortization of warrant costs (148) (54) (169)
(692) (1,756) (2,451)
6. TAXATION
Taxation for the Group’s operations in the PRC is provided at the applicable current tax rate of 25% on the estimated assessable profits for the period. Taxation for operations in India is taxed at 4.326% of gross revenue.
7. EARNINGS PER SHARE
Warrants were outstanding at the end of the period that could potentially dilute basic earnings per share in the future. However, due to losses incurred during the current period, the impact of these share incentives would not be dilutive.
Six months ended
30 June 2017 Six months ended
30 June 2016 Year ended 31
December 2016
US$’000 US$’000 US$’000
Unaudited Unaudited Audited
Earnings for the purpose of basic and diluted loss per share
(1,145) (5,528) (7,744)
Weighted average number of ordinary shares
398,245,758 398,245,758 398,245,758

11 GREKA DRILLING
NOTE TO CONSOLIDATED
INTERIM FINANCIAL STATEMENTS
8. PROPERTY, PLANT AND EQUIPMENT
During the period, the Group incurred US$336,740 on additions to plant and equipment (31 December 2016 — US$318,000).
9. DEFERRED TAXATION
As at 30 June 2017 As at 31 December
2016
US$’000 US$’000
Unaudited Audited
Deferred tax liabilities
Opening balance (377) 1,184
Tax losses recognized (862) (3,372)
Temporary difference charge 638 1,395
Foreign exchange adjustment (180) 416
At the end of the period (781) (377)
The Group has not offset deferred tax assets and liabilities across different jurisdictions. Cayman Island losses of US$14,079,420 (2016: US$13,390,404) do not expire under current tax legislation. PRC tax losses of US$8,688,141 (2016: $7,791,657) expire after 5 years.
10. INVENTORIES
As at 30 June 2017 As at 31 December
2016
US$’000 US$’000
Unaudited Audited
Raw materials and consumables 5,875 5,981
11. TRADE AND OTHER RECEIVABLES
As at 30 June 2017 As at 31 December
2016
US$’000 US$’000
Unaudited Audited
Account receivable 3,294 1,415
Prepayments 412 902
Other receivables 1,363 1,442
5,069 3,759

12 GREKA DRILLING
NOTE TO CONSOLIDATED
INTERIM FINANCIAL STATEMENTS
12. CASH AND CASH EQUIVALENTS
The restricted bank balance represents deposits placed in financial institutions to secure bills payable of an equivalent amount related to bank loans of US$2,657,062.
13. TRADE AND OTHER PAYABLES
As at 30 June 2017 As at 31 December
2016
US$’000 US$’000
Unaudited Audited
Trade payables and others 8,491 8,557
Banks Notes payable 2,657 -
Other current liabilities 4,461 3,561
Amount due to related parties 12,844 12,927
28,453 25,045
14. LOANS AND BORROWINGS
Bank name Period
Balance as at Dec 31,2016
Interest rate
Repayment New loan
Balance as at June 30,2017
US$’000 Date Amount US$'000
Date Amount US$'000
US$’000
CITIC Bank 1 year 1,730 6.60% 11/5/2017 1,730 16/5/2017 1,476 1,476
SPD Bank 1 year 1,874 6.96% 17/1/2017 1,874 18/1/2017 1,476 1,476
Total for Short term loan
3,604 3,604 2,952 2,952
Guaranty finance investors, LLC
3 years
4,514 7.00% 30/3/2019 4,622
Guaranty finance investors, LLC
3 years
2,783 7.00% 30/9/2019 2,823
Total for Long term loan
7,298 7,445
As at 30 June 2017 As at 31 December
2016
US$’000 US$’000
Unaudited Audited
Cash and Cash Equivalents(Unrestricted) 64 2,135
Cash and Cash Equivalents(Restricted) 2,657 -
2,721 2,135

13 GREKA DRILLING
NOTE TO CONSOLIDATED
INTERIM FINANCIAL STATEMENTS
15. Financial Liability
During the year ended 31 December 2016, 35,000,000 and 21,000,000 warrants, at a subscription price of 5 pence per share, were granted to Guaranty Finance Investors LLC as part of the financing agreements entered into in March 2016 and September 2016 respectively. The warrants have an exercise period of 2 years from 1 April 2017 to 31 March 2019 and 30 September 2017 to 30 September 2019 respectively.
16. RELATED PARTY TRANSACTIONS
(a) Amounts due from/to related parties and corresponding transactions
The related parties of the Group include companies that are subsidiaries of Green
Dragon Gas Ltd, Greka Engineering and Technology Limited and Henan Greka Weino
Alcohol Trading Limited. All the related parties are under common management and
control of Mr. Randeep Grewal.
As at 30 June 2017, the Group had the following balances due to/from companies
under common control of Randeep Singh Grewal, the chairman & CEO.
• Net payable to the Green Dragon Gas group of US$9.8m (2016: net payable:
US$ 12.7m)
• Net payable to the Greka Engineering and Technology group of US$518,041
(2016: US$206,940)
These balances are unsecured, interest-free and repayable on demand and represent
receivables/payables for drilling and pre-well services.
• The company has secured a US$2.5 million loan provided by GRECAP
Limited , the Loan is at an interest rate of 7.0% per annum and is repayable
(principal and accrued interest) on 30 November 2018 or, at the option of
the lender (the “Option”), between 1 January 2018 and 31 May 2018 through
the transfer of the ownership held by the Company of the leases of the 28th
and 29th floors of the office building in Zhengzhou, PRC where its Chinese
operational headquarters are based. The net book value of these properties
at 31 December 2016 was US$4.9 million and there are bank loans of
approximately US$2.9 million secured on these properties. The Company
has the option of repaying the Loan prior to the exercise of the Option,
thereby redeeming the Option. The proceeds of the Loan will be used as to
US$2.0m to pay creditors and US$0.5 million for working capital purposes.
Related party transactions during the period comprise of
• Drilling services provided to the Green Dragon Gas group of US$850,856
(2016: US$1,541,000)
• Leasing income from the Green Dragon Gas group of US$228,260 (2016:
US$327,000m), Greka Engineering and Technology group of US$27,422
(2016: US$25,000)
The lease term was 1 year from 1 January 2017 to 31 December 2017 and 1 January 2016 to 31 December 2016 respectively.

14 GREKA DRILLING
DIRECTORS, COMPANY SECRETARY AND
ADVISERS
DIRECTORS COMPANY SECRETARY
Randeep S. Grewal International Corporation Services
Ltd. Executive Director, Chairman and CEO
David Turnbull NOMINATED ADVISER
Non-Executive Director Smith & Williamson Corporate Finance
Limited 25 Moorgate
Bryan Smart London EC2R 6AY
Non-Executive Director
Richard Day AUDITORS
Non-Executive Director BDO LLP
55 Baker Street
Sean Mulhearn London W1U
7EU Non-Executive Director
REGISTERED OFFICE LEGAL ADVISERS
PO Box 2681 As to Cayman Islands & BVI Laws
Cricket Square Conyers Dill & Pearman
Hutchins Drive 29th Floor
Grand Cayman KY1 -1111 One Exchange Square
Cayman Islands 8 Connaught Place
Central
Hong Kong
Principal Corporate Office 29thFloor, Landmark Plaza, No.1 Business Outer Ring Road, Business District, Henan Province, Zhengzhou, 450000, PRC Share Registrar Capita Registrars The Registry 34 Beckenham Road Beckenham Kent BR3 4TU United

15 GREKA DRILLING