
INTERIM REPORT 2014 - Nexteer REPORT 2014 03 CORPORATE INFORMATION BOARD OF DIRECTORS Executive...
55
INTERIM REPORT 2014
Transcript of INTERIM REPORT 2014 - Nexteer REPORT 2014 03 CORPORATE INFORMATION BOARD OF DIRECTORS Executive...
INTERIM REPORT 2014

CONTENTSCompany Profile 2
Corporate Information 3
Business Overview 4
Financial Highlights 6
Management Discussion and Analysis 8
Corporate Governance/Other information 15
Report on Review of Interim Financial Information 21
Interim Condensed Consolidated Balance Sheet 23
Interim Condensed Consolidated Income Statement
25
Interim Condensed Consolidated Statement of Comprehensive Income
26
Interim Condensed Consolidated Statement of Changes in Equity
27
Interim Condensed Consolidated Statement of Cash Flows
28
Notes to the Condensed Consolidated Interim Financial Information
29
02 N E X T E E R A U T O M O T I V E G R O U P L I M I T E D
COMPANY PROFILE
Nexteer Automotive Group Limited (the Company) together with its subsidiaries (together with the Company collectively referred to as we, us, Nexteer or the Group) is a global leader in advanced steering and driveline systems. Nexteer’s in-house development and integration of hardware, software and electronics gives us a competitive advantage as a full service steering supplier.
Nexteer draws upon a 100-year heritage of product development, manufacturing and vehicle integration expertise while maintaining enduring customer relationships. We have a strong foundation and a reputation for providing dependable steering and driveline solutions.
Nexteer provides real-world, vehicle-level thinking that is always ahead of the curve.
• Customer Focused: Respected and trusted for delivering on promises
• Innovative: Market leader in steering and driveline innovation
• Agile: Respond quickly with high-quality, cost-effective solutions
• Expert: Know and understand customer requirements
• Experienced: Provide demonstrated high performance, custom engineered systems for every application
• Global: Committed to exceeding customer and vehicle needs every time, everywhere
We design, engineer, manufacture and distribute steering and driveline systems and components, primarily for original equipment manufacturers (OEM) and our product families include electric power steering (EPS), hydraulic power steering (HPS), steering columns and intermediate shafts (CIS) and driveline systems.
With more than fifty (50) customers in every major region of the world, Nexteer has twenty (20) manufacturing plants, five (5) regional engineering centers, and nine (9) customer service centers strategically located in North and South America, Europe and Asia. Nexteer’s customers include BMW, Fiat Chrysler, Ford, General Motors (GM), PSA Peugeot Citroen and Toyota, as well as domestic automakers in India and China.

03I N T E R I M R E P O R T 2 0 1 4
CORPORATE INFORMATION
BOARD OF DIRECTORSExecutive DirectorsZHAO, Guibin (趙桂斌) (Chairman and Chief Executive Officer)RICHARDSON, Michael PaulFAN, Yi (樊毅)
Non-Executive DirectorsLU, Daen (錄大恩)WANG, Xiaobo (王曉波)
Independent Non-Executive DirectorsTSANG, Hing Lun (曾慶麟)LIU, Jianjun (劉健君)WEI, Kevin Cheng (蔚成)
JOINT COMPANY SECRETARIESFAN, YiMOK Ming Wai (FCIS, FCS)
AUTHORIZED REPRESENTATIVESFAN, YiMOK Ming Wai (FCIS, FCS)
LEGAL ADVISORSAs to Hong Kong LawJones Day
As to Cayman Islands LawMaples and Calder
COMPLIANCE ADVISORSomerley Capital Limited
AUDITORPricewaterhouseCoopers
AUDIT AND COMPLIANCE COMMITTEEWEI, Kevin Cheng (Chairman)TSANG, Hing LunLU, Daen
REMUNERATION AND NOMINATION COMMITTEETSANG, Hing Lun (Chairman)LIU, JianjunWANG, Xiaobo
HEADQUARTERS AND GLOBALENGINEERING CENTERNexteer Automotive3900 E. Holland RoadSaginaw, MI 48601-9494United States
REGISTERED OFFICEP.O. Box 309, Ugland HouseGrand Cayman, KY1-1104Cayman Islands
PRINCIPAL PLACE OF BUSINESS IN HONG KONG8/F, Gloucester TowerThe Landmark15 Queen’s Road CentralHong Kong
PRINCIPAL SHARE REGISTRAR AND TRANSFER OFFICEMaples Fund Services (Cayman) LimitedP.O. Box 1093, Boundary HallCricket SquareGrand Cayman, KY1-1102Cayman Islands
HONG KONG BRANCH SHAREREGISTRAR AND TRANSFER OFFICEComputershare Hong Kong Investor Services LimitedShops 1712–171617th FloorHopewell Centre183 Queen’s Road Central EastWanchaiHong Kong
PRINCIPAL BANKERSWells Fargo Capital FinanceBank of China Suzhou Industrial Park Sub-BranchShanghai Pudong Development Bank, Suzhou BranchCITIC New & Hi-tech Industrial Development ZoneThe Export-Import Bank of ChinaMAC N2814–220PKO Bank PolskiBank Pekao SA
STOCK CODE1316
COMPANY WEBSITEhttp://www.nexteer.com/

04 N E X T E E R A U T O M O T I V E G R O U P L I M I T E D
BUSINESS OVERVIEW
FIRST HALF OF 2014 BUSINESS HIGHLIGHTS
• Successfully launched new production of awarded customer programs
• Achieved a strong backlog to drive continued growth and diversification
• Invested in research and development (R&D) to strengthen product, technology and quality leadership
• Focused on continuous improvement in operating efficiency and cost competitiveness
NEW PRODUCTION LAUNCHES
With the launch of five major customer programs during the first six months of 2014, we introduced new or improved product applications in steering columns, drivelines, rack-assist EPS (REPS), single pinion-assist EPS (SPEPS), and column-assist EPS (CEPS). These programs included incumbent and conquest business to increase and further diversify our revenue base. Customer programs that launched or began production during the six month period ended June 30, 2014 included:
OEMs Vehicle Nameplate Our Products
North AmericaGeneral Motors Tahoe and Yukon ColumnFord Expedition REPSFord Mustang REPS
ChinaDongfeng Peugeot Citroën Auto. Peugeot 2008 HalfshaftsSAIC GM Wuling Wuling Baojun 730 Brush CEPS
BACKLOG OF BOOKED BUSINESS
We begin to derive revenue under a new business contract at start of production, which is generally 24 to 30 months from the date when the new business is contractually awarded. As of June 30, 2014, we have secured new contracts for a number of customer programs which are expected to begin production starting in the second half of 2014. We estimate the value of all booked business under contracts that have been awarded, but which have not yet begun production, as of June 30, 2014 amounts to approximately US$9.0 billion over the lifetime of the relevant vehicle programs (the Booked Business Amount). The Booked Business Amount is based on estimated lifetime volume of the programs derived from indicative production arrangements provided by the applicable OEM customers and information provided by third-party industry sources. In calculating the Booked Business Amount, we also assume that the relevant contracts will be performed in accordance with their terms. Any modification or suspension of the contracts related to the booked business by the Group’s customers may have a substantial and immediate effect on the value of the booked business. The value of booked business is not a measure defined by International Financial Reporting Standards (IFRS), and our methodology for determining the Booked Business Amount may not be comparable to the methodology used by other companies in determining the value of their booked business.
05I N T E R I M R E P O R T 2 0 1 4
Business Overview
While we believe that our current Booked Business Amount is a relevant financial metric, we must emphasize that the above information in relation to the booked business and the Booked Business Amount shall not constitute any forecast or prediction of the profits of the Group and the actual value may differ to the estimated Booked Business Amount due to various factors beyond the Group’s control.
PRODUCT RESEARCH & DEVELOPMENT
We have accumulated extensive technical knowledge and developed a high degree of technical expertise through our 100-year history as a steering and driveline systems supplier with a consistent focus on research and development. Our technological innovation is supported by advanced engineering and testing capabilities.
To support our growing global customer base, we increased our development and testing capability at our European and China Technology Centers. This move will enable our regional teams to be more responsive to the needs of our customers. In Europe we invested in additional SPEPS test and validation equipment and transferred program launch responsibility from the U.S. to Europe for most European programs. We also strengthened our German customer support centers to meet increasing demands from customers. Similarly in China, we invested in additional CEPS test and validation equipment and transferred program launch responsibility from the U.S. to China for most China programs. In addition, the China Technology Center is becoming the engineering center of expertise responsible for brush motor development for the company.
We also began in-house production of brushless motors in North America. The new brushless motor is a proprietary design with a tightly-packed, high-precision wound stator. The in-house motor delivers higher output in a smaller package. This new addition to our product portfolio also increases our vertical integration and opens up additional growth options for our business.
We have a quality culture that aspires to achieve perfect quality. In 2014, we achieved significant improvements on key quality metrics. During the first six months of 2014, first time quality improved by 8% from first time quality in the previous year ended December 31, 2013. Formal customer complaints were also reduced by 10% in the first half of 2014 from the previous year ended December 31, 2013. With increased sensitivity on product safety in the automotive industry, we are also working to further enhance our quality performance and minimize recall risk under the leadership of the Nexteer Product Safety Compliance Committee. We also continue to implement product traceability programs and review contractual terms and conditions to reduce potential financial exposure in product warranty.
FOCUS ON OPERATIONAL EFFICIENCY AND COST COMPETITIVENESS
During the first half of 2014, we implemented a new web-based product lifecycle management system. The system will provide high quality information to our global product development process. Users will have access to engineering drawings, specifications, change documents and be able to better manage project timelines. This will result in improved enterprise efficiency and effectiveness.
06 N E X T E E R A U T O M O T I V E G R O U P L I M I T E D
FINANCIAL HIGHLIGHTS
Six months ended
Six months ended
Results (US$000)June 30,
2014June 30,
2013
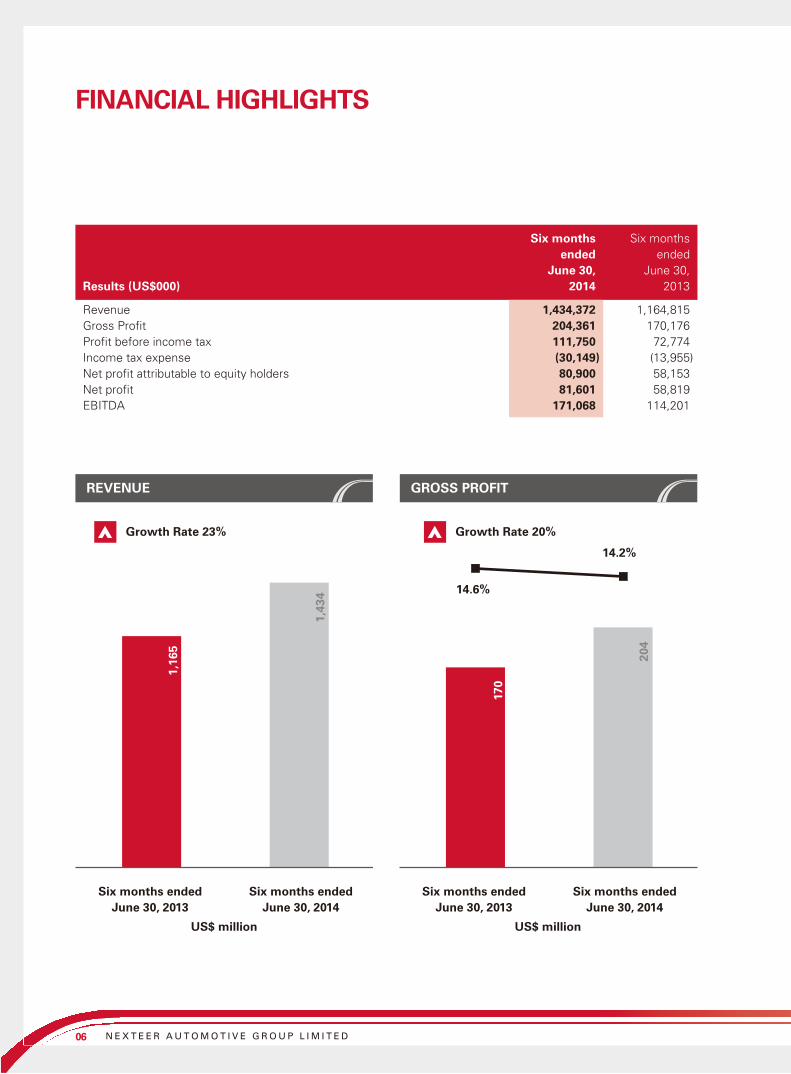
Revenue 1,434,372 1,164,815Gross Profit 204,361 170,176Profit before income tax 111,750 72,774Income tax expense (30,149) (13,955)Net profit attributable to equity holders 80,900 58,153Net profit 81,601 58,819EBITDA 171,068 114,201
Growth Rate 23% Growth Rate 20%
REVENUE GROSS PROFIT
Six months endedJune 30, 2014
Six months endedJune 30, 2013
US$ million
1,16
5
1,43
4
170
204
14.2%
14.6%
Six months endedJune 30, 2014
Six months endedJune 30, 2013
US$ million
07I N T E R I M R E P O R T 2 0 1 4
Financial Highlights
Assets and Liabilities (US$000)June 30,
2014December 31,
2013
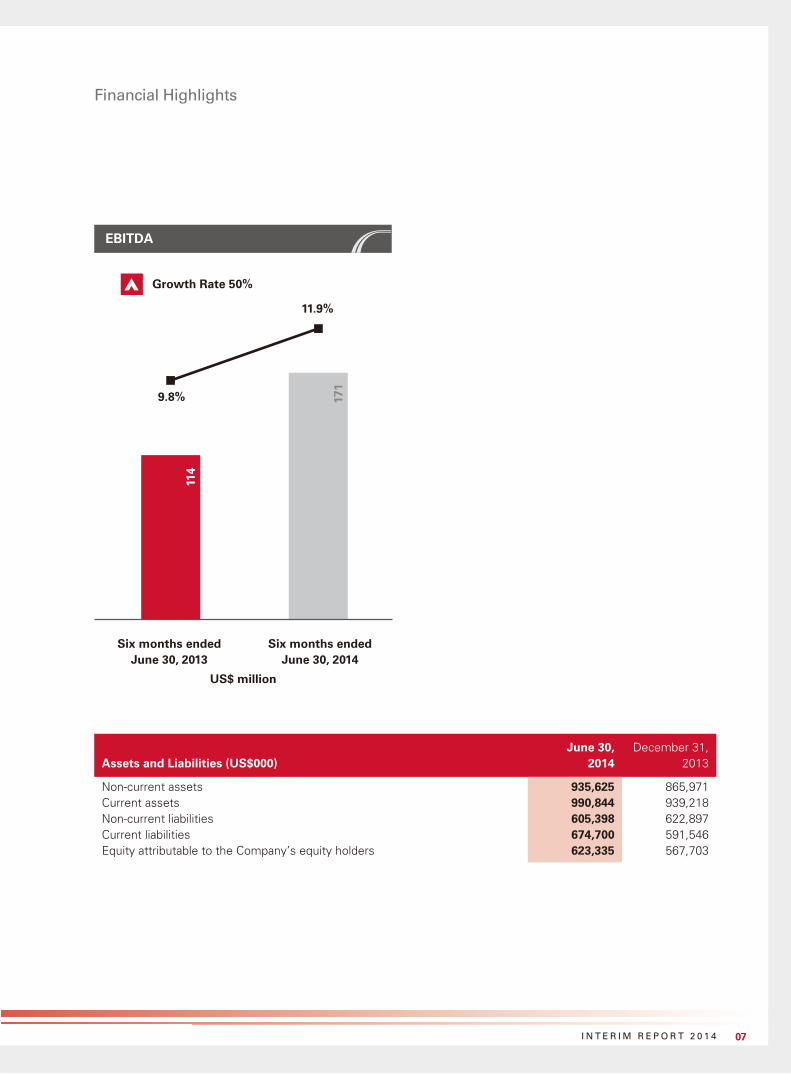
Non-current assets 935,625 865,971Current assets 990,844 939,218Non-current liabilities 605,398 622,897Current liabilities 674,700 591,546Equity attributable to the Company’s equity holders 623,335 567,703
Growth Rate 50%
EBITDA
114
171
9.8%
11.9%
Six months endedJune 30, 2014
Six months endedJune 30, 2013
US$ million
08 N E X T E E R A U T O M O T I V E G R O U P L I M I T E D
MANAGEMENT DISCUSSION AND ANALYSIS
The following management discussion and analysis should be read in conjunction with the Unaudited Interim Condensed Consolidated Financial Information, which has been prepared in accordance with, International Accounting Standard (IAS) 34 “Interim Financial Reporting“ issued by the International Accounting Standards Board.
GLOBAL AUTOMOTIVE MARKET
The growing global automotive market continues to drive demand in steering and driveline systems. Global light vehicle production increased by 3.8% from 42.4 million units for the six months ended June 30, 2013 to 44.0 million units for the six months ended June 30, 2014, achieving a new record high in this segment. Driven by continued increasing demand for vehicle ownership, China light vehicle production was at 11.3 million units for the six months ended June 30, 2014, an increase of 9.7% or 1.0 million units over the 10.3 million units produced for the six months ended June 30, 2013. North America recorded the fourth consecutive period of growth for the six months ended June 30, 2014 with 8.6 million units, an increase of 3.6% or 0.3 million units over the 8.3 million level achieved for the six months ended June 30, 2013. Europe production showed improvement over the previous year, as of June 30, 2014 at 10.4 million units, an increase of 4.0%, or 0.4 million units, over June 30, 2013 levels of 10.0 million units.
FINANCIAL REVIEW
Consistent with our business plan, the Group was successful in driving significant improvements to its financial position during the six months ended June 30, 2014 by capitalizing on strong market conditions as well as a continued focus on cost optimization. Additionally, the Group continued its commitment to capital spending and research and development in order to facilitate growth.
Operating EnvironmentThe Group’s profit attributable to equity holders of the Company for the six months ended June 30, 2014 was US$80.9 million or 5.6% of total revenue, an increase compared to the six months ended June 30, 2013 of US$58.2 million or 5.0% of total revenue. This increase was attributable to the following:
• Significant revenue growth from previously booked business
• Increased customer demands due to market strength
• Cost efficiency initiatives offset by one-time warranty costs
• Improved product line mix (continued conversion from HPS to EPS)
RevenueThe Group’s revenue for the six months ended June 30, 2014 was US$1,434.4 million, a 23.1% increase from the six months ended June 30, 2013 of US$1,164.8 million.
Revenue by Geographical SegmentsFor the six months ended June 30, 2014, the Group experienced an increase in revenue in North America, Europe, and China segments. This increase was partially offset by a decrease in revenue in the Rest of World segment.
09I N T E R I M R E P O R T 2 0 1 4
Management Discussion and Analysis
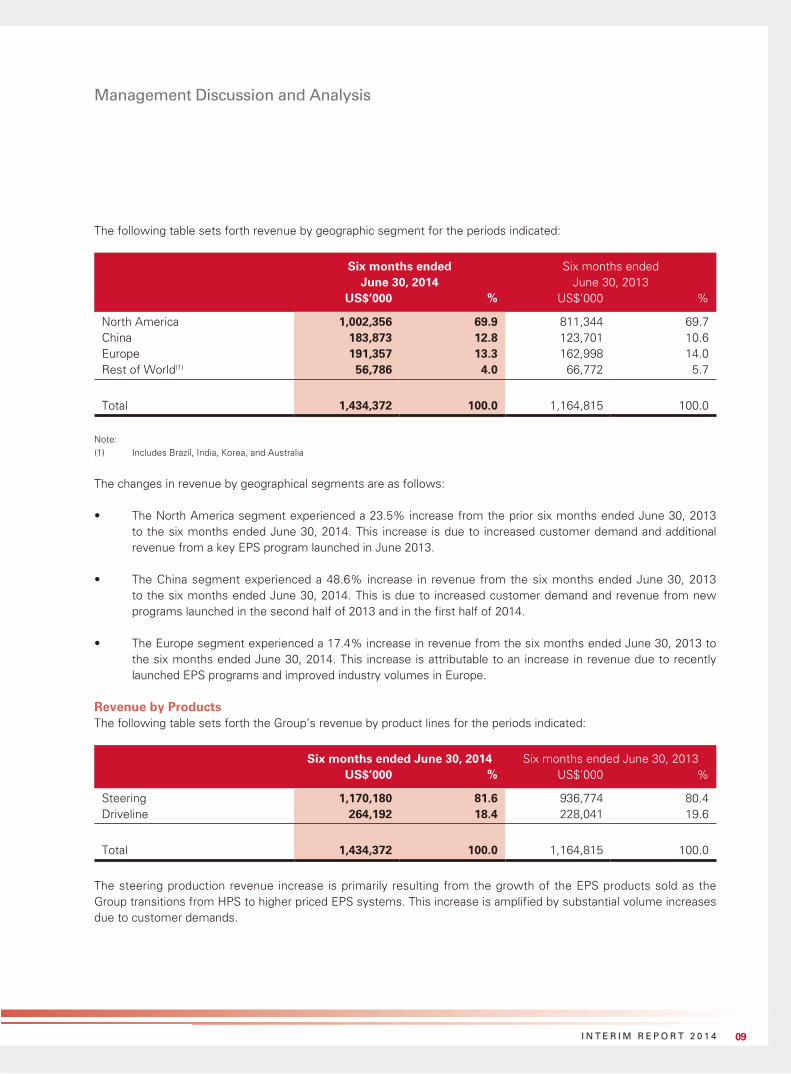
The following table sets forth revenue by geographic segment for the periods indicated:
Six months ended June 30, 2014
Six months ended June 30, 2013
US$’000 % US$’000 %
North America 1,002,356 69.9 811,344 69.7China 183,873 12.8 123,701 10.6Europe 191,357 13.3 162,998 14.0Rest of World(1) 56,786 4.0 66,772 5.7
Total 1,434,372 100.0 1,164,815 100.0
Note:
(1) Includes Brazil, India, Korea, and Australia
The changes in revenue by geographical segments are as follows:
• The North America segment experienced a 23.5% increase from the prior six months ended June 30, 2013 to the six months ended June 30, 2014. This increase is due to increased customer demand and additional revenue from a key EPS program launched in June 2013.
• The China segment experienced a 48.6% increase in revenue from the six months ended June 30, 2013 to the six months ended June 30, 2014. This is due to increased customer demand and revenue from new programs launched in the second half of 2013 and in the first half of 2014.
• The Europe segment experienced a 17.4% increase in revenue from the six months ended June 30, 2013 to the six months ended June 30, 2014. This increase is attributable to an increase in revenue due to recently launched EPS programs and improved industry volumes in Europe.
Revenue by ProductsThe following table sets forth the Group’s revenue by product lines for the periods indicated:
Six months ended June 30, 2014 Six months ended June 30, 2013US$’000 % US$’000 %
Steering 1,170,180 81.6 936,774 80.4Driveline 264,192 18.4 228,041 19.6
Total 1,434,372 100.0 1,164,815 100.0
The steering production revenue increase is primarily resulting from the growth of the EPS products sold as the Group transitions from HPS to higher priced EPS systems. This increase is amplified by substantial volume increases due to customer demands.
10 N E X T E E R A U T O M O T I V E G R O U P L I M I T E D
Management Discussion and Analysis
Cost of SalesThe Group’s cost of sales for the six months ended June 30, 2014 was US$1,230.0 million, an increase of US$235.4 million from the six months ended June 30, 2013. The Group’s cost of sales as of June 30, 2014 primarily included raw material costs of US$836.8 million, manufacturing expense of US$358.7 million, as well as other costs of sales of US$34.5 million.
The increase in cost of sales from the six months ended June 30, 2013 to the six months ended June 30, 2014 was the result of increased material and labor needed to satisfy customer driven volume increases for existing programs and additional volume for new programs as well as an increase in depreciation and amortisation expense of US$18.2 million to US$48.9 million for the six months ended June 30, 2014 from US$30.7 million for the six months ended June 30, 2013. The increase in depreciation and amortisation expense is due to the increase in capital equipment and capitalized product development costs for new product launches. Additionally, cost of sales was increased due to one-time warranty items of US$15.4 million from customer product recalls offsetting cost efficiency initiatives.
Engineering and Product Development CostsEngineering and product development costs in the interim condensed consolidated income statement represent costs incurred as part of continuous improvement initiatives and business pursuits. For the six months ended June 30, 2014, the Group’s engineering and product development costs charged to the consolidated income statement were US$37.0 million or 2.6% of revenue, a 0.6% decrease as a percentage of revenue from the six months ended June 30, 2013 of 3.2% of revenue, or US$37.6 million. The decrease in percentage of revenue is attributable to significant revenue growth in the six months ended June 30, 2014 compared to the six months ended June 30, 2013.
Administrative ExpensesThe Group’s administrative expenses for the six months ended June 30, 2014 were US$40.4 million, a decrease of US$3.4 million, or 7.8% compared to the six months ended June 30, 2013. The decrease was the result of higher costs incurred in the six months ended June 30, 2013 from the preparation for the initial public offering that were not incurred during the six months ended June 30, 2014.
Finance Costs, netFinance costs, net consist of interest income and expense reduced by interest capitalized on qualifying assets and product development. The Group’s net finance costs as of the six months ended June 30, 2014 were US$10.2 million which is a decrease of US$0.5 million from the six months ended June 30, 2013. This decrease was attributable to a lower average LIBOR rate for the six months ended June 30, 2014 compared to the six months ended June 30, 2013, as well as a reduction in the average outstanding principal balance on borrowings.
Income Tax ExpenseThe Group’s income tax expense was US$30.1 million for the six months ended June 30, 2014, representing 27.0% of the Group’s profit before income tax, an increase of US$16.1 million from US$14.0 million, or 19.2% of profit before tax for the six months ended June 30, 2013.
The increase in income tax expense is primarily the result of US$9.4 million of additional income tax expense incurred on the incremental US$39.0 million of profit before tax for the six months ended June 30, 2014 and a US$7.0 million tax benefit reflected in the consolidated income statement for the six months ended June 30, 2013 for a research & experimentation tax credit (R&E tax credit). For the six months ended June 30, 2014, no R&E tax credit has been included because the credit has expired at the end of 2013.
11I N T E R I M R E P O R T 2 0 1 4
Management Discussion and Analysis
Gross Profit and Gross MarginThe Group’s gross profit for the six months ended June 30, 2014 was US$204.4 million, an increase of US$34.2 million from US$170.2 million for the six months ended June 30, 2013. Gross margin for the six months ended June 30, 2014 was 14.2%, a 0.4% decrease from 14.6% for the six months ended June 30, 2013. This decrease was the result of improved manufacturing cost efficiency initiatives, offset by one time warranty costs related to product recalls of US$15.4 million and an increase in depreciation and amortisation of US$18.2 million.
Profit for the PeriodThe Group’s profit attributable to equity holders of the Company for the six months ended June 30, 2014 was US$80.9 million, an increase of US$22.7 million from US$58.2 million for the six months ended June 30, 2013.
ProvisionsAs of June 30, 2014, the Group has provisions of US$81.5 million for restructuring, legal disputes, environmental liabilities, warranties, and decommissioning, an increase of US$20.6 million from US$60.9 million as at December 31, 2013. This increase in provisions was primarily due to increased warranty reserves and current safety recalls by the Group’s customers.
WarrantyIncluded in these provisions is an amount of US$18.9 million for product recalls. The product recalls relate to component parts supplied by the Group that were manufactured by the Group’s suppliers. The provision amounts were determined by an internal estimate of our financial liability considering a range of outcomes. The amounts could change significantly based upon the final negotiations with the customer and supplier. As at the date hereof, the Group has not paid any amount on account of this recall and the Company is not aware of litigation filed against the Group by such customer.
Liquidity and Capital ResourcesCash FlowsThe Group’s business requires a significant amount of working capital, which is primarily used to finance the purchase of raw materials, capital spending for customer programs, and engineering and product development costs. Since the six months ended June 30, 2013, the Group has invested extensively in capital equipment and engineering and product development costs. For the six months ended June 30, 2014, the Group invested US$87.1 million and US$52.9 million in capital equipment and engineering product development, respectively. Due to an increase in cash generated from operations, the Group has reduced the principal balance on some of its borrowings.
In the future, we believe that our liquidity and capital expenditure requirements will be satisfied by cash generated from operating activities and continued debt facilities.
12 N E X T E E R A U T O M O T I V E G R O U P L I M I T E D
Management Discussion and Analysis
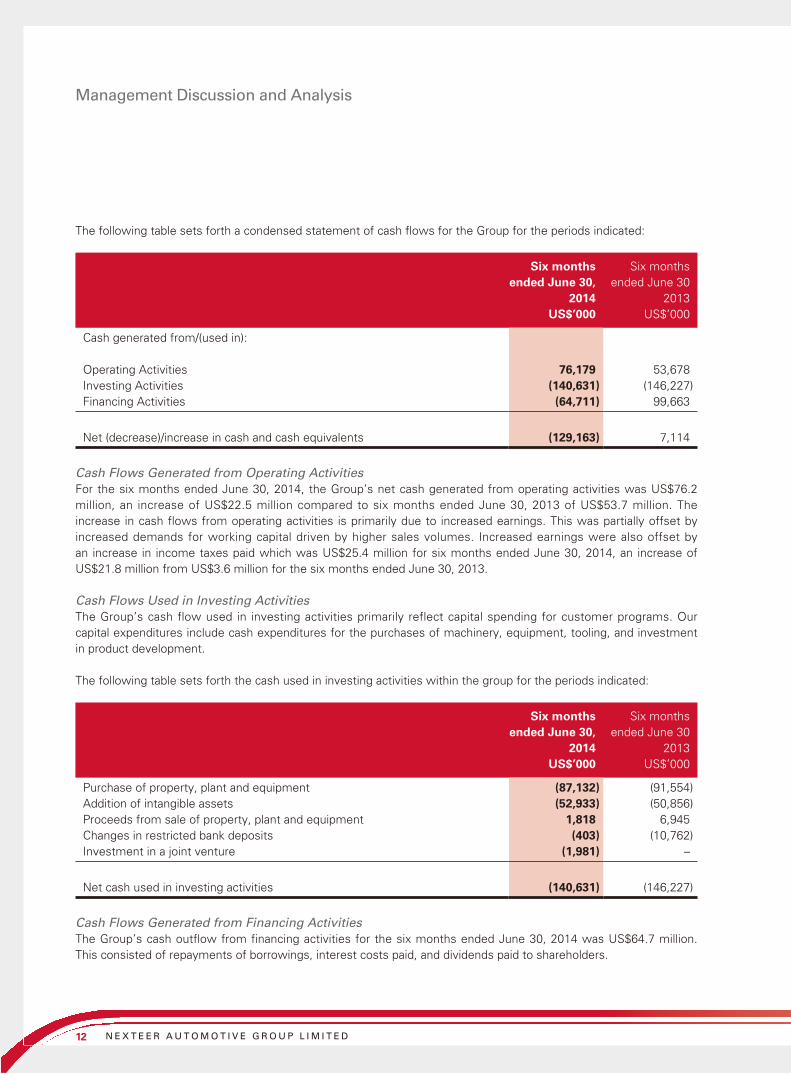
The following table sets forth a condensed statement of cash flows for the Group for the periods indicated:
Six monthsended June 30,
2014
Six monthsended June 30
2013US$’000 US$’000
Cash generated from/(used in):
Operating Activities 76,179 53,678Investing Activities (140,631) (146,227)Financing Activities (64,711) 99,663
Net (decrease)/increase in cash and cash equivalents (129,163) 7,114
Cash Flows Generated from Operating ActivitiesFor the six months ended June 30, 2014, the Group’s net cash generated from operating activities was US$76.2 million, an increase of US$22.5 million compared to six months ended June 30, 2013 of US$53.7 million. The increase in cash flows from operating activities is primarily due to increased earnings. This was partially offset by increased demands for working capital driven by higher sales volumes. Increased earnings were also offset by an increase in income taxes paid which was US$25.4 million for six months ended June 30, 2014, an increase of US$21.8 million from US$3.6 million for the six months ended June 30, 2013.
Cash Flows Used in Investing ActivitiesThe Group’s cash flow used in investing activities primarily reflect capital spending for customer programs. Our capital expenditures include cash expenditures for the purchases of machinery, equipment, tooling, and investment in product development.
The following table sets forth the cash used in investing activities within the group for the periods indicated:
Six monthsended June 30,
2014
Six monthsended June 30
2013US$’000 US$’000
Purchase of property, plant and equipment (87,132) (91,554)Addition of intangible assets (52,933) (50,856)Proceeds from sale of property, plant and equipment 1,818 6,945Changes in restricted bank deposits (403) (10,762)Investment in a joint venture (1,981) –
Net cash used in investing activities (140,631) (146,227)
Cash Flows Generated from Financing ActivitiesThe Group’s cash outflow from financing activities for the six months ended June 30, 2014 was US$64.7 million. This consisted of repayments of borrowings, interest costs paid, and dividends paid to shareholders.
13I N T E R I M R E P O R T 2 0 1 4
Management Discussion and Analysis
Exposure to Currency Rate Fluctuations and Related HedgesThe Group actively limits its foreign currency exposure through naturally matching its purchase of materials and sale of finish goods in the same currencies. The Group monitors its remaining foreign currency exposure regularly to reduce the risk of foreign currency fluctuations in its operations.
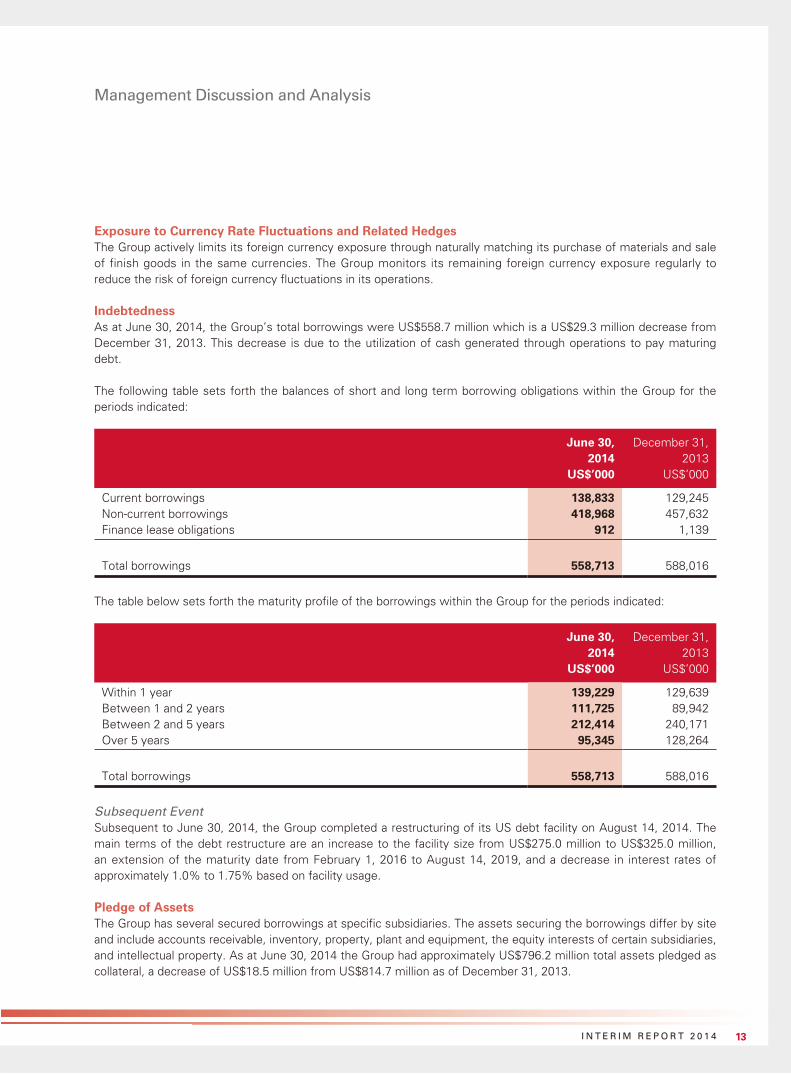
IndebtednessAs at June 30, 2014, the Group’s total borrowings were US$558.7 million which is a US$29.3 million decrease from December 31, 2013. This decrease is due to the utilization of cash generated through operations to pay maturing debt.
The following table sets forth the balances of short and long term borrowing obligations within the Group for the periods indicated:
June 30, 2014
December 31, 2013
US$’000 US$’000
Current borrowings 138,833 129,245Non-current borrowings 418,968 457,632Finance lease obligations 912 1,139
Total borrowings 558,713 588,016
The table below sets forth the maturity profile of the borrowings within the Group for the periods indicated:
June 30, 2014
December 31, 2013
US$’000 US$’000
Within 1 year 139,229 129,639Between 1 and 2 years 111,725 89,942Between 2 and 5 years 212,414 240,171Over 5 years 95,345 128,264
Total borrowings 558,713 588,016
Subsequent EventSubsequent to June 30, 2014, the Group completed a restructuring of its US debt facility on August 14, 2014. The main terms of the debt restructure are an increase to the facility size from US$275.0 million to US$325.0 million, an extension of the maturity date from February 1, 2016 to August 14, 2019, and a decrease in interest rates of approximately 1.0% to 1.75% based on facility usage.
Pledge of AssetsThe Group has several secured borrowings at specific subsidiaries. The assets securing the borrowings differ by site and include accounts receivable, inventory, property, plant and equipment, the equity interests of certain subsidiaries, and intellectual property. As at June 30, 2014 the Group had approximately US$796.2 million total assets pledged as collateral, a decrease of US$18.5 million from US$814.7 million as of December 31, 2013.

14 N E X T E E R A U T O M O T I V E G R O U P L I M I T E D
Management Discussion and Analysis
Gearing RatioThe Group monitors capital structure on the basis of the gearing ratio. The ratio is calculated as total borrowings divided by total equity at the end of the respective period. The gearing ratio as of June 30, 2014 was 86.4%, a decrease of 13.1% from December 31, 2013 which was 99.5%. This is due to an increase in total equity of US$55.6 million. In addition, the gearing ratio was further impacted by a decrease in borrowings of US$29.3 million from US$558.7 million as of June 30, 2014 compared to US$588.0 as of December 31, 2013.
OTHER INFORMATION
Future ProspectsWe plan to strengthen our business in North America, grow in Europe and expand our business in developing markets, including China, by offering steering and driveline products that are specifically tailored for different markets’ product performance and price requirements. In addition, we plan to build upon existing relationships with global and local original equipment manufacturers in these markets. We also may pursue selected strategic acquisitions and alliances globally, including in developing markets. We plan to expand our manufacturing plants in certain countries, such as China, to increase our production capacity. We believe that by offering tailored products, building upon existing relationships, pursuing strategic acquisitions and alliances and expanding our manufacturing plants, our brand recognition and revenue in developing markets will continue to grow.
Employees Remuneration PolicyAs of June 30, 2014, the Group had 10,570 employees globally. The Group’s remuneration policies are formulated based on the performance of individual employees and company performance and are reviewed regularly. The Group’s full time employees participate in various employee benefits and workers compensation plans. In addition, the Group adopted employee incentive plans designed to attract and retain employees with a view of encouraging the participants to commit to enhancing value for the Group and its Shareholders as a whole. For example, the Group has a retention program that includes individual development plans, merit wage adjustments and promotions.
The Group offers training programs to its employees which are designed to develop skills that they need to meet the Group’s enterprise goals and customer requirements and to meet certain training requirements such as mandated customer or regulatory requirements and contractual obligations.
15I N T E R I M R E P O R T 2 0 1 4
CORPORATE GOVERNANCE/OTHER INFORMATION
CORPORATE GOVERNANCE PRACTICES
The Company has adopted its own Internal Control and Corporate Governance Policies, which are based on and more stringent than the principles, provisions and practices set out in the Corporate Governance Code (the Hong Kong CG Code) contained in Appendix 14 of the Rules Governing the Listing of Securities on The Stock Exchange of Hong Kong Limited (the Stock Exchange) (the Listing Rules).
Except for the deviation disclosed in this interim report, in the opinion of the Directors, the Company has complied with all the code provisions as set out in the Hong Kong CG Code throughout the six months ended June 30, 2014.
Chairman and Chief ExecutiveA.2.1 – Mr. ZHAO Guibin, our chairman also acts as the Chief Executive Officer of the Company which will constitute a deviation from Code Provision A.2.1 of the Hong Kong CG Code. The Board believes that this structure will not impair the balance of power and authority between the Board and the management of the Company or the Group, given that: (i) decisions made by our Board require approval by at least a majority of our Directors and that our Board includes three Independent Non-Executive Directors out of a total of eight Directors, which is more than the Listing Rules requirement of one-third, and we believe there is sufficient check and balance in the Board; (ii) Mr. ZHAO and the other Directors are aware of and undertake to fulfill their fiduciary duties as Directors, which require, among other things, that each Director, including Mr. ZHAO, acts for the benefit and in the best interests of the Group and will make decisions for our Group accordingly; and (iii) the balance of power and authority is ensured by the operations of the Board which comprises experienced and high caliber individuals who meet regularly to discuss issues affecting the operations of the Group. Moreover, the overall strategic, financial and operational policies of the Group are made collectively after thorough discussion at both Board and senior management levels. The Board will continue to review the effectiveness of the corporate governance structure of the Group in order to assess whether separation of the roles of chairman and Chief Executive Officer is necessary.
COMPLIANCE WITH CODE ON CONDUCT REGARDING DIRECTORS’ SECURITIES TRANSACTIONS
The Company has adopted the Model Code for Securities Transactions by Directors of Listed Issuers (the Model Code) as set out in Appendix 10 of the Listing Rules as the Company’s code of conduct regarding securities transactions by the Directors of the Company. Having made specific enquiry of all Directors of the Company, all Directors have confirmed that they complied with the required standards set out in the Model Code throughout the six months ended June 30, 2014.
The Company has also adopted its own code of conduct regarding employees’ securities transactions in terms no less exacting than the standard set out in the Model Code for the compliance by its relevant employees who are likely to be in possession of unpublished inside information of the Company in respect of their dealings in the Company’s securities.

16 N E X T E E R A U T O M O T I V E G R O U P L I M I T E D
Corporate Governance/Other information
INTERIM DIVIDEND
The Board does not recommend any interim dividend for the six months ended June 30, 2014.
AUDIT AND COMPLIANCE COMMITTEE AND REVIEW OF INTERIM CONDENSED CONSOLIDATED FINANCIAL INFORMATION
The Audit and Compliance Committee has reviewed together with management and the external auditor the unaudited interim condensed consolidated financial information of the Company for the six months ended June 30, 2014. There has been no disagreement between the Audit and Compliance Committee or the auditor with the accounting treatment adopted by the Company.
PURCHASE, SALE OR REDEMPTION BY THE COMPANY
There was no purchase, sale and redemption of any listed securities of the Company by the Company or any of its subsidiaries during the six months ended June 30, 2014.
USE OF NET PROCEEDS FROM LISTING
On October 7, 2013 (the Listing Date), the shares of the Company were listed on the Main Board of the Stock Exchange and raised net proceeds of approximately US$273 million. As at June 30, 2014, the Company has used approximately US$209 million and has not used the remaining of approximately US$64 million from such proceeds in accordance with the section headed “Future Plans and Use of Proceeds” of the Company’s prospectus dated September 24, 2013. As at June 30, 2014, the planned and actual uses of such proceeds were as follows:
Use
Approximate percentage of net proceeds
Approximateamount of
net proceeds
Approximateamountutilized
Approximateamount
remaining(in US$ million) (in US$ million) (in US$ million)
Capital expenditure on new product programs secured from OEM customers or expects to be secured and expansion of manufacturing capacity and facilities 72% 197 133 64
Strengthening of our research and development capabilities, developing new technologies and products, and enhancing key component manufacturing capabilities 21% 57 57 –
Working capital 7% 19 19 –
Total 100% 273 209 64
The remaining proceeds of approximately US$64 million, deposited in normal interest bearing saving accounts, will be applied by the Company for future capital expenditures.
17I N T E R I M R E P O R T 2 0 1 4
Corporate Governance/Other information
SHARE OPTION SCHEME
On June 5, 2014, the Company adopted a share option scheme (the Share Option Scheme).
The Board may, at its discretion, invite any Directors (excluding independent non-executive Directors), senior management as well as other key employees approved by the Board; as the Participants (as defined under the Share Option Scheme).
An Option may be accepted by a participant within 5 days from the date of the offer of the grant of the Option.
The period within which the Options (as defined under the Share Option Scheme) may be exercised must expire no later than 10 years from the relevant Date of Grant. The Option must be held for one year from the Date of Grant before it can be exercised. The vesting period shall be three years and one-third shall be vested at each anniversary from the Date of Grant. The consideration payable for acceptance of the Option by each Participant is HK$1.00.
The Subscription Price (as defined under the Share Option Scheme) shall be such price determined by the Board in its absolute discretion and notified to the Participant in the Offer and shall be no less than the higher of:
(a) the closing price of a share as stated in the daily quotations sheet issued by the Stock Exchange on the Date of Grant;
(b) the average closing price of the shares as stated in the daily quotations sheets issued by the Stock Exchange for the five business days immediately preceding the Date of Grant; or
(c) the nominal value of a share.

18 N E X T E E R A U T O M O T I V E G R O U P L I M I T E D
Corporate Governance/Other information
The Share Option Scheme will remain in force for a period of 10 years commencing on the date on which the Share Option Scheme became unconditional and has a remaining term of approximately 10 years as at the date of this report.
The summary of the Options initially granted under the Share Option Scheme that were still outstanding as of June 30, 2014 are as follows:
Grant date
Options granted
during the interim
period
Options exercised
during the interim
period ended
June 30, 2014
Options cancelled/
lapsed during
the period
Options held at
June 30, 2014
Exercise period(1)
Exercise price
per share
Share price on
the grant date(2)
Share price on
the exercise date(3)
HK$ HK$ HK$
DirectorZHAO, Guibin June 11, 2014 1,667,970 – – 1,667,970 June 11, 2014 –
June 10, 2024
5.15 5.15 N/A
FAN, Yi June 11, 2014 526,730 – – 526,730 June 11, 2014 –
June 10, 2024
5.15 5.15 N/A
LU, Daen June 11, 2014 351,150 – – 351,150 June 11, 2014 –
June 10, 2024
5.15 5.15 N/A
WANG, Xiaobo June 11, 2014 351,150 – – 351,150 June 11, 2014 –
June 10, 2024
5.15 5.15 N/A
Sub-total 2,897,000 – – 2,897,000 Senior ManagementBRESSON, Laurent
Robert(4)
June 11, 2014 2,633,650 – – 2,633,650 June 11, 2014 –
June 10, 2024
5.15 5.15 N/A
Senior Management
(in aggregate)
June 11, 2014 5,706,210 – (702,300) 5,003,910 June 11, 2014 –
June 10, 2024
5.15 5.15 N/A
Sub-total 8,339,860 – (702,300) 7,637,560 Total 11,236,860 – (702,300) 10,534,560
Notes:
(1) The Options must be held for one year from June 11, 2014. The Options are exercisable subject to, amongst other relevant vesting criteria,
the vesting schedule of one-third at each anniversary of the Date of Grant of Options.
(2) The Subscription Price was the closing price of the shares quoted on the Stock Exchange on the trading day on the Date of the Grant of the
Options.
(3) No Option was exercised during the period ended June 30, 2014.
(4) Mr BRESSON, Laurent Robert is the President and global chief operating officer of the Company.
19I N T E R I M R E P O R T 2 0 1 4
Corporate Governance/Other information
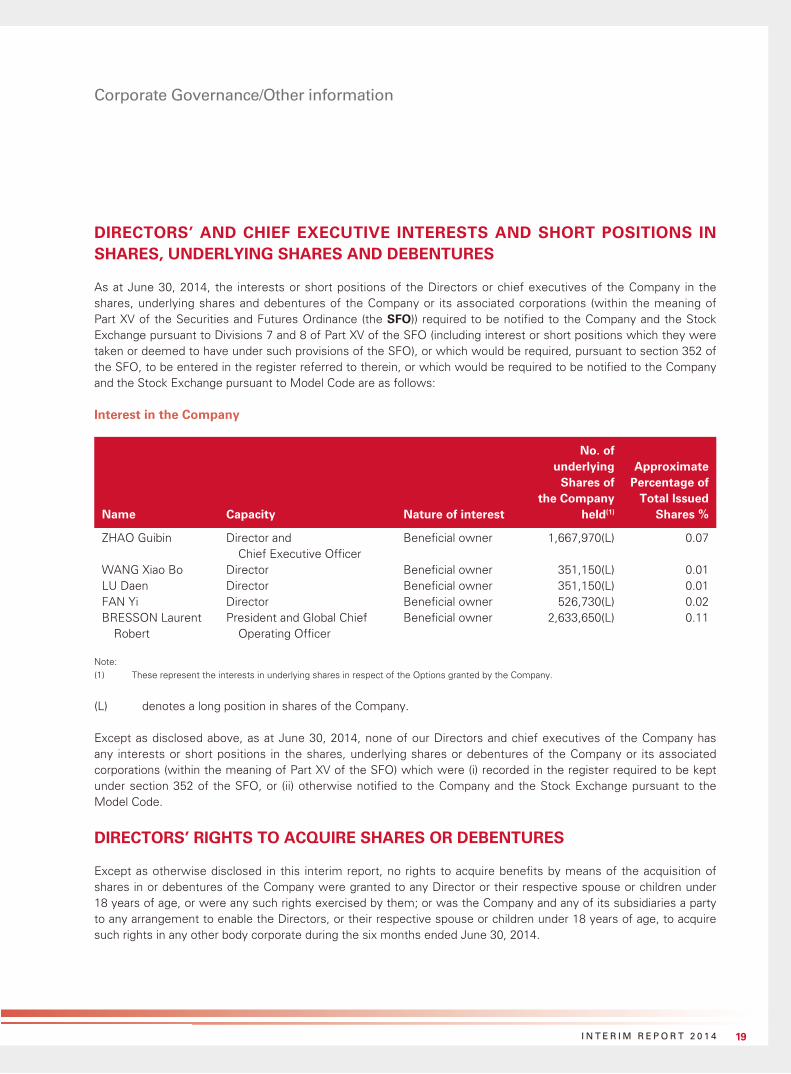
DIRECTORS’ AND CHIEF EXECUTIVE INTERESTS AND SHORT POSITIONS IN SHARES, UNDERLYING SHARES AND DEBENTURES
As at June 30, 2014, the interests or short positions of the Directors or chief executives of the Company in the shares, underlying shares and debentures of the Company or its associated corporations (within the meaning of Part XV of the Securities and Futures Ordinance (the SFO)) required to be notified to the Company and the Stock Exchange pursuant to Divisions 7 and 8 of Part XV of the SFO (including interest or short positions which they were taken or deemed to have under such provisions of the SFO), or which would be required, pursuant to section 352 of the SFO, to be entered in the register referred to therein, or which would be required to be notified to the Company and the Stock Exchange pursuant to Model Code are as follows:
Interest in the Company
Name Capacity Nature of interest
No. of underlying
Shares of the Company
held(1)
Approximate Percentage of
Total Issued Shares %
ZHAO Guibin Director and Chief Executive Officer
Beneficial owner 1,667,970(L) 0.07
WANG Xiao Bo Director Beneficial owner 351,150(L) 0.01LU Daen Director Beneficial owner 351,150(L) 0.01FAN Yi Director Beneficial owner 526,730(L) 0.02BRESSON Laurent
RobertPresident and Global Chief
Operating OfficerBeneficial owner 2,633,650(L) 0.11
Note:
(1) These represent the interests in underlying shares in respect of the Options granted by the Company.
(L) denotes a long position in shares of the Company.
Except as disclosed above, as at June 30, 2014, none of our Directors and chief executives of the Company has any interests or short positions in the shares, underlying shares or debentures of the Company or its associated corporations (within the meaning of Part XV of the SFO) which were (i) recorded in the register required to be kept under section 352 of the SFO, or (ii) otherwise notified to the Company and the Stock Exchange pursuant to the Model Code.
DIRECTORS’ RIGHTS TO ACQUIRE SHARES OR DEBENTURES
Except as otherwise disclosed in this interim report, no rights to acquire benefits by means of the acquisition of shares in or debentures of the Company were granted to any Director or their respective spouse or children under 18 years of age, or were any such rights exercised by them; or was the Company and any of its subsidiaries a party to any arrangement to enable the Directors, or their respective spouse or children under 18 years of age, to acquire such rights in any other body corporate during the six months ended June 30, 2014.
20 N E X T E E R A U T O M O T I V E G R O U P L I M I T E D
Corporate Governance/Other information
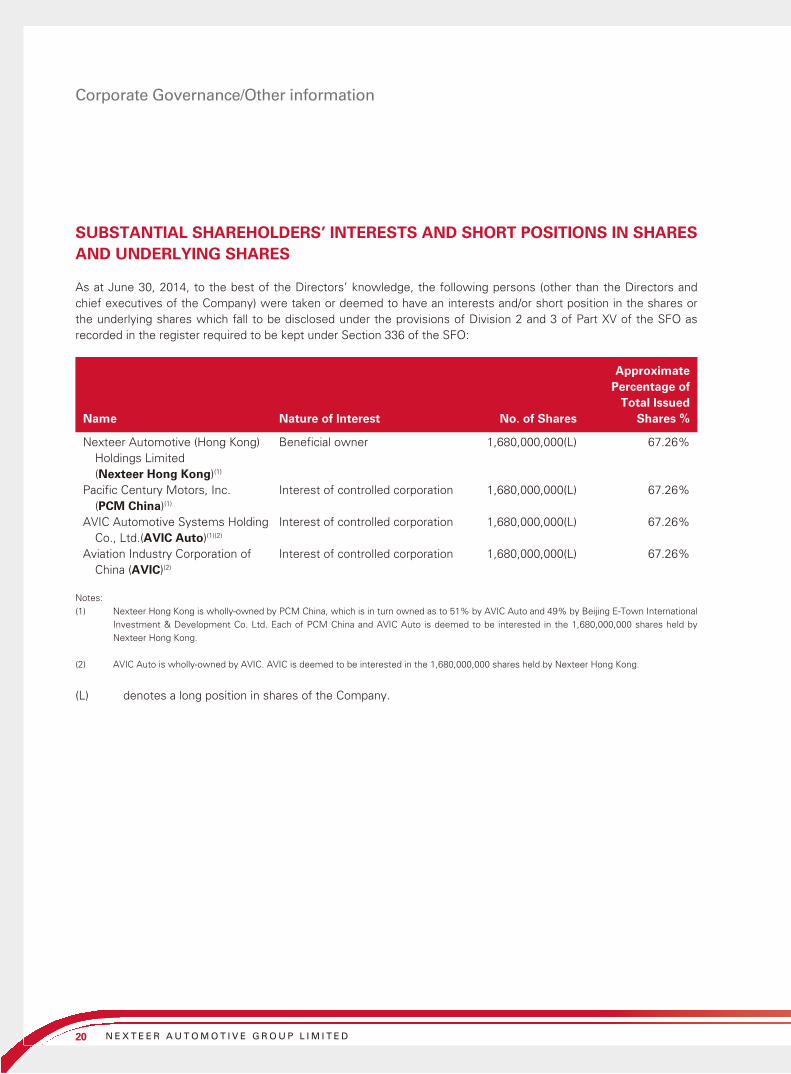
SUBSTANTIAL SHAREHOLDERS’ INTERESTS AND SHORT POSITIONS IN SHARES AND UNDERLYING SHARES
As at June 30, 2014, to the best of the Directors’ knowledge, the following persons (other than the Directors and chief executives of the Company) were taken or deemed to have an interests and/or short position in the shares or the underlying shares which fall to be disclosed under the provisions of Division 2 and 3 of Part XV of the SFO as recorded in the register required to be kept under Section 336 of the SFO:
Name Nature of Interest No. of Shares
Approximate Percentage of
Total Issued Shares %
Nexteer Automotive (Hong Kong) Holdings Limited (Nexteer Hong Kong)(1)
Beneficial owner 1,680,000,000(L) 67.26%
Pacific Century Motors, Inc. (PCM China)(1)
Interest of controlled corporation 1,680,000,000(L) 67.26%
AVIC Automotive Systems Holding Co., Ltd.(AVIC Auto)(1)(2)
Interest of controlled corporation 1,680,000,000(L) 67.26%
Aviation Industry Corporation of China (AVIC)(2)
Interest of controlled corporation 1,680,000,000(L) 67.26%
Notes:
(1) Nexteer Hong Kong is wholly-owned by PCM China, which is in turn owned as to 51% by AVIC Auto and 49% by Beijing E-Town International
Investment & Development Co. Ltd. Each of PCM China and AVIC Auto is deemed to be interested in the 1,680,000,000 shares held by
Nexteer Hong Kong.
(2) AVIC Auto is wholly-owned by AVIC. AVIC is deemed to be interested in the 1,680,000,000 shares held by Nexteer Hong Kong.
(L) denotes a long position in shares of the Company.
21I N T E R I M R E P O R T 2 0 1 4
REPORT ON REVIEW OF INTERIM FINANCIAL INFORMATION
REPORT ON REVIEW OF INTERIM FINANCIAL INFORMATIONTO THE BOARD OF DIRECTORS OF NEXTEER AUTOMOTIVE GROUP LIMITED(incorporated in the Cayman Islands with limited liability)
INTRODUCTION
We have reviewed the interim financial information set out on pages 23 to 54, which comprises the interim condensed consolidated balance sheet of Nexteer Automotive Group Limited (the “Company”) and its subsidiaries (together, the “Group”) as at June 30, 2014 and the related interim condensed consolidated income statement, statement of comprehensive income, statement of changes in equity and statement of cash flows for the six-month period then ended, and a summary of significant accounting policies and other explanatory notes. The Rules Governing the Listing of Securities on The Stock Exchange of Hong Kong Limited require the preparation of a report on interim financial information to be in compliance with the relevant provisions thereof and International Accounting Standard 34 “Interim Financial Reporting”. The directors of the Company are responsible for the preparation and presentation of this interim financial information in accordance with International Accounting Standard 34 “Interim Financial Reporting”. Our responsibility is to express a conclusion on this interim financial information based on our review and to report our conclusion solely to you, as a body, in accordance with our agreed terms of engagement and for no other purpose. We do not assume responsibility towards or accept liability to any other person for the contents of this report.
SCOPE OF REVIEW
We conducted our review in accordance with International Standard on Review Engagements 2410, “Review of Interim Financial Information Performed by the Independent Auditor of the Entity”. A review of interim financial information consists of making inquiries, primarily of persons responsible for financial and accounting matters, and applying analytical and other review procedures. A review is substantially less in scope than an audit conducted in accordance with International Standards on Auditing and consequently does not enable us to obtain assurance that we would become aware of all significant matters that might be identified in an audit. Accordingly, we do not express an audit opinion.
22 N E X T E E R A U T O M O T I V E G R O U P L I M I T E D
Report on Review of Interim Financial Information
CONCLUSION
Based on our review, nothing has come to our attention that causes us to believe that the interim financial information is not prepared, in all material respects, in accordance with International Accounting Standard 34 “Interim Financial Reporting”.
PricewaterhouseCoopersCertified Public Accountants
Hong Kong, August 28, 2014
23I N T E R I M R E P O R T 2 0 1 4
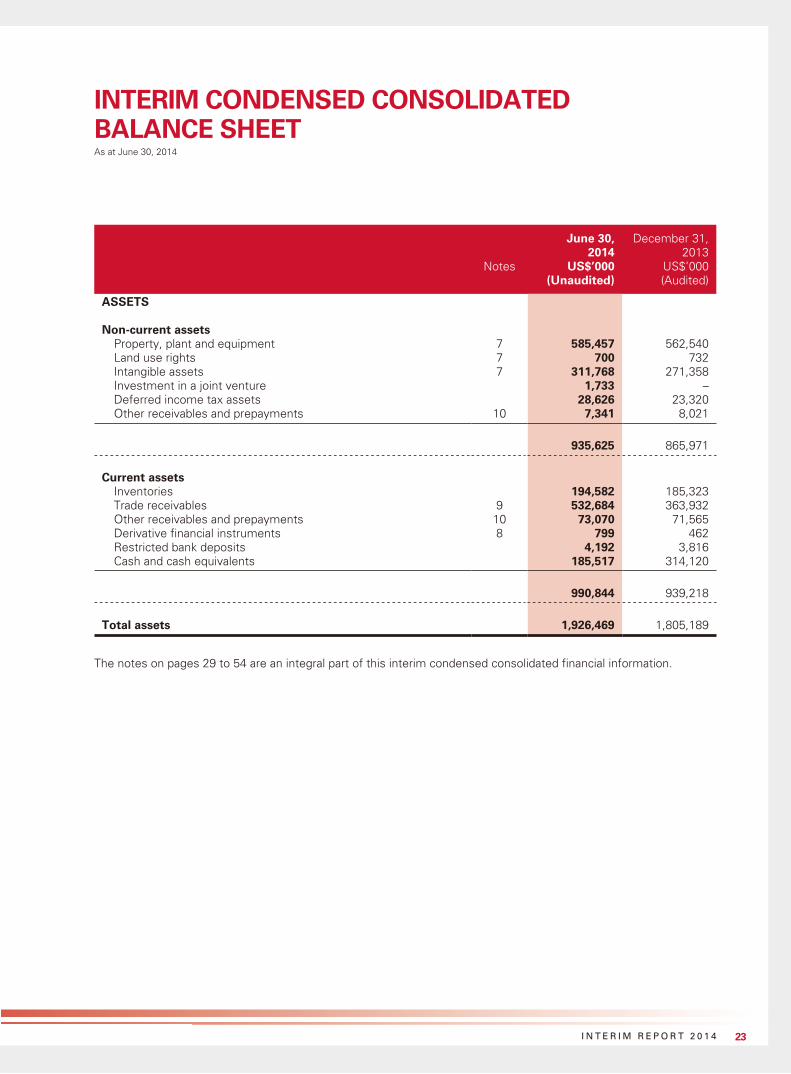
INTERIM CONDENSED CONSOLIDATED BALANCE SHEETAs at June 30, 2014
June 30, 2014
December 31, 2013
Notes US$’000 US$’000(Unaudited) (Audited)
ASSETS
Non-current assetsProperty, plant and equipment 7 585,457 562,540Land use rights 7 700 732Intangible assets 7 311,768 271,358Investment in a joint venture 1,733 –Deferred income tax assets 28,626 23,320Other receivables and prepayments 10 7,341 8,021
935,625 865,971
Current assetsInventories 194,582 185,323Trade receivables 9 532,684 363,932Other receivables and prepayments 10 73,070 71,565Derivative financial instruments 8 799 462Restricted bank deposits 4,192 3,816Cash and cash equivalents 185,517 314,120
990,844 939,218
Total assets 1,926,469 1,805,189
The notes on pages 29 to 54 are an integral part of this interim condensed consolidated financial information.
24 N E X T E E R A U T O M O T I V E G R O U P L I M I T E D
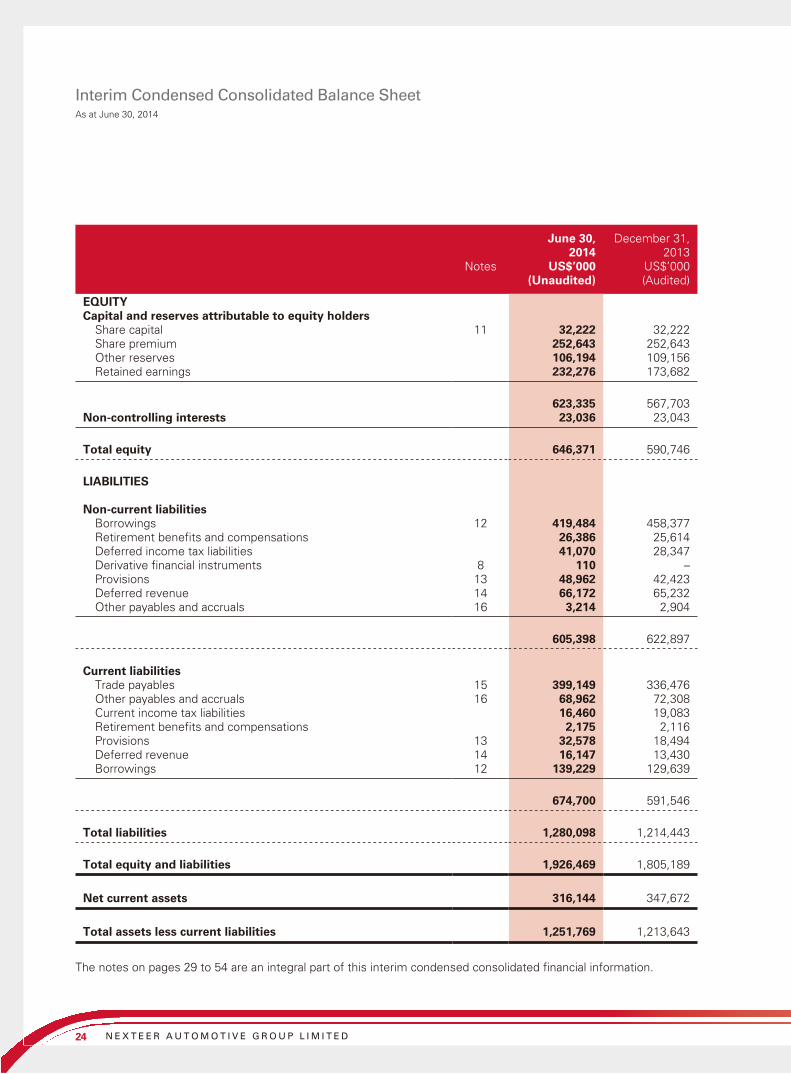
Interim Condensed Consolidated Balance SheetAs at June 30, 2014
June 30, 2014
December 31, 2013
Notes US$’000 US$’000(Unaudited) (Audited)
EQUITYCapital and reserves attributable to equity holders
Share capital 11 32,222 32,222Share premium 252,643 252,643Other reserves 106,194 109,156Retained earnings 232,276 173,682
623,335 567,703Non-controlling interests 23,036 23,043
Total equity 646,371 590,746
LIABILITIES
Non-current liabilities Borrowings 12 419,484 458,377Retirement benefits and compensations 26,386 25,614Deferred income tax liabilities 41,070 28,347Derivative financial instruments 8 110 –Provisions 13 48,962 42,423Deferred revenue 14 66,172 65,232Other payables and accruals 16 3,214 2,904
605,398 622,897
Current liabilitiesTrade payables 15 399,149 336,476Other payables and accruals 16 68,962 72,308Current income tax liabilities 16,460 19,083Retirement benefits and compensations 2,175 2,116Provisions 13 32,578 18,494Deferred revenue 14 16,147 13,430Borrowings 12 139,229 129,639
674,700 591,546
Total liabilities 1,280,098 1,214,443
Total equity and liabilities 1,926,469 1,805,189
Net current assets 316,144 347,672
Total assets less current liabilities 1,251,769 1,213,643
The notes on pages 29 to 54 are an integral part of this interim condensed consolidated financial information.
25I N T E R I M R E P O R T 2 0 1 4
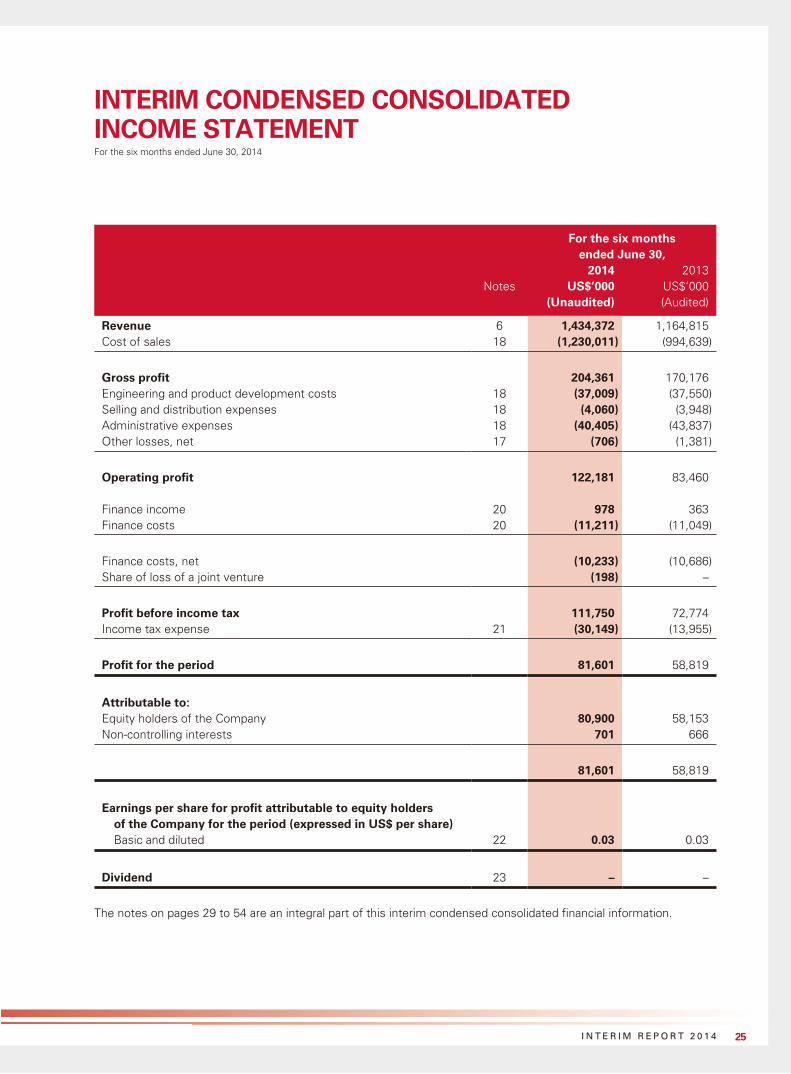
INTERIM CONDENSED CONSOLIDATED INCOME STATEMENTFor the six months ended June 30, 2014
For the six months ended June 30,
2014 2013Notes US$’000 US$’000
(Unaudited) (Audited)
Revenue 6 1,434,372 1,164,815Cost of sales 18 (1,230,011) (994,639)
Gross profit 204,361 170,176Engineering and product development costs 18 (37,009) (37,550)Selling and distribution expenses 18 (4,060) (3,948)Administrative expenses 18 (40,405) (43,837)Other losses, net 17 (706) (1,381)
Operating profit 122,181 83,460
Finance income 20 978 363Finance costs 20 (11,211) (11,049)
Finance costs, net (10,233) (10,686)Share of loss of a joint venture (198) –
Profit before income tax 111,750 72,774Income tax expense 21 (30,149) (13,955)
Profit for the period 81,601 58,819
Attributable to:Equity holders of the Company 80,900 58,153Non-controlling interests 701 666
81,601 58,819
Earnings per share for profit attributable to equity holders of the Company for the period (expressed in US$ per share)Basic and diluted 22 0.03 0.03
Dividend 23 – –
The notes on pages 29 to 54 are an integral part of this interim condensed consolidated financial information.

26 N E X T E E R A U T O M O T I V E G R O U P L I M I T E D
INTERIM CONDENSED CONSOLIDATED STATEMENT OF COMPREHENSIVE INCOMEFor the six months ended June 30, 2014
For the six months ended June 30,
2014 2013US$’000 US$’000
(Unaudited) (Audited)
Profit for the period 81,601 58,819
Other comprehensive loss
Items that will not be reclassified to profit or lossActuarial (losses)/gains on defined benefit plans,
net of tax of US$(271,000) (six months ended June 30, 2013: US$217,000) (652) 502
Items that may be reclassified subsequently to profit or lossExchange differences (3,684) (7,102)Cash flow hedges (110) –
(4,446) (6,600)
Total comprehensive income for the period 77,155 52,219
Attributable to:Equity holders of the Company 77,162 51,448Non-controlling interests (7) 771
77,155 52,219
The notes on pages 29 to 54 are an integral part of this interim condensed consolidated financial information.

27I N T E R I M R E P O R T 2 0 1 4
INTERIM CONDENSED CONSOLIDATED STATEMENT OF CHANGES IN EQUITYFor the six months ended June 30, 2014
Attributable to equity holders of the Company
Non-controlling
interests
Share capital
Share premium
Merger reserve
Share-based
compensation reserve
Exchange reserve
Hedging reserve
Retained earnings Sub-total Total
US$’000 US$’000 US$’000 US$’000 US$’000 US$’000 US$’000 US$’000 US$’000 US$’000
(Note 11)
For the six months ended June 30, 2014 (unaudited)
Balance at January 1, 2014 32,222 252,643 113,000 – (3,844) – 173,682 567,703 23,043 590,746
Comprehensive incomeProfit for the period – – – – – – 80,900 80,900 701 81,601
Other comprehensive loss – – – – (2,976) (110) (652) (3,738) (708) (4,446)
Total comprehensive (loss)/income – – – – (2,976) (110) 80,248 77,162 (7) 77,155
Transactions with ownersValue of employee services provided under
share option scheme (Note 19) – – – 124 – – – 124 – 124
Dividends (Note 23) – – – – – – (21,654) (21,654) – (21,654)
Balance at June 30, 2014 32,222 252,643 113,000 124 (6,820) (110) 232,276 623,335 23,036 646,371
For the six months ended June 30, 2013 (audited)
Balance at January 1, 2013 – – 113,000 – (5,107) – 63,038 170,931 20,878 191,809
Comprehensive incomeProfit for the period – – – – – – 58,153 58,153 666 58,819
Other comprehensive (loss)/income – – – – (7,207) – 502 (6,705) 105 (6,600)
Total comprehensive (loss)/income – – – – (7,207) – 58,655 51,448 771 52,219
Balance at June 30, 2013 – – 113,000 – (12,314) – 121,693 222,379 21,649 244,028
The notes on pages 29 to 54 are an integral part of this interim condensed consolidated financial information.

28 N E X T E E R A U T O M O T I V E G R O U P L I M I T E D
INTERIM CONDENSED CONSOLIDATED STATEMENT OF CASH FLOWSFor the six months ended June 30, 2014
For the six months ended June 30,
2014 2013US$’000 US$’000
(Unaudited) (Audited)
Cash flows from operating activities
Cash generated from operations 101,596 57,229Income tax paid (25,417) (3,551)
Net cash generated from operating activities 76,179 53,678
Cash flows from investing activities
Purchase of property, plant and equipment (87,132) (91,554)Addition of intangible assets (52,933) (50,856)Proceeds from sale of property, plant and equipment 1,818 6,945Changes in restricted bank deposits (403) (10,762)Investment in a joint venture (1,981) –
Net cash used in investing activities (140,631) (146,227)
Cash flows from financing activities
Proceeds from borrowings 31,752 152,082Repayments of borrowings (61,055) (36,110)Finance costs paid (13,754) (15,027)Payment of listing expenses – (1,282)Dividends paid to equity holders of the Company (21,654) –
Net cash (used in)/generated from financing activities (64,711) 99,663
Net (decrease)/increase in cash and cash equivalents (129,163) 7,114
Cash and cash equivalents at January 1 314,120 64,080Exchange gains/(losses) on cash and cash equivalents 560 (457)
Cash and cash equivalents at June 30 185,517 70,737
The notes on pages 29 to 54 are an integral part of this interim condensed consolidated financial information.
29I N T E R I M R E P O R T 2 0 1 4
NOTES TO THE CONDENSED CONSOLIDATED INTERIM FINANCIAL INFORMATIONFor the six months ended June 30, 2014
1 GENERAL INFORMATION
Nexteer Automotive Group Limited (the Company) was incorporated in the Cayman Islands on August 21, 2012 as an exempted company with limited liability under Companies Law, Cap. 22 (Law 3 of 1961, as consolidated and revised) of the Cayman Islands. The address of the Company’s registered office is P.O. Box 309, Ugland House, Grand Cayman, KY1-1104, Cayman Islands.
The Company is an investment holding company. The Company, together with its subsidiaries (collectively referred to as the Group), are principally engaged in the design and manufacture of steering and driveline systems and components for automobile manufacturers and other automotive-related companies. The Group’s primary operations are in the United States of America (USA or US), Mexico, Poland and the People’s Republic of China (China) and it is structured to supply its customers globally. The principal markets for the Group’s products are North America, Europe and China.
The Company’s directors regard Aviation Industry Corporation of China (AVIC), a company established in China, as being the ultimate holding company of the Company.
The Company’s shares have been listed on the Main Board of The Stock Exchange of Hong Kong Limited since October 7, 2013 (the Listing).
This condensed consolidated interim financial information (Condensed Financial Information) is presented in thousands of US dollars (US$’000), unless otherwise stated. This Condensed Financial Information was approved for issue by the Board of Directors on August 28, 2014.
This Condensed Financial Information has not been audited.
2 BASIS OF PREPARATION
This Condensed Financial Information has been prepared in accordance with International Accounting Standard (IAS) 34 “Interim Financial Reporting”. This Condensed Financial Information should be read in conjunction with the annual financial statements for the year ended December 31, 2013, which have been prepared in accordance with International Financial Reporting Standards (IFRS).
3 ACCOUNTING POLICIES
In addition to those described below, the accounting policies applied are consistent with those of the annual financial statements for the year ended December 31, 2013, as described in those annual financial statements.
(a) Derivative financial instruments and hedging activitiesDerivatives are initially recognised at fair value on the date a derivative contract is entered into and are subsequently re-measured at their fair value. The method of recognising the resulting gain or loss depends on whether the derivative is designated as a hedging instrument, and if so, the nature of the item being hedged. All of the Group’s hedging instruments are designated as hedges of a particular risk associated with a recognised asset or liability or a highly probable forecast transaction (cash flow hedge).
30 N E X T E E R A U T O M O T I V E G R O U P L I M I T E D
Notes to the Condensed Consolidated Interim Financial InformationFor the six months ended June 30, 2014
3 ACCOUNTING POLICIES (Continued)
(a) Derivative financial instruments and hedging activities (Continued)The Group documents at the inception of the transaction the relationship between hedging instruments and hedged items, as well as its risk management objectives and strategy for undertaking various hedging transactions. The Group also documents its assessment, both at hedge inception and on an ongoing basis, of whether the derivatives that are used in hedging transactions are highly effective in offsetting changes in cash flows of hedged items.
The fair values of various derivative instruments used for hedging purposes are disclosed in Note 8. Movements on the hedging reserve in shareholder’s equity are shown in the interim condensed consolidated statement of changes in equity. The full fair value of a hedging derivative is classified as a non-current asset or liability when the remaining hedged item is more than 12 months, and as a current asset or liability when the remaining maturity of the hedged item is less than 12 months.
Cash flow hedgeThe effective portion of changes in the fair value of derivatives that are designated and qualified as cash flow hedges are recognised in other comprehensive income. The gain or loss relating to the ineffective portion is recognised immediately in the income statement within ‘other losses, net’.
Amounts accumulated in equity are reclassified to profit or loss in the period when the hedged item affects profit or loss. The gain or loss relating to the effective portion of interest rate swaps hedging variable rate borrowings is recognised in the income statement within ‘finance costs’.
When a hedging instrument expires or is sold, or when a hedge no longer meets the criteria for hedge accounting, any cumulative unrecognised gain or loss existing in equity at that time remains in equity and is recognised when the forecast transaction is ultimately recognised in the income statement. When a forecast transaction is no longer expected to occur, the cumulative gain or loss that was reported in equity is immediately transferred to the income statement within ‘other losses, net’.
(b) Share-based paymentsThe Group established a new equity-settled, share-based compensation plan in June 2014, under which the Group receives services from certain employees as consideration for equity instruments (options) of the Group. The fair value of the employee services received in exchange for the grant of the options is recognised as an expense. The total amount to be expensed is determined by reference to the fair value of the options granted:
• excluding the impact of any service and non-market performance vesting conditions (for example, profitability, sales growth targets and retaining an employee of the entity over a specified time period); and
• including the impact of any non-vesting conditions.

31I N T E R I M R E P O R T 2 0 1 4
Notes to the Condensed Consolidated Interim Financial InformationFor the six months ended June 30, 2014
3 ACCOUNTING POLICIES (Continued)
(b) Share-based payments (Continued)Non-market performance and service conditions are included in assumptions about the number of options that are expected to vest. The total expense is recognised over the vesting period, which is the period over which all of the specified vesting conditions are to be satisfied.
At the end of each reporting period, the Group revises its estimates of the number of options that are expected to vest based on the non-marketing performance and service conditions. It recognises the impact of the revision to original estimates, if any, in the income statement, with a corresponding adjustment to equity.
When the options are exercised, the Group issues new shares. The proceeds received net of any directly attributable transaction costs are credited to share capital (nominal value) and share premium.
(c) Joint arrangementsJoint arrangements are classified as either joint operations or joint ventures, depending on the contractual rights and obligations of each investor. The Group has assessed the nature of its joint arrangements and determined them to be joint ventures. Joint ventures are accounted for using the equity method of accounting.
Under the equity method of accounting, interests in joint ventures are initially recognised at cost and adjusted thereafter to recognise the Group’s share of the post-acquisitions profits or losses and movements in other comprehensive income. When the Group’s share of losses in a joint venture equals or exceeds its interests in the joint ventures, the Group does not recognise further losses, unless it has incurred obligations or made payments on behalf of the joint ventures. Any distributions the Group receives from the joint ventures reduce the carrying amount of the investment.
Unrealised gains on transactions between the Group and its joint ventures are eliminated to the extent of the Group’s interests in the joint ventures. Unrealised losses are also eliminated unless the transaction provides evidence of an impairment of the asset transferred. Accounting policies of the joint ventures have been aligned where necessary to ensure consistency with the policies adopted by the Group.
32 N E X T E E R A U T O M O T I V E G R O U P L I M I T E D
Notes to the Condensed Consolidated Interim Financial InformationFor the six months ended June 30, 2014
3 ACCOUNTING POLICIES (Continued)
(d) New/revised standards, amendments to standards and interpretationsThe following amendments to standards and interpretations are mandatory for the first time for the financial year beginning January 1, 2014:
IAS 27 (Amendment) Investment entitiesIAS 32 (Amendment) Financial instruments: Presentation on asset and liability offsettingIAS 36 (Amendment) Impairment of assetsIAS 39 (Amendment) Novation of derivativesIFRIC 21 Levies
The adoption of the above does not have any significant impact to the results and financial position of the Group for the six months ended June 30, 2014.
The following new standards and amendments to standards have been issued but are not yet effective for the financial year beginning January 1, 2014 and have not been early adopted:
Effective for accounting
periods beginning on or after
IAS 19 (Amendment) Employee benefits July 1, 2014IAS 16 and IAS 38
(Amendments)Clarification of acceptable methods of
depreciation and amortisationJanuary 1, 2016
IFRS 11 (Amendment) Accounting for acquisitions of interests in joint operation
January 1, 2016
IFRS 14 Regulatory deferral accounts January 1, 2016IFRS 15 Revenue from contracts with customers January 1, 2017IFRS 9 Financial instruments January 1, 2018
Management is in the process of assessing their related impacts to the Group.
4 ESTIMATES
The preparation of Condensed Financial Information requires management to make judgements, estimates and assumptions that affect the application of accounting policies and the reported amounts of assets and liabilities, income and expense. Actual results may differ from these estimates.
In preparing this Condensed Financial Information, the significant judgements made by management in applying the Group’s accounting policies and the key sources of estimation uncertainty were the same as those that applied to the consolidated financial statements for the year ended December 31, 2013.

33I N T E R I M R E P O R T 2 0 1 4
Notes to the Condensed Consolidated Interim Financial InformationFor the six months ended June 30, 2014
5 FINANCIAL RISK MANAGEMENT AND FINANCIAL INSTRUMENTS
5.1 Financial risk factorsThe Group’s activities expose it to a variety of financial risks: market risk (including foreign exchange risk, cash flow interest rate risk and price risk), credit risk and liquidity risk.
This Condensed Financial Information does not include all financial risk management information and disclosures required in the annual financial statements, and should be read in conjunction with the Group’s annual financial statements as at December 31, 2013.
(a) Market risk(i) Cash flow interest rate risk
The Group’s interest rate risk primarily arises from current and non-current borrowings. Changes in interest rates on borrowings issued at variable rates potentially expose the Group to cash flow interest rate risk. The Group manages certain of its cash flow interest rate risk by using a floating-to-fixed interest rate swap. In 2014 the Group entered into an interest rate swap for one of its floating rate non-current borrowings which was designated as a cash flow hedge (Note 8).
As at June 30, 2014, if the interest rates had been 100 basis points higher/(lower) than the prevailing rate, with all other variables held constant, net profit for the six months ended June 30, 2014 would have been US$2,817,000 (June 30, 2013: US$3,148,000) lower/(higher).
There have been no other changes in risk management policies since December 31, 2013.
5.2 Fair value estimationThe carrying amounts of the Group’s current financial assets and liabilities, including cash and cash equivalents, restricted bank deposits, trade and other receivables, trade and other payables and current borrowings approximate their fair values. The fair value of financial liabilities for disclosure purposes is estimated by discounting the future contractual cash flows at the current market interest rate available to the Group for similar financial instruments.
34 N E X T E E R A U T O M O T I V E G R O U P L I M I T E D
Notes to the Condensed Consolidated Interim Financial InformationFor the six months ended June 30, 2014
5 FINANCIAL RISK MANAGEMENT AND FINANCIAL INSTRUMENTS (Continued)
5.2 Fair value estimation (Continued)The table below analyses financial instruments carried at fair value, by valuation method. The different levels have been defined as follows:
• Quoted prices (unadjusted) in active markets for identical assets or liabilities (level 1)
• Inputs other than quoted prices included within level 1 that are observable for the asset or liability, either directly (that is, as prices) or indirectly (that is, derived from prices) (level 2)
• Inputs for the asset or liability that are not based on observable market data (that is, unobservable inputs) (level 3)
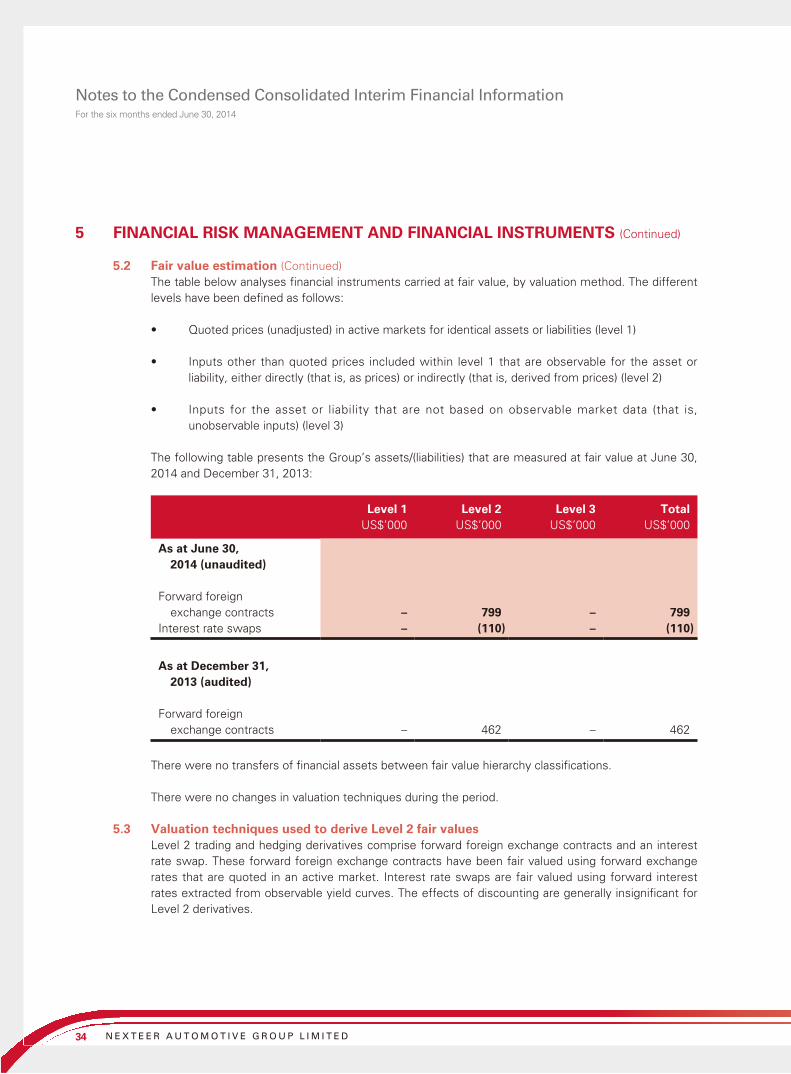
The following table presents the Group’s assets/(liabilities) that are measured at fair value at June 30, 2014 and December 31, 2013:
Level 1 Level 2 Level 3 TotalUS$’000 US$’000 US$’000 US$’000
As at June 30, 2014 (unaudited)
Forward foreign exchange contracts – 799 – 799
Interest rate swaps – (110) – (110)
As at December 31, 2013 (audited)
Forward foreign exchange contracts – 462 – 462
There were no transfers of financial assets between fair value hierarchy classifications.
There were no changes in valuation techniques during the period.
5.3 Valuation techniques used to derive Level 2 fair valuesLevel 2 trading and hedging derivatives comprise forward foreign exchange contracts and an interest rate swap. These forward foreign exchange contracts have been fair valued using forward exchange rates that are quoted in an active market. Interest rate swaps are fair valued using forward interest rates extracted from observable yield curves. The effects of discounting are generally insignificant for Level 2 derivatives.

35I N T E R I M R E P O R T 2 0 1 4
Notes to the Condensed Consolidated Interim Financial InformationFor the six months ended June 30, 2014
6 SEGMENT INFORMATION
The Group’s segment information is presented on the basis of internal reports that are regularly reviewed by the Group’s Chief Executive Officer (CEO), in order to allocate resources to the segments and assess their performance. For each of the Group’s reportable segments, the Group’s CEO reviews internal management reports on a quarterly basis, at a minimum.
The Group classifies its businesses into four reportable segments: North America, Europe, China and Rest of World. All of the Group’s operating segments typically offer the same driveline and steering products. The “Others” category represents parent company activities of the Company and its directly held subsidiaries PCM (US) Steering Holding Inc. and PCM (Singapore) Steering Holding Pte. Limited.
The key performance indicators that the Group monitors to run segment operations are:
• EBITDA, which represents operating income before interest, taxes and depreciation and amortisation; and
• Net working capital (NWC) represents inventory and trade receivables net of trade payables. This measures the Group’s net investment in operating assets for each segment. NWC does not include trade payables and receivables between operating segments.
Information about reportable segments and reconciliations of reportable segment revenues is as follows:
North America Europe China
Rest of World Others Total
US$’000 US$’000 US$’000 US$’000 US$’000 US$’000
For the six months ended June 30, 2014 (unaudited)
Total revenue 1,023,073 201,371 187,722 63,919 – 1,476,085Inter-segment revenue (20,717) (10,014) (3,849) (7,133) – (41,713)
Revenue from external customers 1,002,356 191,357 183,873 56,786 – 1,434,372
EBITDA 118,614 25,830 30,031 (7,280) 3,873 171,068NWC 189,911 40,309 77,307 23,283 (2,693) 328,117 For the six months
ended June 30, 2013 (audited)
Total revenue 829,527 177,332 128,459 73,414 – 1,208,732Inter-segment revenue (18,183) (14,334) (4,758) (6,642) – (43,917)
Revenue from external customers 811,344 162,998 123,701 66,772 – 1,164,815
EBITDA 72,379 23,051 20,106 (3,638) 2,303 114,201NWC 216,344 26,003 37,391 (5,432) (4,366) 269,940
Revenue between segments are carried out at arm’s length. The revenue from external parties reported to the Group’s CEO is measured in a manner consistent with that in the income statement.
36 N E X T E E R A U T O M O T I V E G R O U P L I M I T E D
Notes to the Condensed Consolidated Interim Financial InformationFor the six months ended June 30, 2014
6 SEGMENT INFORMATION (Continued)
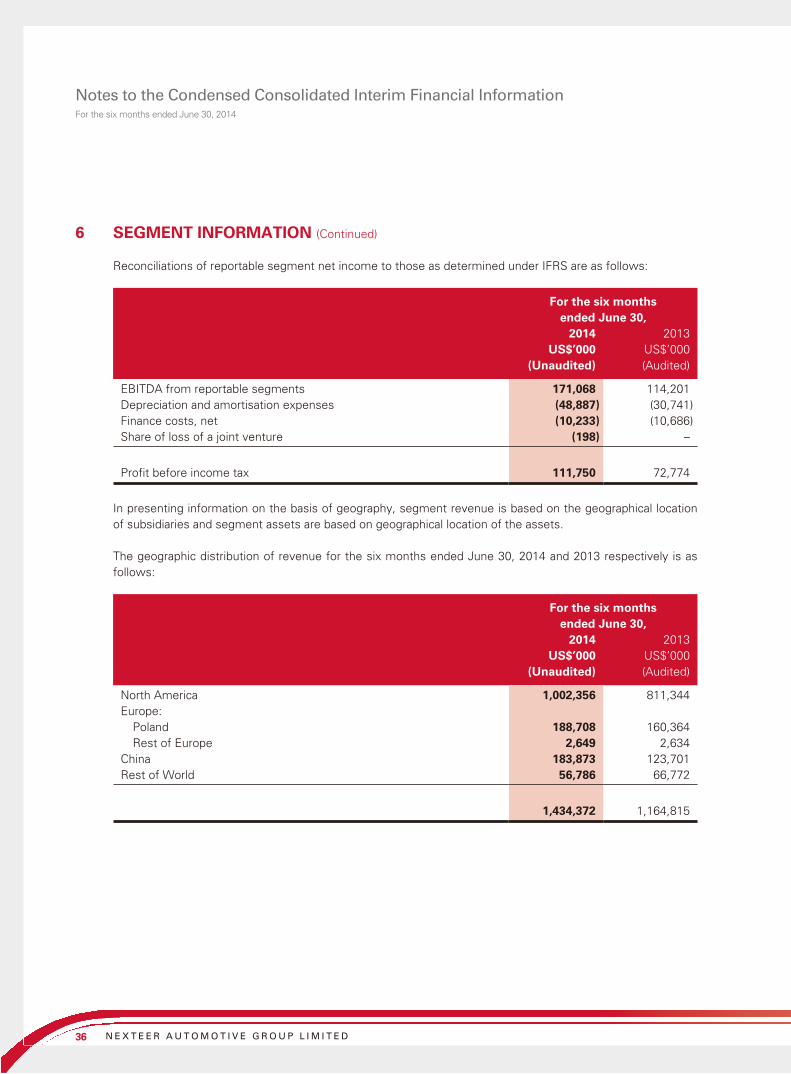
Reconciliations of reportable segment net income to those as determined under IFRS are as follows:
For the six months ended June 30,
2014 2013US$’000 US$’000
(Unaudited) (Audited)
EBITDA from reportable segments 171,068 114,201Depreciation and amortisation expenses (48,887) (30,741)Finance costs, net (10,233) (10,686)Share of loss of a joint venture (198) –
Profit before income tax 111,750 72,774
In presenting information on the basis of geography, segment revenue is based on the geographical location of subsidiaries and segment assets are based on geographical location of the assets.
The geographic distribution of revenue for the six months ended June 30, 2014 and 2013 respectively is as follows:
For the six months ended June 30,
2014 2013US$’000 US$’000
(Unaudited) (Audited)
North America 1,002,356 811,344Europe:
Poland 188,708 160,364Rest of Europe 2,649 2,634
China 183,873 123,701Rest of World 56,786 66,772
1,434,372 1,164,815

37I N T E R I M R E P O R T 2 0 1 4
Notes to the Condensed Consolidated Interim Financial InformationFor the six months ended June 30, 2014
6 SEGMENT INFORMATION (Continued)
The geographic distribution of non-current assets excluding deferred income tax assets as at June 30, 2014 and December 31, 2013 respectively is as follows:
June 30, December 31,2014 2013
US$’000 US$’000(Unaudited) (Audited)
North America 657,782 603,319Europe:
Poland 96,405 100,181Rest of Europe 2,756 2,874
China 131,898 118,665Rest of World 18,158 17,612
906,999 842,651
Distribution of revenue between product lines for the six months ended June 30, 2014 and 2013 respectively is as follows:
For the six months ended June 30,
2014 2013US$’000 US$’000
(Unaudited) (Audited)
Steering 1,170,180 936,774Driveline 264,192 228,041
1,434,372 1,164,815
Revenues from customers amounting to 10 percent or more of the Group’s revenue are as follows and reported in all segments:
For the six months ended June 30,
2014 2013US$’000 US$’000
(Unaudited) (Audited)
General Motors Group and its affiliates 801,139 619,076Customer A 235,300 190,999Customer B 148,200 129,576
1,184,639 939,651

38 N E X T E E R A U T O M O T I V E G R O U P L I M I T E D
Notes to the Condensed Consolidated Interim Financial InformationFor the six months ended June 30, 2014
7 PROPERTY, PLANT AND EQUIPMENT, LAND USE RIGHTS AND INTANGIBLE ASSETS
Property, plant and
equipment Land use
rightsIntangible
assetsUS$’000 US$’000 US$’000
Six months ended June 30, 2014 (unaudited)
Net book amount at January 1, 2014 562,540 732 271,358Additions 63,933 – 55,529Disposals (2,075) – –Depreciation and amortisation (33,923) (13) (14,951)Exchange differences (5,018) (19) (168)
Net book amount at June 30, 2014 585,457 700 311,768
Six months ended June 30, 2013 (audited)
Net book amount at January 1, 2013 434,103 737 179,082Additions 84,980 – 54,453Disposals (7,766) – –Depreciation and amortisation (25,604) (13) (5,124)Exchange differences (5,039) 4 –
Net book amount at June 30, 2013 480,674 728 228,411
Certain of the Group’s property, plant and equipment have been pledged as collateral under the Group’s borrowing arrangements. The carrying amounts of property, plant and equipment pledged as collateral were US$398,746,000 as at June 30, 2014 (December 31, 2013: US$366,396,000).

39I N T E R I M R E P O R T 2 0 1 4
Notes to the Condensed Consolidated Interim Financial InformationFor the six months ended June 30, 2014
8 DERIVATIVE FINANCIAL INSTRUMENTS
June 30, 2014 December 31, 2013Assets Liabilities Assets Liabilities
US$’000 US$’000 US$’000 US$’000(Unaudited) (Unaudited) (Audited) (Audited)
Forward foreign exchange contracts 799 – 462 –Interest rate swaps – 110 – –
799 110 462 –Less: non-current portion – (110) – –
Current portion 799 – 462 –
The notional principal amounts of the outstanding forward foreign exchange contracts as at June 30, 2014 were US$19,800,000 (December 31, 2013: US$26,400,000).
The notional principal amounts of the outstanding interest rate swap contracts as at June 30, 2014 were US$57,861,000 (December 31, 2013: Nil).
9 TRADE RECEIVABLES
June 30, December 31,2014 2013
US$’000 US$’000(Unaudited) (Audited)
Trade receivables, gross 535,763 366,836Less: provision for impairment (3,079) (2,904)
532,684 363,932

40 N E X T E E R A U T O M O T I V E G R O U P L I M I T E D
Notes to the Condensed Consolidated Interim Financial InformationFor the six months ended June 30, 2014
9 TRADE RECEIVABLES (Continued)
Credit terms range primarily from 30-90 days after the invoice date depending on the customer and the geographical region. Ageing analysis of trade receivables based on credit terms is as follows:
June 30, 2014
December 31, 2013
US$’000 US$’000(Unaudited) (Audited)
Not overdue 515,598 344,212Overdue up to 30 days 14,644 11,606Overdue 30 to 60 days 577 6,267Overdue 60 to 90 days 451 1,608Overdue over 90 days 4,493 3,143
535,763 366,836
The carrying amounts of trade receivables pledged as collateral were US$299,039,000 as at June 30, 2014 (December 31, 2013: US$302,791,000).
10 OTHER RECEIVABLES AND PREPAYMENTS
June 30, 2014
December 31, 2013
US$’000 US$’000(Unaudited) (Audited)
Amounts reimbursable from customers on tools 35,753 28,912Other taxes recoverable (1) 22,166 26,102Prepaid assets 13,375 15,554Deposits to vendors 4,888 3,672Reimbursable engineering expenses 3,725 3,470Others 504 1,876
80,411 79,586Less: non-current portion (7,341) (8,021)
Current portion 73,070 71,565
(1) Balance mainly represents value-added tax recoverable and certain incentives granted to the Group for investing capital and
maintaining jobs in the State of Michigan, USA.
41I N T E R I M R E P O R T 2 0 1 4
Notes to the Condensed Consolidated Interim Financial InformationFor the six months ended June 30, 2014
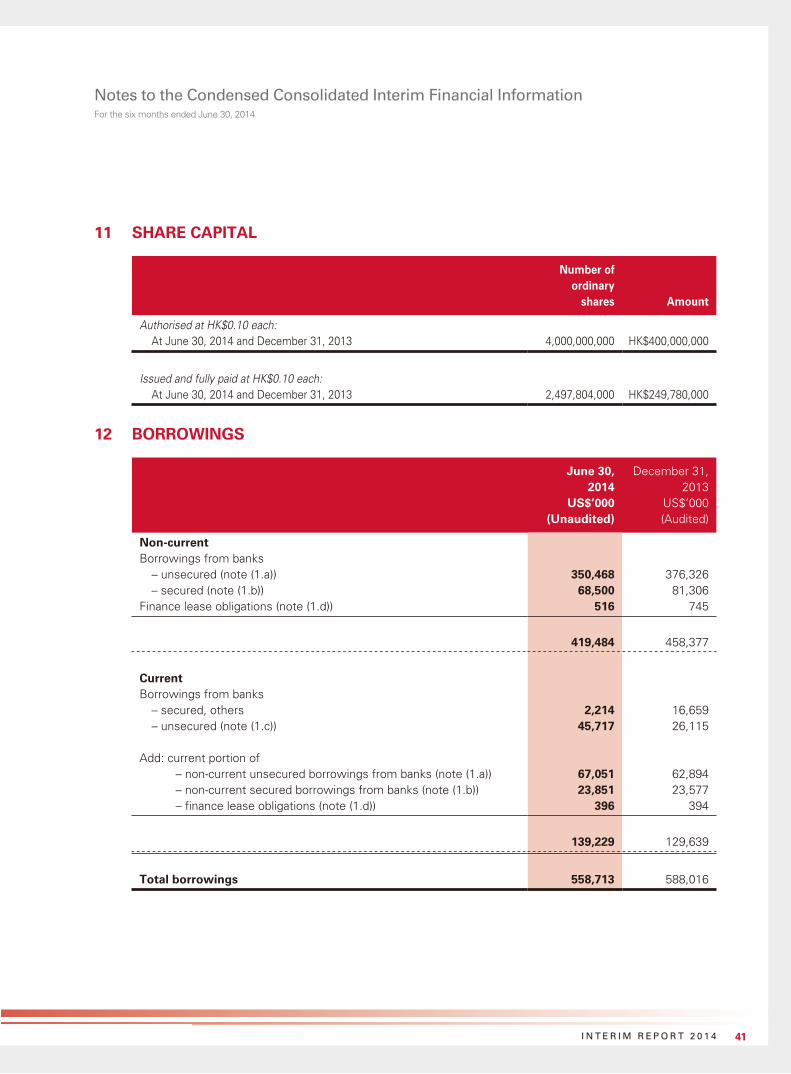
11 SHARE CAPITAL
Number of ordinary
shares Amount
Authorised at HK$0.10 each:At June 30, 2014 and December 31, 2013 4,000,000,000 HK$400,000,000
Issued and fully paid at HK$0.10 each:At June 30, 2014 and December 31, 2013 2,497,804,000 HK$249,780,000
12 BORROWINGS
June 30, 2014
December 31, 2013
US$’000 US$’000(Unaudited) (Audited)
Non-currentBorrowings from banks
– unsecured (note (1.a)) 350,468 376,326– secured (note (1.b)) 68,500 81,306
Finance lease obligations (note (1.d)) 516 745
419,484 458,377
CurrentBorrowings from banks
– secured, others 2,214 16,659– unsecured (note (1.c)) 45,717 26,115
Add: current portion of– non-current unsecured borrowings from banks (note (1.a)) 67,051 62,894– non-current secured borrowings from banks (note (1.b)) 23,851 23,577– finance lease obligations (note (1.d)) 396 394
139,229 129,639
Total borrowings 558,713 588,016
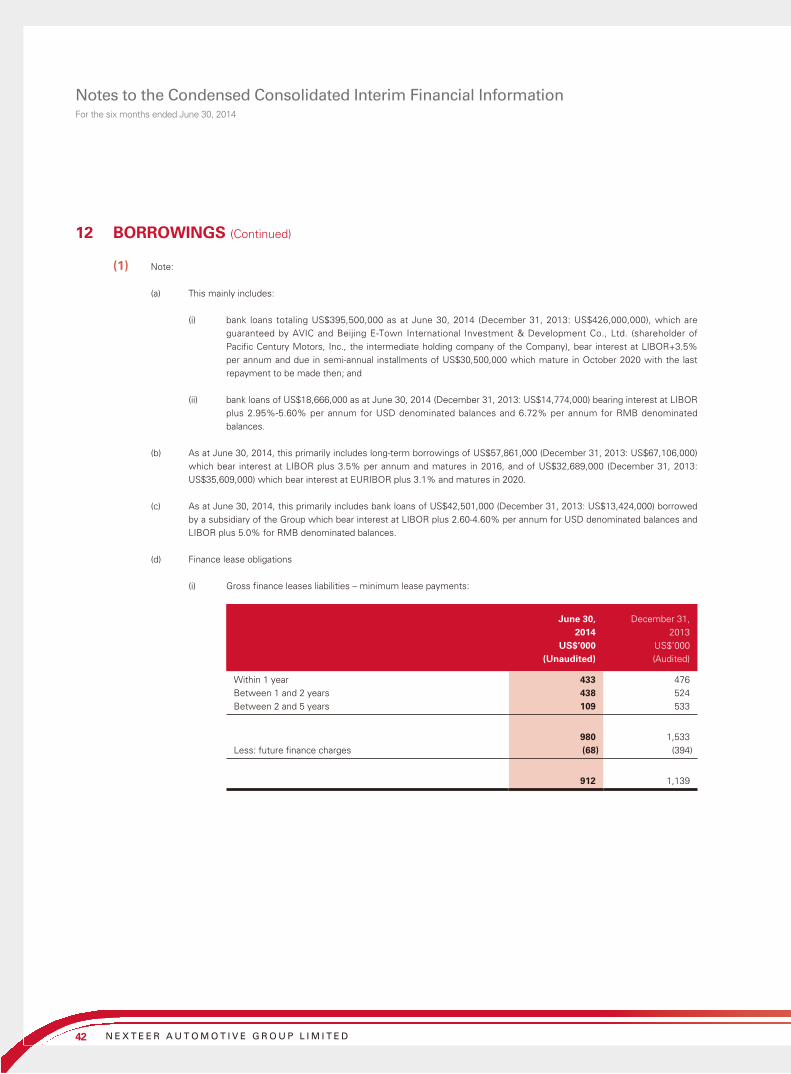
42 N E X T E E R A U T O M O T I V E G R O U P L I M I T E D
Notes to the Condensed Consolidated Interim Financial InformationFor the six months ended June 30, 2014
12 BORROWINGS (Continued)
(1) Note:
(a) This mainly includes:
(i) bank loans totaling US$395,500,000 as at June 30, 2014 (December 31, 2013: US$426,000,000), which are
guaranteed by AVIC and Beijing E-Town International Investment & Development Co., Ltd. (shareholder of
Pacific Century Motors, Inc., the intermediate holding company of the Company), bear interest at LIBOR+3.5%
per annum and due in semi-annual installments of US$30,500,000 which mature in October 2020 with the last
repayment to be made then; and
(ii) bank loans of US$18,666,000 as at June 30, 2014 (December 31, 2013: US$14,774,000) bearing interest at LIBOR
plus 2.95%-5.60% per annum for USD denominated balances and 6.72% per annum for RMB denominated
balances.
(b) As at June 30, 2014, this primarily includes long-term borrowings of US$57,861,000 (December 31, 2013: US$67,106,000)
which bear interest at LIBOR plus 3.5% per annum and matures in 2016, and of US$32,689,000 (December 31, 2013:
US$35,609,000) which bear interest at EURIBOR plus 3.1% and matures in 2020.
(c) As at June 30, 2014, this primarily includes bank loans of US$42,501,000 (December 31, 2013: US$13,424,000) borrowed
by a subsidiary of the Group which bear interest at LIBOR plus 2.60-4.60% per annum for USD denominated balances and
LIBOR plus 5.0% for RMB denominated balances.
(d) Finance lease obligations
(i) Gross finance leases liabilities – minimum lease payments:
June 30, 2014
December 31,
2013
US$’000 US$’000
(Unaudited) (Audited)
Within 1 year 433 476
Between 1 and 2 years 438 524
Between 2 and 5 years 109 533
980 1,533
Less: future finance charges (68) (394)
912 1,139
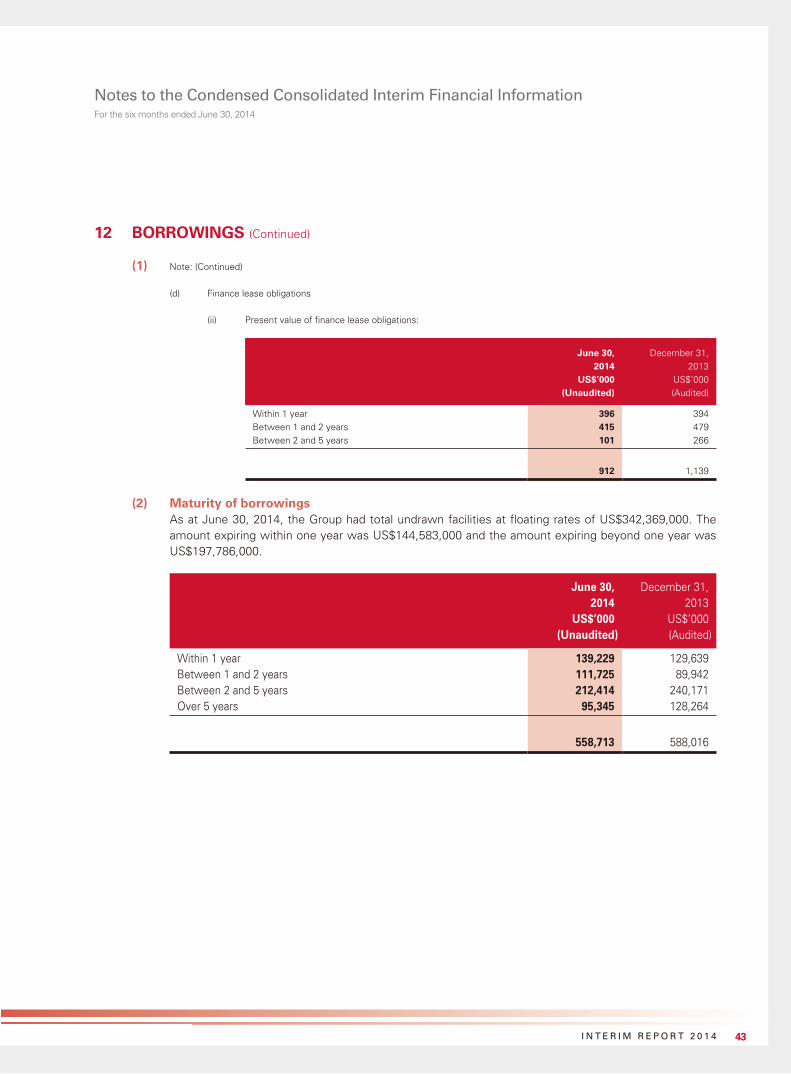
43I N T E R I M R E P O R T 2 0 1 4
Notes to the Condensed Consolidated Interim Financial InformationFor the six months ended June 30, 2014
12 BORROWINGS (Continued)
(1) Note: (Continued)
(d) Finance lease obligations
(ii) Present value of finance lease obligations:
June 30, 2014
December 31,
2013
US$’000 US$’000
(Unaudited) (Audited)
Within 1 year 396 394
Between 1 and 2 years 415 479
Between 2 and 5 years 101 266
912 1,139
(2) Maturity of borrowingsAs at June 30, 2014, the Group had total undrawn facilities at floating rates of US$342,369,000. The amount expiring within one year was US$144,583,000 and the amount expiring beyond one year was US$197,786,000.
June 30, 2014
December 31, 2013
US$’000 US$’000(Unaudited) (Audited)
Within 1 year 139,229 129,639Between 1 and 2 years 111,725 89,942Between 2 and 5 years 212,414 240,171Over 5 years 95,345 128,264
558,713 588,016
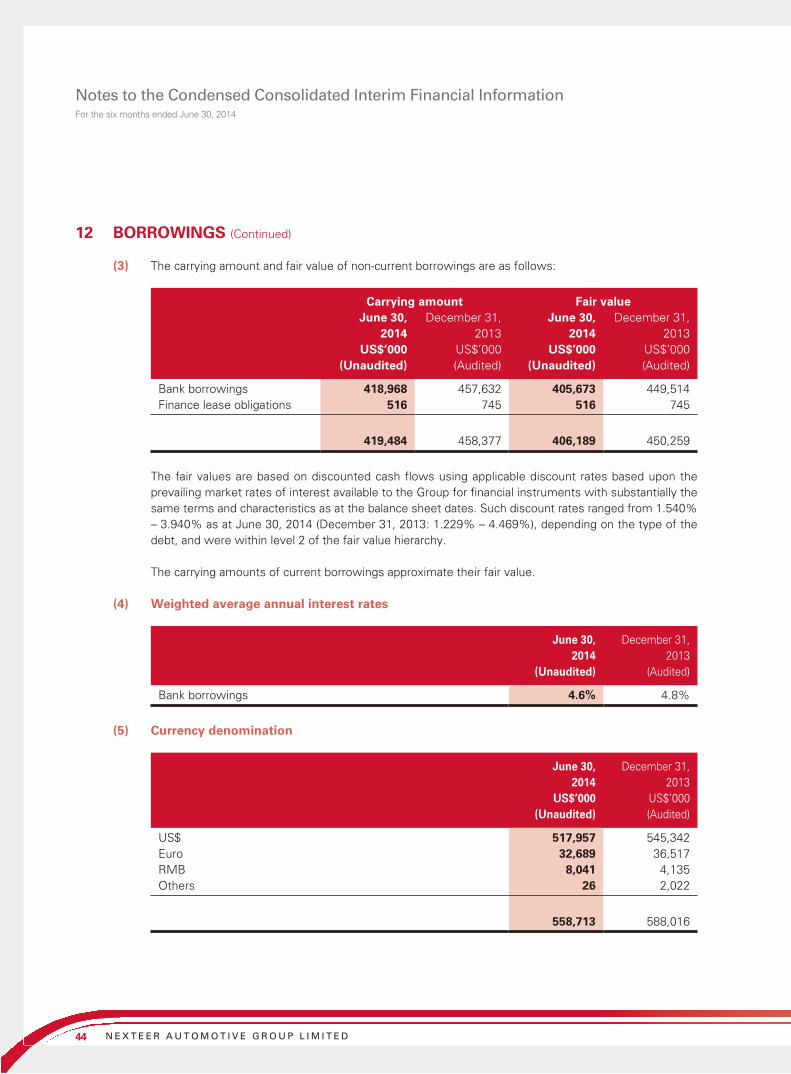
44 N E X T E E R A U T O M O T I V E G R O U P L I M I T E D
Notes to the Condensed Consolidated Interim Financial InformationFor the six months ended June 30, 2014
12 BORROWINGS (Continued)
(3) The carrying amount and fair value of non-current borrowings are as follows:
Carrying amount Fair valueJune 30,
2014December 31,
2013June 30,
2014December 31,
2013US$’000 US$’000 US$’000 US$’000
(Unaudited) (Audited) (Unaudited) (Audited)
Bank borrowings 418,968 457,632 405,673 449,514Finance lease obligations 516 745 516 745
419,484 458,377 406,189 450,259
The fair values are based on discounted cash flows using applicable discount rates based upon the prevailing market rates of interest available to the Group for financial instruments with substantially the same terms and characteristics as at the balance sheet dates. Such discount rates ranged from 1.540% – 3.940% as at June 30, 2014 (December 31, 2013: 1.229% – 4.469%), depending on the type of the debt, and were within level 2 of the fair value hierarchy.
The carrying amounts of current borrowings approximate their fair value.
(4) Weighted average annual interest rates
June 30, 2014
December 31, 2013
(Unaudited) (Audited)
Bank borrowings 4.6% 4.8%
(5) Currency denomination
June 30, 2014
December 31, 2013
US$’000 US$’000(Unaudited) (Audited)
US$ 517,957 545,342Euro 32,689 36,517RMB 8,041 4,135Others 26 2,022
558,713 588,016
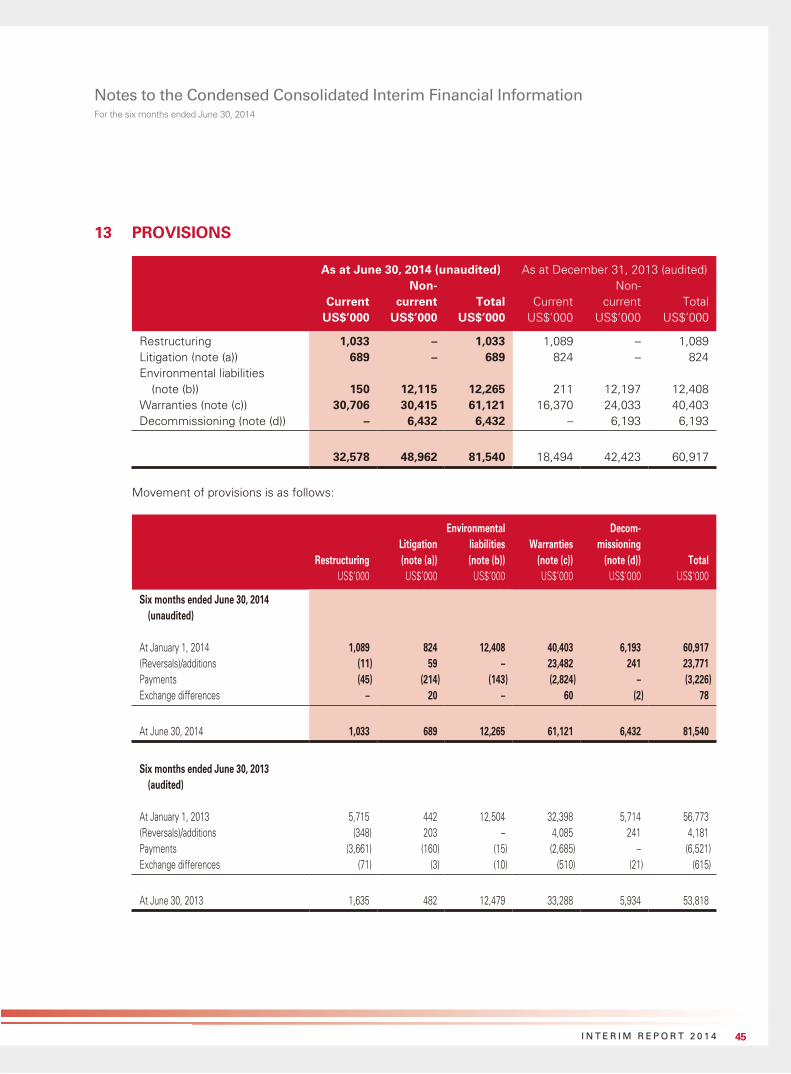
45I N T E R I M R E P O R T 2 0 1 4
Notes to the Condensed Consolidated Interim Financial InformationFor the six months ended June 30, 2014
13 PROVISIONS
As at June 30, 2014 (unaudited) As at December 31, 2013 (audited)
CurrentNon-
current Total CurrentNon-
current TotalUS$’000 US$’000 US$’000 US$’000 US$’000 US$’000
Restructuring 1,033 – 1,033 1,089 – 1,089Litigation (note (a)) 689 – 689 824 – 824Environmental liabilities
(note (b)) 150 12,115 12,265 211 12,197 12,408Warranties (note (c)) 30,706 30,415 61,121 16,370 24,033 40,403Decommissioning (note (d)) – 6,432 6,432 – 6,193 6,193
32,578 48,962 81,540 18,494 42,423 60,917
Movement of provisions is as follows:
RestructuringLitigation (note (a))
Environmental liabilities (note (b))
Warranties (note (c))
Decom-missioning
(note (d)) TotalUS$’000 US$’000 US$’000 US$’000 US$’000 US$’000
Six months ended June 30, 2014 (unaudited)
At January 1, 2014 1,089 824 12,408 40,403 6,193 60,917(Reversals)/additions (11) 59 – 23,482 241 23,771Payments (45) (214) (143) (2,824) – (3,226)Exchange differences – 20 – 60 (2) 78
At June 30, 2014 1,033 689 12,265 61,121 6,432 81,540
Six months ended June 30, 2013 (audited)
At January 1, 2013 5,715 442 12,504 32,398 5,714 56,773(Reversals)/additions (348) 203 – 4,085 241 4,181Payments (3,661) (160) (15) (2,685) – (6,521)Exchange differences (71) (3) (10) (510) (21) (615)
At June 30, 2013 1,635 482 12,479 33,288 5,934 53,818
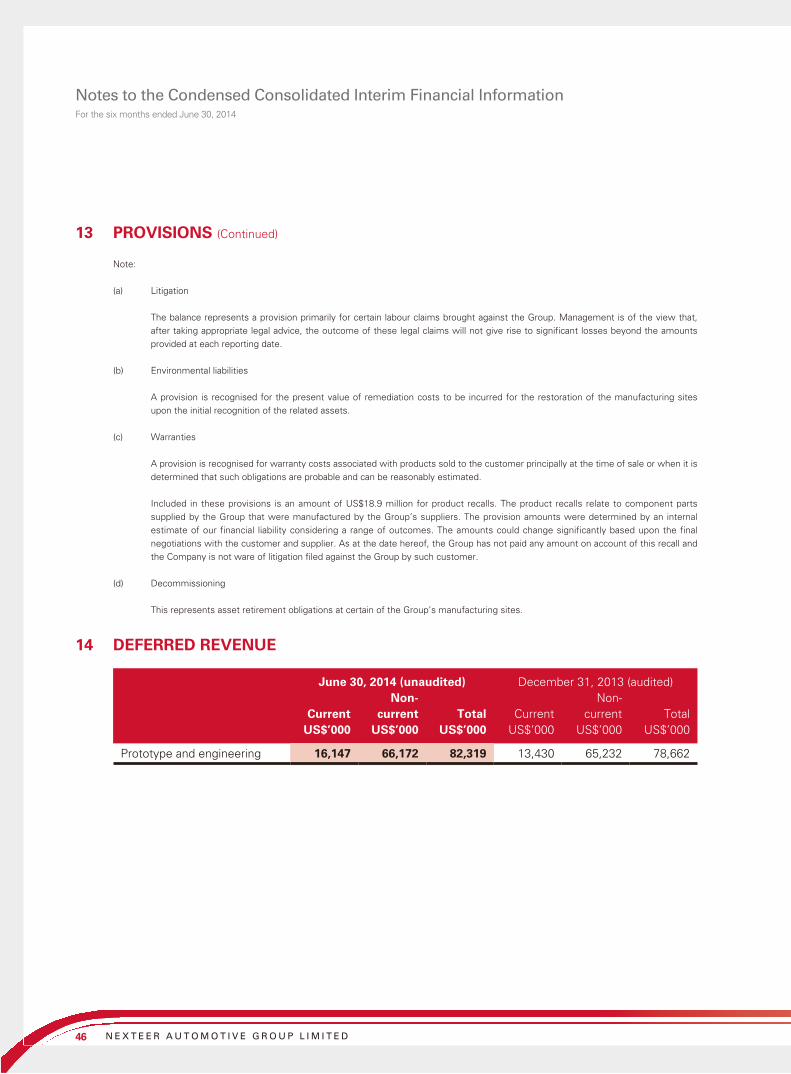
46 N E X T E E R A U T O M O T I V E G R O U P L I M I T E D
Notes to the Condensed Consolidated Interim Financial InformationFor the six months ended June 30, 2014
13 PROVISIONS (Continued)
Note:
(a) Litigation
The balance represents a provision primarily for certain labour claims brought against the Group. Management is of the view that,
after taking appropriate legal advice, the outcome of these legal claims will not give rise to significant losses beyond the amounts
provided at each reporting date.
(b) Environmental liabilities
A provision is recognised for the present value of remediation costs to be incurred for the restoration of the manufacturing sites
upon the initial recognition of the related assets.
(c) Warranties
A provision is recognised for warranty costs associated with products sold to the customer principally at the time of sale or when it is
determined that such obligations are probable and can be reasonably estimated.
Included in these provisions is an amount of US$18.9 million for product recalls. The product recalls relate to component parts
supplied by the Group that were manufactured by the Group’s suppliers. The provision amounts were determined by an internal
estimate of our financial liability considering a range of outcomes. The amounts could change significantly based upon the final
negotiations with the customer and supplier. As at the date hereof, the Group has not paid any amount on account of this recall and
the Company is not ware of litigation filed against the Group by such customer.
(d) Decommissioning
This represents asset retirement obligations at certain of the Group’s manufacturing sites.
14 DEFERRED REVENUE
June 30, 2014 (unaudited) December 31, 2013 (audited)
CurrentNon-
current Total CurrentNon-
current TotalUS$’000 US$’000 US$’000 US$’000 US$’000 US$’000
Prototype and engineering 16,147 66,172 82,319 13,430 65,232 78,662
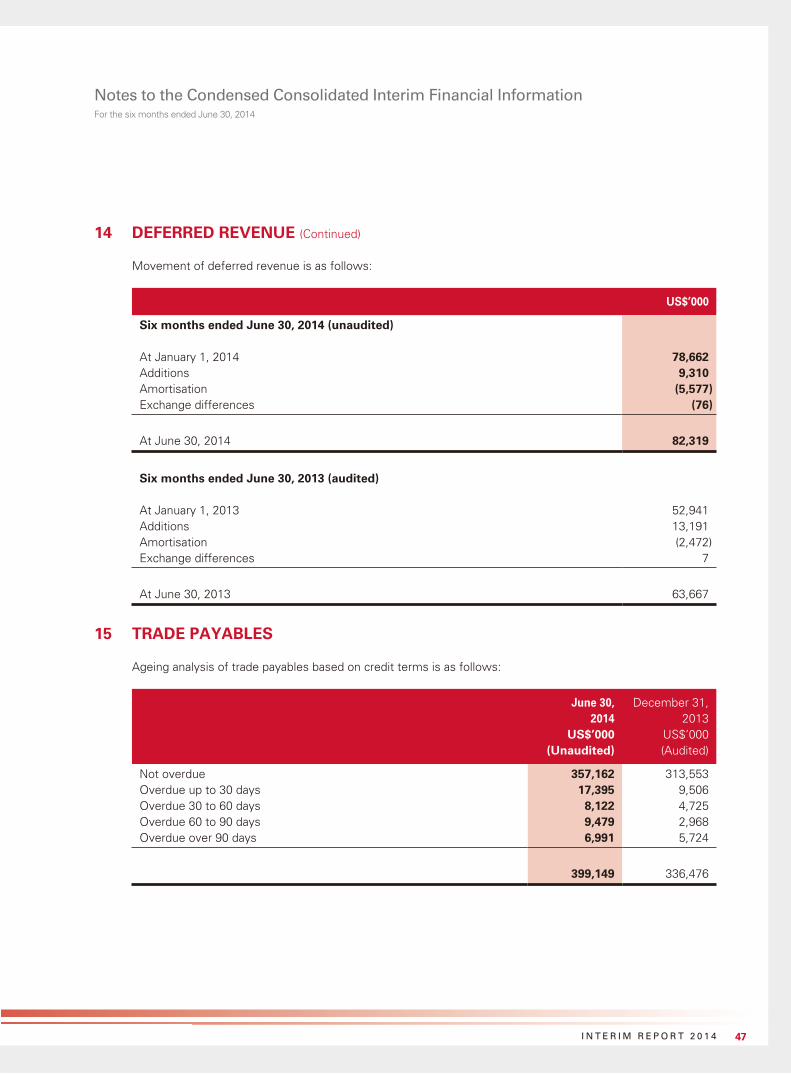
47I N T E R I M R E P O R T 2 0 1 4
Notes to the Condensed Consolidated Interim Financial InformationFor the six months ended June 30, 2014
14 DEFERRED REVENUE (Continued)
Movement of deferred revenue is as follows:
US$’000
Six months ended June 30, 2014 (unaudited)
At January 1, 2014 78,662Additions 9,310Amortisation (5,577)Exchange differences (76)
At June 30, 2014 82,319
Six months ended June 30, 2013 (audited)
At January 1, 2013 52,941Additions 13,191Amortisation (2,472)Exchange differences 7
At June 30, 2013 63,667
15 TRADE PAYABLES
Ageing analysis of trade payables based on credit terms is as follows:
June 30, 2014
December 31, 2013
US$’000 US$’000(Unaudited) (Audited)
Not overdue 357,162 313,553Overdue up to 30 days 17,395 9,506Overdue 30 to 60 days 8,122 4,725Overdue 60 to 90 days 9,479 2,968Overdue over 90 days 6,991 5,724
399,149 336,476
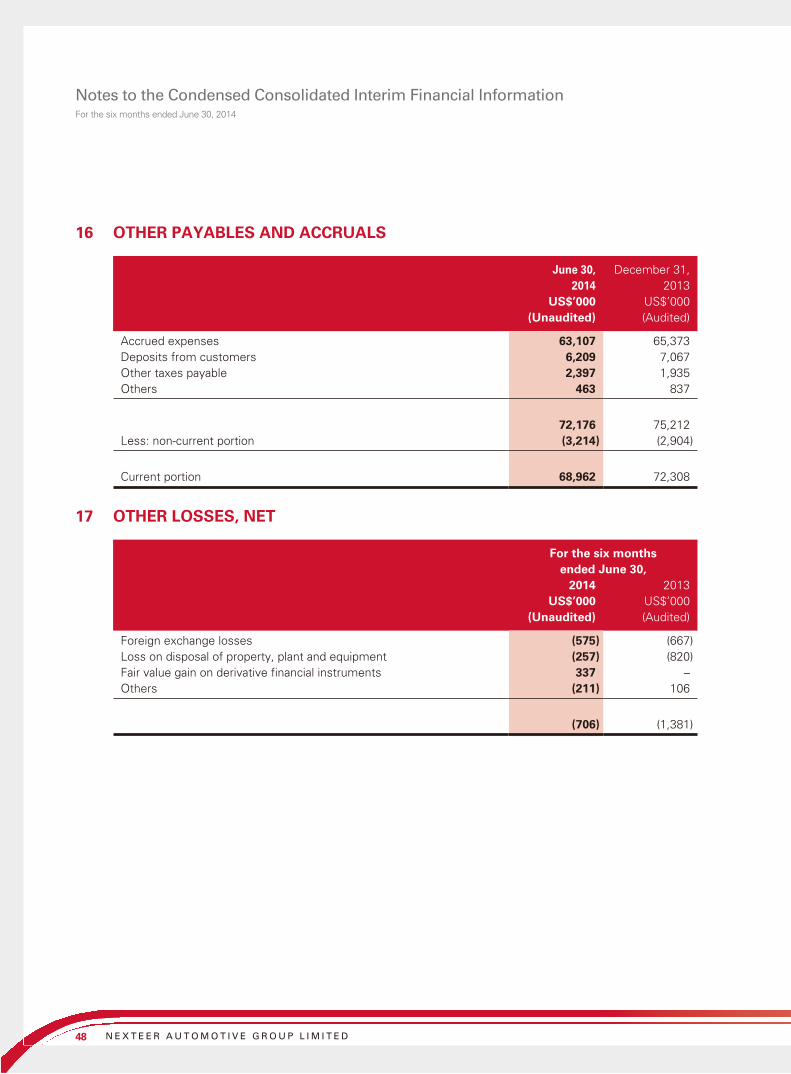
48 N E X T E E R A U T O M O T I V E G R O U P L I M I T E D
Notes to the Condensed Consolidated Interim Financial InformationFor the six months ended June 30, 2014
16 OTHER PAYABLES AND ACCRUALS
June 30, 2014
December 31, 2013
US$’000 US$’000(Unaudited) (Audited)
Accrued expenses 63,107 65,373Deposits from customers 6,209 7,067Other taxes payable 2,397 1,935Others 463 837
72,176 75,212Less: non-current portion (3,214) (2,904)
Current portion 68,962 72,308
17 OTHER LOSSES, NET
For the six months ended June 30,
2014 2013US$’000 US$’000
(Unaudited) (Audited)
Foreign exchange losses (575) (667)Loss on disposal of property, plant and equipment (257) (820)Fair value gain on derivative financial instruments 337 –Others (211) 106
(706) (1,381)
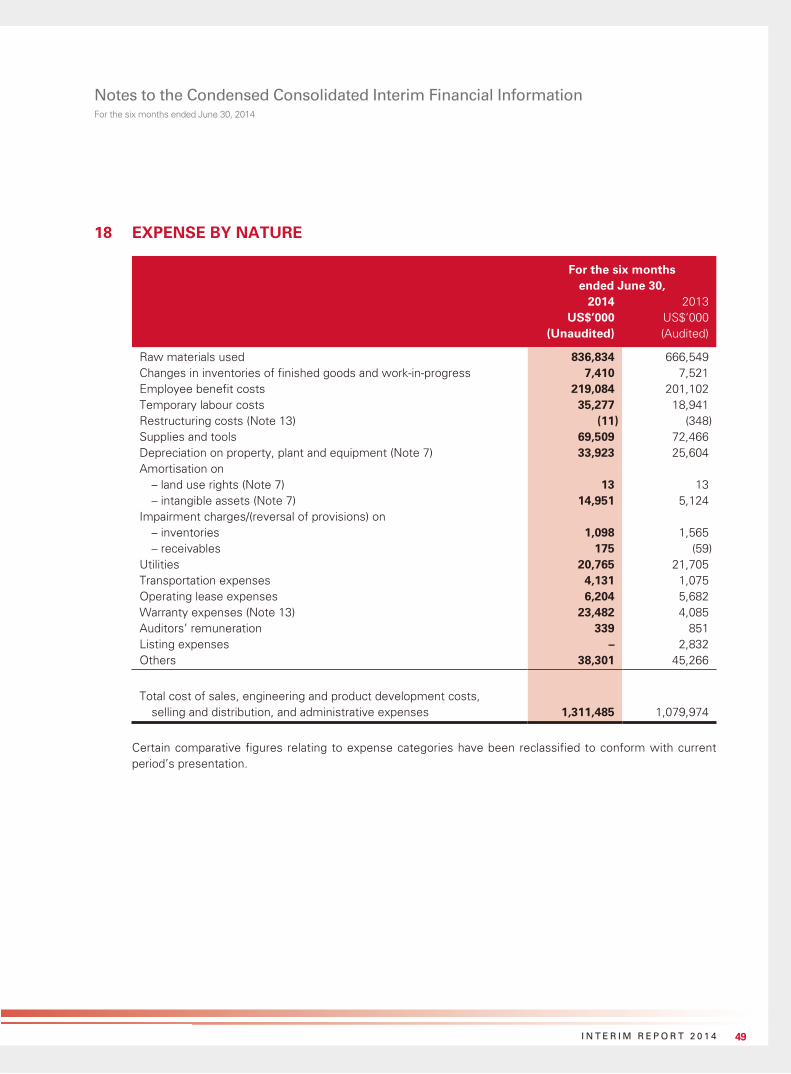
49I N T E R I M R E P O R T 2 0 1 4
Notes to the Condensed Consolidated Interim Financial InformationFor the six months ended June 30, 2014
18 EXPENSE BY NATURE
For the six months ended June 30,
2014 2013US$’000 US$’000
(Unaudited) (Audited)
Raw materials used 836,834 666,549Changes in inventories of finished goods and work-in-progress 7,410 7,521Employee benefit costs 219,084 201,102Temporary labour costs 35,277 18,941Restructuring costs (Note 13) (11) (348)Supplies and tools 69,509 72,466Depreciation on property, plant and equipment (Note 7) 33,923 25,604Amortisation on
– land use rights (Note 7) 13 13– intangible assets (Note 7) 14,951 5,124
Impairment charges/(reversal of provisions) on – inventories 1,098 1,565– receivables 175 (59)
Utilities 20,765 21,705Transportation expenses 4,131 1,075Operating lease expenses 6,204 5,682Warranty expenses (Note 13) 23,482 4,085Auditors’ remuneration 339 851Listing expenses – 2,832Others 38,301 45,266
Total cost of sales, engineering and product development costs, selling and distribution, and administrative expenses 1,311,485 1,079,974
Certain comparative figures relating to expense categories have been reclassified to conform with current period’s presentation.
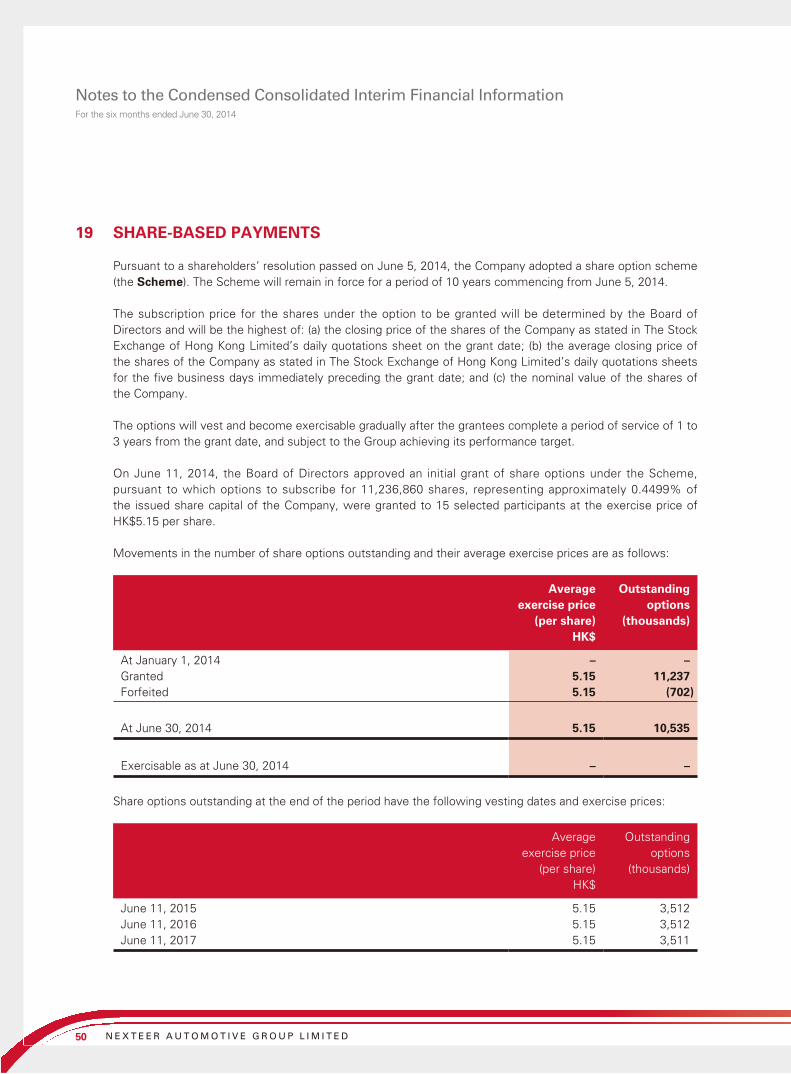
50 N E X T E E R A U T O M O T I V E G R O U P L I M I T E D
Notes to the Condensed Consolidated Interim Financial InformationFor the six months ended June 30, 2014
19 SHARE-BASED PAYMENTS
Pursuant to a shareholders’ resolution passed on June 5, 2014, the Company adopted a share option scheme (the Scheme). The Scheme will remain in force for a period of 10 years commencing from June 5, 2014.
The subscription price for the shares under the option to be granted will be determined by the Board of Directors and will be the highest of: (a) the closing price of the shares of the Company as stated in The Stock Exchange of Hong Kong Limited’s daily quotations sheet on the grant date; (b) the average closing price of the shares of the Company as stated in The Stock Exchange of Hong Kong Limited’s daily quotations sheets for the five business days immediately preceding the grant date; and (c) the nominal value of the shares of the Company.
The options will vest and become exercisable gradually after the grantees complete a period of service of 1 to 3 years from the grant date, and subject to the Group achieving its performance target.
On June 11, 2014, the Board of Directors approved an initial grant of share options under the Scheme, pursuant to which options to subscribe for 11,236,860 shares, representing approximately 0.4499% of the issued share capital of the Company, were granted to 15 selected participants at the exercise price of HK$5.15 per share.
Movements in the number of share options outstanding and their average exercise prices are as follows:
Average exercise price
Outstanding options
(per share) (thousands)HK$
At January 1, 2014 – –Granted 5.15 11,237Forfeited 5.15 (702)
At June 30, 2014 5.15 10,535
Exercisable as at June 30, 2014 – –
Share options outstanding at the end of the period have the following vesting dates and exercise prices:
Average exercise price
Outstanding options
(per share) (thousands)HK$
June 11, 2015 5.15 3,512June 11, 2016 5.15 3,512June 11, 2017 5.15 3,511

51I N T E R I M R E P O R T 2 0 1 4
Notes to the Condensed Consolidated Interim Financial InformationFor the six months ended June 30, 2014
19 SHARE-BASED PAYMENTS (Continued)
The weighted average fair value of options granted during the period determined using a binomial valuation model was HK$2.71 per option. The significant inputs into the model were share price at the measurement date of HK$5.15, exercise price of HK$5.15, volatility of 50%, dividend yield of nil, an expected term of 8.06 years, and an annual risk-free interest rate of 1.88%. The volatility measured at the standard deviation of continuously compounded share returns is based on statistical analysis of daily trading prices of the Company’s shares since the date of listing (October 7, 2013) as well as the daily trading prices of benchmarked publicly traded companies in the same industry. Considering there is limited information on the historical share price of the Company, the Group referred to benchmarked companies’ historical share price in addition to our share price history to determine the historical volatility.
The fair value of the share options charged to the interim condensed consolidated income statement was US$124,000 during the six months ended June 30, 2014.
20 FINANCE COSTS, NET
For the six months ended June 30,
2014 2013US$’000 US$’000
(Unaudited) (Audited)
Finance income
Interest on bank deposits 978 363
Finance costs
Interest expense on bank borrowings– Wholly repayable within 5 years 3,092 5,434– Not wholly repayable within 5 years 9,868 9,107
12,960 14,541
Interest on finance leases 34 36Other finance costs 812 674
13,806 15,251Less: amount capitalised in qualifying assets (2,595) (4,202)
11,211 11,049
Finance costs, net 10,233 10,686
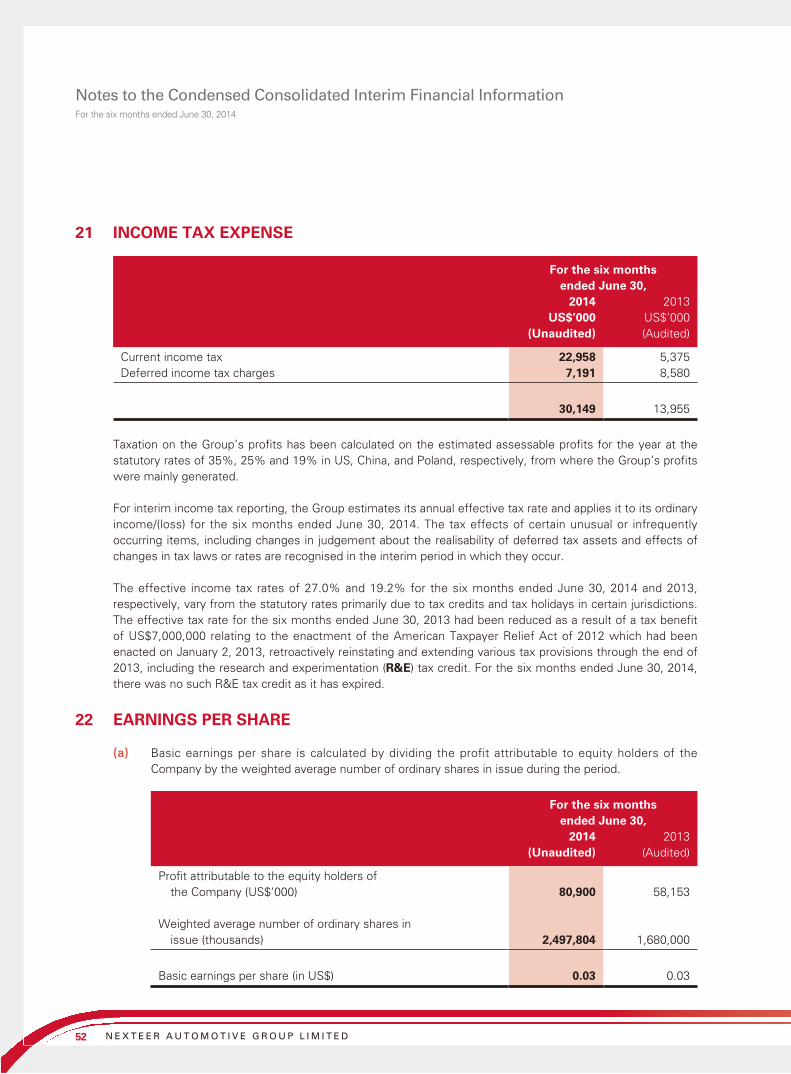
52 N E X T E E R A U T O M O T I V E G R O U P L I M I T E D
Notes to the Condensed Consolidated Interim Financial InformationFor the six months ended June 30, 2014
21 INCOME TAX EXPENSE
For the six months ended June 30,
2014 2013US$’000 US$’000
(Unaudited) (Audited)
Current income tax 22,958 5,375Deferred income tax charges 7,191 8,580
30,149 13,955
Taxation on the Group’s profits has been calculated on the estimated assessable profits for the year at the statutory rates of 35%, 25% and 19% in US, China, and Poland, respectively, from where the Group’s profits were mainly generated.
For interim income tax reporting, the Group estimates its annual effective tax rate and applies it to its ordinary income/(loss) for the six months ended June 30, 2014. The tax effects of certain unusual or infrequently occurring items, including changes in judgement about the realisability of deferred tax assets and effects of changes in tax laws or rates are recognised in the interim period in which they occur.
The effective income tax rates of 27.0% and 19.2% for the six months ended June 30, 2014 and 2013, respectively, vary from the statutory rates primarily due to tax credits and tax holidays in certain jurisdictions. The effective tax rate for the six months ended June 30, 2013 had been reduced as a result of a tax benefit of US$7,000,000 relating to the enactment of the American Taxpayer Relief Act of 2012 which had been enacted on January 2, 2013, retroactively reinstating and extending various tax provisions through the end of 2013, including the research and experimentation (R&E) tax credit. For the six months ended June 30, 2014, there was no such R&E tax credit as it has expired.
22 EARNINGS PER SHARE
(a) Basic earnings per share is calculated by dividing the profit attributable to equity holders of the Company by the weighted average number of ordinary shares in issue during the period.
For the six months ended June 30,
2014 2013(Unaudited) (Audited)
Profit attributable to the equity holders of the Company (US$’000) 80,900 58,153
Weighted average number of ordinary shares in issue (thousands) 2,497,804 1,680,000
Basic earnings per share (in US$) 0.03 0.03
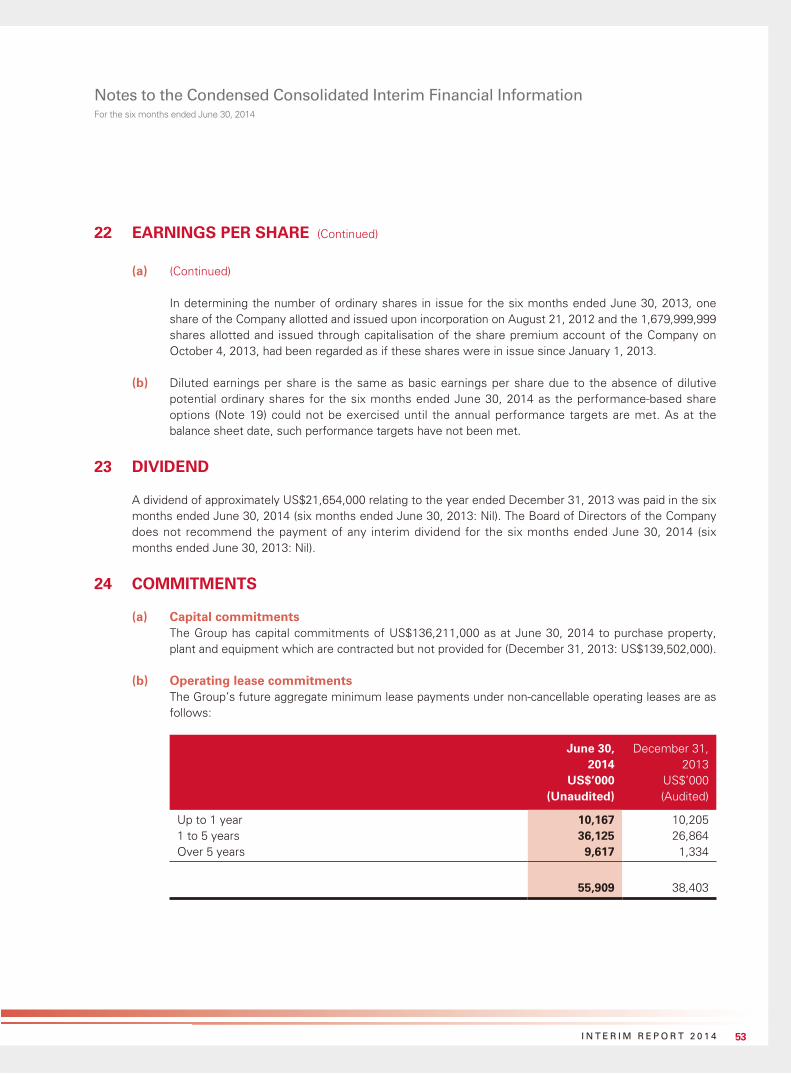
53I N T E R I M R E P O R T 2 0 1 4
Notes to the Condensed Consolidated Interim Financial InformationFor the six months ended June 30, 2014
22 EARNINGS PER SHARE (Continued)
(a) (Continued)
In determining the number of ordinary shares in issue for the six months ended June 30, 2013, one share of the Company allotted and issued upon incorporation on August 21, 2012 and the 1,679,999,999 shares allotted and issued through capitalisation of the share premium account of the Company on October 4, 2013, had been regarded as if these shares were in issue since January 1, 2013.
(b) Diluted earnings per share is the same as basic earnings per share due to the absence of dilutive potential ordinary shares for the six months ended June 30, 2014 as the performance-based share options (Note 19) could not be exercised until the annual performance targets are met. As at the balance sheet date, such performance targets have not been met.
23 DIVIDEND
A dividend of approximately US$21,654,000 relating to the year ended December 31, 2013 was paid in the six months ended June 30, 2014 (six months ended June 30, 2013: Nil). The Board of Directors of the Company does not recommend the payment of any interim dividend for the six months ended June 30, 2014 (six months ended June 30, 2013: Nil).
24 COMMITMENTS
(a) Capital commitmentsThe Group has capital commitments of US$136,211,000 as at June 30, 2014 to purchase property, plant and equipment which are contracted but not provided for (December 31, 2013: US$139,502,000).
(b) Operating lease commitmentsThe Group’s future aggregate minimum lease payments under non-cancellable operating leases are as follows:
June 30, 2014
December 31, 2013
US$’000 US$’000(Unaudited) (Audited)
Up to 1 year 10,167 10,2051 to 5 years 36,125 26,864Over 5 years 9,617 1,334
55,909 38,403
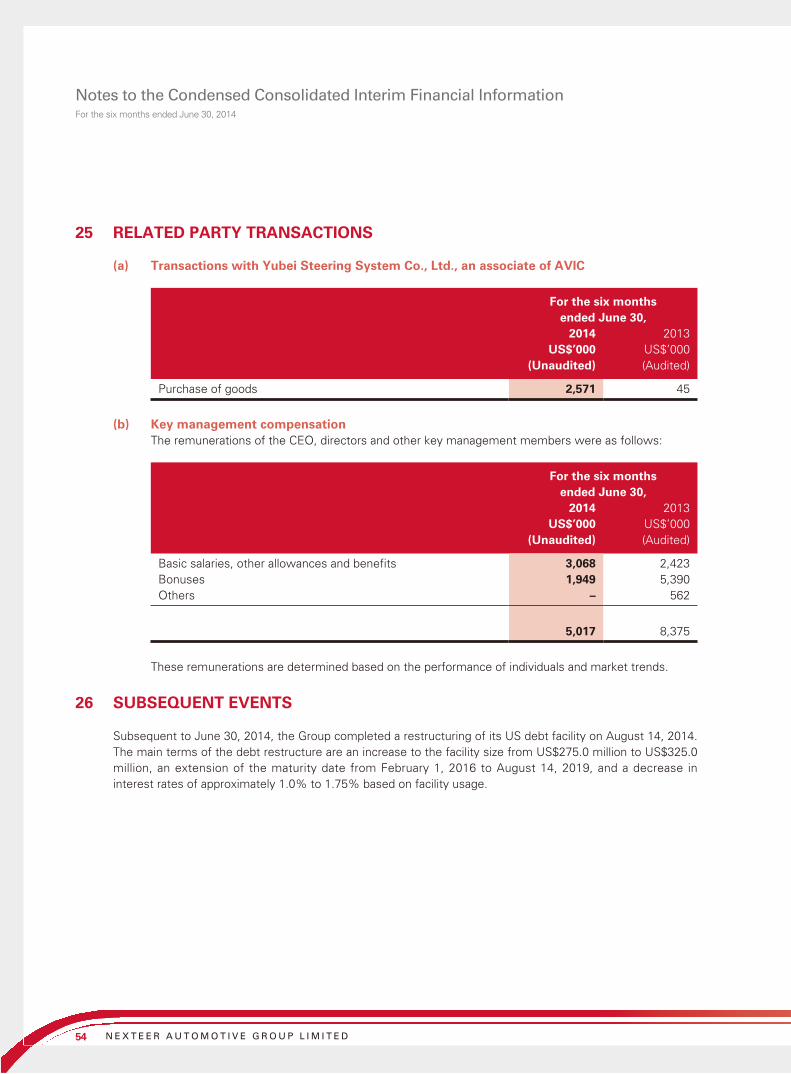
54 N E X T E E R A U T O M O T I V E G R O U P L I M I T E D
Notes to the Condensed Consolidated Interim Financial InformationFor the six months ended June 30, 2014
25 RELATED PARTY TRANSACTIONS
(a) Transactions with Yubei Steering System Co., Ltd., an associate of AVIC
For the six months ended June 30,
2014 2013US$’000 US$’000
(Unaudited) (Audited)
Purchase of goods 2,571 45
(b) Key management compensationThe remunerations of the CEO, directors and other key management members were as follows:
For the six months ended June 30,
2014 2013US$’000 US$’000
(Unaudited) (Audited)
Basic salaries, other allowances and benefits 3,068 2,423Bonuses 1,949 5,390Others – 562
5,017 8,375
These remunerations are determined based on the performance of individuals and market trends.
26 SUBSEQUENT EVENTS
Subsequent to June 30, 2014, the Group completed a restructuring of its US debt facility on August 14, 2014. The main terms of the debt restructure are an increase to the facility size from US$275.0 million to US$325.0 million, an extension of the maturity date from February 1, 2016 to August 14, 2019, and a decrease in interest rates of approximately 1.0% to 1.75% based on facility usage.


