Interim report 01.04.2009 - 31.12 · transition to a management model based on business divisions....
33
A Interim report 1 April 2009 - 31 December 2009
Transcript of Interim report 01.04.2009 - 31.12 · transition to a management model based on business divisions....
A
Interim report
1 April 2009 - 31 December 2009

Key Figures and Ratios 1
1/4/2009- 1/4/2008-
31/12/2009 31/12/2008-
Total electricity sales, of which GWh 6,672 7,149 -477 -6.7%
domestic electricity sales GWh 4,950 5,383 -433 -8.0%
electricity exports GWh 1,722 1,766 -44 -2.5%
Sales of heat GWh 700 1,009 -309 -30.6%
Sales of oil shale (outside the Group) th t 1,240 1,266 -26 -2.0%
Sales of shale oil (outside the Group) th t 118 103 16 15.1%
Distribution grid losses % 7.2% 5.8% 1,6pp
Average number of employees 7,681 8,273 -592 -7.2%
Total revenues and other income, including MEUR 470.4 481.9 -11.5 -2.4%
sales revenue MEUR 459.4 475.1 -15.7 -3.3%
EBITDA MEUR 159.1 114.1 45.1 39.5%
EBIT MEUR 89.9 49.4 40.5 82.0%
Net profit2 MEUR 75.8 48.9 26.9 55.0%
Net Fixed Assets MEUR 1,202.8 1,105.8 97.0 8.8%
Equity MEUR 1,120.2 1,117.5 2.8 0.2%
Net Debt MEUR 321.1 223.0 98.1 44.0%
Investments MEUR 154.5 135.1 19.4 14.3%
FFO MEUR 132.9 96.7 36.2 37.5%
Leverage1 % 24.4% 22.8% 1,6pp
ROIC2,3 % 10.5% 5.1% 5,4pp
EBITDA interest cover times 9.1 13.1 -4.0
FFO/ Interest Expenses times 10.9 7.7 3.2
FFO/ investments % 86.1% 71.6% 14,5pp
EBITDA margin % 33.8% 23.7% 10,2pp
EBIT margin % 19.1% 10.2% 8,9pp
1 Borrowings / (Borrowings + Equity)2 Discontinuing and continuing operations
3 rolling 12 months
FFO - Funds from operations excluding changes in the working capital
Change
1 Data covering only continuing segments.

Table of Contents Key Figures and Ratios ........................................................................................................................2
Eesti Energia in Brief ............................................................................................................................4
Significant Events during 2009/10 Financial Year First Nine Months ....................................................5
The Business Environment ...................................................................................................................7
Economic Performance and Business Segment’s.................................................................................9
Asset Portfolio and Investments .........................................................................................................13
Profitability, Financing and Cash Flows ..............................................................................................15
Short-term Outlook .............................................................................................................................18
Overview of Segment’s.......................................................................................................................19
Consolidated Statement of Financial Position.....................................................................................22
Consolidated Statement of Comprehensive Income ...........................................................................23
Consolidated Statement of Cash Flow................................................................................................24
Consolidated Statement of Changes in Equity....................................................................................25
Notes to the Consolidated Financial Statements.................................................................................26
1. Accounting Policies.....................................................................................................................26
2. Segment Reporting .....................................................................................................................26
3. Seasonality of Operating Profit....................................................................................................28
4. Property, Plant and Equipment ...................................................................................................28
5. Derivative Financial Instruments .................................................................................................29
7. Earnings per Share.....................................................................................................................31
8. Nominal Value and Amortised Cost of Borrowings......................................................................31
9. Contingent Liabilities...................................................................................................................32
10. Related Party Transactions.......................................................................................................32
11. Discontinued Operations...........................................................................................................32
12. Events After the Balance Sheet Date........................................................................................33

Eesti Energia in Brief Eesti Energia is an international energy company offering energy solutions ranging from electricity, heat and fuel production to sales, customer service and consulting. The company operates in all three Baltic States, in Finland and in Jordan, using the company name Eesti Energia in Estonia, and, since May 2009, the brand name Enefit for international operations. Our comprehensive approach to energy generation and customers’ energy needs helps us create value and increase security in Estonia and the wider world.
• We are the only energy company in Estonia operating across the entire value chain, from the upstream operations of oil shale mining, electricity and heat generation and oil production, through to client service and sales.
• In the Baltic Sea region, we sell electricity to customers in all three Baltic States and in Finland. • Our unique know-how and technology in oil shale processing is in high demand around the world, and is
a key export in our business portfolio. As preparation for the deregulation of the electricity market, in the 2008/09 financial year Eesti Energia made the transition to a management model based on business divisions. Dividing the company into divisions2 lays a foundation for the Eesti Energia Group to create more added value and be more successful in the international market.
2 Electricity Transmission segment is considered as discontinued operations due to assignment of OÜ Elering. Group’s six month interim report reflects financial and natural data for continuing segments. Nordic Energy Link is comprised in Electricity and Heat Production segment.
2

5 Interim report • 31 December 2009
Significant Events during 2009/10 Financial Year First Nine Months We are building new oil factory
In maximising the value of oil shale resources and increasing the quality of liquid fuels produced we are building a new shale oil plant with more efficient technology. For achieving this goal we have signed during the first nine months of current financial year contracts for the supply of steam turbine and generator as well as a contract for the construction of key parts of the new shale oil plant.
In July we signed a contract with Outotec for the construction of key parts of the new shale oil plant. Agreements include building of thermal unit, where the process of oil production takes place. Total cost of the contracts will be 110 million euros. In December we contracted Siemens Osakeyhtiö’s branch in Estonia to supply new oil plant with steam turbine and generator. The value of the contract is around 10 million euros. As a new solution the steam turbine of new oil plant with electrical capacity 37 MW will use the heat that is co product in the process of oil production. This update of the new Enefit-technology increases useful energy obtained from oil shale and enables to self-supply the plant with electricity when the plant is operating on full capacity. The installation of turbine will begin in September 2011.
The new oil plant uses a more environmentally friendly, dependable and scaled-up Enefit technology, developed through Eesti Energia’s cooperation with the international engineering company Outotec. The construction of the plant commenced in year 2010 and the start-up of the oil plant will take place in 2011. The cost of the new oil plant is approximately 190 million euros.
We are renewing our power capacity Our goal is to have competitive and diverse power generation portfolio. During the nine months of current
financial year we have made substantial decisions for achieving that – we have started the procurement for building new energy unit in Narva Elektrijaamad (Narva Power Plants), approved the Iru municipal solid waste plant, laid corner stone for the peak boiler house in Ahtme and opened Aulepa Tuulepargid (Aulepa Wind Farms), the biggest wind farms in Baltics. Additionally we started to produce from wood chips renewable electricity in Narva Elektrijaamad.
In June we opened Aulepa Tuulepargid. The brand-new wind farm is rated at 39 MW. The annual output of Aulepa wind farm will be about 100 GWh, which is 1.4 per cent of the domestic end consumption of electricity in Estonia. The total cost of the project is close to 58 million euros. In Narva Elektrijaamad about 260-280 GWh renewable energy is possible to generate from wood chips. That is 4 per cent of total consumption in Estonia. Amendments to Electricity Market Act, ratified by the Parliament on the 28th of January 2010, stipulate that only electricity produced in heat and electricity cogeneration is eligible for support. This will decrease the amount of renewable energy generated in Narva Elektrijaamad.
One of important decisions in renewing our power capacity was the procurement for the new energy unit in Narva Elektrijaamad. In November all qualified applicants received tender documentation necessary to draw up the offers. The deadline set for tenders is April 2010. Contract with the winner will be signed at the end of 2010.
Corner stone for the new peak boiler house in Ahmte was laid on the 24th of November. Total cost of the construction will be 8.6 million euros. The new boiler house will use gas and shale oil and has a total capacity of 100 MW, out of which 20 MW are covered with two new boilers built in Ahtme old heat plant in 2008.
Group’s Supervisory Board approved on the 27th on January the construction of the solid waste plant. The total cost of the project will be 95 million euros. The combined heat and power plant, which is scheduled to be completed in 2012, will have a capacity of burning up to 220,000 tons of mixed waste. Construction of the municipal solid waste plant is scheduled to commence at the summer of 2010.
We sold Elering Eesti Energia and the Ministry of Economic Affairs and Communications completed a transaction on the 27th of
January, according to what Elering was acquired by the state. The sales price totalled 172.6 million euros. Additionally Elering repaid intra-Group borrowings. The goal of the separation of Elering OÜ, Estonia’s TSO, is to conform with European Union requirements that TSOs be independent from generation and sales activity as well to establish the conditions for the creation of an electricity market in Estonia.
We started offering new products and services to cl ients We have started offering number of new products and services during the first nine months of current financial
year – electrical works, energy label, energy audit, thermal inspection and Green Energy. In May we started offering electrical works to clients - services range from installing sockets to creating
electricity projects. Clients can order energy labels from the beginning of June. An energy label is a document
6 Interim report • 31 December 2009
that characterizes buildings energy needs and contains a list of main measures that help to decrease buildings energy needs. In October we started offering energy audits and thermal inspections. An energy audit is an inspection of energy flows of buildings for energy conservation and decrease of losses in a building, based on the data collected from the client. Thermal inspection service enables to locate leakages in thermal insulation and to test heat firmness of external walls. Under the Green Energy brand Eesti Energia sells only renewable energy produced mainly by Eesti Energia or other producers outside the Group. Over 1660 clients have joined Green Energy at the end of December, with annual consumption at 25 GWh
We continue to be on the top of best service compan ies In November 2009 survey company TNS Emor published results of annual survey, carried through in
September-October, called the Service index. Value of Eesti Energia’s service index increased from 3.66 points to 3.70 points (from maximum 4.00 points), placing Eesti Energia third in the ranking.
We signed a EUR 150 million loan agreement with the European Investment Bank In May we signed a loan agreement with the European Investment Bank for 150 million euros with 15 year
maturity and favourable financial conditions. We will use the loan capital to finance a three-year investment programme, aimed at modernizing and developing Estonian electricity networks.
We rebranded our subsidiaries under one name In May we brought our subsidiaries, which had previously operated under different names and logos, under
one name and visual identity. All of the companies in the Group will begin using a single visual identity and the companies operating outside of Estonia will bear the trademark Enefit. As all of the companies will use the same visual identity as Eesti Energia, it will create strong associations between Eesti Energia’s international and domestic activities.
Changes in Eesti Energia's Supervisory Board Minister of Economic Affairs Juhan Parts appointed Rein Kuusmik as member of Eesti Energia's Supervisory
Board and recalled Minister of Finance Jürgen Ligi from the Supervisory Board. Minister of Finance Jürgen Ligi appointed Kalle Palling and Janek Parkman as members of Eesti Energia's Supervisory Board and recalled Meelis Virkebau and Rene Tammist from the Supervisory Board. The Supervisory Board of Eesti Energia is comprised of eight members. Half of the members of the Supervisory Board of Eesti Energia are appointed by the Minister of Economic Affairs, and the other half by the Minister of Finance.

7 Interim report • 31 December 2009
The Business Environment
Macroeconomic environment Decrease in real growth rate of gross domestic product (GDP) has stayed around -15-16% (compared to the
same period last year) in the three quarters of 2009 according to Statistics Estonia. The slowdown is attributable to weak domestic demand. The slowdown in the growth of wages, tighter loan conditions and growing unemployment have strongly discouraged consumer spending (-17.7% in first quarter, -20.8% in second quarter and -20.0% in third quarter). Due to the drop in demand both in Estonia and abroad and the limited availability of credit, companies have cut investments by –27.3% in first quarter, -38.8% in second quarter and -37.0% in third quarter. The economic slowdown in Estonia’s trading partners has pulled down exports (-16.5%, -11.1% and -9.6% respectively), while imports has dropped even more (-27.4%, -30.9% and -26.6%).
-40%
-30%
-20%
-10%
0%
10%
20%
30%
Jan 2004 Jan 2005 Jan 2006 Jan 2007 Jan 2008 Jan 2009
% y-o-y
GDP
Average wage
Inflation
Index of industrial output
Source: Statistics Estonia
Increase in unemployment and decrease in the average wage growth have characterized the labour market. The unemployment rate has increased from 7.6% in the fourth quarter of 2008 to 14.6% in the third quarter of 2009 and decrease of average wage has deepened from -1.5 in the first quarter of 2009 to -5.9% in the third quarter of 2009. From the beginning of the year 2009 the inflationary environment has turned into deflationary - the rate of change in the consumer price index has decreased from 3.1% in the first quarter into -2.1% in the fourth quarter. Decrease in world food prices and prices related to housing (heating) have been the main reasons for that. Although the confidence of households and companies has steadily increased from the beginning of the year according to Estonian Institute of Economic Research, there have been no signs in the macroeconomic data yet.
The index of industrial output, which shows the change in industrial output compared to the previous period, decreased -26.6% on average in the first eight months of the financial year. In the last months of the year decrease slowed down, from -35.5% in April to -13.8% in November, partly to lower base. Temperature
Average outside temperature in the first nine months of the financial year 2009/10 was 8.9°C that is 0 .7 °C lower than in the corresponding period of the last year according to the Estonian Meteorology and Hydrology Institute data. Average temperature was 1.3°C in th e third quarter. Temperature was 0.4°C lower in the first quarter, 1.2°C warmer in the second quarter and 2.7 °C lower in the third quarter, compared to the same period of the previous financial year. The biggest monthly differences occurred in September (+3.0°C), Octobe r (-3.9°C) and December (-4.0°C). Lower temperature in the thi rd quarter, at the beginning of the heating season, substantially influenced Group’s electricity and heat sales. Prices of electricity
Estonia. Under Estonian legislation, the Competition Authority is responsible for approving the limit on the price of electricity sold by Narva Elektrijaamad (Narva Power Plants) to the regulated market segment and the limit of the weighted average price of the electricity sold under the Group’s sales obligation. Since January 1st 2009, indexing methods approved by the Competition Authority have been used in both cases.
Domestic price of electricity changed once in the first six months of the financial year – price decreased 6.4% at the beginning of August. The selling price, which had been set at the level 32.5 €/MWh since March 1st, fell to 30.4 €/MWh. The change in price was caused by a decrease in the costs of electricity generation in Narva

8 Interim report • 31 December 2009
Elektrijaamad as new smaller environmental charges came into effect. Average domestic selling price of electricity in the first nine months of the financial year was 31.4 €/MWh and 30.4 €/MWh in the third quarter.
Nordic countries. Average price of electricity at the Nordic power exchange Nord Pool Finland area was 36.6 €/MWh in the first nine months of financial year, decreasing by 18.3 €/MWh (-33.3%) in comparison to the same period last year. The average price was 39.9 €/MWh in the third quarter. Extraordinary circumstances occurred on December 17th when the average price in the Finland area was 251 €/MWh. Not withstanding that average prices fluctuated between 18.5-60.6 €/MWh in the first nine months of the financial year, and between 23.1-60.6 €/MWh. CO2 emission allowances
Average daily price of CO2 2009 emission allowances was 14.0 €/t and decreased by 9.5 €/t (40.4%) in comparison with first nine months of the previous financial year. The price was 13.7 €/t in the third quarter.
0
40
80
120
160
Apr 2006 Oct 2006 Apr 2007 Oct 2007 Apr 2008 Oct 2008 Apr 2009 Oct 2009
$/barrel
0
200
400
600
800$/t
Brent crude oil ($/barrel) Fuel oil ($/t)
0
30
60
90
120
Apr 2006 Oct 2006 Apr 2007 Oct 2007 Apr 2008 Oct 2008 Apr 2009 Oct 2009
€/MWh
Nord Pool Finland area monthly average price
Eesti Energia average electricity selling price on the domestic market
Average price 251 €/MWh on the 17th of December
Price of crude and fuel oil
Brent crude oil daily average price was 67.4 $/barrel (47.2 €/barrel) in the first nine months of the financial year, that is 30.6% (27.6%) lower compared to the same period last year. The price has steadily grown from the beginning of the financial year – from 50 $/barrel in April to 70 $/barrel in December (+50% compared to the start of the financial year). Fuel oil price follows the trend of crude oil price, influencing the sale price of fuel oil produced by the Group. Daily average price of fuel oil in world market was 394$/t (276 €/t) in the first nine months of the financial year, decreasing by 22.2% (19.0%) in comparison to same time last year. The price was 446.0 $/t (302 €/t) in the third quarter, that means an increase by 53.3% (36.8%) from a year ago.

9 Interim report • 31 December 2009
Economic Performance and Business Segment’s Retail Business
Financial data. Due to the economic downturn the electricity consumption in Estonia decreased. This had a negative impact on both, the segment’s nine months’ revenue streams from electricity sales as well as network services. However the decline in consumption was somewhat compensated by higher electricity prices and an increase in sales volumes in the Latvian market. The segment’s profitability has gone up due to a decrease in fixed costs, mainly in costs associated with the maintenance and improvement of equipment and labour. Due to the increase in costs associated with electricity purchasing, the operating profit declined in third quarter compared to the same period of the previous financial year.
9 months Change (MEUR) 09/10 08/09 (MEUR) % Revenues 301.7 292.8 8.9 3.1% Operating Profit 28.8 24.0 4.9 20.3% FFO 37.5 33.6 3.8 11.4% Investments 49.3 84.1 -34.8 -41.3% EVA (12 months) -8.4 -4.2 -4.2 100.0% Number of Employees 1,603 1,788 -185 -10.3%
During the first nine months of the financial year domestic sales of electricity outside the Group were
4,950 GWh, which is 433 GWh (8.0%) lower than that of the previous financial year. Sales to business customers were 2,923 GWh (-409 GWh, -12.3%), to retail customers 1,163 GWh (-2 GWh, -0.2%) and to network operators 863 GWh (-22 GWh, -2.4%). Sales to business customers have been mostly affected by the economic recession, sales revenues to network operators by the decline in electricity sold to Elering for losses. Green Energy from renewable sources amounted to 14.2 GWh during the first 9 months.
-20%
-10%
0%
10%
20%
I 06/07
III I 07/08
III I 08/09
III I 09/10
III
% y-o-y
-5.0
-2.5
0.0
2.5
5.0degrees
Change in the av erage temperature (degrees)Change in the domestic sales of electricity (%)Change in GDP (%)
0
40
80
120
I 07/08
II III IV I 08/09
II III IV I 09/10
II III
GWh
0
50
100
150number of clients
Enef it SIA sales (GWh) Number of Enef it SIA clients
Partial opening of Latv ian electricity market in May 2008
Source: Eesti Energia, Estonian Meteorological and Hydrological Institute, Statistics Estonia
In third quarter the decline in domestic electricity sales outside the Group slowed down a little compared to the previous quarters (first quarter -7,8%, second quarter -12,3% and third quarter -5,0%). It was partly the result of a lower-than-average outside temperature that was 2.7°C lower than in third quarter of the 2008/09 fin ancial year. Decline in sales to business customers slowed from 16.0% in second quarter to 7.5% in third quarter. The volume of electricity sold to network operators declined in third quarter by 1.8% and to retail customers by 0.8%.
The network service sales of Jaotusvõrk (Distribution Network) amounted to 4,363 GWh during the first nine months – a decrease of 5.7% (-263 GWh) compared to the same period of the previous year. The fall in sales volumes was lower in third quarter (2.6%) than in first (-6.1%) and second quarter (-9.3%). The fall is largely the result of decrease in the volume of electricity transmitted at medium voltage (mainly to business customers) (-12.4%, -203 GWh), sales volumes of electricity transmitted at low voltage have declined less (-2.0%, -60 GWh).
The network service revenues of the first nine months were 118.2 million euros, a growth of 1.9 million euros (+1.6%) compared to the same period of the previous financial year. During the nine months of the current financial year the network service fee was on average 8.6% higher than during the same period of the previous
10 Interim report • 31 December 2009
financial year. The growth stems from a change in the sales structure – less electricity is transmitted at medium voltage and at lower fees, and more is transmitted at high voltage and at higher fees.
Sales to the retail customers in the Latvian open market amounted to 270 GWh during the first nine months, which is 182 GWh more than during the first nine months of the previous financial year. The sales in third quarter were 89 GWh, that is 27 GWh (+43.7%) more than during the same period of the previous year. As of December 2009 Enefit SIA had 116 large accounts, which is 103.5% (59 accounts) more than a year ago.
The distribution network losses amounted to 7.2% as of December 2009. This implies a growth by 1.4 percentage points compared to the same period of the previous year. In third quarter the losses were 9.9% or 2.6 percentage points higher than during third quarter of the financial year 2008/09. The percentage figure of losses has been influenced, on the one hand, by bigger losses in terms of real figures +19.4% (+56 GWh), and on the other hand by a 3.9% (-194 GWh) decline in the volume of electricity entering the grid, compared to the previous financial year.
The telecommunication services revenues of the 9 months were 9.3 million euros, implying a growth of 10.2% (0.9 million euros). This was mainly due to an increase in the revenues of the mobile internet service KÕU. As of December 2009 KÕU had more than 25 500 active clients, which is 16.5% (more than 3,600 customers) more than in December a year ago.
The segments investments during the first 9 months were 49.3 million euros, which is 41.3% (34.8 million euros) less than during the same period of the previous financial year. Jaotusvõrk network’s investments amounted to 48.7 million euros and were used to finish the development of new connections as well as increasing the reliability of the service.
Electricity and Heat Generation
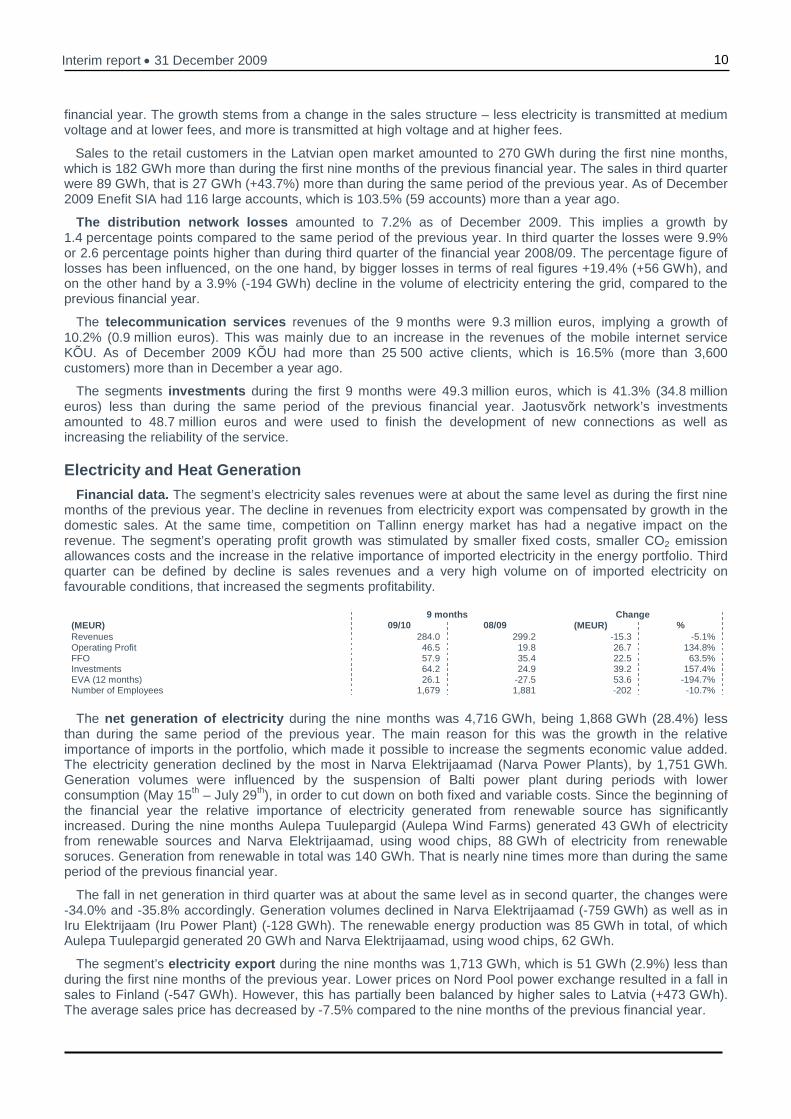
Financial data. The segment’s electricity sales revenues were at about the same level as during the first nine months of the previous year. The decline in revenues from electricity export was compensated by growth in the domestic sales. At the same time, competition on Tallinn energy market has had a negative impact on the revenue. The segment’s operating profit growth was stimulated by smaller fixed costs, smaller CO2 emission allowances costs and the increase in the relative importance of imported electricity in the energy portfolio. Third quarter can be defined by decline is sales revenues and a very high volume on of imported electricity on favourable conditions, that increased the segments profitability.
9 months Change (MEUR) 09/10 08/09 (MEUR) % Revenues 284.0 299.2 -15.3 -5.1% Operating Profit 46.5 19.8 26.7 134.8% FFO 57.9 35.4 22.5 63.5% Investments 64.2 24.9 39.2 157.4% EVA (12 months) 26.1 -27.5 53.6 -194.7% Number of Employees 1,679 1,881 -202 -10.7%
The net generation of electricity during the nine months was 4,716 GWh, being 1,868 GWh (28.4%) less
than during the same period of the previous year. The main reason for this was the growth in the relative importance of imports in the portfolio, which made it possible to increase the segments economic value added. The electricity generation declined by the most in Narva Elektrijaamad (Narva Power Plants), by 1,751 GWh. Generation volumes were influenced by the suspension of Balti power plant during periods with lower consumption (May 15th – July 29th), in order to cut down on both fixed and variable costs. Since the beginning of the financial year the relative importance of electricity generated from renewable source has significantly increased. During the nine months Aulepa Tuulepargid (Aulepa Wind Farms) generated 43 GWh of electricity from renewable sources and Narva Elektrijaamad, using wood chips, 88 GWh of electricity from renewable soruces. Generation from renewable in total was 140 GWh. That is nearly nine times more than during the same period of the previous financial year.
The fall in net generation in third quarter was at about the same level as in second quarter, the changes were -34.0% and -35.8% accordingly. Generation volumes declined in Narva Elektrijaamad (-759 GWh) as well as in Iru Elektrijaam (Iru Power Plant) (-128 GWh). The renewable energy production was 85 GWh in total, of which Aulepa Tuulepargid generated 20 GWh and Narva Elektrijaamad, using wood chips, 62 GWh.
The segment’s electricity export during the nine months was 1,713 GWh, which is 51 GWh (2.9%) less than during the first nine months of the previous year. Lower prices on Nord Pool power exchange resulted in a fall in sales to Finland (-547 GWh). However, this has partially been balanced by higher sales to Latvia (+473 GWh). The average sales price has decreased by -7.5% compared to the nine months of the previous financial year.

11 Interim report • 31 December 2009
In third quarter the decline in the volumes of electricity sold to Finland continued, however the fall was the lowest of the last three quarters (-14.5%). Export to Latvia, which grew during the first two quarters, declined in third quarter (-19 GWh), as the high level of precipitation lead to an increase in the production volumes of Latvian hydro power plants.
Heat sales during the nine months amounted to 773 GWh, being 310 GWh (-28.6%) less than during the same period of the previous financial year. The fall in sales can mainly be attributed to a decline in the sales of Iru Elektrijaam - by 303 GWh. The nine months’ average temperature was 0.7°C lower than during the pre vious year. The average sales price of the nine months was 10.5% lower than during the same period of the 2008/09 financial year. The heat price of Iru Elektrijaam decreased the most, as the result of a decline in the purchase price of natural gas used in production.
The decline in heat sales in third quarter slowed down to 14.2% (first quarter -59.6% and second quarter -39.2%) due to 2.7°C lower outside temperature. The sales of Iru Elektrijaam fell by 115 GWh, however the sales of Narva Soojusvõrk (Narva District Heating) grew by 19 GWh.
-60%
-30%
0%
30%
60%
I 06/07
III I 07/08
III I 08/09
III I 09/10
III
% y-o-y
-5.0
-2.5
0.0
2.5
5.0
degrees
Change in the av erage temperature (degrees)Change in the net production of heat (%)
0
120
240
360
480
600
I 07/08
II III IV I 08/09
II III IV I 09/10
II III
GWh
0.0
20.0
40.0
60.0
80.0
100.0€/MWh
Electriciy exports to Finland (GWh)Spot-price of Nord Pool Finland area (€/MWh)
Source: Eesti Energia, Estonian Meteorological and Hydrological Institute, Nord Pool
The segment’s investments reached 64.2 million euros during the first nine months, which is 157.4% (39.2 million euros) more than during the 9 months of the previous financial year. The investments of Narva Elektrijaamad were 30.4 million euros (21.6 million euros), the majority of which was used for the installation of the desulphurisation equipment (15.6 million euros). 11.6 million euros were invested into Aulepa Tuulepargid; Taastuvenergia ettevõtte (the Renewable Energy) investments were up to 9.1 million euros (+8.9 million euros) due to land purchases; and out of the 4.6 million euros (+1.8 million euros), invested in Kohtla-Järve Soojus (Kohtla-Järve Heat), 3.3 million euros can be associated with the erection of a new peak and reserve boiler house.
Minerals, Oil, Biofuels
Financial data. The segment’s revenues were influenced by two opposite trends – due to the decrease in intra Group energy generation the oil shale revenues are exhibiting a downward trend, shale oil revenues on the other hand exhibit an upward trend due to positive impact of hedging. The segment’s profitability increased as a result of smaller fixed costs, especially transport related costs, and smaller change in inventory. The profitability grew substantially in third quarter, as the decrease in revenues was smaller compared to previous quarters and cost savings were greater.
9 months Change (MEUR) 09/10 08/09 (MEUR) % Revenues 138.1 151.4 -13.3 -8.8% Operating Profit 18.0 8.2 9.8 120.3% FFO 29.5 17.6 11.9 67.6% Investments 34.0 25.4 8.6 34.0% EVA (12 months) 9.7 -5.6 15.3 -271.6% Number of Employees 4,163 4,413 -250 -5.7%

12 Interim report • 31 December 2009
Volume of oil shale sales outside the segment amounted to 7.6 million tonnes during the first nine months, which is 23.7% (2.4 million tonnes) less than during the same period of the previous year. Lower electricity generation has led to fall in sales to Narva Elektrijaamad by 27.3% during the nine months. At the same time sales inside the segment, to the Oil and Gas, have grown by 25.1% (0.2 million tonnes) as a result of an increase in the production of liquid fuels. The oil shale production of the first nine months amounted to 9.9 million tonnes (-9.3%; -1.0 million tonnes).
In third quarter the oil shale sales outside the segment reached 2.7 million tonnes. The fall in sales volume comparing to same period last year remained at the same level as in second quarter, -29.6% and -29.4% respectively. The growth in the volume of sales inside the segment sped up compared to second quarter from 23.3% to 66.8%. The volume of production was 4.0 million tonnes (-1.7%; -0.1 million tonnes).
The sales revenues of oil shale decreased by 12.7% during the first nine months and amounted to 85.6 million euros. The revenues have been positively affected by the new oil shale sales price that was harmonised with the Estonian Competition Authority and came into effect from October 1st 2008. In third quarter the sales revenues were EEK 29.9 million euros (-17.9%).
Shale oil sales volumes during the nine months were 133 thousand tonnes, which is 21.2% more than during the same period of the previous year. Outside the Group sales grew by 15.1% (16 thousand tonnes) during the first nine months and inside the Group sales grew by 114.7% (8 thousand tonnes). Due to lower fuel oil prices on the world market the average sales price not including the impact of future transactions, for outside the Group sales, was 23.4% lower than during the first nine months of the 2008/09 financial year.
In third quarter the shale oil sales in total grew 50.7% (18 thousand tonnes) and reached 54 thousand tonnes. Outside the Group sales grew 44.7% (15 thousand tonnes) and inside the Group sales grew 111.1% (4 thousand tonnes). The average sales price outside the Group was 11.1% higher in third quarter than at the same time during the previous year.
-40%
-20%
0%
20%
40%
60%
80%
100%
I 06/07
III I 07/08
III I 08/09
III I 09/10
III
Oil shale f or oil production (% of total sales)Oil shale f or electricity and cement production (% of total sales)Total sales of oil shale (% y -o-y )Group's net electricity production (% y -o-y )
% y-o-y; % of total sales
0
10
20
30
40
50
60
I 06/07
III I 07/08
III I 08/09
III I 09/10
III
th t
0
50
100
150
200
250
300
350
400
450€/t
Sales of shale oil (outside Group) (th t)
Fuel oil world market price (€/t)
Sales price of shale oil (outside Group) (€/t)
Source: Eesti Energia, Reuters
The segment’s export revenues of power engineering equipment and goods declined by 7.3% (0.6 million euros) during the nine months and the domestic revenues declined by 70.6% (4.2 million euros). The revenues from gravel grew 0.3%; however revenues from retort gas grew by 45.0%. In total, revenues from other products and goods amounted to 13.0 million euros (-23.2%).
The segment’s investments during the first nine months of the financial year were 34.0 million euros, which is 34.0% (8.6 million euros) higher than during the nine months of the previous financial year. Oil Factory investments reached 21.2 million euros, out of which 15.4 million euros can be associated with the preparation of the procurement of the new Enefit equipment and the first down-payment. The investment of Mining was 10.8 million euros, most of which (4.9 million euros) was used for obtaining new equipment for the Narva quarry, and for the reconstruction of the existing equipment. Technology invested 1.9 million euros during the first nine months.

13 Interim report • 31 December 2009
Asset Portfolio and Investments A Vertically Integrated Portfolio offers a Sound Se t of Assets of Varied Risk Levels
Eesti Energia is a vertically integrated energy company whose portfolio of assets covers businesses involved in the energy supply chain, from the mining of fuel to the sales of electricity. As of 31.12.2009 the value of the Group’s assets stood at 1.6 billion euros.
The Estonian electricity market is gradually opening up for competition – until 31st of December 2008 the market was opened to clients, whose electrical consumption exceeded 40 GWh from one connection point. From the 1st of January 2009 the market has been opened to clients whose electrical consumption exceeds 2 GWh from one connection point and from the beginning of year 2013 the market will be fully opened. Therefore at the moment the risks related to the assets of generation of energy and the mining of oil shale are limited, but growing as the electricity market will open by the year 2013 at the latest. Eesti Energia sells electricity to the Nordic electricity market Nord Pool and to the open market in Latvia as well. Therefore, oil shale mining and electricity generation are already partially opened to market risks.
One obstacle in the development to an open market has been that open market clients can buy electricity from the regulated market at the regulated market price. For this reason the price of electrical energy in the regulated market determines the upper limit of electricity prices in the open market and interferes with the actual functioning of the open market. If the amendments to the electricity law are ratified by Parliament then from April 2010 open market clients will not be able to buy electricity at the regulated market regulated price. This will create the basis for the real opening of the market. At the end of January 2010 the amendments had been adopted by the Parliament.
Power networks constitute a substantial part of the Group’s portfolio of assets. Revenues from distribution operations and return on invested capital are regulated and co-ordinated with Estonian Competition Authority. Balance sheet value of distribution network assets stands at 637 million euros.
Oil production from oil shale is another important business in addition to the vertically integrated electricity business. The value of the oil production business is directly tied to volatile oil prices.
Investments boost the Group’s development
Investment strategy of Eesti Energia is based on the criteria of economic efficiency, environmentally sustainable development, and security of supply. Investments are planned to ensure the fulfilment of strategic objectives. In terms of energy generation this means diversification of the generation portfolio so that it is in compliance with stricter environmental requirements while maintaining competitiveness in the regional electricity market, including through development of co-generation and renewable energy. The largest investment in the near future is the building of first new energy unit in Narva Elektrijaamad (Narva Power Plants) by the year 2015 at the latest. Procurement for building at least new one energy unit was announced in July 2009 with aim of signing a contract with the winner in autumn 2010 latest. New energy blocks enable Eesti Energia to maintain the current capacities after the year 2016, when stricter environmental requirements become effective, and guarantee the security of energy supply. Meanwhile Aulepa Wind Farm (39 MW) construction work has ended and production of electricity has commenced. Additionally we are exploring possibilities to build a wind park in Balti Elektrijaama’s closed ash field, in Paldiski, off-shore wind parks and expanding of Aulepa Wind Farm. Eesti Energia has entered small co-generation field by acquiring from BLRT two co-generation units and has reached to an agreement with Strantum OÜ of building a co-generation unit in Tabasalu that will start production in 2010.
The distribution network has undergone remarkable development since 1998, when Eesti Energia was established. If in 2003 distribution losses of electric energy were around 12%, since then domestic losses have dropped to 7.9% by the end of December 2009. The targets of the investments in the energy networks are tightly related to the reduction of failures and losses, and to the elimination of problems with voltage fluctuation.
Property, plant and equipment
590 622
401441
103115
0
300
600
900
1,200
Dec. 2008 Dec. 2009
million euros
Retail Business Electricity and Heat ProductionMinerals, Oil, Biofuels Other and elimination
+32 MEUR
+40 MEUR
+12 MEUR

14 Interim report • 31 December 2009
Eesti Energia has unique know-how in the field of large-scale oil shale mining and from it, the production of electricity and shale oil. To take a step further, Eesti Energia and international engineering company Outotec concluded a deal in July 2009 to build a shale oil plant operating an on a new more efficient technology. The new oil plant uses a more environmentally friendly, reliable and scaled-up Enefit technology, developed through Eesti Energia’s cooperation with the international engineering company Outotec. In the coming years, Eesti Energia plans to develop a liquid fuels industry, producing oil up to twice the value of the current shale oil which could also be used as motor fuel according to existing fuel norms. We have also reached an agreement with the Jordanian government, where the world’s fourth biggest oil shale deposit can be found, to build an oil shale based electric power plant in Jordan. There is also an ongoing project to produce shale oil from oil shale in Jordan.
One of the principle techniques of strategic management in Eesti Energia is the balanced scorecard. The balanced scorecard takes financial criteria into account, as well as aspects relating to clients, staff, and the business processes. The investments should, in addition to meeting financial criteria, also contribute towards meeting the goals set forth in the balanced scorecard.
In past six financial years, Eesti Energia Group has invested 1.0 billion euros, i.e. on average 0.2 billion euros a year. In the first nine months of the current financial year, Eesti Energia invested 154.5 million euros. The main areas of investments were the networks, where 48.7 million euros were invested. Considerable amounts were invested in the electricity and heat generation segment – Narva Elektrijaamad investments were 30.4 million euros, including 15.9 million euros in desulphurisation equipment and in the Aulepa Wind Park 11.6 million euros. 15.4 million euros were invested in the new Enefit technology.
Investments (9 months)
84
49
2564
2534
0
40
80
120
160
2008/09 2009/10
million euros
Retail Business Electricity and Heat ProductionMinerals, Oil, Biofuels Other and elimination
-35 MEUR
+39 MEUR
+9 MEUR

15 Interim report • 31 December 2009
Profitability, Financing and Cash Flows 3 Decrease in expenses has increased the Group’s prof itability
First nine months of 2009/10 financial year is characterized by increased profitability in environment of decreasing revenue and economic recession. The Group’s operating profit was 89.9 million euros, increase by 82.0% (40.5 million euros) comparing to same period last year. Total revenue and other income was 470.4 million euros (decreasing by 11.5 million euros, -2.4% compared to last year same period) and net profit (for continuing and discontinuing operations) was 78.5 million euros (+26.9 million euros, +55.0%). Increase in corporate income tax (4.0 million euros) due to increase in dividends had negative impact on the net profit.
Revenue of electricity continued to form the largest part of Groups revenue, amounting to 52.5% of revenue and decreasing by 1.1% comparing to nine months last financial year. Lower outside temperature and higher domestic selling price compensated for some degree for the decrease in the sales volume due to economic downturn. Although electricity exports to Latvia grew, then decrease in electricity export to Nord Pool Finland area was main reason for decline in revenue of electricity export. Fall in sales revenue of heat (-37.4%) is related to tighter competition in Tallinn heat market. Oil shale outside Group sales volume have decreased (-2.0%), but the selling price was higher, resulting in increase of sales revenue (+4.9%). Higher sales revenue from shale oil (+16.9%) was due to bigger selling volume and positive impact of hedging. Smaller production volumes have lead to decrease in Group’s variable costs, mainly in the cost of CO2 emission allowances. Also we have cut successfully Group’s fixed costs, that decreased by 16.2% in the nine months comparing to same period previous financial year. The biggest decrease has been in the equipment repair and maintenance expenses (-35.3%) compared to the previous financial year’s first nine months. Declines were registered also in equipment expenses related to transportation and tools (-19.3%) and payroll expenses (-7.2%).
Change in Group's nine months fixed costs
25,3%
7,0%
-16,2%-25%
0%
25%
50%
2007/08 2008/09 2009/10
% y-o-y
Group's EVA (rolling 12 months)
-2
18
-49
-60
-30
0
30
Dec. 2007 Dec. 2008 Dec. 2009
MEUR
-47 MEUR +67 MEUR
Group’s operating profit was 46.5 million euros (+23.2 million euros, 118.4%) in the third quarter. Decrease in revenue decelerated from -7.0% in the second quarter to -4.3% in the third and decrease in operating expenses increased from -9.4% in the second quarter to -18.7% in the third. Main drivers in revenue side were domestic electricity sales revenue and sales revenue of shale oil that grew as the fuel oil price in the world market increased. Sales revenue of export and heat had negative impact on the revenue. Export sales revenue decreased due to smaller export volume and selling price to Finland and Latvia, heat revenue due to continuing decline in sales volume and decrease in the selling price. Additionally to variable costs have decreased also fixed costs, mainly the equipment repair and maintenance expenses.
Eesti Energia's rolling twelve months revenues were 662.3 million euros (+19.4 million euros, +3.0%), operating profit 117.8 million euros (+75.0 million euros, +174.9%) and net profit 102.9 million euros (+67.9 million euros, +194.0%).
Group’s twelve months EVA was 18.1 million euros at the end of December 2009, growing by remarkable 67.0 million euros compared to twelve months at the end of December 2008.
Operating profit of the discontinuing operations was 1.1 million euros in the first nine months (-6.5 million euros, -85.1%) and in the third quarter 12.8 million euros (+2.9 million euros, +28,9%).
3 Data in text covering continuing operations only, if not noted otherwise. Data for continuing operations presented in the graphics for financial year 2009/10; previous years include data for discontinuing operations, except EVA where all data is for both operations.

16 Interim report • 31 December 2009
Eesti Energia balance sheet is strong
Despite large-scale investments, Eesti Energia has retained a conservative balance sheet structure. Disbursement of a loan from the Nordic Investment Bank in the amount of 40 million euros in May 2009 increased the proportion of borrowings in the balance sheet at the end of December and debt / (debt + equity) ratio increased compared to the end of December 2008 from 22.8% to 24.4%.
Borrowings/EBITDA (rolling 12 months) ratio has decreased in the year from 2.5 to 1.7 as EBITDA has increased.
In the medium term we are expecting an increase in leverage, as investments grow in order to achieve our strategic objectives. Working capital increased during the nine months by 107.7 million euros as current assets increased and the short-term liabilities decreased. At the end of December the Group’s net debt was 321.1 million euros (+98.1 million euros, +43.9% compared to year ago). Net debt change was due to decrease in cash and equivalents due to increased dividends an increase in long-term borrowings.
As of 31.12.2009, the weighted average interest rate of Eesti Energia's debt was 4.09%, which is 0.4 percentage points smaller than a year ago due to a decrease in the six months Euribor. The principle currency for Eesti Energia's debt is the euro. Eesti Energia has been given credit ratings of A1 with negative outlook by Moody’s and A- with negative outlook by Standard & Poor’s.
Leverage
27.0% 26.9%26.2%
23.5%24.2%
22.1%
24.4%
20%
25%
30%
2003
/04
2004
/05
2005
/06
2006
/07
2007
/08
2008
/09
2009
/10*
* - as at 31.12.2009
Borrowings / EBITDA
2.2 2.1
1.3 1.2
1.9
1.5
1.7
0.0
1.0
2.0
3.0
2003
/04
2004
/05
2005
/06
2006
/07
2007
/08
2008
/09
2009
/10*
* - as at 31.12.2009
Among Eesti Energia's long-term debt, the largest part is a Eurobond of 300 million euros with a fixed interest rate of 4.5% and maturity in 2020. The debt portfolio also contains loans from the Nordic Investment Bank (NIB) totalling 59.7 million euros, loan from the European Investment Bank with a loan balance of 13.0 million euros and a loan from Nordea with a loan balance of EUR 1 million. 80% of the current debt portfolio is with a fixed interest rate and a 20% floating interest rate (taking into account only the drawn volumes of the debt facilities). Amount of undrawn debt is 139 million euros.
Group liquidity risk is low
As of 31.12.2009 the Eesti Energia group held cash and other liquid investments worth 41.3 million euros. Closing of Elering sale to the Ministry of Economy and Communications on the 27th of January has substantially increased Group’s liquid assets. Sales revenue of Elering and repaid intra-Group debt will be source of financing for future investments.
Liquidity risk is small for the company in the medium term, which is also reflected by the strong credit ratings. The Group quick ratio was 2.7 at the end of the December.
The credit risk is the risk that the group’s clients and its trading partners do not fulfil their obligations. The maximum sum open to credit risk is the book value of outstanding customer receivables after the provisions for doubtful receivables.
Quick ratio
1.0 0.9
2.2
3.3
2.01.6
2.7
0.0
1.0
2.0
3.0
4.0
2003
/04
2004
/05
2005
/06
2006
/07
2007
/08
2008
/09
2009
/10*
* - as at 31.12.2009

17 Interim report • 31 December 2009
The proportion of doubtful receivables from total trade receivables has not changed substantially – it was 10.3% as at December 31 2008 and 10.8% at December 31 2009. The average settlement cycle length for invoices increased by 2 days within the past 12 months compared to the end of third quarter of 2008/09 fiscal year, standing at 38 days. At the same time we closely monitor client’s payment behaviour and we have dedicated unit in the Retail segment that is specialized in overdue accounts – they process, manage and develop the overdue accounts processes.
Eesti Energia paid dividends in the amount of finan cial year 2008/09 net profit
The Group paid dividends to owner in the amount of net profit of financial year 2009/10 87 million euros. Dividends were paid out in September (21 million euros) and in November (66 million euros).

18 Interim report • 31 December 2009
Short-term Outlook Economy
The Bank of Estonia forecasts, published on October 21 2009, for GDP real growth are -14.2% in 2009 and 1.4% in 2010. The forecast for harmonized consumer price index change in 2009 is 0.1%, for average wage growth -4.7% and for unemployment 14.5%.
Ministry of Finance forecasts, published on August 27 2009, for GDP real growth are -14.5% in 2009 and -2.0% in 2010. Slowdown is attributable to slowdown of private consumption and investments growth rate. The forecast for inflation is -0.1% in 2009, for average wage growth -5.7% and for unemployment rate 14.4%.
Domestic consumption of electricity is decreasing i n the recession
Rolling 12 month domestic electricity sales were 7,041 GWh at the end of December, that is 5.8% smaller than in the end of December 2008. The average temperature was 1.2 degrees lower in the last twelve months than in the corresponding period in 2008 December and the rolling 12 month adjusted domestic sales were 8.1% smaller than the rolling 12 months by the end of December 2008.
We forecast that domestic sales will be 7,017 GWh (-6.1%) by the end of the current financial year. The forecast predicts that the temperature next year will not exceed the historical average temperature that the increase in the sales of electric energy is forecasted on the basis of the Ministry of Finance GDP growth forecast and that sales to Elering are outside Group from the beginning of current financial year.
We forecast sales of thermal energy in the current financial year of 1,364 GWh, which is 19.3% less than in the previous financial year. The decrease in the sales amount comes from the smaller forecast for Iru Power Plant as the competition in the Tallinn district heating market has increased.
Distribution network losses
Distribution losses were 7.8% in the course of the past 12 months, which is 0.6 percentage points bigger than in the end of December 2008. In the financial year 2009/10 we forecast distribution losses to be 7.2%.
Nord Pool electricity price, emission allowances an d crude oil
Nord Pool Finland area electricity contracts for the first half of 2010 were concluded at the level of around 50 €/MWh from the beginning of second half of December 2009.
Year 2010 CO2 contracts were traded at around 13 €/t at the end of December 2009.
Brent futures point to continuation of the rising trend for price of crude oil – 2010 December deliveries were contracted on the 20th of January at the level of 81 $/barrel (average price in December 2009 was 75 $/barrel).
Fuel oil swaps also point to a continuous rise of the price of fuel oil – 2010 December deliveries were contracted on the 20th of January at the level 455 $/t (average price in December was 442 $/t).
From the beginning of summer 2007 we have been using light heating oil swaps to hedge the shale oil price risk. By the end of December 2009 we had fixed the price for about 50 000 tons of the year's forecasted shale oil production until the end of year 2012.
Group’s revenue and expenses will decrease
The Group’s 2009/10 financial year total revenue and other income will be affected by the slower growth of electricity consumption in Estonia which is caused by the decline of economic activity. We expect smaller sales revenue from electricity export as the price and volume will be lower, smaller volumes of heat sales as Iru Elektrijaam sales are projected to decline. We project that the shale oil sales revenue will grow as volume will increase. In our projections we assume that ambient air temperature will stay at its historical average, electricity exports price will develop in line with the forecast derived from current Nord Pool futures prices and taking into account the prices of futures already sold by the Group, domestic electricity price will be over reviewed twice a year and previously concluded future contracts. Operational expenses are projected to decline accordingly – technological fuel and CO2 emission allowances expenses will decline due to the lower generation volumes and decrease in fixed costs will come along with decline of labour and equipment repair and maintenance expenses.

19 Interim report • 31 December 2009
Overview of Segment’s Minerals, Oil, Biofuels – Eesti Energia Kaevandused AS (Mining), Eesti Energia Õlitööstus AS (Oil and Gas), Eesti Energia Tehnoloo giatööstus AS (Technology Industries), Oil Shale Energy of Jordan and Enefit Outotec Technology OÜ.
The aim of the segment is to maximize the value of oil shale starting from mining, and valuing oil shale through sustainable usage and selling of resources, production of fuel oils and gas and biofuels production.
The strategic aims of the segment are effective oil shale mining in Estonia, production of one million tons of liquid fuels per year in Estonia and opening of the oil shale energy complex in Jordan.
Eesti Energia Kaevandused AS (Mining) Oil shale is extracted in Ida-Virumaa in the stretch of the Estonian oil shale deposit from Kiviõli in the west to
the Narva River in the east, and from Jõhvi in the north to Väike-Pungerja in the south. The layer of oil shale is located at a depth of between 10 and 70 meters. Quarrying is used in the Aidu and Narva open quarries to extract oil shale, and underground mining in the Estonia and Viru mines. Oil shale extraction directly or indirectly employs 3,096 people within the structures of the Eesti Energia group and is the most labour intensive segment of the group. Oil shale production over the last 12 months was 14.0 million tons.
Eesti Energia Õlitööstus AS (Oil and Gas) EE Õlitööstus AS is engaged in production of liquid fuel and high-calorific-value retort gas from oil shale. Narva
Õlitööstus uses a unique and ultra-efficient solid heat carrier technology to produce liquefied fuels. In addition to the production units, Õlitööstus also has a certified laboratory, which organizes the taking of samples and conducts quality analysis of its output. The principal raw material used is low-calorific-value oil shale in all sizes, but the technology allows rubber particles and organic oil and petroleum waste to be used as well in the production of liquid fuels.
Shale oil is mostly used as fuel in both large and small boilers. The Oil Industry’s production amounted to 175,000 tons of shale oil in the last 12 months. The Oil Plant employs 184 people.
Eesti Energia Tehnoloogiatööstus AS (Technology Ind ustries) Eesti Energia Tehnoloogiatööstus deals with equipment and metal structures mainly for the energy sector,
including manufacturing, installation and maintenance. The company’s products are exported all over the world. The bigger clients include Alstom, Andritz, Foster Wheeler, Kvaerner Power, ABB, Roxon and many others. The company employs 775 people.
Enefit Outotec Technology OÜ Enefit Outotec Technology OÜ is joint venture by Eesti Energia and Outotec OY. The main aim of the joint
venture is selling the new generation Enefit fuel oil production technology.
Oil Shale Energy of Jordan Oil Shale Energy of Jordan (OSEJ) is a subsidiary of Eesti Energia acquired in late 2006. It is engaged in
researching the commercial opportunities in the field of oil shale, particularly oil and power production, in the Kingdom of Jordan. EE’s partner in Jordan is the Near East Group, which holds 24% of OSEJ.
Electricity and Heat Generation – Eesti Energia Nar va Elektrijaamad AS (Narva Power Plants), Eesti Energia AS Taastuvenergia ettevõte ( Renewable Energy), Eesti Energia AS Iru Elektrijaam (Iru Power Plant), AS Kohtla-Jär ve Soojus (Kohtla-Järve Heating), AS Narva Soojusvõrk (Narva Heating), OÜ Aulepa Tuulepa rgid (Aulepa Wind Farms), Eesti Energia AS Energiakaubandus (Energy Trading), Solid us OY, Eesti Energia Tabasalu Koostoomisjaam OÜ (Tabasalu CHP) and Nordic Energy Link AS
The aim of the segment is the generation of electrical energy and heat and energy trading in the wholesale market. The strategic aims of the segment are investments in new capacities for the security of supply, cutting CO2 emission in the generation of electricity and expanding the generation portfolio.
The Eesti Energia group currently has an installed capacity of 2,644 MW for the generation of electrical energy: Narva Power Plants 2,380 MW, Iru CHP Plant 190 MW, Aulepa Wind Park 39 GWh, Ahtme CHP Plant 30 MW and 1,517 MW of installed capacity for the generation of thermal energy: Iru CHP Plant 764 MW (incl. CHP part 400 MW), Narva Power Plants 484 MW (incl. peak and reserve boiler house 240 MW), Ahtme CHP plant 268 MW. 1,633 people are involved in the generation of electrical or thermal energy within the group. Over the last 12 months, generation in the electrical and thermal energy segment amounted to 7,179 GWh of electrical energy and 1,630 GWh of thermal energy.

20 Interim report • 31 December 2009
Eesti Energia Narva Elektrijaamad AS (Narva Power P lants) EE Narva Elektrijaamad AS is one of the leading producers and sellers of electricity in Estonia and the Baltic
region and a competitive company in line with environmental requirements. AS Narva Elektrijaamad supplies Estonian consumers with electricity and furnishes the city of Narva with heat as well as exporting electricity to the other two Baltic countries and to Finland. The company is also engaged sales of fly ash. The company employs 1,404 people.
AS Narva Soojusvõrk (Narva Heating) Narva Soojusvõrk buys, distributes and sells thermal energy and also maintains repairs and builds thermal
networks mainly in the city of Narva. 66% of the company is owned by Narva Elektrijaamad and 34% by city of Narva. The company employs 31 people.
Eesti Energia AS Iru Elektrijaam (Iru Power Plant) Iru Elektrijaam is a plant for the combined generation of electricity and heat. It has been in operation since
1978. Iru Power Plant is the largest heat producer and third largest electricity producer in Estonia. Iru Elektrijaam sells produced heat to Tallinna Küte AS, that supplies Tallinn Kesklinn, Lasnamägi and Maardu with heat. The company employs 53 people.
AS Kohtla-Järve Soojus (Kohtla-Järve Heating) Kohtla-Järve Soojus supplies the town of Jõhvi and Ahtme district with heat and sells electricity to Eesti
Energia. The company owns the oil-shale-based Ahtme combined power plant launched in 1951 and the heating networks in the Ahtme-Jõhvi district. 59.2% of the company is owned by Eesti Energia and 40.8% by OÜ VKG Energia. The company employs 107 people.
Eesti Energia AS Taastuvenergia ettevõte (Renewable Energy) Taastuvenergia Ettevõte has been operating in the Eesti Energia Group since 2002 and its goal is to operate
power plants to generate energy from renewable sources. The business unit employs 5 people.
OÜ Aulepa Tuulepargid (Aulepa Wind Farms) OÜ Aulepa Tuulepargid was established to construction and management of the biggest wind farm with
capacity 39 MW in the Baltic States - Aulepa wind farm - in Noarootsi, rural municipality in West county.
Eesti Energia AS Energiakaubandus (Energy Trading) From 1st of April 2007 Energiakaubandus operates as a separate business unit. Its main tasks are to manage
generation of electrical energy, Eesti Energia’s portfolio of contracts to sell or buy electricity, provide power balancing and open supplier services in Estonia and arrange electrical energy buy and sell transactions outside of Estonia. The business unit employs 16 people.
Solidus OY Solidus OY operates on the Nordic electricity markets as a member of Nordpool, managing electricity portfolios
for its clients and offering consultation and expert services related to operating on the electricity market and managing risks. Solidus OY was founded in 2005 and from 2006 the company is 100% owned by Eesti Energia. The company employs 8 people.
Eesti Energia Tabasalu Koostootmisjaam OÜ (Tabasalu CHP) Tabasalu CHP is joint venture by Eesti Energia and OÜ Strantum of building and operating co-generation unit
in Tabasalu. Eesti Energia owns 55% and Strantum 45% of the company.
Nordic Energy Link AS Nordic Energy Link was established as a subsidiary of Eesti Energia AS with the main objective to construct
and commission the Estlink cable. To administer the cable, the company AS Nordic Energy Link was founded, its shareholders being Eesti Energia (39.9%), Latvenergo (25%), Lietuvos Energija (25%) and Soome Finestlink (10.1%).
Retail Business – Eesti Energia Jaotusvõrk OÜ (Dist ribution Network), Energiamüük (Energy Sales), Eesti Energia Võrguehitus AS (Netwo rk Construction), Eesti Energia Elektritööd AS (Electrical Works), SIA Enefit, UAB Enefit, Eesti Energia AS Müük ja Teenindus (Sales and Customer Service) and Televõrg u AS (Telecommunications Network)
The aim of the segment is to offer the following services to clients: electricity, heat, distribution network, telecommunication and services related to energy.
The strategic aims of the segment are product enhancements, expanding the client base and renovation of the Estonian power grid.

21 Interim report • 31 December 2009
Eesti Energia Jaotusvõrk OÜ (Distribution Network) The function of the Distribution Network is to distribute electricity to end consumers through the 35 KW and
under low and medium-voltage power grid as well as manage these grids. The company employs 755 people.
Enefit SIA Enefit SIA is Eesti Energia’s subsidiary in Latvia. The company’s main areas of activity are the sales of electric
energy to end consumers in Latvia as well as the provision of services to corporate customers interested in hedging risks related to changes in electricity prices. The company employs 5 people.
Enefit UAB Enefit UAB is Eesti Energia’s subsidiary in Lithuania. The company’s main areas of activity are trade and
consultancy in electricity, including the sales of electric energy to end consumers in Lithuania. The company employs 1 person.
Eesti Energia Võrguehitus AS (Network Construction) Eesti Energia Network Building is a joint venture based on uniting Electrical Services and Elpec. The company
will offer services that are bound to electrical network before connection point, id est designing, building and maintenance of electrical network. Company employs 259 people.
Eesti Energia Elektritööd AS (Electrical Works) Eesti Energia Electrical Works offers market-base electrical services that stay inside network of the client’s
connection point, for example repairing faults of households and companies indoors, scheduled repair and maintenance services. Company employs 67 people.
Eesti Energia AS Müük ja Teenindus (Sales and Custo mer Service) Eesti Energia AS Teenindus is engaged in maintaining and developing customer relations, servicing clients
and offering them different services and products. Eesti Energia has over 493,600 customers, including about 25,600 business customers. Company employs 296 people.
Eesti Energia AS Energiamüük (Energy Sales) Eesti Energia AS Energiamüük is engaged in development and sales of electricity and related products.
Company employs 13 people.
Televõrgu AS (Telecommunications Network) Televõrgu AS provides a domestic and international data communications trunk network service to operator
firms in the telecommunications sector. The company employs 57 people.

22 Interim report • 31 December 2009
Consolidated Statement of Financial
Position
CONSOLIDATED STATEMENT OF FINANCIAL POSITION in thousand EUR
31 March NoteASSETS 2009 2008 2009
Non-current assetsProperty, plant and equipm ent 1,202,838 1,437,328 1,459,292 4Intangible as sets 15,211 9,381 11,138Inves tm ents in as sociates 11,780 11,262 11,412Derivative financial ins trum ents 244 5,366 7,862 5Long-term receivables 177 90 338Total non-current assets 1,230,250 1,463,428 1,490,042
Current assetsInventories 39,763 30,889 29,313Greenhous e gas allowances - 25,780 25,780Trade and other receivables 279,434 97,830 114,599Derivative financial ins trum ents 2,710 15,550 18,166 5Financial ass ets at fair valuethrough profit or los s 426 990 2,014Depos its with m aturities greater than three m onths at banks 5,100 25,100 25,100Cash and cas h equivalents 36,212 82,646 97,181Total current assets 363,646 278,784 312,153
Assets of disposal group classified as held for sal e 362,951 - - 11
Total assets 1,956,847 1,742,212 1,802,195
EQUITY
Capital and reserves attributable to equity holder of the Parent CompanyShare capital 471,646 471,817 471,817 6Share prem ium 258,799 259,833 259,833Statutory res erve capital 47,182 47,182 47,182Hedge reserve -3,140 19,856 24,549Unrealised exchange rate differences -2 -2 -13Retained earnings 343,052 316,070 353,581Total equity and reserves attributable to equity ho lder of the Parent Company 1,117,536 1,114,756 1,156,9 48
Minority interest 2,705 2,728 3,232
Total equity 1,120,242 1,117,483 1,160,180
LIABILITIES
Non-current liabilitiesBorrowings 358,902 322,146 321,654 8Trade payables 86 180 86Derivate financial ins trum ents 3,873 - 740 5Deferred incom e 116,870 122,531 125,184Provis ions 21,213 27,653 20,186Total non-current liabilities 500,945 472,511 467,848
Current liabilitiesBorrowings 3,505 8,601 7,687 8Trade and other payables 109,342 111,427 125,616Derivative financial ins trum ents 2,086 - 1 5Deferred incom e 215 215 215Provis ions 2,766 31,975 40,647Total current liabilities 117,914 152,218 174,166
Liabilities of disposal group classified as held fo r sale 217,746 - - 11
Total liabilities 836,605 624,729 642,014
Total liabilities and equity 1,956,847 1,742,212 1,802,195
31 December

23 Interim report • 31 December 2009
Consolidated Statement of Comprehensive
Income
CONSOLIDATED INCOME STATEMENTin thousand EUR
Note
2009 2008 2009 2008 2009 2008
CONTINUING OPERATIONSRevenue 179,924 189,756 459,410 475,114 649,772 633,982 2
Other operating income 3,402 612 10,912 4,489 12,490 5,976Government grants 17 1,250 45 2,313 70 3,013
Change in inventories of finishedgoods and work-in-progress 7,365 456 10,924 3,246 11,568 7,741
Raw materials and consumables used -78,974 -99,756 -183,866 -228,383 -267,334 -315,462Other operating expenses -10,994 -14,344 -49,703 -46,288 -64,767 -72,032Payroll expenses -30,953 -32,467 -88,592 -96,412 -123,608 -129,487
Depreciation, amortisation and impairment -23,326 -22,203 -69,265 -64,715 -100,359 -90,870
OPERATING PROFIT 46,461 23,303 89,865 49,364 117,833 42,860 2
Financial income 3,022 8,160 9,775 16,382 13,076 20,783
Financial expenses -3,434 -4,747 -10,648 -14,195 -15,034 -18,913Total financial income and expenses -412 3,413 -873 2,1 86 -1,958 1,869
Gain from associates using equity method 368 442 368 442 1,668 1,015
PROFIT BEFORE TAX 46,417 27,158 89,360 51,992 117,543 45,745CORPORATE INCOME TAX EXPENSE - -8 -14,672 -10,704 -14,672 -10,758PROFIT FROM CONTINUING OPERATIONS 46,417 27,150 74,688 41,289 102,871 34,987
PROFIT/LOSS FROM DISCONTINUED OPERATIONS 12,821 9,944 1,134 7,620 10,966 12,943 11
PROFIT FOR THE YEAR 59,239 37,093 75,822 48,909 113,837 47,930ATTRIBUTABLE TO:
Equity holders of the Parent Company 58,835 36,871 76, 351 49,534 113,862 48,197Minority interest 404 223 -529 -625 -25 -268
Basic earnings per share (euros) 0.80 0.50 0.69 0.67 1.54 0.65 7Diluted earnings per share (euros) 0.80 0.50 0.69 0.67 1.54 0.65 7
CONSOLIDATED STATEMENT OF COMPREHENSIVE INCOME in thousand EUR
2009 2008 2009 2008 2008/2009 2007/2008
PROFIT FOR THE YEAR 59,239 37,093 75,822 48,909 113,837 47,930
Other comprehensive incomeRevaluation of risk hedge instruments -9,915 75,082 -27,689 54,810 -22,996 46,323
Currency translation differences attributable toforeign subsidiaries -2 -3 11 -12 -1 3Other comprehensive income for the year -9,917 75,080 -27,678 54,798 -22,996 46,326
COMPREHENSIVE INCOME FOR THE YEAR 49,322 112,173 48,144 103,707 90,841 94,256ATTRIBUTABLE TO:
Equity holders of the Parent Company 48,918 111,950 48 ,673 104,332 90,866 94,523Minority interest 404 223 -529 -625 -25 -268
3 months 9 months1 October - 31 December 1 April - 31 December
3 months 9 months1 October - 31 December 1 April - 31 December
12 months1 January - 31 December
12 months1 January - 31 December

24 Interim report • 31 December 2009
Consolidated Statement of Cash Flow
CONSOLIDATED STATEMENT OF CASH FLOWS in thousand EUR
2009 2008 2009 2008 2008/2009 2007/2008Cash flows from operating activities
Cash flows from operating activities from continuin g operationsCash generated from operations 60 204 25 648 149 012 86 364 194 008 114 928Interest and loan fees paid -14 552 -14 510 -15 442 -15 755 -15 616 -15 965
Interest received 3 474 5 100 10 775 14 662 13 380 18 292Corporate income tax paid -14 689 -10 750 -14 756 -10 750 -14 758 -10 750Net cash generated from operating activities from continuing operations 34 437 5 488 129 588 74 521 177 014 106 504Net cash generated from operating activities from discontinued operations -5 591 10 618 6 117 23 508 26 632 34 473Net cash generated from operating activities 28 846 16 106 135 705 98 029 203 646 140 977
Cash flows from investing activitiesCash flows from investing activities from continuin g operationsPurchase of property, plant and equipment and intangible assets -67 888 -51 228 -154 986 -138 013 -204 722 -188 841Proceeds from connection and other fees 2 792 4 111 9 153 16 681 12 485 23 856Proceeds from sale of property, plant and equipment 4 599 1 432 5 209 3 704 5 297 3 923
Net change in deposits with maturit ies greater than 3 months 72 941 44 000 20 000 113 090 20 000 139 679Purchase of short-term financial investments -4 740 -5 149 -14 511 -13 068 -20 306 -21 294
Dividens received from long-term financial investments - - 31 833 - 31 833 1 229Loans granted to employees - - -2 - -2 -
Loan repayments received from employees 1 - 1 - 1 -Change in overdraft granted to discontinued operations -16 948 3 126 -48 162 -8 050 -32 140 519
Proceeds from sale and redemption of short-term financial investments 6 703 8 308 16 159 18 917 20 952 29 392Net cash used in investing activities from continuing operations -2 540 4 600 -135 307 -6 739 -166 602 -11 538Net cash used in investing activities from discontinued operations -11 371 -7 492 -23 611 -31 558 -28 104 -33 954Net cash used in investing activities -13 911 -2 892 -158 917 -38 298 -194 706 -45 492
Cash flows from financing activitiesCash flows from financing activities from continuin g operationsReceived long-term bank loans 1 020 - 41 020 - 41 020 -
Repayments of bank loans -2 253 -3 162 -8 319 -7 006 -9 000 -7 006Repayments of f inance lease liabilities - -26 - -52 - -65
Change in overdraft - -77 -0 731 -915 915Proceeds from minority interests - - 2 - 2 -Payment of transaction costs related to issuance of new shares -1 034 - -1 034 - -1 034 -
Dividends paid -66 212 -41 670 -86 920 -41 670 -86 920 -41 670Net cash used in financing activities from continuing operations -68 480 -44 935 -55 251 -47 997 -56 846 -47 826Net cash used in financing activities from discontinued operations 16 963 -3 126 17 494 8 050 1 472 -519Net cash used in financing activities -51 517 -48 061 -37 757 -39 946 -55 374 -48 345
Net cash flows -36 582 -34 847 -60 969 19 785 -46 434 47 140
Cash and cash equivalents at the beginning of the period 72 794 117 494 97 181 62 861 82 646 35 506Cash and cash equivalents at the end of the period 36 212 82 646 36 212 82 646 36 212 82 646Net increase/(-)decrease in cash and cash equivalen ts -36 582 -34 847 -60 969 19 785 -46 434 47 140
12 months1 January - 31 December
9 months3 months1 October - 31 December 1 April - 31 December

25 Interim report • 31 December 2009
Consolidated Statement of Changes in
Equity
CONSOLIDATED STATEMENT OF CHANGES IN EQUITY in thousand EUR
Minority TotalShare Unregiste- Share Statutory Other Retained Total interest equitycapital red share premium legal reserves earnings(note 7) capital reserve
Equity as at 31 March 2008 467,909 3,907 259,833 46,490 -34,944 308,899 1,052,094 3,353 1,055,447
Comprehensive incomeComprehensive income for the year - - - - 54,798 49,534 104,332 -625 103,707
Transactions with ownerIncrease of the share capital(according to Government orderNo. 97 from 27th February 2008) 3,907 -3,907 - - - - - - -Transfer of retained earningsto reserve capital - - - 692 - -692 - - -Dividends paid - - - - - -41,670 -41,670 - -41,670Total transactions with owner 3,907 -3,907 - 692 - -42,362 -41,670 - -41,670
Equity as at 31 December 2008 471,817 - 259,833 47,182 19,854 316,070 1,114,756 2,728 1,117,483
Equity as at 31 March 2009 471,817 - 259,833 47,182 24,536 353,581 1,156,948 3,232 1,160,180
Comprehensive incomeComprehensive income for the year - - - - -27,678 76,351 48,673 -529 48,144
Transactions with ownerReduction of the share capital(according to Government orderNo. 502 from 11th December 2008) -171 - - - - 40 -131 - -131(Note 6)Proceeds from minority interests - - - - - - - 2 2Payment of transaction costs related to issuance of new shares - - -1,034 - - - -1,034 - -1,034Dividends paid - - - - - -86,920 -86,920 - -86,920Total transactions with owner -171 - -1,034 - - -86,880 -88,085 2 -88,083
Equity as at 31 December 2009 471,646 - 258,799 47,182 -3,142 343,052 1,117,536 2,705 1,120,242
Attributable to equity holder of the Company

26 Interim report • 31 December 2009
Notes to the Consolidated Financial Statements 1. Accounting Policies
This consolidated interim report has been prepared in accordance with International Financial Reporting Standards (IFRS) as adopted by the European Union. These consolidated interim condensed financial statements are prepared in accordance with IAS 34 'Interim Financial Reporting'.
Accounting policies and presentation of financial statements applied to this interim report were identical to those used in financial statements for the financial year that ended 31 March 2009, excluding changes in the presentation of dividend and interest income in the segment reporting and changes from IAS 23 "Borrowing Costs" and IAS 1 "Presentation of Financial Statements" in the recognition of borrowing costs and presentation of main financial statements. In addition compared with the interim statement of 30 September 2009 the presentation of interest income received from the discontinued operations has been changed in the income statement.
In the segment reporting the presentation of interest and dividend income received from the subsidiaries has been changed and as the result the interest and dividend income is not included in the operating profit but is classified as financial income instead. Interest income received from discontinued operations is also classified as financial income.
IAS 23 "Borrowing Costs" (revised) became mandatory for the Group from 1 April 2009. The amended IAS 23 requires borrowing costs that are directly attributable to acquisition, construction or production of a qualifying asset that necessarily takes a substantial period of time to get ready for its intended use or sale to be immediately capitalised as part of the cost of the asset. The standard eliminates the option of immediately recognising such borrowing costs as expenses. The amended standard will be effective prospectively for asset-related borrowing costs to be incurred after 1 April 2009. Borrowing costs in the Group are capitalised as part of the assets acquisition cost starting 1 April 2009 according to IAS 23 requirements.
IAS 1 "Presentation of Financial Statements" (revised) became mandatory for the Group from 1 April 2009. The main amendment to IAS 1 is the replacement of the income statement with the statement of comprehensive income which also includes non-owner changes in equity, such as changes in the revaluation reserve of available-for-sale assets. Two statements are allowed to be presented as an alternative: a separate income statement and a statement of comprehensive income. The amended standard also requires the disclosure of the financial position (balance sheet) for the opening balances of the comparable period when comparative information has been adjusted due to reclassifications, changes in accounting policies or correction of errors. The amended standard will primarily have an effect on the presentation of financial statements but not the recognition of transactions and balances as well as accounting policies. According to IAS 1 amendments a separate income statement and a statement of comprehensive income is presented.
Remainder of the amendments do not have importance from the Group's business perspective and do not have an impact on the Group's financial statements.
According to the Management Board the Interim Report prepared for the period 1 April 2009 - 31 December 2009 presents a true and fair view of the financial position, the cash flows and the results of operations of Eesti Energia AS and its subsidiaries (Group).
The information contained in the Interim Financial Statements has not been audited.
2. Segment Reporting For segment reporting purposes, the division into operating segments is based on the company's internal
management structure, which is the basis for the reporting system, performance assessment and the allocation of resources by the chief operating decision maker, the parent company's management board.
The internal management structure of the Group is divided into three operating segments based on the different types of products offered and the clients:
• Retail Business • Electricity and Heat Generation • Minerals, Oil, Biofuels
In addition Corporate Functions are presented separately, although these do not form a separate business segment.
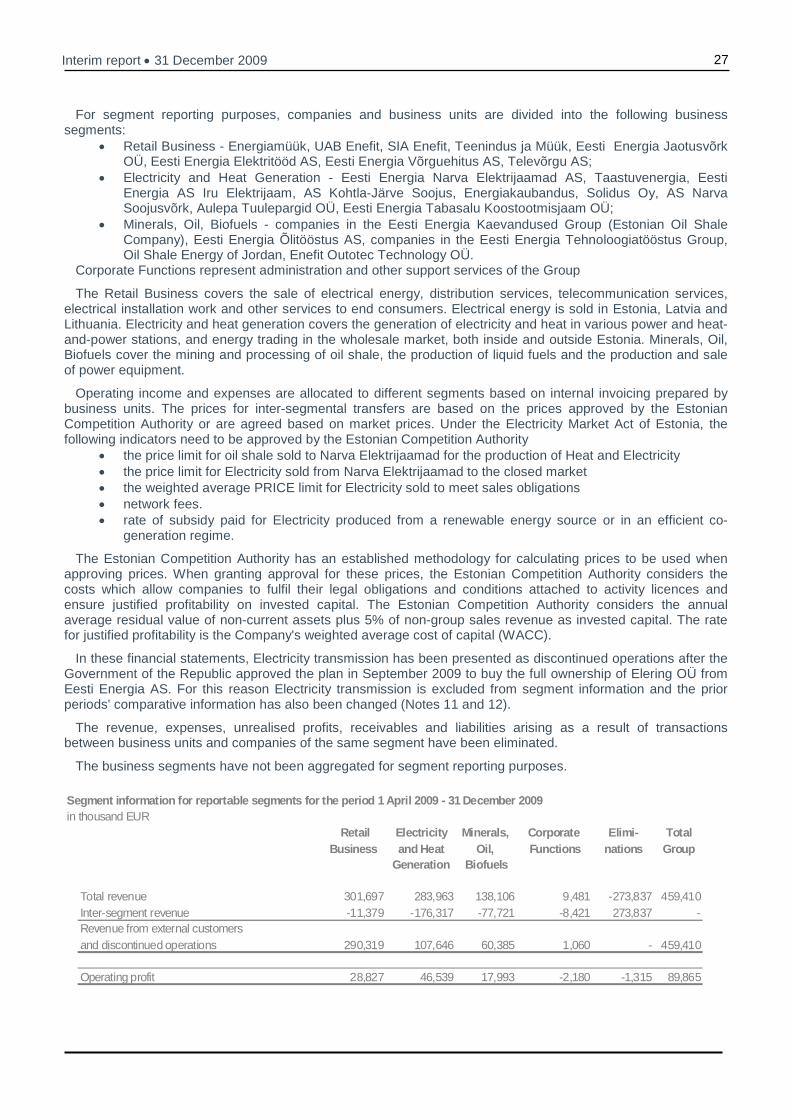
27 Interim report • 31 December 2009
For segment reporting purposes, companies and business units are divided into the following business segments:
• Retail Business - Energiamüük, UAB Enefit, SIA Enefit, Teenindus ja Müük, Eesti Energia Jaotusvõrk OÜ, Eesti Energia Elektritööd AS, Eesti Energia Võrguehitus AS, Televõrgu AS;
• Electricity and Heat Generation - Eesti Energia Narva Elektrijaamad AS, Taastuvenergia, Eesti Energia AS Iru Elektrijaam, AS Kohtla-Järve Soojus, Energiakaubandus, Solidus Oy, AS Narva Soojusvõrk, Aulepa Tuulepargid OÜ, Eesti Energia Tabasalu Koostootmisjaam OÜ;
• Minerals, Oil, Biofuels - companies in the Eesti Energia Kaevandused Group (Estonian Oil Shale Company), Eesti Energia Õlitööstus AS, companies in the Eesti Energia Tehnoloogiatööstus Group, Oil Shale Energy of Jordan, Enefit Outotec Technology OÜ.
Corporate Functions represent administration and other support services of the Group
The Retail Business covers the sale of electrical energy, distribution services, telecommunication services, electrical installation work and other services to end consumers. Electrical energy is sold in Estonia, Latvia and Lithuania. Electricity and heat generation covers the generation of electricity and heat in various power and heat-and-power stations, and energy trading in the wholesale market, both inside and outside Estonia. Minerals, Oil, Biofuels cover the mining and processing of oil shale, the production of liquid fuels and the production and sale of power equipment.
Operating income and expenses are allocated to different segments based on internal invoicing prepared by business units. The prices for inter-segmental transfers are based on the prices approved by the Estonian Competition Authority or are agreed based on market prices. Under the Electricity Market Act of Estonia, the following indicators need to be approved by the Estonian Competition Authority
• the price limit for oil shale sold to Narva Elektrijaamad for the production of Heat and Electricity • the price limit for Electricity sold from Narva Elektrijaamad to the closed market • the weighted average PRICE limit for Electricity sold to meet sales obligations • network fees. • rate of subsidy paid for Electricity produced from a renewable energy source or in an efficient co-
generation regime.
The Estonian Competition Authority has an established methodology for calculating prices to be used when approving prices. When granting approval for these prices, the Estonian Competition Authority considers the costs which allow companies to fulfil their legal obligations and conditions attached to activity licences and ensure justified profitability on invested capital. The Estonian Competition Authority considers the annual average residual value of non-current assets plus 5% of non-group sales revenue as invested capital. The rate for justified profitability is the Company's weighted average cost of capital (WACC).
In these financial statements, Electricity transmission has been presented as discontinued operations after the Government of the Republic approved the plan in September 2009 to buy the full ownership of Elering OÜ from Eesti Energia AS. For this reason Electricity transmission is excluded from segment information and the prior periods' comparative information has also been changed (Notes 11 and 12).
The revenue, expenses, unrealised profits, receivables and liabilities arising as a result of transactions between business units and companies of the same segment have been eliminated.
The business segments have not been aggregated for segment reporting purposes.
Segment information for reportable segments for the period 1 April 2009 - 31 December 2009in thousand EUR
Retail Electricity Minerals, Corporate Elimi- TotalBusiness and Heat Oil, Functions nations Group
Generation Biofuels
Total revenue 301,697 283,963 138,106 9,481 -273,837 459,410Inter-segment revenue -11,379 -176,317 -77,721 -8,421 273,837 -Revenue from external customersand discontinued operations 290,319 107,646 60,385 1,060 - 459,410
Operating profit 28,827 46,539 17,993 -2,180 -1,315 89,865

28 Interim report • 31 December 2009
Segment information for reportable segments for the period 1 April 2008 - 31 December 2008in thousand EUR
Retail Electricity Minerals, Corporate Elimi- TotalBusiness and Heat Oil, Functions nations Group
Generation Biofuels
Total revenue 292,807 299,221 151,426 7,296 -275,636 475,114Inter-segment revenue -13,731 -165,119 -90,721 -6,065 275,636 -Revenue from external customersand discontinued operations 279,076 134,102 60,705 1,231 - 475,114
Operating profit 23,954 19,816 8,166 -2,691 120 49,364
Reportable segments’ operating profits are reconcil ed to total consolidated operating profit as follow s:in thousand EUR
2009 2008
Segment operating profits for reportable segments 91,180 49,244Eliminations:Profits/losses from intra-segment sales of property, plant and equipment -668 -318Other eliminations -647 438Total operating profit per consolidated income stat ement 89,865 49,364
9 months1 April - 31 December
3. Seasonality of Operating Profit Temperature is the most important factor influencing the domestic electricity and heat demand. Lower
temperatures in winter induce higher energy consumption and thus higher revenues and operating profit. In summer, higher temperatures lead to lower electricity and heat consumption and correspondingly to lower revenues and lower operating profit.
4. Property, Plant and Equipment
Property, Plant and Equipmentin thousand EUR
Land Buildings Const- Plant and Other Totalruction equipment
Property, plant and equipment as at 31 March 2009Cost 17 485 166 025 974 897 1 260 473 5 012 2 423 891Accumulated depreciation - -82 756 -403 719 -576 676 -3 967 -1 067 119Net book amount 17 485 83 269 571 177 683 796 1 045 1 356 773Construction in progress - 404 30 104 57 462 - 87 971Prepayments 127 4 1 980 12 437 - 14 548 Total property, plant and pquipment as at 31 March 2009 17 612 83 677 603 262 753 695 1 045 1 459 292
Movements 1 April - 31 December 2009Purchases of property, plant and equipment 27 643 1 297 39 528 80 166 84 148 719Depreciation charge - -3 287 -17 588 -47 622 -315 -68 811Net book amount of non-current assets disposed -312 -3 338 - -511 - -4 161 including assets disposed to discontinued operations -308 -3 304 - - - -3 612
Transfer to disposal group at net book value -3 232 -9 534 -181 108 -138 162 -33 -332 070Assets transferred at net book value as a result of non-monetary disbursement-13 -118 - - - -131Reclassified at net book amount - -349 349 - - -Exchange differences - - - - - -

29 Interim report • 31 December 2009
Property, Plant and Equipmentin thousand EUR
Land Buildings Const- Plant and Other Totalruction equipment
Movements 1 April - 31 December 2009 24,086 -15,328 -158,820 -106,128 -264 -256,454Property, plant and equipment as at 31 December 200 9Cost 41,687 148,189 696,639 1,146,363 4,932 2,037,809Accumulated depreciation - -81,066 -280,970 -548,527 -4,150 -914,713Net book amount 41,687 67,123 415,669 597,836 781 1,123,096Construction in progress - 1,226 26,246 29,388 - 56,860Prepayments 11 - 2,528 20,343 - 22,882Total property, plant and equipment as at 31 Decemb er 2009 41,698 68,349 444,443 647,567 781 1,202,838
5. Derivative Financial Instruments
Derivative Financial Instrumentsin thousand EUR
Assets Liabilities Assets LiabilitiesForward and option contracts for buying and selling electricity 1,985 21 7,704 -Swap contracts for selling oil 969 5,938 13,212 -Total derivative financial instruments 2,954 5,960 20,916 -
including non-current portion:Forward contracts for buying and selling electricity 1,741 - 420 -Swap contracts for selling oil 969 3,873 4,946 -Total non-current portion 2,710 3,873 5,366 -
Total current portion 244 2,086 15,550 -
31 December 2009 31 December 2008
Forward, future and option contracts for buying and selling electricity The goal of the forward, future and option contracts for buying and selling electricity is to hedge changes in the
price of electricity or earn income on changes in the price of electricity on the Nordic electricity exchange Nord Pool. All contracts have been entered into for the sale or buying of a fixed volume of electricity at each trading hour and their price is denominated in Euros. The transactions, the goal of which is to hedge the risk in the price of electricity, are designated as cash flow hedging instruments, where the underlying instrument being hedged is the estimated electricity transactions of high probability on the Nordic electricity exchange Nord Pool. The effective portion of the change in fair value of transactions concluded for hedging purposes is included in the appropriate reserve in equity and is accounted for either as a gain or loss at the time the sales transactions of electricity occur or when it is evident that sales transactions are unlikely to occur in a given period. Fair value changes of the transactions for the purpose of earning income from the change in prices of electricity are recognised as gains or losses in the income statement. The basis for determining the fair value of transactions is the quotes on Nord Pool.
Changes in forward, future and option contracts for buying and selling electricityin thousand EUR 2009 2008
Fair value at the beginnig of the period 9,152 567Change in fair value, including 1,214 7,276 change in fair value recognised in income statement 324 25 change in fair value recognised in hedge reserve 890 7,251Settled in cash (+paid/-collected) -8,402 -139
Fair value at the end of the period 1,964 7,704
1 April - 31 December

30 Interim report • 31 December 2009
Future and option contracts for buying and selling greenhouse gas emissions allowances
The option contracts for buying and selling greenhouse gas emission allowances are concluded together with electricity option contracts and their goal is to earn income from the change in prices. The fair value changes of these transactions are recognised as gains or losses in the income statement. The fair value changes of future contracts of greenhouse gas emissions allowances are also recognised as gains and losses in the income statement if the purpose of these transactions is no longer the acquiring the greenhouse gas emission allowances. The basis for determining the fair value of transactions is the quotes on SEB Futures. The prices are denominated in Euros.
Changes in future and option contracts for buying a nd selling greenhouse gas
emissions allowances 2009 2008in thousand EUR
Fair value at the beginnig of the period 445 -
Change in fair value, including -12,189 60
change in fair value recognised in income statement -12,189 60
Settled in cash (+paid/-collected) 11,744 -60
Fair value at the end of the period - -
1 April - 31 December
Swap and future contracts for buying and selling oi l
The goal of the swap and future contracts for buying and selling oil is to hedge the risk of price changes for shale oil. The swap transactions have been concluded for the sale of a specified volume of oil in future periods and they are designated as cash flow hedging instruments, where the underlying instrument to be hedged is highly probable shale oil sales transactions. The fair value changes of future contracts are recognised as gains and losses in the income statement. The basis for determining the fair value of transactions is the quotes by Platt's European Marketscan, Nymex and SEB Futures. The prices of swap contracts are denominated in Euros. The prices of future contracts are denominated in US dollars.
Changes in swap and future contracts for buying and selling oilin thousand EUR 2009 2008
Fair value at the beginnig of the period 15,690 -36,058Change in fair value, including -17,471 41,752 change in fair value recognised in income statement 39 - change in fair value recognised in hedge reserve -17,509 41,752Settled in cash (+paid/-collected) -3,189 7,518
Fair value at the end of the period -4,969 13,212
1 April - 31 December
Forward contract for foreign currency sale As at 30 June 2008 the foreign currency forward contract comprised the contract entered into on 10 January
2008 for the sale of EUR 10 000 thousand, at an exchange rate which is higher than the official exchange rate of the Bank of Estonia.
Changes in forward contract for the sale of foreign currenciesin thousand EUR 2009 2008
Fair value at the beginnig of the period - 89Settled in cash (+paid/-collected) - -89
Fair value at the end of the period - -
1 April - 31 December

31 Interim report • 31 December 2009
Other future and option contracts
The goal of the other future and option contracts is to earn income on the price changes and the fair value changes are recognised as gains and losses in the income statements. The basis for determing the fair value of transactions is the quotes of SEB Futures. The prices of transactiosn are denominated in US dollars.
Changes in other future and option contractsin thousand EUR 2009 2008
Fair value at the beginnig of the period - -Change in fair value -3 - change in fair value recognised in income statement -3 -Settled in cash (+paid/-collected) 3 -
Fair value at the end of the period - -
1 April - 31 December
6. Decreasing the Share Capital Entry for decreasing Eesti Energia AS share capital was made in the commercial register in June 2009. Share
capital was decreased by EUR 171 thousand to 471 645 725 Euros by abolishing 267 420 share with nominal value of 6.40 Euros. In September 2009 a non-monetary disbursement was made by Eesti Energia to Estonian Republic by delivering building on Telliskivi street in Tallinn with nominal value of EUR 171 thousand.
7. Earnings per Share Basic earnings per share are calculated by dividing profit attributable to the equity holders of the company by
the weighted average number of ordinary shares outstanding. As there are no potential ordinary shares, diluted earnings per share equal to basic earnings per share all the periods.
2009 2008 2009 2008 2008/2009 2007/2008Profit attributable to the equity holders of the company (th. EUR) 58,835 36,871 76,351 49,534 113,862 48,197Weighted average number of shares (th.) 73,797 73,823 110,717 73,823 73,814 73,721Basic earnings per share (EUR) 0.80 0.50 0.69 0.67 1.54 0.65Diluted earnings per share (EUR) 0.80 0.50 0.69 0.67 1.54 0.65
12 months1 January - 31 December
3 months 9 months1 October - 31 December 1 April - 31 December
8. Nominal Value and Amortised Cost of Borrowings Nominal Value and Amortised Cost of Borrowingsin thousand EUR
Nominal Amortised Nominal Amortised value cost value cost
Short- term borrowingsOverdraft - - 915 915Current portion of long-term bank loans 3,505 3,505 7,687 7,687Finance lease liabilities - - - -Total short-term borrowings 3,505 3,505 8,601 8,601
Long- term borrowingsBank loans 70,133 69,840 33,931 33,830Bonds issued 300,000 289,062 300,000 288,316Total long- term borrowings 370,133 358,902 333,931 322,146Total borrowings 373,638 362,407 342,532 330,747
31 December 2009 31 December 2008

32 Interim report • 31 December 2009
9. Contingent Liabilities Collaterals, guarantees and court actions
The loan agreements concluded by the Group set certain covenants on the Group’s consolidated financial indicators. The covenants have been adhered to.
Foster Wheeler Energia Oy has launched a commercial dispute against Eesti Energia Narva Elektrijaamad AS in the arbitrage court of London and submitted its initial claim of EUR 31 170 thousand for the payment of renovation costs. By the end of the reporting period, the outstanding balance due from Eesti Energia Narva Elektrijaamad AS amounted to EUR 22 006 thousand, subject to withholding until the start-up of the power blocks. Due to the delay in the renovation works and violation of contractual terms, Eesti Energia Narva Elektrijaamad AS has filed a counterclaim against Foster Wheeler Energia Oy for of EUR 44 514 thousand. Management believes the claim of Foster Wheeler Energia Oy is not founded in total amount. The dispute over responsibilities of the parties was delivered by arbitrage court in October 2008. The court proceeding over the financial claims took place in September 2009, but at the date of preparation of these financial statements the final judgement of the arbitrage is not known.
10. Related Party Transactions The sole shareholder of Eesti Energia AS is the state. In preparing the Group's financial statements, the
related parties include associates, members of the management and supervisory board of the parent company, and other companies over which these persons have significant influence. Related parties also include state-controlled companies. Continuing operations
2009/10 2008/09Transactions with associates
Purchase of goods and services 13,889 21,123Purchase of equipment 46 -Proceeds from sale of goods and services 2,813 3,059
1 April - 31 December
No impairment loss from receivables was recognised in the reporting period and in the comparable period.
Upon premature termination of the service contract with a member of the Management Board, the service contracts stipulate the payment of 3 months' remuneration as termination benefits. Transactions with the other related parties were concluded on the following conditions:
• In purchasing and selling electricity, the prices set by the Estonian Competition Authority are used • All other transactions are concluded using agreed prices.
11. Discontinued Operations In this interim report Elering OÜ operations have been presented as discontinued operations as the
Government of the Republic approved the plan in August 2009 to buy the full ownership of Elering OÜ from Eesti Energia AS. Elering was 100% subsidiary of Eesti Energia AS and represented the Electricity transmission segment. The transaction was completed January 27, 2010 (Note 12).

33 Interim report • 31 December 2009
Analysis of the results of discontinued operationsin thousand EUR 2009/10 2008/09
Revenue 48,852 54,951Expenses -39,561 -47,331Profit before tax of discontinued operations 9,290 7,620
Corporate income tax expense -8,156 -
Profit after tax of discontinued operations 1,134 7,620
Assets of disposal group classified as held for sal ein thousand EUR 2009 2008
Property, plant and equipment 350,022 -Trade and other receivables 12,929 -Total assets of discontinued operations 362,951 -
Liabilities of disposal group classified as held fo r salein thousand EUR 2009 2008
Borrowings and unamortized loan fees -192 -Trade and other payables 204,926 - including overdraft from parent company 187,619 -Non-current deferred income 13,013 -Total liabilities of discontinued operations 217,746 -
1 April - 31 December
31 December
31. detsember
12. Events After the Balance Sheet Date As at 27 January 2010 the transaction was completed, during which 100% ownership of Elering OÜ was
transferred from Eesti Energia AS to the Republic of Estonia for EUR 172,6 million.