
Interim Management Statement as at 31 March 2016 (3rd ......Bruno Soresina Director (3) Dario Treves...
70
Interim Management Statement as at 31 March 2016 (3rd quarter of fiscal year 2015/2016) Digital Bros S.p.A. Via Tortona, 37 – 20144 Milan, Italy VAT and tax identification no. 09554160151 Share capital: 5,644,334.80 euros fully paid-in Reg. of Co. Court of Milan 290680 - Vol. 7394 Chamber of Commerce 1302132 This report can be downloaded from the Company’s website at www.digitalbros.com in the Investors section
Transcript of Interim Management Statement as at 31 March 2016 (3rd ......Bruno Soresina Director (3) Dario Treves...

Interim Management Statement
as at 31 March 2016
(3rd quarter of fiscal year 2015/2016)
Digital Bros S.p.A.
Via Tortona, 37 – 20144 Milan, Italy
VAT and tax identification no. 09554160151
Share capital: 5,644,334.80 euros fully paid-in
Reg. of Co. Court of Milan 290680 - Vol. 7394 Chamber of Commerce 1302132
This report can be downloaded from the Company’s website
at www.digitalbros.com in the Investors section

Digital Bros Group Interim Management Statement at 31 March 2016
2
(page intentionally left blank)

Digital Bros Group Interim Management Statement at 31 March 2016
3
Contents
Officers and control bodies 4
Directors’ report 6
1. Group structure 6
2. The video games market 10
3. Seasonal trends 13
4. Significant events during the period 14
5. Analysis of the economic performance as at 31 March 2016 15
6. Analysis of the statement of financial position as at 31 March 2016 19
7. Performance of business segments 22
8. Economic performance in the third quarter of the FY 2015/16 36
9. Treasury shares 43
10. Research and development 43
11. Contingent assets and liabilities 43
12. Subsequent events 43
13. Outlook 44
14. Other information 45
Abridged consolidated financial statements as at 31 March 2016 46
Consolidated statement of financial position as at 31 March 2016 47
Consolidated income statement as at 31 March 2016 48
Consolidated statement of comprehensive income as at 31 March 2016 49
Consolidated statement of cash flows as at 31 March 2016 50
Consolidated statement of changes in equity 52
Notes to the abridged consolidated financial statements as at 31 March 2016 53
1. Introductory note 54
2. Analysis of the statement of financial position 55
3. Analysis of the income statement 64
4. Non-recurring income and expenses 66
5. Other information 67
6. Related party transactions 68
7. Atypical or unusual transactions 69
Statement pursuant to Art. 154-bis (5) of the Consolidated Finance Act 70

Digital Bros Group Interim Management Statement at 31 March 2016
4
OFFICERS AND CONTROL BODIES
Board of Directors
Lidia Florean Director (2)
Abramo Galante Chairman and managing director (1)
Davide Galante Director (2)
Raffaele Galante Managing director (1)
Guido Guetta Director (3)
Elena Morini Director (3)
Stefano Salbe Director (1) (4)
Bruno Soresina Director (3)
Dario Treves Director (2)
(1) Executive directors
(2) Non-executive directors
(3) Independent directors
(4) Financial Reporting Officer per Art. 154-bis of Legislative Decree 58/98
Internal Control and Risk Committee Remuneration Committee
Guido Guetta (Chairman) Guido Guetta (Chairman)
Elena Morini Elena Morini
Bruno Soresina Bruno Soresina
Board of Statutory Auditors
Paolo Villa Chairman
Emanuela Maria Conti Standing auditor
Laura Guazzoni Standing auditor
Simone Luigi Dalledonne Alternate auditor
The Shareholders’ Meeting of 28 October 2014 appointed the members of the Board of Directors and
Board of Statutory Auditors. The terms of office of the directors and statutory auditors will end with the
Shareholders’ Meeting that approves the financial statements at 30 June 2017.
On 14 January 2016 Sergio Amendola tendered his resignation as Chairman of the Board of Statutory
Auditors. Standing auditor Paolo Villa thus became Chairman of the Board of Statutory Auditors and
Emanuela Maria Conti standing auditor.
By resolution of 7 August 2007, the Board of Directors appointed board member Stefano Salbe to the
position of Financial Reporting Officer pursuant to Art. 154-bis of Legislative Decree 58/98, granting the
appropriate powers.
External statutory auditors
Deloitte & Touche S.p.A.
Digital Bros Group Interim Management Statement at 31 March 2016
5
At the meeting of 26 October 2012 the shareholders selected Deloitte & Touche S.p.A, with registered
office at Via Tortona 25 in Milan, as external auditing firm until approval of the accounts at 30 June
2021.
Other information
Publication of the interim management statement as at 31 March 2016 was authorised by resolution of the
Board of Directors on 12 May 2016. Digital Bros S.p.A. is a joint stock company established and
domiciled in Italy. It is listed on the STAR segment of the MTA market managed by Borsa Italiana S.p.A.

Digital Bros Group Interim Management Statement at 31 March 2016
6
DIRECTORS’ REPORT
1. GROUP STRUCTURE
The Digital Bros Group develops, publishes, distributes and markets video games on an international
scale.
The Group has implemented a change process that involved expanding into the Mobile segment,
dedicated to the publication of video games on smartphones and social networks, alongside the already
existing structure. The reorganisation involved the consolidation of the previous Digital organisational
unit into the Publishing business segment, considering that the products distributed on the traditional
channels and digital marketplaces use the same processes managed by the organisational division in
question. The increasing weight of the Mobile and Publishing business segments and the concurrent
reduction of the Italian Distribution business segment resulted in a need for a more extensive
organisational structure to coordinate the Group’s business, the Holding business segment, in particular
for the finance, administration, IT and general services functions.
The acquisition of the U.S. company Pipeworks Inc. on 12 September 2014 allowed the Group to extend
the scope of its business to include video game development (the Development business segment).
Since the previous year, the business conducted by the subsidiary Game Network S.r.l., which manages
paid gaming platforms under concession from the Italian State Monopoly Administration (AAMS), has
been separated from the Mobile segment. This activity is now included in the Other Activities segment,
which also includes the organisation of IT and video game specialisation and training courses by the
subsidiary Digital Bros Game Academy S.r.l.
The Group is therefore organised into five business segments:
Development: the Development business segment is responsible for designing and developing video
games. The business is conducted through a dedicated organisational structure. The business carries out
development projects on behalf of Group companies and non-captive clients. The business is conducted
solely by Pipeworks Inc.
Publishing: this activity consists of acquiring the rights to use video games from developers and their
subsequent distribution both through a traditional-type international sales network and by distribution on
the digital marketplaces such as, for example: Steam, Sony PlayStation Network, Microsoft Xbox Live.
The video games are normally acquired on an exclusive licence with international exploitations rights
valid for several years.
505 Games is the trade name used by the Group worldwide in the Publishing segment.
Publishing operations were carried out during the period by the subsidiary 505 Games S.r.l. (which
coordinates the segment), 505 Games France S.a.s., 505 Games Ltd., 505 Games (US) Inc., 505 Games
Spain Slu and 505 Games GmbH, operating respectively in the French, U.K., U.S., Spanish and German

Digital Bros Group Interim Management Statement at 31 March 2016
7
markets. The company 505 Games Interactive (US) Inc. provided consultancy on behalf of 505 Games
S.r.l. The Swedish company 505 Games Nordic AB was dormant during the period and was placed in
liquidation. The subsidiary Digital Bros China (Shenzhen) Ltd., responsible for business development on
the Asian market, became operational in November.
Mobile: this business segment is responsible for the production and marketing of video games for mobile
(smartphone and tablet) platforms and for social networks. The segment is coordinated by 505 Mobile
S.r.l., which controls the U.S. company 505 Mobile (US) Inc., which provided consultancy on behalf of
its parent company. With the acquisition of the English company DR Studios Ltd. on 12 September 2014,
the business segment benefited from an expansion of the activities carried out, which now also include the
development of applications.
The distinctive nature of the video games of the Mobile business segment relates to the different
distribution platforms and the possibility for players to download applications free from the marketplaces
and then spend money during the phases of the game. This type of game is also known as “free-to-play”.
505 Mobile is the trade name used by the Group worldwide in the segment.
Italian Distribution: the distribution in Italy of video games acquired from international publishers. The
games are marketed through a direct network of key accounts and through an indirect network of sales
representatives.
These operations are conducted by the parent, Digital Bros S.p.A., under the Halifax brand, and by the
subsidiary Game Service S.r.l. for alternative distribution channels.
The Group also distributes the Yu-Gi-Oh! trading card game throughout the country.
Other Activities: this residual business segment includes all activities of limited scope, which are
consolidated into a separate business segment, in the interest of logical presentation of results. It includes
the activities of the subsidiary Game Network S.r.l., which manages paid games under concession from
AAMS (the Italian State Monopoly Administration) and the activities of the subsidiary Digital Bros
Game Academy S.r.l. which organises IT and gaming specialisation courses, training courses and
professional refresher courses, in multimedia and other formats.
Holding: all coordination functions for the different segments carried out directly by Digital Bros S.p.A.
In particular, these are the implementation of financial policies for Group companies, centralised treasury
management, and management of real estate and trademarks. Administration, management control and
development business are the responsibility of the Holding business segment.
In June 2015, in order to bring the organisational structure into line with the structure of the business
segments, the parent company sold 100% of 505 Mobile S.r.l. and its subsidiaries, 505 Games France
S.a.s. and 505 Games Slu, to 505 Games S.r.l.
All of the equity investments indicated in the following organisation chart are fully owned.

Digital Bros Group Interim Management Statement at 31 March 2016
8
COMPANY ORGANIZATION CHART AS AT 31 MARCH 2016
ITALIAN DISTRIBUTION
DEVELOPMENT
ITALIAN DISTRIBUTION
OTHER PROJECTS

Digital Bros Group Interim Management Statement at 31 March 2016
9
During the period, the Group operated from the following locations:
Company Address Function
Digital Bros S.p.A. Via Tortona 37, Milan Offices
Digital Bros S.p.A. Via Boccaccio 95, Trezzano sul Naviglio (MI) Logistics
133 W Broadway, Inc. 133 W. Broadway, Suite 200 Eugene, Oregon, U.S.A. Offices
Digital Bros China (Shenzhen) Ltd. Tao Yuan Road, Nanshan district, Shenzhen 518062, China Offices
Digital Bros Game Academy S.r.l. Via Labus, 15 Milan Offices
DR Studios Ltd. 4 Linford Forum, Rockingham Drive, Milton Keynes, U.K. Offices
Game Entertainment S.r.l. Via Tortona 37, Milan Offices
Game Network S.r.l. Via Tortona 37, Milan Offices
Game Service S.r.l. Via Tortona 37, Milan Offices
Pipeworks Inc. 133 W. Broadway, Suite 200 Eugene, Oregon, U.S.A. Offices
505 Games S.r.l. Via Tortona 37, Milan Offices
505 Games France S.a.s. 2, Chemin de la Chauderaie, Francheville, France Offices
505 Games Spain Slu Calle Cabo Rufino Lazaro 15, Las Rozas de Madrid, Spain Offices
505 Games Ltd. 402 Silbury Court, Silbury Boulevard, Milton Keynes, U.K. Offices
505 Games (US) Inc. 5145 Douglas Fir Road, Calabasas, California, U.S.A. Offices
505 Games GmbH Brunnfeld 2-6, Burglengenfeld, Germany Offices
505 Games Interactive Inc. 5145 Douglas Fir Road, Calabasas, California, U.S.A. Offices
505 Mobile S.r.l. Via Tortona 37, Milan Offices
505 Mobile (US) Inc. 5145 Douglas Fir Road, Calabasas, California, U.S.A. Offices
505 Games Nordic AB, based in Stockholm, was placed in liquidation during the period. Digital Bros
Holdings Ltd., based in Milton Keynes, incorporated in January 2016, was not operational during the
quarter.
As at 31 March 2016 the Group had equity investments in the associates listed below:
Company name Registered Office Holding Book value
Delta DNA Ltd. (1) Edinburgh 1.16% 60
Ebooks&Kids S.r.l. Milan 16% 200
Cityglance S.r.l. Milan 37.5% 45
Ovosonico S.r.l. Varese 28.58% 420
Total 725
(1) Previously Games Analytics Ltd.

Digital Bros Group Interim Management Statement at 31 March 2016
10
2. THE VIDEO GAMES MARKET
The video games market is part of the entertainment industry. Movies, publishing, and toys are businesses
that build on the same characters, brands, and intellectual property.
The market is in constant flux and is expanding quickly as a result of non-stop technological advances.
Today, playing is no longer limited to traditional games consoles, Sony Playstation and Microsoft Xbox
in the various versions, but also mobile telephones, tablets, etc. The dissemination of connectivity at
increasingly lower costs and the availability of optic fibre networks and high speed mobile networks
enable video games to diversify increasingly, becoming more and more sophisticated and interactive. The
spread of smartphones to the entire population, without difference by gender or age, has allowed
developers to express their creativity in non-traditional contexts, for example by developing video games
suited to female gamers.
The video games market for the Sony Playstation and Microsoft Xbox instead performs in cycles, in
parallel with the life cycle of the consoles themselves for which the video games are developed, as is
standard in almost all technological markets. With the rollout of a given console, the price of the
hardware and the video games designed for it is high, and relatively small quantities are sold. During the
life cycle, prices then gradually go down, as they progress from new releases to maturity, and the
quantities sold increase. The games market for a given console usually peaks in its fifth year on the
market. The lifespan for consoles is currently around seven years. The new consoles Sony Playstation 4
and Microsoft Xbox One came out in November 2013.
High quality video games with high sales potential, in addition to being marketed on the digital
marketplaces, are also produced physically and distributed through traditional sales networks. In this case,
the value chain is as follows:
Developers are those who create and program the game, which is usually based on an original idea, a hot
brand, a film, etc. The developers retain the intellectual property rights, but they transfer the exploitation
rights – for a limited amount of time agreed by contract – to international video game publishers, who are
therefore crucial for completing the game and giving it a global reputation and clientèle.
Publishers allow the game to reach the consumer, as most of them are equipped with direct and indirect
sales networks in various countries. They also finance the phases of development and implement
communication strategies to maximise global sales. The publisher decides on a game’s release schedule,
global pricing and sales policy, positioning, and package design, while taking on all of the risks and,
jointly with the developer, enjoying all the opportunities that the video game may generate if it is a
success.
Developers PublishersConsole
manufacturersDistributors Dealers
End consumers

Digital Bros Group Interim Management Statement at 31 March 2016
11
The console manufacturer is the company that designs, engineers, produces and markets the hardware or
platform on which consumers play the game. Sony is the console manufacturer for Sony Playstation 4 and
Sony PSP Vita; Microsoft is the console manufacturer for Microsoft Xbox One; and Nintendo is the
console manufacturer for Nintendo 3 DS and Nintendo Wii U. The console manufacturer prints the game
on behalf of publishers in specific plants dedicated to the reproduction of software on the various physical
storage devices used. The video game must be approved in advance by the manufacturer, through a
structured process known as submission. Only publishers selected in advance will be allowed to publish
games by the console manufacturer, according to a licensing publishing agreement. The console
manufacturer and the video game publisher are often one and the same.
The role of the distributor varies from country to country. The more a market is fragmented, like Italy’s,
the more the distributor’s role is integrated with that of the publisher, with the implementation of specific
communication policies for a local audience and public relations strategies. In some markets, like the
U.K. and the U.S., retailers are highly concentrated so publishers usually have a direct commercial
presence. The French and Spanish markets have an intermediate structure somewhere between the Italian
and Anglo-Saxon markets.
The retailer is the outlet where the consumer purchases the game. Retailers can be international chains
specialized in the sale of video games, mass retail stores, specialized independent shops, or online stores.
If video games are distributed in digital format on the marketplaces, but also as regards video games for
smartphones and/or tablets, the value chain is less structured and is as follows:
As distribution goes increasingly digital, console manufacturers have organized “marketplaces” where
video games can be sold directly to the consumer without the need for a distributor or retailer. The main
marketplaces through which the video games for consoles are sold to the end consumer are: PlayStation
Store by Sony, Xbox Live by Microsoft and eShop by Nintendo. The world leader in the digital
distribution of games for personal computers is the marketplace Steam. Through its subsidiaries, the
Group has entered into publishing contracts with all of the marketplaces mentioned.
Concerning games for mobile phones, on the other hand, Apple has its AppStore marketplace for iPhone
and iPad games, while the marketplace for Android technology is GooglePlayStore. The Group has
appropriate distribution agreements with the latter as well.
The digital distribution of a video game considerably extends the life cycle of a product, enabling the
video game to be constantly available on the digital catalogue of the marketplace, a dynamic that is
difficult to imagine if the product were to be physically distributed, since the constant release of new
products makes it indispensable to rotate the video games on retailers’ shelves. Digital distribution also
allows publishers to conduct promotional campaigns in a relatively swift, efficient manner throughout a
Developers Publishers MarketplaceEnd
consumers

Digital Bros Group Interim Management Statement at 31 March 2016
12
video game’s life cycle. The ability to distribute additional episodes of a particularly successful game on
digital marketplaces represents a further way of expanding a video game’s potential over time.

Digital Bros Group Interim Management Statement at 31 March 2016
13
3. SEASONAL TRENDS
The seasonal nature of the business is due to the launch on the market of highly successful products:
quarter-on-quarter results can be volatile depending on whether or not a popular new game is released
during each three-month period. The launch of these products causes sales to be concentrated in the first
days of marketing of the product, known as “day one”.
The seasonal pattern is even more pronounced for the video game publisher, which usually releases a
limited number of games over the 12-month period, whereas the distributor can count on a steady stream
of new products as its business is to sell the games of different publishers in a given geographical market.
The launch of a game in one quarter as opposed to another concentrates sales in a restricted period of
time, thus magnifying the volatility of revenues between different quarters and/or different years.
The publication and distribution of video games in the digital marketplace reduces, but does not
neutralize, the volatility of a publisher’s results from one quarter to the next. In digital distribution,
revenue is recorded when the end consumers purchase the video game from the marketplace. This process
takes place more gradually over time and not primarily in the days immediately following launch,
differently to traditional distribution, where revenue is earned at the time of delivery to the
distributor/retailer regardless of the purchase by the end consumer.
The financial structure is also closely related to the pattern in sales. The physical distribution of a product
in a quarter entails the concentration of investments in net working capital, which are temporarily
reflected in the net financial position at least until revenues from sales are collected.
Digital Bros Group Interim Management Statement at 31 March 2016
14
4. SIGNIFICANT EVENTS DURING THE PERIOD
The main events during the period were as follows:
At various points during the period, Digital Bros S.p.A. purchased 2,883,271 Starbreeze B shares
for a total of 2,767 thousand euros and disposed of 4,083,962 shares for a total of 5,805 thousand
euros. During the same period, it purchased 1,776,314 Starbreeze A ordinary shares for a total of
1,821 thousand euros.
In August and September, Digital Bros S.p.A. sold on the open market 270,000 treasury shares
for a total value of 3,045 thousand euros. At the end of the period, treasury shares held amounted
to 130,247 ordinary shares.
On 2 September 2015, Digital Bros S.p.A. incorporated Digital Bros China (Shenzhen) Ltd.,
based in Shenzhen, China, with the purpose of carrying out marketing and business development
activity on the Chinese market on behalf of Group companies. Share capital is 100 thousand
euros.
On 11 September 2015, the Group entered into a commitment to subscribe for a capital increase
by the Italian video game developer Ovosonico S.r.l. in the total amount, inclusive of premium,
of 720 thousand euros. The increase will take place in multiple stages and will result in Digital
Bros S.p.A. holding a 49% interest in the company at the end of the process, scheduled for 31
July 2016. The company is based in Varese and employs about 25 people. Among the products
already developed, Murasaki Baby, award-winning video game published by Sony Computer
Entertainment, stand out. During the period, two single payments totalling 420 thousand euros
were made, of which 28,583 euros of capital and 391,417 euros of premium, representing an
28.58% interest in the Company;
The company 133 W Broadway, Inc. was incorporated on 8 January 2016. The company, based
in the United States of America, is a fully-owned subsidiary of Digital Bros S.p.A. and has share
capital of 100 thousand US dollars. On 3 February 2016 the company purchased the building in
which the offices of Pipeworks Inc. are located and succeeded to the existing rental agreement;
On 11 January 2016 the Shareholders’ Meeting of 505 Games S.r.l. transformed the company
from its current form into a joint-stock company. Its new name is 505 Games S.p.A. The
registered office, duration and end of the financial year remained unchanged, and the current
Board of Directors was confirmed. The Shareholders’ Meeting also authorised a bonus issue of
900,000 euros, increasing capital from 100,000 euros to 1,000,000 euros, through the issue of
900,000 shares with a nominal value of 1 euro each, through partial use of retained earnings.
The company Digital Bros Holdings Ltd. was incorporated on 13 January 2016. The company,
based in the United Kingdom, is a fully-owned subsidiary of Digital Bros S.p.A. and has share
capital of 100 thousand pounds. The company will become the sub-holding for the equity
investments of all of the Group’s English companies for the purposes of local tax consolidation.

Digital Bros Group Interim Management Statement at 31 March 2016
15
5. ANALYSIS OF THE ECONOMIC PERFORMANCE AS AT 31 March 2016
EUR/000 31 March 2016 31 March 2015 Change
1 Gross revenues 61,281 104.6% 88,258 104.4% (26,977) -30.6%
2 Revenue adjustments (2,680) -4.6% (4,288) -4.4% 1,608 -37.5%
3 Total net revenues 58,601 100.0% 83,970 100.0% (25,369) -30.2%
4 Purchase of goods for retail (16,372) -27.9% (26,741) -30.9% 10,369 -38.8%
5 Purchase of services for retail (4,438) -7.6% (3,912) -4.9% (526) 13.5%
6 Royalties (14,648) -25.0% (21,813) -24.4% 7,165 -32.8%
7 Changes in finished product inventories (1,164) -2.0% (216) -2.7% (948) n.s.
8 Total cost of sold products (36,622) -62.5% (52,682) -63.0% 16,060 -30.5%
9 Gross profit (3+8) 21,979 37.5% 31,288 37.0% (9,309) -29.8%
10 Other revenues 4,366 7.5% 955 0.4% 3,411 n.s.
11 Cost of services (9,847) -16.8% (7,858) -9.3% (1,989) 25.3%
12 Rent and leasing (1,159) -2.0% (1,149) -1.3% (10) 0.8%
13 Personnel costs (14,601) -24.9% (12,680) -13.0% (1,921) 15.1%
14 Other operating expenses (1,136) -1.9% (948) -1.1% (188) 19.8%
15 Total operating costs (26,743) -45.6% (22,635) -24.6% (4,108) 18.1%
16 EBITDA (9+10+15) (398) -0.7% 9,608 12.9% (10,006) n.s.
17 Amortisation and depreciation (2,798) -4.8% (2,183) -2.2% (615) 28.2%
18 Provisions 0 0.0% 0 -0.1% 0 n.s.
19 Write-down of assets (425) -0.7% (332) -0.6% (93) 28.0%
20 Write-backs and non-monetary income 588 1.0% 0 0.0% 588 0.0%
21
Total non-monetary income and
operating costs (2,635) -4.5% (2,515) -2.9% (120) 4.8%
22 EBIT (16+21) (3,033) -5.2% 7,093 10.0% (10,126) n.s.
23 Interest and financial income 2,574 4.4% 2,905 2.3% (331) -11.4%
24 Interest and financial expenses (1,222) -2.1% (1,384) -1.4% 162 -11.8%
25 Net financial income 1,352 2.3% 1,521 0.9% (169) -11.1%
26 Pre-tax income (22+25) (1,681) -2.9% 8,614 10.9% (10,295) n.s.
27 Current taxes (1,116) -1.9% (3,604) -4.2% 2,488 -69.0%
28 Deferred taxes 1,506 2.6% 578 0.0% 928 n.s.
29 Total income taxes 390 0.7% (3,026) -4.2% 3,416 n.s.
30 Net profit (26+29) (1,291) -2.2% 5,588 6.7% (6,879) n.s.
Net income per share:
33 Basic earnings per share (in euros) (0.09) 0.41 (0.50) n.s.
34 Diluted earnings per share (in euros) (0.09) 0.41 (0.50) n.s.

Digital Bros Group Interim Management Statement at 31 March 2016
16
In the absence of significant new product launches during the period, the Group’s gross revenues were
61,281 thousand euros, down by 26,977 thousand euros. Net revenues decreased by 30.2% to 58,601
thousand euros from 83,970 thousand euros as at 31 March 2015.
Below is the breakdown of revenues by business segment as at 31 March 2016 compared with the
previous year:
EUR/000
Gross revenues Net revenues
2016 2015 Change 2016 2015 Change
Publishing 32,366 54,878 (22,512) -41.0% 30,763 52,037 (21,274) -40.9%
Italian Distribution 16,293 20,688 (4,395) -21.2% 15,267 19,356 (4,089) -21.1%
Mobile 11,010 11,309 (299) -2.6% 11,010 11,309 (299) -2.6%
Development 1,102 1,184 (82) -6.9% 1,102 1,184 (82) -6.9%
Other Activities 510 199 311 n.s. 510 199 311 n.s.
Total gross revenues 61,281 88,258 (26,977) -30.6% 58,601 83,970 (25,369) -30.2%
The significant decline in revenues was primarily due to the decrease in Publishing segment product
sales, which fell by 22,512 thousand euros. Revenues for the Publishing segment are detailed by product
below:
EUR/000 31 March 2016 31 March 2015 Change
PAYDAY 2 14,260 14,751 (491)
Sniper Elite V3 6,618 26,779 (20,161)
Terraria 6,196 6,707 (511)
Brothers 2,092 868 1,224
How to Survive 954 1,872 (918)
Portal Knights 758 0 758
Sniper Elite V2 222 1,675 (1,453)
Other products 1,266 2,226 (960)
Total gross revenues - Publishing 32,366 54,878 (22,512)
The decline in the Publishing segment was largely due to the decrease in sales of the video game Sniper
Elite V3 of 20,161 thousand euros. During the reporting period, the Group continued to be able to count
solely on revenues on highly successful products published by the Group in previous years, PAYDAY 2,
revenues from which were essentially stable, and Terraria, which posted a decrease in revenues of 14% in
the first nine months of the year. The only launches during the period were limited to various new
products such as Portal Knights, which generated revenues of 758 thousand euros, released at the end of
February in early access mode, i.e. at a late, but not final, stage of development, solely on the Steam
platform.
The decrease in revenues of the Italian Distribution segment of 4,395 thousand euros was due to the
significant decline in the sales of the Yu-Gi-Oh! collectible cards, whereas there was an increase in video
game distribution revenues due to the launch on the Italian market of the video games Metal Gear Solid V
and PES 2016, which met with particular success among the public.

Digital Bros Group Interim Management Statement at 31 March 2016
17
Although no new products were launched during the year, revenues of the Mobile segment decreased by
just 2.6% to 11,010 thousand euros. The segment’s sales benefited from the positive performance of
revenues generated by the video game Battle Island, developed by the subsidiary DR Studios.
The Development segment’s revenues for the period amounted to 1,102 thousand euros, down by 6.9%,
and related to sales that the U.S. developer Pipeworks Inc. completed on development projects for non-
captive clients.
Revenues of the Other Activities segment include Fantasfida revenues of 366 thousand euros. Fantasfida
is the first Italian daily fantasy sport, a phenomenon that is particularly popular in the United States of
America. This is a game of skill in which the player fields a virtual team of champions in various athletic
disciplines and takes part in a tournament with potential cash prizes in return for payment of an entry fee.
The cost of goods decreased by 30.5%, in line with the decline in revenues, from 52,682 thousand euros
to 36,622 thousand euros. Gross profits were consequently down by 29.8% from 31,288 thousand euros
as at 31 March 2015 to the 21,979 thousand euros as at 31 March 2016, of which 2,572 thousand euros of
costs incurred for the launch of Fantasfida.
Other revenues were a quite significant component for the period, amounting to 4,366 thousand euros.
Such revenues consist of the capitalisation of internal work as a result of development projects carried out
by the subsidiaries Pipeworks Inc. and DR Studios Ltd on behalf of Group companies, in particular on
Prominence Poker, which will be launched in the first quarter of next year.
Operating expenses increased by 4,108 thousand euros, or 18.1%, rising from 22,635 thousand euros as at
31 March 2015 to 26,743 thousand euros as at 31 March 2016. In particular, cost of services increased by
1,989 thousand euros, or 25.3% compared to the previous year, of which 1,965 thousand euros of
advertising costs incurred for the launch of Fantasfida.
The increase in personnel costs of 1,921 thousand euros was due to the acquisition of the two
development studios, which in the previous year were only consolidated from September, but also to the
growth of the Publishing and Mobile structures to manage the important process of investment in new
video games that the Group undertook in the previous 18 months.
EBITDA was a negative 398 thousand euros, compared to a positive 9,608 thousand euros as at 31 March
2015, down by approximately 10 million euros.
Net non-monetary operating costs increased by 120 thousand euros, due to the increase in amortisation of
615 thousand euros to reflect the investments undertaken by the Group with the acquisitions of 100% of
Pipeworks Inc. and DR Studios Ltd. and the write-downs of assets of 93 thousand euro, partially offset by
higher write-backs of assets and non-financial income of 588 thousand euros. The write-backs of assets
were due to the non-existence of the payable of 588 thousand euros to the sellers of DR Studios Ltd. as a
result of the expected failure to satisfy the condition for an earn-out payment in September 2016. This
entailed the concurrent write-down of the assets allocated during the acquisition phase for 425 thousand
euros.

Digital Bros Group Interim Management Statement at 31 March 2016
18
EBIT decreased by 10,126 thousand euros, falling from 7,093 thousand euros as at 31 March 2015 to a
negative 3,033 thousand euros in the current period.
Net financial income amounted to 1,352 thousand euros, compared to 1,521 thousand euros in the same
period of the previous year.
Interest and financial income amounted to 2,574 thousand euros, including exchange gains of 1,054
thousand euros and capital gains realised on the sale of the Starbreeze B shares of 1,495 thousand euros,
while in the previous year the item was 2,905 thousand euros, consisting almost exclusively of exchange
gains.
Interest and financial expenses amounted to 1,222 thousand euros, down by 162 thousand euros compared
to the period ended 31 March 2015, due to the significant decline in financial expenses of 321 thousand
euros and an increase in exchange losses of 159 thousand euros.
Pre-tax loss as at 31 March 2016 was 1,681 thousand euros, compared to the pre-tax income of 8,614
thousand euros recorded during the same period of last year. Net loss was 1,291 thousand euros,
compared to the profit of 5,588 thousand euros as at 31 March 2015.
Basic and diluted net loss per share came to 0.09 euros, versus earnings per share of 0.41 euros in the
same period of the previous year.
Please refer to the specific sections in the report for more information regarding the Group’s performance
in its various business segments, including through subsidiaries.

Digital Bros Group Interim Management Statement at 31 March 2016
19
6. ANALYSIS OF THE STATEMENT OF FINANCIAL POSITION AS AT 31
March 2016
EUR/000 31 March 2016 30 June 2015 Change
Non-current assets
1 Property, plant and equipment 7,300 4,841 2,459 50.8%
2 Investment property 0 0 0 0.0%
3 Intangible assets 9,933 7,946 1,987 25.0%
4 Equity investments 725 1,274 (549) -43.0%
5 Non-current receivables and other assets 1,053 1,058 (5) -0.5%
6 Deferred tax assets 3,548 2,240 1,308 58.4%
Total non-current assets 22,559 17,359 5,200 30.0%
Non-current liabilities
7 Employee benefits (480) (486) 6 -1.2%
8 Non-current provisions (88) (170) 82 -48.1%
9 Other non-current payables and liabilities 0 (589) 589 n.s.
Total non-current liabilities (568) (1,245) 677 -54.4%
Net working capital
10 Inventories 11,717 12,881 (1,164) -9.0%
11 Trade receivables 31,683 36,350 (4,667) -12.8%
12 Tax credits 3,408 2,466 942 38.2%
13 Other current assets 4,509 6,148 (1,639) -26.7%
14 Trade payables (18,004) (26,929) 8,925 -33.1%
15 Tax payables (1,902) (3,029) 1,127 -37.2%
16 Current provisions 0 0 0 0.0%
17 Other current liabilities (1,172) (1,859) 687 -37.0%
Total net working capital 30,239 26,028 4,211 16.2%
Shareholders’ equity
18 Share capital (5,644) (5,644) 0 0.0%
19 Reserves (19,927) (19,417) (510) 2.6%
20 Treasury shares 390 1,199 (809) -67.5%
21 Retained earnings (losses) (9,074) (9,947) 873 -8.8%
Total shareholders’ equity (34,255) (33,809) (445) 1.3%
Total net assets 17,975 8,333 9,642 n.s.
22 Cash and cash equivalents 2,197 4,339 (2,142) -49.4%
23 Current payables due to banks (22,136) (12,738) (9,398) 73.8%
24 Other current financial assets and liabilities 4,157 1,685 2,472 n.s.
Current net financial position (15,782) (6,714) (9,068) n.s.
25 Non-current financial assets 1,195 0 1,195 0.0%
26 Non-current payables due to banks (1,687) (1,619) (68) 4.2%
27 Other non-current financial liabilities (1,701) 0 (1,701) 0.0%
Non-current net financial position (2,193) (1,619) (574) 35.5%
Total net financial position (17,975) (8,333) (9,642) n.s.

Digital Bros Group Interim Management Statement at 31 March 2016
20
Non-current assets increased by 5,200 thousand euros compared to 30 June 2015, primarily due to the
purchase by 133 W Broadway, Inc. of the property located in Eugene that is home to the offices of
Pipeworks Inc. for 2,196 thousand euros, the increase in costs incurred for video games in the
development phase and classified among intangible assets in the amount of 1,987 thousand euros in
relation to the internal development orders of the subsidiaries Pipeworks Inc. and DR Studios Ltd., and
the increase in deferred tax assets of 1,307 thousand euros.
Equity investments decreased by 549 thousand euros due to the classification among other current
financial assets of the Starbreeze A shares of 969 thousand euros at 30 June 2015 and the increase of 420
thousand euros relating to the purchase of a 28.58% interest in Ovosonico S.r.l.
Non-current liabilities decreased by 677 thousand euros due to the failure to meet the condition for the
pay-out of the earn-out envisaged in the acquisition agreement for DR Studios Ltd. (589 thousand euros),
whereas the remainder was due to minor changes in the captions employee benefits and non-current
provisions.
An analysis of net working capital in comparison with figures at 30 June 2015 is provided below:
EUR/000 31 March 2016 30 June 2015 Change
Inventories 11,717 12,881 (1,164) -9.0%
Trade receivables 31,683 36,350 (4,667) -12.8%
Tax credits 3,408 2,466 942 38.2%
Other current assets 4,509 6,148 (1,639) -26.7%
Trade payables (18,004) (26,929) 8,925 -33.1%
Tax payables (1,902) (3,029) 1,127 -37.2%
Current provisions 0 0 0 0.0%
Other current liabilities (1,172) (1,859) 687 -37.0%
Total net working capital 30,239 26,028 4,211 16.2%
Net working capital increased by 4,211 thousand euros compared to 30 June 2015, despite the decline in
inventories of 1,164 thousand euros. This increase contrasted with the decline in sales, which normally
permits a simultaneous reduction of net working capital, as manifest in the 33.1% decrease in trade
payables. The process of significant investments in new products launched by the Group in the past
several months, expected to begin to generate revenues in the following year, had a significant impact on
trade receivables, which declined by 12.8%, a much smaller decrease than the drop in revenues of 30%.
The item consists of trade receivables and advances for licences for the use of video games. Its
composition is therefore fundamental to an understanding of the performance of net working capital and
illustrated below:
EUR/000 31 March 2016 30 June 2015 Change
Receivables due from customers 12,814 24,824 (12,010)
Receivables for licences to use video games 18,869 11,526 7,343
Total trade receivables 31,683 36,350 (4,667)
In the table below, the net financial position is compared with the situation at 30 June 2015:

Digital Bros Group Interim Management Statement at 31 March 2016
21
EUR/000 31 March 2016 30 June 2015 Change
Cash and cash equivalents 2,197 4,339 (2,142) -49.4%
Current payables due to banks (22,136) (12,738) (9,398) 73.8%
Other current financial assets and liabilities 4,157 1,685 2,472 n.s.
Current net financial position (15,782) (6,714) (9,068) n.s.
Non-current financial assets 1,195 0 1,195 0.0%
Non-current payables due to banks (1,687) (1,619) (68) 4.2%
Other non-current financial liabilities (1,701) 0 (1,701) 0.0%
Non-current net financial position (2,193) (1,619) (574) 35.5%
Total net financial position (17,975) (8,333) (9,642) n.s.
Net financial debt was 17,975 thousand euros, up by 9,642 thousand euros compared to 30 June 2015, in
line with the increase in non-current assets and net working capital.
The change was due to the increase in current payables due to banks of 9,398 thousand euros, the
decrease in cash and cash equivalents of 2,142 thousand euros and the increase in other non-current
financial liabilities of 1,701 thousand euros, partially offset by the increase in other current financial
assets and liabilities of 2,472 thousand euros and non-current financial assets of 1,195 thousand euros.
For further details, see the consolidated statement of cash flows.

Digital Bros Group Interim Management Statement at 31 March 2016
22
7. PERFORMANCE OF BUSINESS SEGMENTS
Development
Key results (reclassified)
Consolidated data in thousands of euros Development
31 March 2016 31 March 2015 Change
1 Revenues 1,102 100.0% 1,184 100.0% (82) -6.9%
2 Revenue adjustments 0 0.0% 0 0.0% 0 0.0%
3 Total revenues 1,102 100.0% 1,184 100.0% (82) -6.9%
4 Purchase of goods for retail 0 0.0% 0 0.0% 0 0.0%
5 Purchase of services for retail (408) -37.0% (84) -7.1% (324) n.s.
6 Royalties 0 0.0% 0 0.0% 0 0.0%
7 Changes in finished product inventories 0 0.0% 0 0.0% 0 0.0%
8 Total cost of sold products (408) -37.0% (84) -7.1% (324) n.s.
9 Gross profit (3+8) 694 63.0% 1,100 93.0% (406) -36.9%
10 Other revenues 3,365 305.4% 667 56.4% 2,698 n.s.
11 Cost of services (213) -19.3% (190) -16.1% (24) 11.9%
12 Rent and leasing (109) -9.9% (58) -4.9% (51) n.s.
13 Personnel costs (3,804) -345.3% (2,434) -205.6% (1,370) 56.3%
14 Other operating expenses (134) -12.1% (53) -4.5% (81) n.s.
15 Total operating costs (4,260)
-
386.6% (2,735) -231.1% (1,525) 55.8%
16 EBITDA (9+10+15) (201) -18.2% (968) -81.8% 767 -79.3%
17 Amortisation and depreciation (453) -41.1% (301) -25.4% (152) 50.6%
18 Provisions 0 0.0% 0 0.0% 0 0.0%
19 Write-down of assets 0 0.0% 0 0.0% 0 0.0%
20 Write-backs of assets and non-monetary income 0 0.0% 0 0.0% 0 0.0%
21
Total non-monetary income and operating
costs (453) -41.1% (301) -25.4% (152) 50.6%
22 EBIT (16+21) (654) -59.3% (1,269) -107.2% 615 -48.5%
The segment consists solely of the activities of the U.S. Pipeworks Inc., acquired on 1 September 2014
and thus consolidated for just seven months in the corresponding period of the previous year.
The Development segment’s revenues relate to development contracts for non-captive clients, whereas
revenues related to the development projects carried out on behalf of Group companies are classified to
other revenues, net of the margins realised.
Revenues from non-captive clients amounted to 1,102 thousand euros during the period, compared to
1,184 thousand euros in the previous year, whereas internal development projects increased to 3,365
Digital Bros Group Interim Management Statement at 31 March 2016
23
thousand euros compared to just 667 thousand euros in the previous year, in line with the greater
integration of the acquiree and the Group over time.
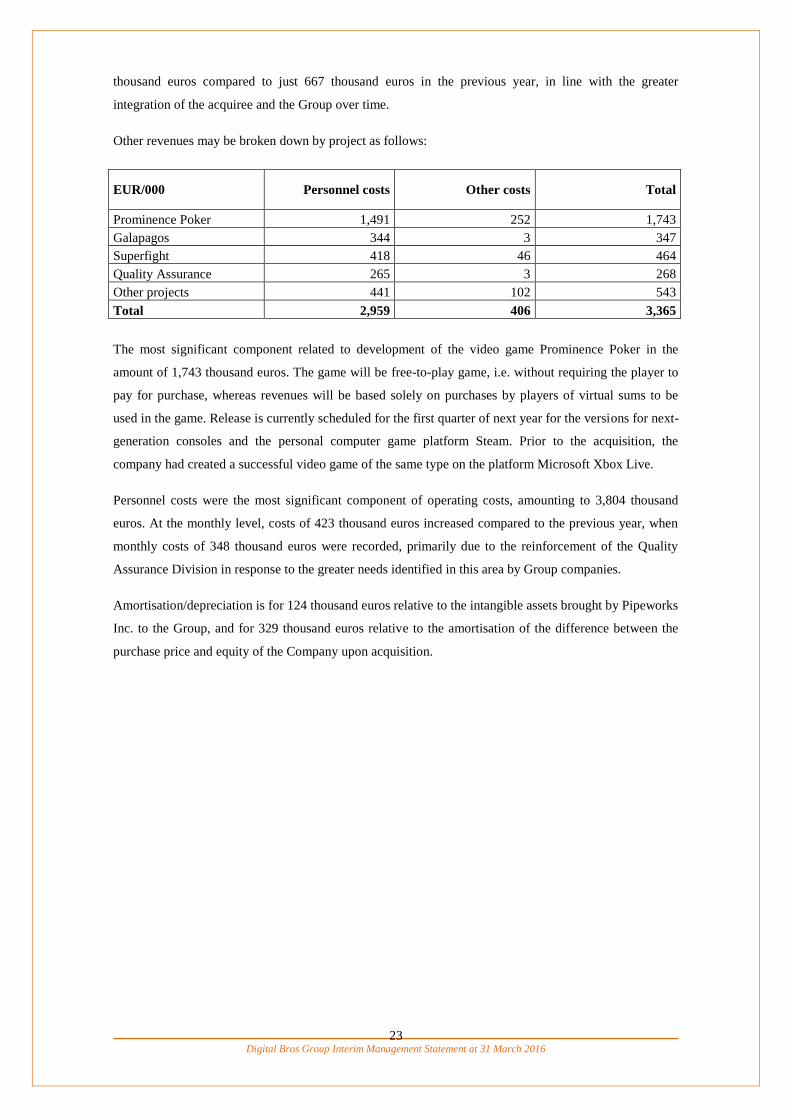
Other revenues may be broken down by project as follows:
EUR/000 Personnel costs Other costs Total
Prominence Poker 1,491 252 1,743
Galapagos 344 3 347
Superfight 418 46 464
Quality Assurance 265 3 268
Other projects 441 102 543
Total 2,959 406 3,365
The most significant component related to development of the video game Prominence Poker in the
amount of 1,743 thousand euros. The game will be free-to-play game, i.e. without requiring the player to
pay for purchase, whereas revenues will be based solely on purchases by players of virtual sums to be
used in the game. Release is currently scheduled for the first quarter of next year for the versions for next-
generation consoles and the personal computer game platform Steam. Prior to the acquisition, the
company had created a successful video game of the same type on the platform Microsoft Xbox Live.
Personnel costs were the most significant component of operating costs, amounting to 3,804 thousand
euros. At the monthly level, costs of 423 thousand euros increased compared to the previous year, when
monthly costs of 348 thousand euros were recorded, primarily due to the reinforcement of the Quality
Assurance Division in response to the greater needs identified in this area by Group companies.
Amortisation/depreciation is for 124 thousand euros relative to the intangible assets brought by Pipeworks
Inc. to the Group, and for 329 thousand euros relative to the amortisation of the difference between the
purchase price and equity of the Company upon acquisition.

Digital Bros Group Interim Management Statement at 31 March 2016
24
Publishing
Key results (reclassified)
Consolidated data in thousands of euros Publishing
31 March 2016 31 March 2015 Change
1 Revenues 32,366 105.2% 54,878 105.5% (22,511) -41.0%
2 Revenue adjustments (1,603) -5.2% (2,841) -5.5% 1,238 -43.6%
3 Total revenues 30,763 100.0% 52,037 100.0% (21,274) -40.9%
4 Purchase of goods for retail (4,963) -16.1% (11,175) -21.5% 6,213 -55.6%
5 Purchase of services for retail (2,197) -7.1% (2,518) -4.8% 322 -12.8%
6 Royalties (8,684) -28.2% (16,374) -31.5% 7,689 -47.0%
7 Changes in finished product inventories (1,011) -3.3% (739) -1.4% (272) 36.9%
8 Total cost of sold products (16,855) -54.8% (30,806) -59.2% 13,951 -45.3%
9 Gross profit (3+8) 13,908 45.2% 21,231 40.8% (7,323) -34.5%
10 Other revenues 86 0.3% 17 0.0% 69 n.s.
11 Cost of services (3,976) -12.9% (4,222) -8.1% 246 -5.8%
12 Rent and leasing (385) -1.3% (429) -0.8% 44 -10.2%
13 Personnel costs (4,881) -15.9% (4,311) -8.3% (570) 13.2%
14 Other operating expenses (373) -1.2% (334) -0.6% (39) 11.7%
15 Total operating costs (9,615) -31.3% (9,296) -17.9% (319) 3.4%
16 EBITDA (9+10+15) 4,379 14.2% 11,952 23.0% (7,573) -63.4%
17 Amortisation and depreciation (883) -2.9% (627) -1.2% (256) 41.0%
18 Provisions 0 0.0% 0 0.0% 0 0.0%
19 Write-down of assets 0 0.0% 0 0.0% 0 0.0%
20
Write-backs of assets and non-monetary
income 0 0.0% 0 0.0% 0 0.0%
21
Total non-monetary income and
operating costs (883) -2.9% (627) -1.2% (256) 41.0%
22 EBIT (16+21) 3,496 11.4% 11,325 21.8% (7,829) -69.1%
In absence of significant new product launches, the decline in the Publishing segment was largely due to
the decrease in sales of the video game Sniper Elite V3 of 20,161 thousand euros, out of the total of
22,512 thousand euros. During the reporting period, the Group continued to be able to count solely on
revenues on highly successful products published by the Group in previous years, PAYDAY 2, revenues
from which were essentially stable, and Terraria, which posted a decrease in revenues of 14% in the first
nine months of the year. The only launches during the period were limited to various new products such
as Portal Knights, which generated revenues of 758 thousand euros, released at the end of February in
early access mode, i.e. at a late, but not final, stage of development, solely on the Steam platform.
Details of revenues divided up according to the main products published by the Group during the period
are as follows:

Digital Bros Group Interim Management Statement at 31 March 2016
25
Data in thousands of euros 31 March 2016 31 March 2015 Change
PAYDAY 2 14,260 14,751 (491)
Sniper Elite V3 6,618 26,779 (20,161)
Terraria 6,196 6,707 (511)
Brothers 2,092 868 1,224
How to Survive 954 1,872 (918)
Portal Knights 758 0 758
Sniper Elite V2 222 1,675 (1,453)
Other 1,266 2,226 (960)
Total revenues - Publishing 32,366 54,878 (22,512)
A breakdown of revenues as at 31 March 2016, divided up according to type of distribution channel and
compared with the same data of the previous period, yields the following:
Revenues in thousands of euros 31 March 2016 31 March 2015 Change
Revenues from retail distribution 14,752 31,098 (16,346) -52.6%
Revenues from digital distribution 17,560 23,609 (6,049) -25.6%
Revenues from sub-licensing 54 171 (117) -68.4%
Total revenues - Publishing 32,366 54,878 (22,512) -41.0%
Digital distribution revenues as at 31 December 2015 are broken down below by digital marketplace, as
follows:
Revenues in thousands of euros 31 March 2016 31 March 2015 Change
Steam 7,544 10,315 (2,771)
Sony Play Station Network 5,084 5,080 (4)
Microsoft Xbox Live 4,618 7,829 (3,211)
Other marketplaces 314 385 (71)
Total revenues - Digital distribution 17,560 23,609 (6,049)
Revenue adjustments decreased by 1,238 thousand euros, with a percentage decline of 43.6%, resulting in
a decrease in net revenues of 40.9%. The item includes the estimated credit notes for unsold products that
the Group forecasts having to issue to customers in the near future and was also down in line with the
decrease in retail distribution revenues.
The cost of goods sold decreased by 45.3%, greater than the decrease in revenues, falling from 30,806
thousand euros to 16,855 thousand euros, resulting in a decrease in gross profits of 34.5% from 21,231
thousand euros as at 31 March 2015 to 13,908 thousand euros as at 31 March 2016.
Operating costs increased by 319 thousand euros, due to an increase in personnel costs of 570 thousand
euros due to the expansion of the segment’s international organisational structure to manage the important
process of investments in new video games undertaken by the Group in the past 18 months, only partly
offset by a decline in costs of services of 246 thousand euros due to the decreased advertising
investments.
EBITDA declined to 14.2% of net revenues from 23% in the previous year, falling from 11,952 thousand
euros to 4,379 thousand euros.
Digital Bros Group Interim Management Statement at 31 March 2016
26
Non-monetary operating costs increased by 256 thousand euros due to greater amortisation of intellectual
property, resulting in a decline of EBIT to 3,496 thousand euros or 11.4% of net revenues, compared to
11,325 thousand euros in the first nine months of the previous year.

Digital Bros Group Interim Management Statement at 31 March 2016
27
Mobile
Key results (reclassified)
Consolidated data in thousands of euros Mobile
31 March 2016 31 March 2015 Change
1 Revenues 11,010 100.0% 11,309 100.0% (299) -2.6%
2 Revenue adjustments 0 0.0% 0 0.0% 0 0.0%
3 Total revenues 11,010 100.0% 11,309 100.0% (299) -2.6%
4 Purchase of goods for retail 0 0.0% 0 0.0% 0 0.0%
5 Purchase of services for retail (1,755) -15.9% (1,296) -11.5% (459) 35.4%
6 Royalties (5,872) -53.3% (5,436) -48.1% (436) 8.0%
7 Changes in finished product inventories 0 0.0% 0 0.0% 0 0.0%
8 Total cost of sold products (7,627) -69.3% (6,732) -59.5% (895) 13.3%
9 Gross profit (3+8) 3,383 30.7% 4,577 40.5% (1,194) -26.1%
10 Other revenues 685 6.2% 209 1.8% 476 n.s.
11 Cost of services (692) -6.3% (539) -4.8% (153) 28.4%
12 Rent and leasing (55) -0.5% (31) -0.3% (24) 76.2%
13 Personnel costs (2,178) -19.8% (1,861) -16.5% (317) 17.0%
14 Other operating expenses (51) -0.5% (23) -0.2% (28) 123.5%
15 Total operating costs (2,976) -27.0% (2,454) -21.7% (522) 21.3%
16 EBITDA (9+10+15) 1,092 9.9% 2,332 20.6% (1,240) -53.2%
17 Amortisation and depreciation (1,036) -9.4% (915) -8.1% (121) 13.3%
18 Provisions 0 0.0% 0 0.0% 0 0.0%
19 Write-down of assets (425) -3.9% 0 0.0% (425) 0.0%
20
Write-backs of assets and non-monetary
income 588 5.3% 0 0.0% 588 0.0%
21
Total non-monetary income and
operating costs (873) -7.9% (915) -8.1% 42 -4.5%
22 EBIT (16+21) 219 2.0% 1,417 12.5% (1,198) -84.5%
Although no new products were launched during the year, revenues of the Mobile segment decreased by
just 2.6% to 11,010 thousand euros. The segment’s sales benefited from the positive performance of
revenues generated by the video game Battle Island, developed by the subsidiary DR Studios.
The segment’s revenues for the period may be broken down as follows by segment:
Revenues in thousands of euros 31 March 2016 31 March 2015 Change
Terraria 7,583 9,265 (1,682)
Battle Islands 2,070 1,461 609
Gems of War 893 150 743
Other products 464 433 31
Total revenues - Mobile 11,010 11,309 (299)

Digital Bros Group Interim Management Statement at 31 March 2016
28
Revenues on the sale of Terraria, despite decreasing by 18.1% compared to the same period of the
previous year, amounted to 7,583 thousand euros, and were the main source of sales for the period, even
two years from launch on the market.
The video game Battle Islands, developed by the subsidiary DR Studios Ltd. and launched in December
2013, made a 2,070 thousand euros contribution towards period revenues, up by 609 thousand euros
compared to the same period of the previous year. Differently to Terraria, which is distributed in
exchange for payment on the main digital marketplaces, Battle Islands can instead be downloaded free of
charge and has purchase functions available to the player while playing. Like Gems of War, the product
benefited from the sales of new versions for the Sony Playstation Network and Microsoft Xbox Live
marketplaces.
The cost of goods sold comprises only purchases of services and royalties. The first, which come to 1,755
thousand euros in the year, consist of localisation costs, ratings and quality assurance, as well as the costs
incurred for live support services. This is a development activity that is carried out after the game is
launched and which helps maintain and improve the game during the product’s life cycle to encourage the
player to pay out and continue playing. Details of costs for services by type are as follows:
Data in thousands of euros 31 March 2016 31 March 2015 Change
Live support 782 279 503
Programming 253 335 (82)
Quality assurance 399 518 (119)
Hosting 179 107 72
Other 142 57 85
Total 1,755 1,296 459
Royalty costs increased by 436 thousand euros compared to the same period of the previous year, even
though the share of revenues generated on products developed by Group companies, such as Battle
Islands and Gems of War, on which royalties do not accrue, were on the rise. The increase was due to
costs for early termination of development contracts of 2,360 thousand euros compared to 762 thousand
euros in the previous year. This component is quite typical of the segment.
Operating costs include services (mostly advertising to promote products on the various platforms) and
personnel costs. The increase in personnel costs was related to the acquiree DR Studios Ltd., which
during the previous year was only consolidated from September.
Amortisation and depreciation increased by 121 thousand euros and were composed of:
Data in thousands of euros 31 March 2016 31 March 2015 Change
Amortisation/depreciation of Battle Islands 667 731 (64)
Amortisation of intangible assets 328 162 166
Depreciation of tangible assets 41 22 19
Total 1,036 915 121
The write-backs of assets were due to the non-existence of the payable of 588 thousand euros to the
sellers of DR Studios Ltd. as a result of the expected failure to satisfy the condition for an earn-out

Digital Bros Group Interim Management Statement at 31 March 2016
29
payment in September 2016. This entailed the concurrent write-down of the assets allocated during the
acquisition phase for 425 thousand euros.
Period EBIT came to 219 thousand euros, as compared with an EBIT of 1,417 thousand euros recorded as
at 31 March 2015.

Digital Bros Group Interim Management Statement at 31 March 2016
30
Italian Distribution
Key results (reclassified)
Consolidated data in thousands of
euros Italian Distribution
31 March 2016 31 March 2015 Change
1 Revenues 16,293 106.7% 20,688 106.9% (4,395) -21.2%
2 Revenue adjustments (1,026) -6.7% (1,332) -6.9% 306 -22.9%
3 Total revenues 15,267 100.0% 19,356 100.0% (4,089) -21.1%
4 Purchase of goods for retail (11,409) -74.7% (15,566) -80.4% 4,157 -26.7%
5 Purchase of services for retail 0 0.0% 0 0.0% 0 0.0%
6 Royalties 0 0.0% 0 0.0% 0 0.0%
7 Changes in finished product inventories (153) -1.0% 523 2.7% (676) n.s.
8 Total cost of sold products (11,562) -75.7% (15,043) -77.7% 3,481 -23.1%
9 Gross profit (3+8) 3,705 24.3% 4,313 22.3% (608) -14.1%
10 Other revenues 53 0.3% 62 0.3% (9) -13.9%
11 Cost of services (1,563) -10.2% (1,714) -8.9% 151 -8.8%
12 Rent and leasing (46) -0.3% (43) -0.2% (3) 7.5%
13 Personnel costs (1,277) -8.4% (1,547) -8.0% 270 -17.4%
14 Other operating expenses (178) -1.2% (191) -1.0% 13 -6.5%
15 Total operating costs (3,064) -20.1% (3,495) -18.1% 431 -12.3%
16 EBITDA (9+10+15) 694 4.5% 880 4.5% (186) -21.2%
17 Amortisation and depreciation (135) -0.9% (169) -0.9% 34 -20.0%
18 Provisions 0 0.0% 0 0.0% 0 0.0%
19 Write-down of assets 0 0.0% 0 0.0% 0 0.0%
20
Write-backs of assets and non-monetary
income 0 0.0% 0 0.0% 0 0.0%
21
Total non-monetary income and
operating costs (135) -0.9% (169) -0.9% 34 -20.0%
22 EBIT (16+21) 559 3.7% 711 3.7% (152) n.s.
The decrease in revenues of the Italian Distribution segment of 4.395 thousand euros was due to the
significant decline in the sales of the Yu-Gi-Oh! collectible cards, whereas there was an increase in video
game distribution revenues due to the launch on the Italian market of the video games Metal Gear Solid V
and PES 2016, which met with particular success among the public.
The breakdown of gross revenues by type of game distributed is as follows:
EUR/000 31 March 2016 31 March 2015 Change
Distribution of video games for consoles 11,474 10,460 1,014 9.7%
Distribution of video games for PC-CDRom 452 1,398 (946) -67.7%
Distribution of trading cards 3,879 8,736 (4,857) -55.6%
Distribution of other products and services 519 215 304 n.s.
Financial discounts (31) (121) 90 -73.9%
Total gross revenues - Italian Distribution 16,293 20,688 (4,395) -21.2%

Digital Bros Group Interim Management Statement at 31 March 2016
31
In order to better understand the quarterly trend in gross revenues, the breakdown of distribution revenues
by console is shown below:
EUR/000 31 March 2016 31 March 2015 Change
Units Turnover Units Turnover Units Turnover
Sony Playstation 4 154,989 6,281 101,921 4,008 52.1% 56.7%
Sony Playstation 3 112,348 2,530 145,475 3,391 -22.8% -25.4%
Microsoft Xbox One 30,969 1,165 27,394 1,055 13.1% 10.5%
Microsoft Xbox 360 63,795 1,235 67,530 1,457 -5.5% -15.3%
Other consoles 32,983 263 37,683 550 -12.5% -52.2%
Total console revenues 395,084 11,474 380,003 10,461 4.0% 9.7%
The business segment showed an increase in console video game distribution revenues of 1,014 thousand
euros, due to the concurrent launch during the period of two video games that met with very high levels
of success with the public: Metal Gear Solid V and PES 2016.
Sales of Yu-Gi-Oh! collectible cards decreased by 4,857 thousand euros.
Net revenues came to 15,267 thousand euros, a decrease of 21.1% compared to the same period of the
previous year.
The cost of goods sold was down by 3,481 thousand euros (23.1%), a slightly higher decrease than that of
net revenues. Gross profit thus decreased by 14.1%, or 608 thousand euros.
Operating costs decreased by 12.3% (431 thousand euros) compared with the same period of the prior
year, a smaller decrease than at the level of revenues. This reduction is due primarily to a decrease in the
cost of services by 151 thousand euros and a decline in personnel costs by 270 thousand euros.
EBIT decreased by 152 thousand euros, from 711 thousand euros during the period ended 31 March 2015
to 559 thousand euros in the current period.

Digital Bros Group Interim Management Statement at 31 March 2016
32
Other Activities
Key results (reclassified)
Consolidated data in thousands of euros Other Activities
31 March 2016 31 March 2015 Change
1 Revenues 510 111.2% 199 237.1% 311 n.s.
2 Revenue adjustments (51) -11.2% (115) -137.1% 64 -55.4%
3 Total revenues 459 100.0% 84 100.0% 375 n.s.
4 Purchase of goods for retail 0 0.1% 0 0.0% 0 0.0%
5 Purchase of services for retail (78) -17.0% (14) -16.3% (64) n.s.
6 Royalties (92) -20.1% (3) -4.0% (89) n.s.
7 Changes in finished product inventories 0 0.0% 0 0.0% 0 0.0%
8 Total cost of sold products (170) -37.0% (17) -20.3% (153) n.s.
9 Gross profit (3+8) 289 63.0% 67 79.7% 222 n.s.
10 Other revenues 177 38.5% 0 0.0% 177 0.0%
11 Cost of services (2,468) -537.8% (226) -269.3% (2,242) n.s.
12 Rent and leasing (16) -3.6% (18) -21.3% 2 -8.3%
13 Personnel costs (400) -87.1% (291) -347.4% (109) 37.2%
14 Other operating expenses (54) -11.8% (31) -37.1% (23) 74.5%
15 Total operating costs (2,938) -640.3% (566) -675.2% (2,372) n.s.
16 EBITDA (9+10+15) (2,472) -538.6% (499) -595.5% (1,973) n.s.
17 Amortisation and depreciation (188) -40.9% (83) -98.6% (105) n.s.
18 Provisions 0 0.0% 0 0.0% 0 0.0%
19 Write-down of assets 0 0.0% 0 0.0% 0 0.0%
20 Write-backs of assets and non-monetary income 0 0.0% 0 0.0% 0 0.0%
21 Total non-monetary income and operating costs (188) -40.9% (83) -98.6% (105) n.s.
22 EBIT (16+21) (2,660) -579.7% (582) -694.1% (2,078) n.s.
Revenues of the Other Activities segment include Fantasfida revenues of 366 thousand euros. Fantasfida
is the first Italian daily fantasy sport, a phenomenon that is particularly popular in the United States of
America. This is a game of skill in which the player fields a virtual team of champions in various athletic
disciplines and takes part in a tournament with potential cash prizes in return for payment of an entry fee.
Revenues on the training activity performed by the subsidiary Digital Bros Academy were 144 thousand
euros during the period.
Revenue adjustments consist entirely of taxes paid on revenues earned by the portals www.gameplaza.it
and www.fantasfida.it.
Other revenues represent the increase in internal orders relating to the direct costs incurred during the
period for development of the product Fantasfida, released in September 2015. They increased after the
launch date due to the internal costs incurred for the creation of the mobile application, which is expected
Digital Bros Group Interim Management Statement at 31 March 2016
33
to be completed by the end of the year and which will become operational starting next season. The
application will allow players to play directly from their smartphones using a native application.
Operating costs amounted to 2,938 thousand euros and were significantly affected by the expenses of
2,572 thousand euros incurred for the launch of Fantasfida.
EBIT was a negative 2,660 thousand euros.

Digital Bros Group Interim Management Statement at 31 March 2016
34
Holding
Key results (reclassified)
Consolidated data in thousands of euros Holding
31 March 2016 31 March 2015 Change
1 Revenues 0 0.0% 0 0.0% 0 0.0%
2 Revenue adjustments 0 0.0% 0 0.0% 0 0.0%
3 Total revenues 0 0.0% 0 0.0% 0 0.0%
4 Purchase of goods for retail 0 0.0% 0 0.0% 0 0.0%
5 Purchase of services for retail 0 0.0% 0 0.0% 0 0.0%
6 Royalties 0 0.0% 0 0.0% 0 0.0%
7 Changes in finished product inventories 0 0.0% 0 0.0% 0 0.0%
8 Total cost of sold products 0 0.0% 0 0.0% 0 0.0%
9 Gross profit (3+8) 0 0.0% 0 0.0% 0 0.0%
10 Other revenues 0 0.0% 0 0.0% 0 0.0%
11 Cost of services (935) 0.0% (967) 0.0% 32 -3.3%
12 Rent and leasing (548) 0.0% (570) 0.0% 22 -3.9%
13 Personnel costs (2,061) 0.0% (2,236) 0.0% 175 -7.8%
14 Other operating expenses (346) 0.0% (316) 0.0% (30) 9.6%
15 Total operating costs (3,890) 0.0% (4,089) 0.0% 199 -4.9%
16 EBITDA (9+10+15) (3,890) 0.0% (4,089) 0.0% 199 -4.9%
17 Amortisation and depreciation (103) 0.0% (88) 0.0% (15) 18.1%
18 Provisions 0 0.0% 0 0.0% 0 0.0%
19 Write-down of assets 0 0.0% (332) 0.0% 332 n.s.
20 Write-backs of assets and non-monetary income 0 0.0% 0 0.0% 0 0.0%
21 Total non-monetary income and operating costs (103) 0.0% (420) 0.0% 317 -75.4%
22 EBIT (16+21) (3,993) 0.0% (4,509) 0.0% 516 -11.4%
The increasing importance of the Mobile and Publishing business segments and the corresponding
reduction of the business segment of Italian Distribution have brought about the need for a more
extensive holding structure than before, in particular for the finance, administration, IT and general
services functions. These are carried out directly by the parent, Digital Bros S.p.A., and among other
activities include the coordination of the different business segments, implementation of sound financial
policies for Group companies, centralised treasury management and management of office buildings and
brand management.
Operating costs of 3,890 thousand euros, down by 199 thousand euros compared to the same period of the
previous year, due to the absence of a provision for the directors’ bonuses due to the failure to achieve
short-term objectives.
Digital Bros Group Interim Management Statement at 31 March 2016
35
Depreciation and amortisation increased by 18.1% due to the investments incurred by the Group for
management systems, whereas there were no write-downs of assets, as in the same period of the previous
year.

Digital Bros Group Interim Management Statement at 31 March 2016
36
8. ECONOMIC PERFORMANCE FOR THE THIRD QUARTER OF THE YEAR
2015/2016
The results posted by the Group in the third quarter of the year, compared with the third quarter of the
previous year, are shown below:
EUR/000
3rd quarter of
2015/2016
3rd quarter of
2014/2015 Change
1 Gross revenues 15,991 101.8% 27,261 106.7% (11,270) -41.3%
2 Revenue adjustments (284) -1.8% (1,700) -6.7% 1,416 -83.3%
3 Total net revenues 15,707 100.0% 25,561 100.0% (9,854) -38.5%
4 Purchase of goods for retail (4,282) -27.3% (8,683) -34.0% 4,401 -50.7%
5 Purchase of services for retail (1,153) -7.3% (1,041) -4.1% (112) 10.7%
6 Royalties (6,679) -42.5% (7,554) -29.6% 875 -11.6%
7 Changes in finished product inventories 521 3.3% 1,367 5.3% (846) -61.9%
8 Total cost of sold products (11,592) -73.8% (15,911) -62.2% 4,319 -27.1%
9 Gross profit (3+8) 4,115 26.2% 9,650 37.8% (5,535) -57.4%
10 Other revenues 1,602 10.2% 696 2.7% 907 n.s.
11 Cost of services (3,103) -19.8% (2,387) -9.3% (716) 30.0%
12 Rent and leasing (375) -2.4% (382) -1.5% 8 -2.1%
13 Personnel costs (4,765) -30.3% (5,102) -20.0% 336 -6.6%
14 Other operating expenses (369) -2.4% (315) -1.2% (54) 17.1%
15 Total operating costs (8,612) -54.8% (8,186) -32.0% (426) 5.2%
16 EBITDA (9+10+15) (2,895) -18.4% 2,160 8.5% (5,055) n.s.
17 Amortisation and depreciation (1,007) -6.4% (904) -3.5% (103) 11.4%
18 Provisions 0 0.0% 0 0.0% 0 0.0%
19 Write-down of assets (0) 0.0% 0 0.0% (0) 0.0%
20 Asset write-backs 0 0.0% 0 0.0% 0 0.0%
21 Total non-monetary operating costs (1,007) -6.4% (904) -3.5% (103) 11.4%
22 EBIT (16+21) (3,902) -24.8% 1,256 4.9% (5,158) n.s.
23 Interest income 602 3.8% 1,541 6.0% (939) -60.9%
24 Interest expense (357) -2.3% (539) -2.1% 182 -33.8%
25 Total net interest 245 1.6% 1,002 3.9% (757) -75.5%
26 Pre-tax income (22+25) (3,657) -23.3% 2,258 8.8% (5,915) n.s.
27 Current taxes 549 3.5% (1,175) -4.6% 1,725 n.s.
28 Deferred taxes 568 3.6% 584 2.3% (16) -2.8%
29 Total income taxes 1,117 7.1% (591) -2.3% 1,708 n.s.
30 Net profit (26+29) (2,540) -16.2% 1,667 6.5% (4,207) n.s.
Net income per share:
33 Basic earnings per share (in euros) (0.18) 0.12 (0.30) n.s.
34 Diluted earnings per share (in euros) (0.18) 0.12 (0.30) n.s.

Digital Bros Group Interim Management Statement at 31 March 2016
37
In the third quarter, consolidated gross revenues decreased by 41.3% and net revenues by 38.5%, falling
from 25,561 thousand euros to 15,707 thousand euros.
The cost of goods sold decreased by 27.1% compared to the third quarter of the prior year, resulting in a
gross profit of 4,115 thousand euros, down by 57.4% from 9,650 thousand euros in the third quarter of the
prior year.
Operating expenses increased by 5.2% to 8,612 thousand euros, resulting in an EBITDA of a negative
2,895 thousand euros, compared to a positive 2,160 thousand euros in the third quarter of the previous
year.
The net loss for the quarter amounted to 2,540 thousand euros compared a profit of 1,667 thousand euros
in the third quarter of the prior year.
Commentary on the performances of the three main business segments in the third quarter is provided
below.

Digital Bros Group Interim Management Statement at 31 March 2016
38
Publishing
The third quarter results for Publishing compared with the same period of the prior year are shown below:
Consolidated data in thousands of
euros Publishing
3rd quarter of
2015/2016
3rd quarter of
2014/2015 Change
1 Revenues 9,365 103.0% 18,017 108.3% (8,651) -48.0%
2 Revenue adjustments (275) -3.0% (1,381) -8.3% 1,106 -80.1%
3 Total revenues 9,090 100.0% 16,636 100.0% (7,545) -45.4%
4 Purchase of goods for retail (1,067) -11.7% (3,460) -20.8% 2,393 -69.2%
5 Purchase of services for retail (241) -2.6% (605) -3.6% 365 -60.2%
6 Royalties (3,536) -38.9% (5,594) -33.6% 2,058 -36.8%
7 Changes in finished product inventories (527) -5.8% (8) 0.0% (520) n.s.
8 Total cost of sold products (5,371) -59.1% (9,667) -58.1% 4,296 -44.4%
9 Gross profit (3+8) 3,719 40.9% 6,969 41.9% (3,250) -46.6%
10 Other revenues 48 0.5% 0 0.0% 48 n.s.
11 Cost of services (1,731) -19.0% (1,302) -7.8% (429) 32.9%
12 Rent and leasing (124) -1.4% (134) -0.8% 10 -7.4%
13 Personnel costs (1,504) -16.5% (1,556) -9.4% 51 -3.3%
14 Other operating expenses (117) -1.3% (114) -0.7% (3) 2.5%
15 Total operating costs (3,476) -38.2% (3,106) -18.7% (370) 11.9%
16 EBITDA (9+10+15) 291 3.2% 3,863 23.2% (3,571) -92.5%
17 Amortisation and depreciation (308) -3.4% (259) -1.6% (49) 19.1%
18 Provisions 0 0.0% 0 0.0% 0 0.0%
19 Write-down of assets 0 0.0% 0 0.0% 0 0.0%
20 Asset write-backs 0 0.0% 0 0.0% 0 0.0%
21 Total non-monetary operating costs (308) -3.4% (259) -1.6% (49) 19.1%
22 EBIT (16+21) (17) -0.2% 3,604 21.7% (3,621) n.s.
The gross revenues of the Publishing segment decreased by 8,651 thousand euros during the quarter
compared to the third quarter of the previous year, whereas net revenues decreased by 7,545 thousand
euros, falling from 16,636 thousand euros to the current 9,090 thousand euros. Gross profit was 3,719
thousand euros versus 6,969 thousand euros in the third quarter of the previous year.
Operating expenses increased by 370 thousand euros, whereas non-monetary operating expenses
increased by 49 thousand euros, resulting in an EBITDA of a negative 17 thousand euros, compared to a
positive EBITDA of 3,604 thousand euros in the third quarter of the previous year.
Digital Bros Group Interim Management Statement at 31 March 2016
39
Mobile
The third quarter results for the Mobile segment compared with the same period of the prior year are
shown below:
Consolidated data in thousands of
euros Mobile
3rd quarter of
2015/2016
3rd quarter of
2014/2015 Change
1 Revenues 3,910 100.0% 4,669 100.0% (758) -16.2%
2 Revenue adjustments 0 0.0% 0 0.0% 0 0.0%
3 Total revenues 3,910 100.0% 4,669 100.0% (758) -16.2%
4 Purchase of goods for retail (0) 0.0% (0) 0.0% 0 0.0%
5 Purchase of services for retail (806) -20.6% (421) -9.0% (384) 91.3%
6 Royalties (3,108) -79.5% (1,956) -41.9% (1,152) 58.9%
7 Changes in finished product inventories 0 0.0% 0 0.0% (0) 0.0%
8 Total cost of sold products (3,914) -100.1% (2,378) -50.9% (1,536) 64.6%
9 Gross profit (3+8) (3) -0.1% 2,291 49.1% (2,294) n.s.
10 Other revenues 283 7.2% 130 2.8% 154 n.s.
11 Cost of services (172) -4.4% (216) -4.6% 44 -20.2%
12 Rent and leasing (15) -0.4% (15) -0.3% (0) 3.3%
13 Personnel costs (706) -18.1% (756) -16.2% 50 -6.6%
14 Other operating expenses (15) -0.4% (14) -0.3% (1) 4.3%
15 Total operating costs (908) -23.2% (1,001) -21.4% 93 -9.3%
16 EBITDA (9+10+15) (628) -16.1% 1,419 30.4% (2,047) n.s.
17 Amortisation and depreciation (377) -9.7% (386) -8.3% 8 -2.1%
18 Provisions 0 0.0% 0 0.0% 0 0.0%
19 Write-down of assets (0) 0.0% 0 0.0% (0) 0.0%
20 Asset write-backs 0 0.0% 0 0.0% 0 0.0%
21 Total non-monetary operating costs (378) -9.7% (386) -8.3% 8 -2.1%
22 EBIT (16+21) (1,006) -25.7% 1,034 22.1% (2,040) n.s.
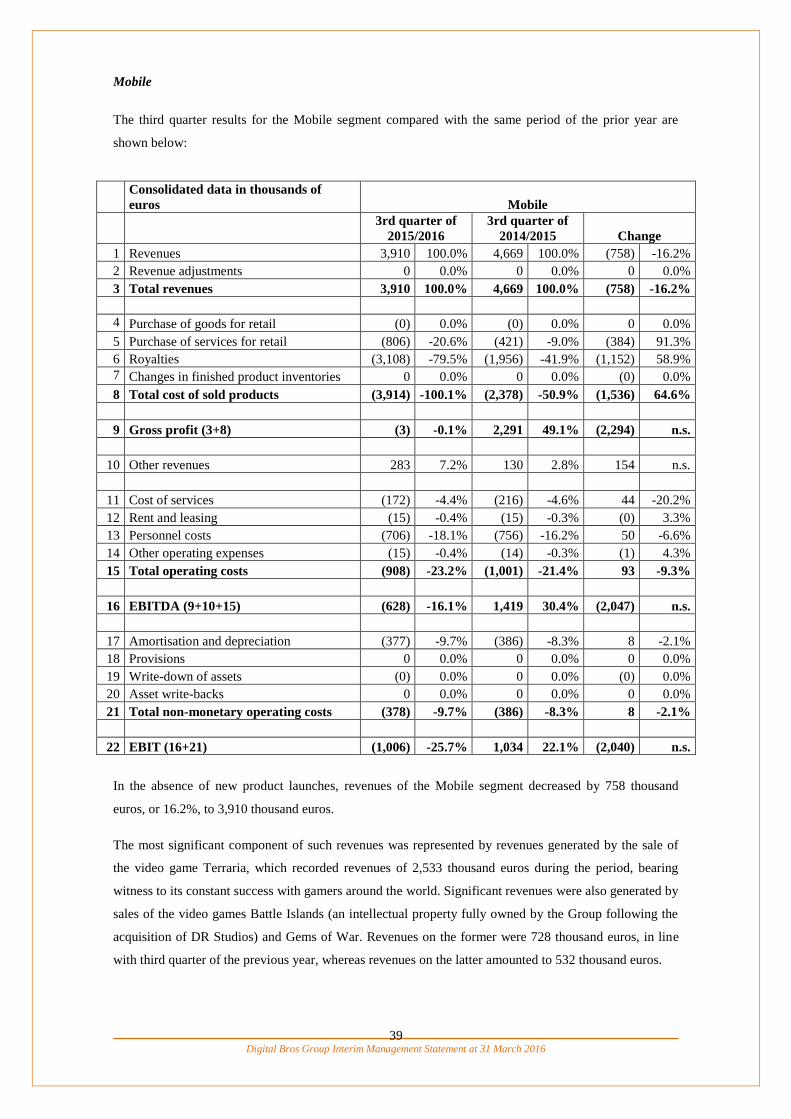
In the absence of new product launches, revenues of the Mobile segment decreased by 758 thousand
euros, or 16.2%, to 3,910 thousand euros.
The most significant component of such revenues was represented by revenues generated by the sale of
the video game Terraria, which recorded revenues of 2,533 thousand euros during the period, bearing
witness to its constant success with gamers around the world. Significant revenues were also generated by
sales of the video games Battle Islands (an intellectual property fully owned by the Group following the
acquisition of DR Studios) and Gems of War. Revenues on the former were 728 thousand euros, in line
with third quarter of the previous year, whereas revenues on the latter amounted to 532 thousand euros.

Digital Bros Group Interim Management Statement at 31 March 2016
40
The cost of goods sold increased by 1,536 thousand euros, due to an increase in royalty costs of 1,152
thousand euros. The increase compared to the same period of the previous year occurred even though the
share of revenues generated on products developed by Group companies, such as Battle Islands and Gems
of War, on which royalties do not accrue, were on the rise. The increase was due to costs for early
termination of development contracts of 2,019 thousand euros compared to 762 thousand euros in the
previous year. This component is quite typical of the segment.
The gross loss for the third quarter was 3 thousand euros, compared to a gross profit of 2,291 thousand
euros in the previous year.
Operating expenses decreased by 93 thousand euros compared to the same period of the previous year,
and non-monetary operating expenses decreased by 8 thousand euros, resulting in a negative EBITDA of
1,006 thousand euros, compared to a positive EBITDA of 1,034 thousand euros in the third quarter of the
previous year.

Digital Bros Group Interim Management Statement at 31 March 2016
41
Italian Distribution
The third quarter results for Italian Distribution compared with the same period of the prior year are
shown below:
Consolidated data in thousands of
euros Italian Distribution
3rd quarter of
2015/2016
3rd quarter of
2014/2015 Change
1 Revenues 2,357 100.1% 4,399 106.9% (2,042) -46.4%
2 Revenue adjustments (2) -0.1% (284) -6.9% 282 -99.4%
3 Total revenues 2,355 100.0% 4,115 100.0% (1,760) -42.8%
4 Purchase of goods for retail (3,212) -136.4% (5,223) -126.9% 2,011 -38.5%
5 Purchase of services for retail 0 0.0% 0 0.0% 0 0.0%
6 Royalties 0 0.0% 0 0.0% 0 0.0%
7 Changes in finished product inventories 1,048 44.5% 1,375 33.4% (327) -23.7%
8 Total cost of sold products (2,164) -91.9% (3,848) -93.5% 1,684 -43.8%
9 Gross profit (3+8) 191 8.1% 267 6.5% (76) -28.6%
10 Other revenues 35 1.5% 27 0.7% 8 28.4%
11 Cost of services (359) -15.3% (438) -10.6% 79 -18.0%
12 Rent and leasing (15) -0.6% (15) -0.4% 0 0.0%
13 Personnel costs (382) -16.2% (587) -14.3% 205 -34.9%
14 Other operating expenses (58) -2.5% (63) -1.5% 5 -8.4%
15 Total operating costs (814) -34.6% (1,103) -26.8% 289 -26.2%
16 EBITDA (9+10+15) (588) -25.0% (809) -19.7% 221 -27.3%
17 Amortisation and depreciation (49) -2.1% (57) -1.4% 8 -13.1%
18 Provisions 0 0.0% 0 0.0% 0 0.0%
19 Write-down of assets 0 0.0% 0 0.0% 0 0.0%
20 Asset write-backs 0 0.0% 0 0.0% 0 0.0%
21 Total non-monetary operating costs (49) -2.1% (57) -1.4% 8 -13.1%
22 EBIT (16+21) (638) -27.1% (867) -21.1% 229 -26.4%
Revenues for Italian Distribution fell 46.4% in the third quarter of the year, while net revenues were down
42.8%. Net revenues fell from the 4,115 thousand euros posted in the third quarter of the prior year to
2,355 thousand euros.
The breakdown of gross revenues by type of game distributed compared with the same period of the prior
year is as follows:

Digital Bros Group Interim Management Statement at 31 March 2016
42
EUR/000
3rd quarter of
2015/2016
3rd quarter of
2014/2015 Change
Distribution of video games for consoles 1,369 2,349 (980) -41.7%
Distribution of video games for PC-CDRom 53 253 (200) -79.1%
Distribution of trading cards 858 1,783 (925) -51.9%
Distribution of other products and services 83 28 55 n.s.
Financial discounts (6) (14) 8 -57.1%
Total gross revenues - Italian Distribution 2,357 4,399 (2,042) -46.4%
The segment’s costs of goods sold fell by 1,684 thousand euros, causing gross profit to drop by 76
thousand euros to 191 thousand euros from 267 thousand euros in the third quarter of the prior year.
Operating expenses decreased by 289 thousand euros, resulting in a decline in the operating loss of 229
thousand euros to 638 thousand euros, compared to 867 thousand euros in the third quarter of the
previous year.

Digital Bros Group Interim Management Statement at 31 March 2016
43
9. TREASURY SHARES
Pursuant to Art. 2428, paragraph 2 no. 3 of the Italian Civil Code, as at 31 March 2016 Digital Bros
S.p.A. owned 130,247 treasury shares, against the 400,247 held as at 30 June 2015.
In accordance with no. 4 of said paragraph 2, during the period the Company sold off 270,000 of its
treasury shares at the average price of 11.28 euros each, for a total value of 3,045 thousand euros.
10. RESEARCH AND DEVELOPMENT
During the period, the Group incurred research expenses of 40 thousand euros and development expenses
of 4,847 thousand euros. Such costs amounted to 683 thousand euros and 2,027 thousand euros,
respectively, during the period ended 31 March 2015.
Research and development activities relate to the preliminary phases preceding the design of new video
games and are primarily performed by the subsidiaries Pipeworks Inc. and DR Studios Ltd.
11. CONTINGENT ASSETS AND LIABILITIES
As at 31 March 2016, there were no contingent assets and liabilities, as in the same period of the previous
year.
12. SUBSEQUENT EVENTS
After the end of the period, Digital Bros S.p.A. purchased 583,639 Starbreeze B shares for a total of 941
thousand euros and disposed of 583,639 Starbreeze B ordinary shares for a total of 939 thousand euros.
The parent company purchased 291,819 Starbreeze A ordinary shares for a total of 470 thousand euros.

Digital Bros Group Interim Management Statement at 31 March 2016
44
13. OUTLOOK
The investment plan undertaken by the Group in the past 18 months, involving the simultaneous
development of a number of new products, will begin to generate revenues in the first quarter of next
year. Contrary to the announcement made at the end of February, the release of Assetto Corsa has been
postponed until the end of August 2016 for commercial reasons. This decision was due not only to
international athletic events such as the Olympic Games and the 2016 European Championships, but also
a competitive analysis of the release of competing products on the market. Despite this postponement, the
Group, due in part to the launch of Battle Ages for the Mobile segment and Rocket League for the
Publishing segment, nonetheless foresees that it will end the fourth quarter with a profit, although of a
more modest amount than previously announced, not sufficient to offset all of the losses recorded in the
rest of the year.
The decision to postpone the launch of Assetto Corsa will significantly shift revenues and margins from
the fourth quarter to the first quarter of next year, resulting in the expectation of a sharp increase in sales
and a significant level of profit margins for 2016-2017.
Net financial debt, which increased in line with investments during the period, will tend to increase
further in the fourth quarter in keeping with the progress of the investment plan. Following the launch of
the products on the market, it will then resume its natural tendency to decline starting in the first quarter
of next year.

Digital Bros Group Interim Management Statement at 31 March 2016
45
14. OTHER INFORMATION
EMPLOYEES
Below are the details of the workforce as at 31 March 2016 with comparative figures as at 31 March
2015:
Type 31 March 2016 31 March 2015 Change
Executives 10 9 1
Office workers 228 196 32
Blue-collar workers and apprentices 4 5 (1)
Total employees 242 210 32
The same details for employees at the Group’s foreign companies as at 31 December 2015, compared
with 31 December 2014, are as follows:
Type 31 March 2016 31 March 2015 Change
Executives 5 5 0
Office workers 172 139 33
Total foreign employees 177 144 33
The average headcount for the period, calculated as the average number of employees in service at the
end of every month, is shown below:
Type
Average number for
2016
Average number for
2015
Change
Executives 10 8 2
Office workers 220 183 37
Blue-collar workers and apprentices 4 6 (2)
Total employees 234 197 37
The average headcount for the period at foreign companies is as follows:
Type
Average number for
2016
Average number for
2015
Change
Executives 5 4 1
Office workers 164 124 40
Total foreign employees 169 128 41
The increase in the number of foreign employees is the result of the acquisitions in the previous year.
The Group’s Italian subsidiaries use the current Confcommercio national collective employment contract
for the commercial, distribution and services sector.
ENVIRONMENT
As at 31 March 2016 there were no issues of an environmental nature, and as the Group’s environment-
related activities consist chiefly of packing and shipping video games and affixing labels to packaging,
there is no reason any such problems should arise in the future.

Digital Bros Group Interim Management Statement at 31 March 2016
46
Abridged consolidated financial statements
as at 31 March 2016

Digital Bros Group Interim Management Statement at 31 March 2016
47
FINANCIAL STATEMENTS Digital Bros Group
Consolidated statement of financial position as at March 2016
EUR/000 31 March 2016 30 June 2015 Change
Non-current assets
1 Property, plant and equipment 7,300 4,841 2,459 50.8%
2 Investment property 0 0 0 0.0%
3 Intangible assets 9,933 7,946 1,987 25.0%
4 Equity investments 725 1,274 (549) -43.0%
5 Non-current receivables and other assets 1,053 1,058 (5) -0.5%
6 Deferred tax assets 3,548 2,240 1,308 58.4%
Total non-current assets 22,559 17,359 5,200 30.0%
Non-current liabilities
7 Employee benefits (480) (486) 6 -1.2%
8 Non-current provisions (88) (170) 82 -48.1%
9 Other non-current payables and liabilities 0 (589) 589 n.s.
Total non-current liabilities (568) (1,245) 677 -54.4%
Net working capital
10 Inventories 11,717 12,881 (1,164) -9.0%
11 Trade receivables 31,683 36,350 (4,667) -12.8%
12 Tax credits 3,408 2,466 942 38.2%
13 Other current assets 4,509 6,148 (1,639) -26.7%
14 Trade payables (18,004) (26,929) 8,925 -33.1%
15 Tax payables (1,902) (3,029) 1,127 -37.2%
16 Current provisions 0 0 0 0.0%
17 Other current liabilities (1,172) (1,859) 687 -37.0%
Total net working capital 30,239 26,028 4,211 16.2%
Shareholders’ equity
18 Share capital (5,644) (5,644) 0 0.0%
19 Reserves (19,927) (19,417) (510) 2.6%
20 Treasury shares 390 1,199 (809) -67.5%
21 Retained earnings (losses) (9,074) (9,947) 873 -8.8%
Total shareholders’ equity (34,255) (33,809) (445) 1.3%
Total net assets 17,975 8,333 9,642 n.s.
22 Cash and cash equivalents 2,197 4,339 (2,142) -49.4%
23 Current payables due to banks (22,136) (12,738) (9,398) 73.8%
24 Other current financial assets and liabilities 4,157 1,685 2,472 n.s.
Current net financial position (15,782) (6,714) (9,068) n.s.
25 Non-current financial assets 1,195 0 1,195 0.0%
26 Non-current payables due to banks (1,687) (1,619) (68) 4.2%
27 Other non-current financial liabilities (1,701) 0 (1,701) 0.0%
Non-current net financial position (2,193) (1,619) (574) 35.5%
Total net financial position (17,975) (8,333) (9,642) n.s.

Digital Bros Group Interim Management Statement at 31 March 2016
48
Digital Bros Group
Consolidated income statement as at 31 March 2016
EUR/000 31 March 2016 31 March 2015 Change
1 Gross revenues 61,281 104.6% 88,258 104.4% (26,977) -30.6%
2 Revenue adjustments (2,680) -4.6% (4,288) -4.4% 1,608 -37.5%
3 Total net revenues 58,601 100.0% 83,970 100.0% (25,369) -30.2%
4 Purchase of goods for retail (16,372) -27.9% (26,741) -30.9% 10,369 -38.8%
5 Purchase of services for retail (4,438) -7.6% (3,912) -4.9% (526) 13.5%
6 Royalties (14,648) -25.0% (21,813) -24.4% 7,165 -32.8%
7 Changes in finished product inventories (1,164) -2.0% (216) -2.7% (948) n.s.
8 Total cost of sold products (36,622) -62.5% (52,682) -63.0% 16,060 -30.5%
9 Gross profit (3+8) 21,979 37.5% 31,288 37.0% (9,309) -29.8%
10 Other revenues 4,366 7.5% 955 0.4% 3,411 n.s.
11 Cost of services (9,847) -16.8% (7,858) -9.3% (1,989) 25.3%
12 Rent and leasing (1,159) -2.0% (1,149) -1.3% (10) 0.8%
13 Personnel costs (14,601) -24.9% (12,680) -13.0% (1,921) 15.1%
14 Other operating expenses (1,136) -1.9% (948) -1.1% (188) 19.8%
15 Total operating costs (26,743) -45.6% (22,635) -24.6% (4,108) 18.1%
16 EBITDA (9+10+15) (398) -0.7% 9,608 12.9% (10,006) n.s.
17 Amortisation and depreciation (2,798) -4.8% (2,183) -2.2% (615) 28.2%
18 Provisions 0 0.0% 0 -0.1% 0 n.s.
19 Write-down of assets (425) -0.7% (332) -0.6% (93) 28.0%
20 Write-backs and non-monetary income 588 1.0% 0 0.0% 588 0.0%
21
Total non-monetary income and
operating costs (2,635) -4.5% (2,515) -2.9% (120) 4.8%
22 EBIT (16+21) (3,033) -5.2% 7,093 10.0% (10,126) n.s.
23 Interest and financial income 2,574 4.4% 2,905 2.3% (331) -11.4%
24 Interest and financial expenses (1,222) -2.1% (1,384) -1.4% 162 -11.8%
25 Net financial income 1,352 2.3% 1,521 0.9% (169) -11.1%
26 Pre-tax income (22+25) (1,681) -2.9% 8,614 10.9% (10,295) n.s.
27 Current taxes (1,116) -1.9% (3,604) -4.2% 2,488 -69.0%
28 Deferred taxes 1,506 2.6% 578 0.0% 928 n.s.
29 Total income taxes 390 0.7% (3,026) -4.2% 3,416 n.s.
30 Net profit (26+29) (1,291) -2.2% 5,588 6.7% (6,879) n.s.
Net income per share:
33 Basic earnings per share (in euros) (0.09) 0.41 (0.50) n.s.
34 Diluted earnings per share (in euros) (0.09) 0.41 (0.50) n.s.

Digital Bros Group Interim Management Statement at 31 March 2016
49
Digital Bros Group
Consolidated statement of comprehensive income as at 31 March 2016
EUR/000 31 March 2016 31 March 2015 Change
Net profit (loss) for the period (A) (1,291) 5,588 (6,879)
Items that will not subsequently be
reclassified to the income statement (B)
Actuarial profit (loss) (4) (17) 13
Tax effect relating to the actuarial profit (loss) 1 5 (4)
Differences from the conversion of foreign
accounts (554) (293) (261)
Tax effect relating to the conversion differences
of foreign accounts 0 0 0
Fair value adjustment of shares “available for
sale” 1,472 0 1,472
Tax effect related to the fair value adjustment of
shares “available for sale” (405) 0 (405)
Items that will subsequently be reclassified to
the income statement (C) 510 (305) 815
Total other items of comprehensive profit D
= (B)+(C) 510 (305) 815
Total comprehensive profit (loss) (A)+(D) (781) 5,283 (6,064)
Attributable to:
Shareholders of the parent company (781) 5,283 (6,064)
Equity investments pertaining to third parties 0 0 0
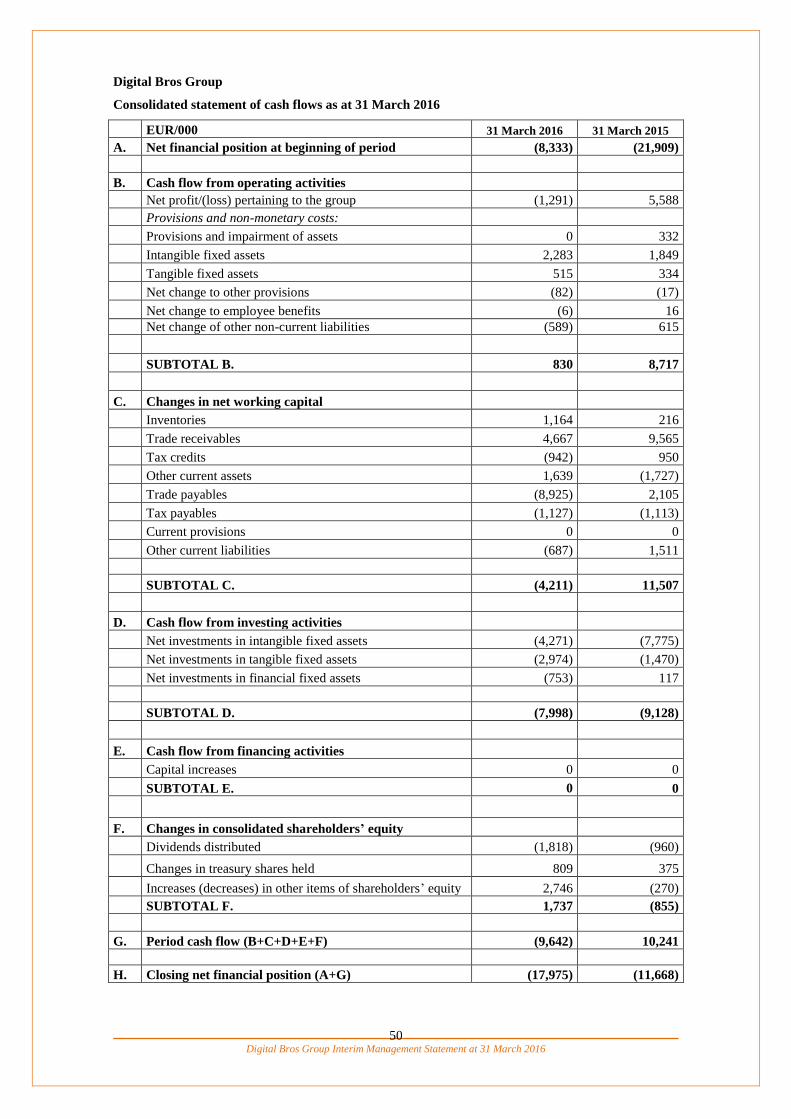
Digital Bros Group Interim Management Statement at 31 March 2016
50
Digital Bros Group
Consolidated statement of cash flows as at 31 March 2016
EUR/000 31 March 2016 31 March 2015
A. Net financial position at beginning of period (8,333) (21,909)
B. Cash flow from operating activities
Net profit/(loss) pertaining to the group (1,291) 5,588
Provisions and non-monetary costs:
Provisions and impairment of assets 0 332
Intangible fixed assets 2,283 1,849
Tangible fixed assets 515 334
Net change to other provisions (82) (17)
Net change to employee benefits (6) 16
Net change of other non-current liabilities (589) 615
SUBTOTAL B. 830 8,717
C. Changes in net working capital
Inventories 1,164 216
Trade receivables 4,667 9,565
Tax credits (942) 950
Other current assets 1,639 (1,727)
Trade payables (8,925) 2,105
Tax payables (1,127) (1,113)
Current provisions 0 0
Other current liabilities (687) 1,511
SUBTOTAL C. (4,211) 11,507
D. Cash flow from investing activities
Net investments in intangible fixed assets (4,271) (7,775)
Net investments in tangible fixed assets (2,974) (1,470)
Net investments in financial fixed assets (753) 117
SUBTOTAL D. (7,998) (9,128)
E. Cash flow from financing activities
Capital increases 0 0
SUBTOTAL E. 0 0
F. Changes in consolidated shareholders’ equity
Dividends distributed (1,818) (960)
Changes in treasury shares held 809 375
Increases (decreases) in other items of shareholders’ equity 2,746 (270)
SUBTOTAL F. 1,737 (855)
G. Period cash flow (B+C+D+E+F) (9,642) 10,241
H. Closing net financial position (A+G) (17,975) (11,668)

Digital Bros Group Interim Management Statement at 31 March 2016
51
Notes to the statement of cash flows
Details of cash flow movements by maturity:
EUR/000 31 March 2016 31 March 2015
Increase (decrease) in securities and liquid funds (2,142) (1,183)
Decrease (increase) in current payables due to banks (9,398) 8,108
Decrease (increase) in other current financial assets and liabilities 2,472 3,050
Change in financial position due to acquisition of equity investments 0 252
Short-term period cash flow (9,068) 10,227
Medium-term period cash flow (574) 14
Period cash flow (9,642) 10,241

Digital Bros Group Interim Management Statement at 31 March 2016
52
Digital Bros Group
Consolidated statement of changes in equity
EUR/000
Share
capital
(A)
Share
premium
reserve
Legal
reserve
IAS
transition
reserve
Translation
reserve
Other
reserves
Total
reserves
(B)
Treasury
shares
(C)
Retained
earnings
(losses)
Period
profit
(loss)
Total
retained
earnings
(D)
Group
consolidated
shareholders’
equity
(A+B+C+D)
Total as at 01 July 2014 5,644 16,954 1,129 1,367 145 (86) 19,509 (1,574) (122) 1,924 1,802 25,381
Allocation of period profit 0 (1,924) 1,924 0 0
Distribution of dividends 0 (960) (960) (960)
Other changes 35 35 375 0 410
Comprehensive profit (loss) (293) (12) (305) 5,588 5,588 5,283
Total as at 31 March 2015 5,644 16,954 1,129 1,367 (148) (63) 19,239 (1,199) (3,006) 9,436 6,430 30,114
Total as at 01 July 2015 5,644 16,954 1,129 1,367 (244) 211 19,417 (1,199) (3,006) 12,953 9,947 33,809
Allocation of period profit 0 9,105 (9,105) 0 0
Distribution of dividends (1,818) (1,818) (1,818)
Other changes 0 809 2,236 2,236 3,045
Comprehensive profit (loss) (554) 1,064 510 (1,291) (1,291) (781)
Total as at 31 March 2016 5,644 16,954 1,129 1,367 (798) 1,275 19,927 (390) 6,517 2,557 9,074 34,255

Digital Bros Group Interim Management Statement at 31 March 2016
53
Notes to the abridged consolidated financial
statements as at 31 March 2016

Digital Bros Group Interim Management Statement at 31 March 2016
54
1. Introductory note
For information concerning form and content, and other general information, accounting policies,
discretionary assessments and significant estimates, consolidation criteria, interests in associates and other
companies and business combinations, refer to the notes on the abridged consolidated financial statements
as at 31 December 2015 and the notes to the consolidated financial statements as at 30 June 2015.
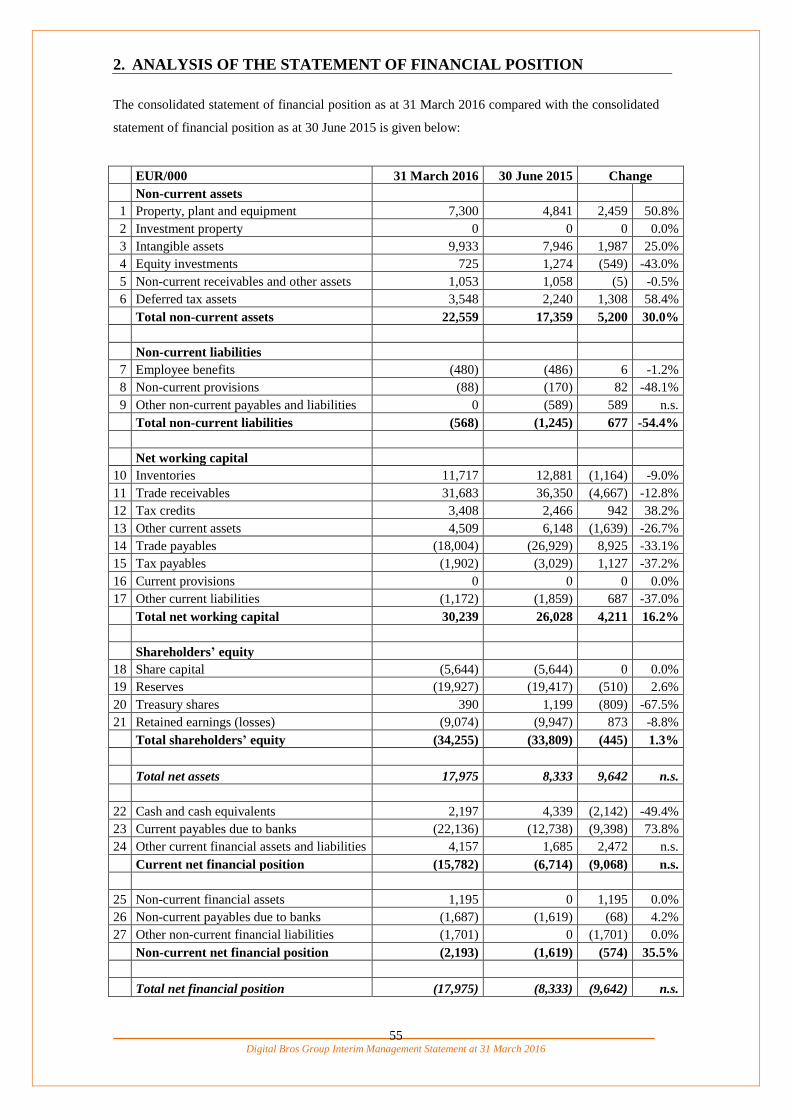
Digital Bros Group Interim Management Statement at 31 March 2016
55
2. ANALYSIS OF THE STATEMENT OF FINANCIAL POSITION
The consolidated statement of financial position as at 31 March 2016 compared with the consolidated
statement of financial position as at 30 June 2015 is given below:
EUR/000 31 March 2016 30 June 2015 Change
Non-current assets
1 Property, plant and equipment 7,300 4,841 2,459 50.8%
2 Investment property 0 0 0 0.0%
3 Intangible assets 9,933 7,946 1,987 25.0%
4 Equity investments 725 1,274 (549) -43.0%
5 Non-current receivables and other assets 1,053 1,058 (5) -0.5%
6 Deferred tax assets 3,548 2,240 1,308 58.4%
Total non-current assets 22,559 17,359 5,200 30.0%
Non-current liabilities
7 Employee benefits (480) (486) 6 -1.2%
8 Non-current provisions (88) (170) 82 -48.1%
9 Other non-current payables and liabilities 0 (589) 589 n.s.
Total non-current liabilities (568) (1,245) 677 -54.4%
Net working capital
10 Inventories 11,717 12,881 (1,164) -9.0%
11 Trade receivables 31,683 36,350 (4,667) -12.8%
12 Tax credits 3,408 2,466 942 38.2%
13 Other current assets 4,509 6,148 (1,639) -26.7%
14 Trade payables (18,004) (26,929) 8,925 -33.1%
15 Tax payables (1,902) (3,029) 1,127 -37.2%
16 Current provisions 0 0 0 0.0%
17 Other current liabilities (1,172) (1,859) 687 -37.0%
Total net working capital 30,239 26,028 4,211 16.2%
Shareholders’ equity
18 Share capital (5,644) (5,644) 0 0.0%
19 Reserves (19,927) (19,417) (510) 2.6%
20 Treasury shares 390 1,199 (809) -67.5%
21 Retained earnings (losses) (9,074) (9,947) 873 -8.8%
Total shareholders’ equity (34,255) (33,809) (445) 1.3%
Total net assets 17,975 8,333 9,642 n.s.
22 Cash and cash equivalents 2,197 4,339 (2,142) -49.4%
23 Current payables due to banks (22,136) (12,738) (9,398) 73.8%
24 Other current financial assets and liabilities 4,157 1,685 2,472 n.s.
Current net financial position (15,782) (6,714) (9,068) n.s.
25 Non-current financial assets 1,195 0 1,195 0.0%
26 Non-current payables due to banks (1,687) (1,619) (68) 4.2%
27 Other non-current financial liabilities (1,701) 0 (1,701) 0.0%
Non-current net financial position (2,193) (1,619) (574) 35.5%
Total net financial position (17,975) (8,333) (9,642) n.s.

Digital Bros Group Interim Management Statement at 31 March 2016
56
NON-CURRENT ASSETS
During the period, investments of 2,974 thousand euros were made in property, plant and equipment and
of 5,416 thousand euros in intangible assets.
Investments made in fixed assets during the period are as follows:
EUR/000 31 March
2016
31 March
2015
Purchase of Eugene property used as office of Pipeworks Inc. 2,196 0
Improvements made to the property of the new office of 505 Games (US) Inc. 402 735
Office automation equipment 309 246
Investments for Digital Bros Game Academy S.r.l. 0 104
Furnishing for 505 Games (US) Inc. 33 73
Other 34 6
Total investments during the period (A) 2,974 1,164
Office automation equipment and furnishing supplied by Pipeworks Inc. 0 239
Office automation equipment and furnishing supplied by DR Studios Ltd. 0 67
Total intangible fixed assets supplied by the companies acquired (B) 0 306
Reclassification of the property in Via Labus, Milan (C) 0 455
Total increase in tangible fixed assets (A+B+C) 2,974 1,925
Investments in intangible assets consist primarily of internal development orders and investments in the
game Fantasfida. Details are as follows:
EUR/000 31 March
2016
31 March
2015
In-company development orders 3,333 970
Fantasfida 639 0
Rights to use Gems of Wars 360 374
Rights to use Brothers 356 502
Rights to use Battle Ages 255 130
Battle Islands 237 3,613
Investments in the development of the management systems 177 121
Rights to use How to Survive 1.5 30 325
Pipeworks Inc. contracts 0 1,314
Rights to use Mythic Islands 0 212
Cityglance app 0 112
Other 29 102
Total intangible assets 5,416 7,775
Equity investments decreased by 549 thousand euros due to the classification among other current
financial assets of the Starbreeze A shares of 969 thousand euros at 30 June 2015 and the increase of 420
thousand euros relating to the purchase of a 28.58% interest in Ovosonico S.r.l.
Non-current receivables and other assets, comprised of security deposits, are made up as follows:
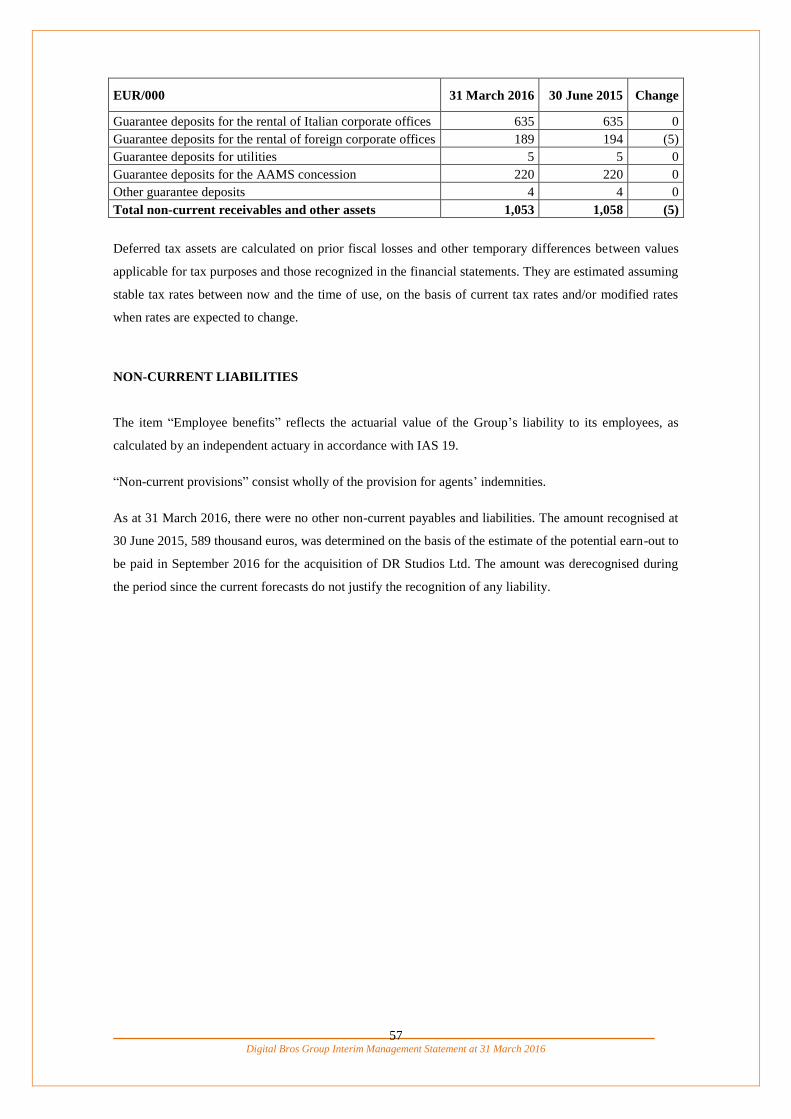
Digital Bros Group Interim Management Statement at 31 March 2016
57
EUR/000 31 March 2016 30 June 2015 Change
Guarantee deposits for the rental of Italian corporate offices 635 635 0
Guarantee deposits for the rental of foreign corporate offices 189 194 (5)
Guarantee deposits for utilities 5 5 0
Guarantee deposits for the AAMS concession 220 220 0
Other guarantee deposits 4 4 0
Total non-current receivables and other assets 1,053 1,058 (5)
Deferred tax assets are calculated on prior fiscal losses and other temporary differences between values
applicable for tax purposes and those recognized in the financial statements. They are estimated assuming
stable tax rates between now and the time of use, on the basis of current tax rates and/or modified rates
when rates are expected to change.
NON-CURRENT LIABILITIES
The item “Employee benefits” reflects the actuarial value of the Group’s liability to its employees, as
calculated by an independent actuary in accordance with IAS 19.
“Non-current provisions” consist wholly of the provision for agents’ indemnities.
As at 31 March 2016, there were no other non-current payables and liabilities. The amount recognised at
30 June 2015, 589 thousand euros, was determined on the basis of the estimate of the potential earn-out to
be paid in September 2016 for the acquisition of DR Studios Ltd. The amount was derecognised during
the period since the current forecasts do not justify the recognition of any liability.

Digital Bros Group Interim Management Statement at 31 March 2016
58
NET WORKING CAPITAL
Net working capital increased by 4,583 thousand euros compared to 30 June 2015, despite the decline in
inventories of 1,164 thousand euros. This increase contrasted with the decline in sales, which normally
permits a simultaneous reduction of net working capital, manifest in the item trade payables.
An analysis of net working capital in comparison with figures at 30 June 2015 is provided below:
EUR/000 31 March 2016 30 June 2015 Change
Inventories 11,717 12,881 (1,164) -9.0%
Trade receivables 31,683 36,350 (4,667) -12.8%
Tax credits 3,408 2,466 942 38.2%
Other current assets 4,509 6,148 (1,639) -26.7%
Trade payables (18,004) (26,929) 8,925 -33.1%
Tax payables (1,902) (3,029) 1,127 -37.2%
Current provisions 0 0 0 0.0%
Other current liabilities (1,172) (1,859) 687 -37.0%
Total net working capital 30,239 26,028 4,211 16.2%
Net working capital increased by 4,211 thousand euros compared to 30 June 2015, despite the decline in
inventories of 1,164 thousand euros. This increase contrasted with the decline in sales, which normally
permits a simultaneous reduction of net working capital, as manifest in the 33.1% decrease in trade
payables. The process of significant investments in new products launched by the Group in the past
several months, expected to begin to generate revenues in the following year, had a significant impact on
trade receivables, which declined by 12.8%, a much smaller decrease than the drop in revenues of 30%.
The item consists of trade receivables and advances for licences for the use of video games. Its
composition is therefore fundamental to an understanding of the performance of net working capital and
illustrated below:
EUR/000 31 March 2016 30 June 2015 Change
Receivables due from customers 12,814 24,824 (12,010)
Receivables for licences to use video games 18,869 11,526 7,343
Total trade receivables 31,683 36,350 (4,667)

Digital Bros Group Interim Management Statement at 31 March 2016
59
SHAREHOLDERS’ EQUITY
Detailed changes in shareholders’ equity are reported in the consolidated statement of changes in equity. They can be summarised as follows:
EUR/000 Share
capital
(A)
Share
premium
reserve
Legal
reserve
IAS
transition
reserve
Translation
reserve
Other
reserves
Total
reserves
(B)
Treasury
shares
(C)
Retained
earnings
(losses)
Period
profit
(loss)
Total
retained
earnings
(D)
Group
consolidated
shareholders’
equity
(A+B+C+D)
Total as at 01 July 2015 5,644 16,954 1,129 1,367 (244) 211 19,417 (1,199) (3,006) 12,953 9,947 33,809
Allocation of period profit 0 9,105 (9,105) 0 0
Distribution of dividends (1,818) (1,818) (1,818)
Other changes 0 809 2,236 2,236 3,045
Comprehensive profit (loss) (554) 1,064 510 (1,291) (1,291) (781)
Total as at 31 March 2016 5,644 16,954 1,129 1,367 (798) 1,275 19,927 (390) 6,517 2,557 9,074 34,255
The share capital (unchanged with respect to 30 June 2015) is divided into 14,110,837 ordinary shares of par value of 0.40 euros each, for a total of 5,644,334.8 euros. There are no
other types of shares outstanding. There are no rights, preferences or restrictions on ordinary shares.
No specific uses or objectives have been designated for individual equity reserves, other than those defined by law.
During the period, 270,000 treasury shares were sold for an average price of 11.28 euros per share, for a total of 3,045 thousand euros. The book value of the shares sold was 809
thousand euros and represents the change in the heading “Treasury shares”, whereas the positive differential of 2,236 thousand euros was classified as other changes in retained
earnings.

Digital Bros Group Interim Management Statement at 31 March 2016
60
The changes in reserves in the period are:
EUR/000 31 March 2016
Change in the translation reserve (554)
Change in the IAS 19 reserve (3)
Change in the security valuation reserve 1,067
Total changes in reserves 510
The change in the security valuation reserve was due to the difference between the market value at the
end of the period and the purchase cost of the Starbreeze A ordinary shares held on 31 March 2016 and
originally classified amongst equity investments.
NET FINANCIAL POSITION
The breakdown of the Group’s net financial position as at 31 March 2016 as compared with the same data
at 30 June 2015 is as follows:
EUR/000 31 March 2016 30 June 2015 Change
22 Cash and cash equivalents 2,197 4,339 (2,142)
23 Short-term payables due to banks (22,136) (12,738) (9,398)
24 Other current financial assets and liabilities 4,157 1,685 2,472
Current net financial position (15,782) (6,714) (9,068)
25 Non-current financial assets 1,195 0 1,195
26 Non-current payables due to banks (1,687) (1,619) (68)
27 Other non-current financial liabilities (1,701) 0 (1,701)
Non-current net financial position (2,193) (1,619) (574)
Total net financial position (17,975) (8,333) (9,642)
Net financial debt increased by 9,642 thousand euros compared to 30 June 2015, primarily due to the
increase in current payables due to banks of 9,398 thousand euros, the decrease in cash and cash
equivalents of 2,142 thousand euros and the increase in other non-current financial liabilities of 1,701
thousand euros, partially offset by the increase in other current financial assets and liabilities of 2,472
thousand euros and non-current financial assets of 1,195 thousand euros.
At the end of the period, the carrying values of the financial instruments held by the Group were equal to
their fair values. For cash and cash equivalents, carrying amount is a reasonable approximation of fair
value since these are highly liquid forms of investment, while for finance lease liabilities (included with
other financial liabilities), carrying amount is a reasonable approximation of fair value.
The following table shows the Group’s financial liabilities as at 31 March 2016, grouped by maturity:

Digital Bros Group Interim Management Statement at 31 March 2016
61
EUR/000 Due within
12 months
1-5
years
over 5
years Total
Payables due to banks relating to current accounts (28) 0 0 (28)
Payables due to banks relating to the financing of
import and export (18,183) 0 0 (18,183)
Payables due to banks relating to advances on invoices
and subject to collection (2,270) 0 0 (2,270)
Payables due to banks for unsecured loans (1,655) (1,687) 0 (3,342)
Total amounts due to banks (A) (22,136) (1,687) 0 (23,823)
Other financial liabilities (B) (318) (1,701) 0 (2,019)
Total financial liabilities (A) + (B) (22,454) (3,388) 0 (25,842)
Current net financial position
The current net financial position is made up as follows:
EUR/000 31 March 2016 30 June 2015 Change
22 Cash and cash equivalents 2,197 4,339 (2,142)
23 Short-term payables due to banks (22,136) (12,738) (9,398)
24 Other current financial assets and liabilities 4,157 1,685 2,472
Total current net financial position (15,782) (6,714) (9,068)
22. Cash and cash equivalents
As at 31 March 2016 cash and cash equivalents, which were not subject to any restrictions, consisted of
sight deposits at banks. Details are as follows:
EUR/000 31 March 2016 30 June 2015 Change
Cash on hand and bank deposits 2,197 4,018 (1,821)
AXA MPS Quadrante policy 0 321 (321)
Total liquid funds 2,197 4,339 (2,142)
The Group’s liquid funds as at 31 March 2016 amounted to 2,197 thousand euros, down by 1,821
thousand euros on 30 June 2015.
At 30 June 2015, the heading included a Quadrante insurance policy contracted by Digital Bros S.p.A.
and issued by AXA MPS, which was paid out during the period.

Digital Bros Group Interim Management Statement at 31 March 2016
62
23. Short-term payables due to banks
Short-term payables due to banks are comprised of account overdrafts, import-export financing, advances
on invoices, and advances subject to collection. Most of the increase in short-term payables due to banks
with respect to 30 June 2015 (9,398 thousand euros) is due to the rise in import-export financing and
advances on invoices subject to collection. Details are as follows:
EUR/000 31 March 2016 30 June 2015 Change
Current account overdrafts (28) (13) (15)
Loans for import and export (18,183) (10,529) (7,654)
Advances on invoices and subject to collection (2,270) (859) (1,411)
Loans payable within 12 months (1,655) (1,337) (318)
Total short-term payables due to banks (22,136) (12,738) (9,398)
Payables due to banks do not involve pledges, guarantees or covenants to be satisfied by the Group.
The portion of loans payable within twelve months as at 31 March 2016 consists of, for 905 thousand
euros, the short-term portion of a loan granted by UniCredit S.p.A. maturing in January 2018 and, for 750
thousand euros, the short-term portion of a loan granted by Monte dei Paschi di Siena S.p.A. maturing in
December 2017.
24. Other current financial liabilities
The breakdown of other current financial assets and liabilities is as follows:
EUR/000 31 March 2016 30 June 2015 Change
Starbreeze A shares 4,256 0 4,256
Starbreeze B shares 0 1,553 (1,553)
Receivables collected by factoring companies on behalf
of 505 Games Ltd. 219 302 (83)
Advances on the non-recourse factoring of trade
receivables (144) (151) 7
Leasing instalments due within twelve months (14) (19) 5
Loan for the purchase of Eugene property (160) 0 (160)
Total other current financial assets and liabilities 4,157 1,685 (2,472)
The caption “Starbreeze A shares” refers to the market value of 2,549,502 Starbreeze A shares (listed on
NASDAQ Stockholm First North Premier). These shares were measured at fair value with recognition in
equity reserve of the difference between the book value and the market value at 30 June 2015 as financial
instruments classified as available for sale. The balance at 31 March 2016 is composed of 969 thousand
euros from the classification to the caption of the shares that as at 30 June 2015 were classified as
financial fixed assets, and the remainder, of 3,287 thousand euros, of purchases for the period and the
mark-to-market of the shares held.

Digital Bros Group Interim Management Statement at 31 March 2016
63
At 30 June 2015, the caption “Starbreeze B shares” referred to the market value of 1,220,691 Starbreeze
B shares (listed on NASDAQ Stockholm First North Premier). During the period, the shares were all
sold.
Receivables collected from factoring companies on behalf of 505 Games Ltd. are amounts relating to
certain receivables claimed by 505 Games Ltd. in respect of its customers and that were collected by
Unicredit Factoring and Mediofactoring by 31 March 2016 and paid to the subsidiary only subsequently.
Advances on the non-recourse factoring of trade receivables of 144 thousand euros decreased by 7
thousand euros compared with 30 June 2015.
Leasing instalments due within twelve months are composed of 5 thousand euros attributable to the full
residual amount of the finance lease entered into with UniCredit Leasing for a motor vehicle and of 9
thousand euros of the short-term portion of a new lease agreement entered into with UniCredit Leasing
for the purchase of a server.
The 46 thousand euros lease contract for the motor vehicle called for 47 monthly payments of 1 thousand
euros each, plus an advance payment of 9 thousand euros and an end-of-lease purchase option of 5
thousand euros. The lease contract matures on 02 April 2016. The effective interest rate is 6.46%;
The loan for the purchase of the Eugene property of 180 thousand U.S. dollars relates to the portion due
within twelve months of the loan received from Spring Properties Inc. for the purchase of the property
used as the office of Pipeworks Inc.
Non-current net financial position
Non-current net financial position is made up as follows:
EUR/000 31 March 2016 30 June 2015 Change
25 Non-current financial assets 1,195 0 1,195
26 Non-current payables due to banks (1,687) (1,619) (68)
27 Other non-current financial liabilities (37) 0 (37)
Total current net financial position (529) (1,619) 1,090
25. Non-current financial assets
As at 31 March 2016 the heading includes a loan of JPY 150,000,000 granted by 505 Games S.r.l. to
Shinshuppatsu Junbi Co. Ltd. The loan, which bears interest at an annual rate of 7%, may be repaid on
demand, but the Group estimates that the borrower will make use of the funds for at least two years. The
loan was granted to the company concerned as part of a broader commercial agreement concerning the
joint development of certain video games.

Digital Bros Group Interim Management Statement at 31 March 2016
64
26. Non-current payables due to banks
Non-current payables due to banks include 937 thousand euros of the portion due beyond 12 months of a
loan granted by UniCredit S.p.A. and 750 thousand euros of the portion due beyond 12 months of a loan
granted by Monte dei Paschi di Siena S.p.A. The loan granted by Unicredit S.p.A. to the parent company
was granted on 1 April 2015 for 2.5 million euros. The loan provides for interest payments and the
repayment of capital through deferred quarterly instalments starting from 31 July 2015. The interest rate
is variable and is determined based on the 3-month Euribor plus a spread of 3.50 percentage points. The
loan by Monte dei Paschi di Siena S.p.A. to the parent company was granted on 23 November 2015 for
1.5 million euros. The loan calls for repayment over two years in six quarterly instalments, inclusive of
principal and interest, starting on 30 September 2016, plus two instalments of interest only, due on 31
March 2016 and 30 June 2016. The interest rate is variable and is determined based on the 6-month
Euribor plus a spread of 2 percentage points.
27. Other non-current financial liabilities
The item is primarily composed (1,664 thousand euros) of the portion due beyond twelve months of a
loan granted by Spring Properties, Inc. for the purchase of the Eugene property used as the office of
Pipeworks Inc. The loan of 2,125 thousand U.S. dollars is to be repaid in monthly instalments of 15
thousand U.S. dollars at an annual interest rate of 6%.
The remainder, 37 thousand euros, relates to leasing instalments due beyond twelve months on a finance
lease contract with UniCredit Leasing for the purchase of a server. The 54 thousand euros lease contract
with calls 59 monthly payments of plus an advance payment of 5 thousand euros and an end-of-lease
purchase option of 1 thousand euros. The lease contract matures on 29 December 2020. The amount of
the instalments due beyond the twelve months comes to 37 thousand euros. The interest rate is variable
and is determined based on the 3-month Euribor plus a spread of 3 percentage points.
The following table shows finance lease payments by maturity:
EUR/000 31 March 2016 30 June 2015 Change
Due within 12 months 14 19 (5)
1-5 years 0 0 0
Non-current (5 years) 37 0 37
Total 51 19 (32)
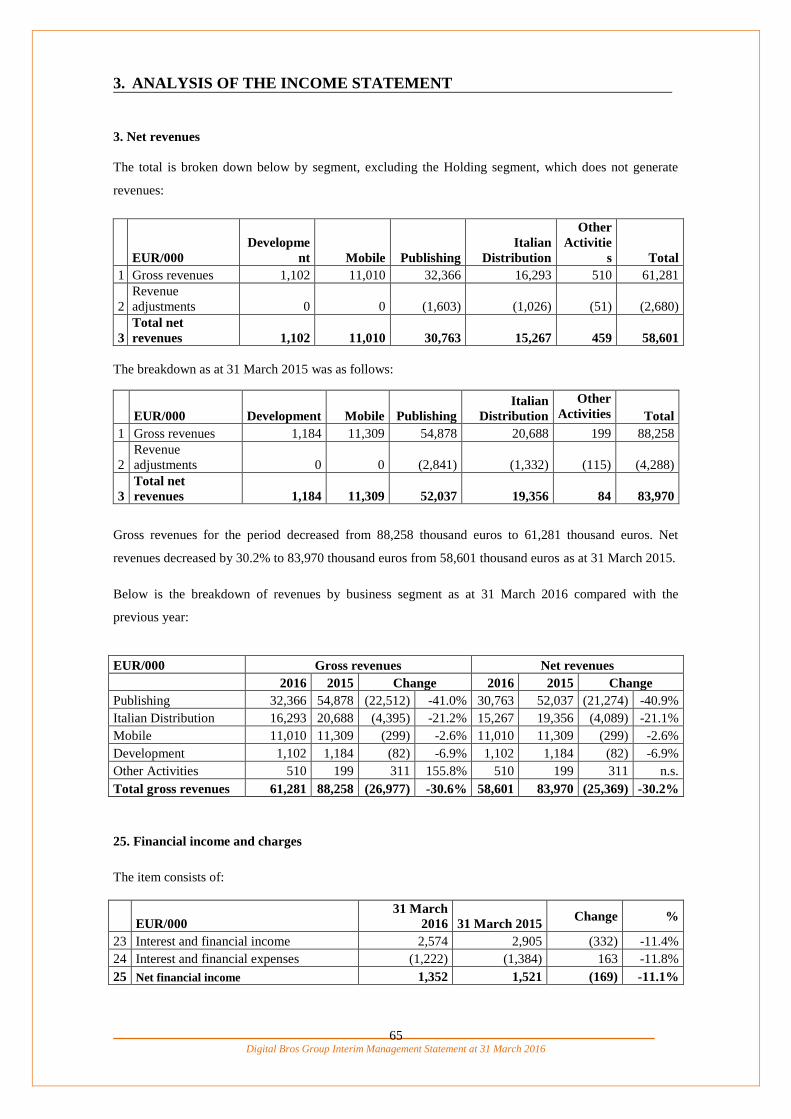
Digital Bros Group Interim Management Statement at 31 March 2016
65
3. ANALYSIS OF THE INCOME STATEMENT
3. Net revenues
The total is broken down below by segment, excluding the Holding segment, which does not generate
revenues:
EUR/000
Developme
nt Mobile Publishing
Italian
Distribution
Other
Activitie
s Total
1 Gross revenues 1,102 11,010 32,366 16,293 510 61,281
2
Revenue
adjustments 0 0 (1,603) (1,026) (51) (2,680)
3
Total net
revenues 1,102 11,010 30,763 15,267 459 58,601
The breakdown as at 31 March 2015 was as follows:
EUR/000 Development Mobile Publishing
Italian
Distribution
Other
Activities Total
1 Gross revenues 1,184 11,309 54,878 20,688 199 88,258
2
Revenue
adjustments 0 0 (2,841) (1,332) (115) (4,288)
3
Total net
revenues 1,184 11,309 52,037 19,356 84 83,970
Gross revenues for the period decreased from 88,258 thousand euros to 61,281 thousand euros. Net
revenues decreased by 30.2% to 83,970 thousand euros from 58,601 thousand euros as at 31 March 2015.
Below is the breakdown of revenues by business segment as at 31 March 2016 compared with the
previous year:
EUR/000 Gross revenues Net revenues
2016 2015 Change 2016 2015 Change
Publishing 32,366 54,878 (22,512) -41.0% 30,763 52,037 (21,274) -40.9%
Italian Distribution 16,293 20,688 (4,395) -21.2% 15,267 19,356 (4,089) -21.1%
Mobile 11,010 11,309 (299) -2.6% 11,010 11,309 (299) -2.6%
Development 1,102 1,184 (82) -6.9% 1,102 1,184 (82) -6.9%
Other Activities 510 199 311 155.8% 510 199 311 n.s.
Total gross revenues 61,281 88,258 (26,977) -30.6% 58,601 83,970 (25,369) -30.2%
25. Financial income and charges
The item consists of:
EUR/000
31 March
2016 31 March 2015 Change %
23 Interest and financial income 2,574 2,905 (332) -11.4%
24 Interest and financial expenses (1,222) (1,384) 163 -11.8%
25 Net financial income 1,352 1,521 (169) -11.1%

Digital Bros Group Interim Management Statement at 31 March 2016
66
Net financial income amounted to 1,352 thousand euros, compared to 1,521 thousand euros in the same
period of the previous year. Interest and financial income decreased by 332 thousand euros due to
exchange gains of 1,054 thousand euros, compared to exchange gains of 2,899 thousand euros in the same
period of the previous year, partially offset by the capital gains on the sale of the Starbreeze B shares of
1,495 thousand euros. Interest and financial expense decreased by 162 thousand euros.
Below are the details of interest expense:
EUR/000 31 March
2016
31 March
2015 Change %
Interest expense due to by banks (347) (737) 390 -60.4%
Other interest expense 0 0 0 0.0%
Interest expense on financing and leasing (80) (11) (69) n.s.
Interest on factoring (14) (14) 1 15.3%
Total interest expense on sources of finance (441) (762) 321 -50.6%
Exchange losses (781) (622) (159) n.s.
Total interest and financial expenses (1,222) (1,384) 162 2.4%
29. Taxes
The breakdown of current and deferred taxes as at 31 March 2016 is as follows:
EUR/000 31 March
2016
31 March
2015 Change %
Current taxes (1,116) (3,604) 2,489 -69.1%
Deferred taxes 1,506 578 928 n.s.
Total income taxes 390 (3,026) 3,416 n.s.
The decrease in current taxes is in line with the lower pre-tax income recorded as at 31 March 2016
compared to the same period of the previous year.
As at 31 March 2016 deferred taxes amounted to 1,506 thousand euros and were estimated on the basis of
the pre-tax losses of the subsidiaries 505 Games (US) Inc. and Game Network S.r.l.
4. NON-RECURRING INCOME AND EXPENSES
As required by Consob Resolution no. 15519 of 27 July 2006, non-recurring income and expenses are
shown separately in the income statement. These are generated by transactions or events that by nature do
not occur on a regular basis as part of the business.
During the period, the Group did not recognise any non-recurring income or expenses.

Digital Bros Group Interim Management Statement at 31 March 2016
67
5. OTHER INFORMATION
Information on geographical segments
Gross revenues are broken down below by region:
EUR/000 31 March 2016 31 March 2015 Change
Europe 12,289 20% 14,793 17% (2,504) -16.9%
The Americas 31,181 51% 50,319 57% (19,138) -38.0%
Rest of the world 1,007 2% 2,259 3% (1,252) -55.4%
Total revenues from abroad 44,477 73% 67,371 76% (22,894) -34.0%
Italy 16,804 27% 20,887 24% (4,083) -19.5%
Consolidated total gross revenues 61,281 100% 88,258 100% (26,977) -30.6%
Revenues from abroad accounted for 73% of consolidated gross revenues, compared to 76% in the same
period of the previous year, and decreased by 34% compared to 31 March 2015.
Revenues in the rest of the world were made by the subsidiary 505 Games Ltd., mainly in Australia, the
Middle East and South Africa.
The most significant portion of revenues from abroad is generated by the Publishing segment, which
booked revenues from abroad as 32,366 thousand euros, or 73% of revenues from abroad.
Below is a breakdown of gross revenues from abroad, according to business segment:
EUR/000 31 March 2016 31 March 2015 Change
Mobile 11,010 25% 11,309 17% (299) -2.6%
Publishing 32,366 73% 54,878 81% (22,512) -41.0%
Development 1,102 2% 1,184 2% (82) -6.9%
Total gross revenues from abroad 44,478 100% 67,371 100% (22,893) -34.0%
Revenues of the Development business segment include revenues generated by Pipeworks Inc. on
ongoing development orders from non-captive clients.
Italian revenues decreased to a less pronounced extent than revenues from abroad.

Digital Bros Group Interim Management Statement at 31 March 2016
68
6. RELATED PARTY TRANSACTIONS
In accordance with Consob Resolution 17221 of 12 March 2010, it is hereby reported that all commercial
and financial transactions between members of the Digital Bros Group, and between those companies and
other non-subsidiary related parties, have been conducted at arm’s length and do not qualify as atypical or
unusual transactions.
Intercompany transactions
Intercompany transactions have been described in paragraph 8 of the report on intercompany operations
and related party transactions and atypical/unusual transactions, to which we would refer you.
Other related parties
Related party transactions regard:
legal consultancy provided by the director Dario Treves;
property rental carried out by Matov Imm. S.r.l. towards the parent company and subsidiary 505
Games France S.a.s.;
property rental carried out by Matov LLC to the subsidiary 505 Games (US) Inc.
Both Matov Imm. S.r.l. and Matov LLC are owned by Abramo and Raffaele Galante.
Transactions as at 31 March 2016 are summarized below:
EUR/000 Receivables Payables Revenues Costs
comm. finan. comm. finan.
Dario Treves 0 0 (22) 0 0 (189)
Matov Imm. S.r.l. 0 635 0 0 0 (579)
Matov LLC 0 130 0 0 0 (209)
Total 0 765 (22) 0 0 (657)
As at 31 March 2015, these were:
EUR/000 Receivables Payables Revenues Costs
comm. finan. comm. finan.
Dario Treves 0 0 (18) 0 0 (145)
Matov Imm. S.r.l. 0 635 0 0 0 (599)
Matov LLC 0 138 0 0 0 (181)
Total 0 773 (18) 0 0 (925)
The financial receivable due to Digital Bros S.p.A. by Matov Imm. S.r.l. refers to the security deposit on
the Via Tortona 37 premises in Milan.

Digital Bros Group Interim Management Statement at 31 March 2016
69
The financial receivable due to 505 Games (US) Inc. by Matov LLC refers to the guarantee deposits paid
by way of guarantee against the lease instalments for the premises that became the American subsidiary’s
offices during the previous year.
Rent for the Milan offices paid during the year by Digital Bros S.p.A. to Matov Imm. S.r.l. amounts to
545 thousand euros, that paid by 505 Games France S.a.s. for the buildings of Francheville amounts to 34
thousand euros.
In November 2013, a rent contract was stipulated between the subsidiary 505 Games (US) Inc. and Matov
LLC, an associated party owned by the Galante family. As a whole, the operation was subject to the
“Related party transactions procedure” adopted by Digital Bros S.p.A. in accordance with Consob
Regulation 17221 of 12 March 2010 and provides for annual charges of 285 thousand US dollars.
Tax consolidation
Digital Bros S.p.A., in its capacity as parent company/consolidating company, has opted for the tax
consolidation allowed by Italian law for the period 2015-2017 with the companies 505 Mobile S.r.l.,
Game Entertainment S.r.l., Game Service S.r.l., 505 Games S.r.l. and Digital Bros Game Academy S.r.l.
This has made it necessary to prepare a set of rules for intercompany relations to ensure that no prejudice
is caused to the individual participants in the system.
7. ATYPICAL OR UNUSUAL TRANSACTIONS
There were no atypical or unusual transactions in the period under examination or the same period of the
previous year, as defined by Consob Communication DEM 6064293 of 28 July 2006.
Digital Bros Group Interim Management Statement at 31 March 2016
70
STATEMENT PURSUANT TO ART. 154-BIS (5) OF THE CONSOLIDATED
FINANCE ACT
We, the undersigned, Abramo Galante as chairman of the Board of Directors and Stefano Salbe as
Financial Reporting Officer of the Digital Bros Group, hereby declare, including in accordance with Art.
154-bis (3) and (4) of Legislative Decree 58 of 24 February 1998:
- the adequacy in relation to the characteristics of the business; and
- due compliance with the administrative and accounting procedures for the preparation of the
interim management report at 31 March 2016.
We also confirm that:
1. the interim management statement of the Digital Bros Group at 31 March 2016:
a) has been prepared in accordance with the applicable International Accounting Standards
recognised by the European Union pursuant to Regulation 1606/2002/EC of the European
Parliament and the Council of 19 July 2002;
b) corresponds to the ledgers and accounting entries;
c) provides a true and fair view of the financial position and performance of Digital Bros
S.p.A. and of the companies included in the consolidation;
2. the interim management statement at 31 March 2016 contains information on the key events that
took place during the period and their impact on the interim management statement at 31 March
2016, along with a description of the main risks and uncertainties. The interim management
statement at 31 March 2016 also contains information on significant transactions with related
parties.
Milan, 12 May 2016
Signed
Chairman of the Board of Directors Financial Reporting Officer
Abramo Galante Stefano Salbe


![Latteria Soresina Presentation - English[2]](https://static.fdocuments.in/doc/165x107/58ef628e1a28abf5488b4665/latteria-soresina-presentation-english2.jpg)
