Interim consolidated condensed financial statements · Interim consolidated condensed financial...
36
Interim consolidated condensed financial statements Opsens Inc. Three-month periods ended November 30, 2011 and 2010 (unaudited)
Transcript of Interim consolidated condensed financial statements · Interim consolidated condensed financial...
Interim consolidated condensed financial statements
Opsens Inc. Three-month periods ended November 30, 2011 and 2010 (unaudited)
Notice These unaudited interim consolidated condensed financial statements
have not been
reviewed by the Company’s independant auditors.
Opsens Inc. November 30, 2011 and 2010 Table of contents Consolidated statements of loss and comprehensive loss ............................................................. 1
Consolidated statements of changes in equity ......................................................................... 2-3
Consolidated statements of financial position ............................................................................. 4
Consolidated statements of cash flows ...................................................................................... 5
Notes to the consolidated condensed financial statements........................................................6-33
Opsens Inc.
Page 1
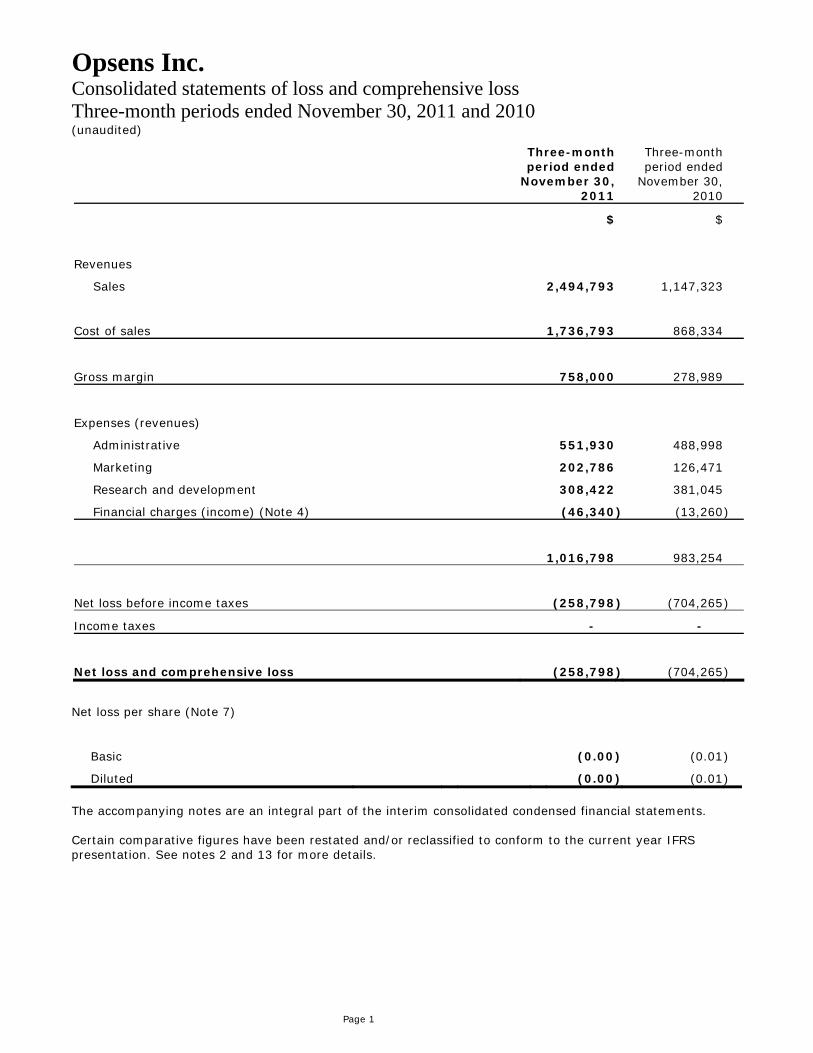
Consolidated statements of loss and comprehensive loss Three-month periods ended November 30, 2011 and 2010 (unaudited)
Three-month period ended
November 30, 2011
Three-month period ended
November 30, 2010
$ $
Revenues
Sales 2,494,793 1,147,323
Cost of sales 1,736,793 868,334
Gross margin 758,000 278,989
Expenses (revenues)
Administrative 551,930 488,998
Marketing 202,786 126,471
Research and development 308,422 381,045
Financial charges (income) (Note 4) (46,340 ) (13,260 )
1,016,798 983,254
Net loss before income taxes (258,798 ) (704,265 )
Income taxes - -
Net loss and comprehensive loss (258,798 ) (704,265 )
Net loss per share (Note 7)
Basic (0.00 ) (0.01 )
Diluted (0.00 ) (0.01 ) The accompanying notes are an integral part of the interim consolidated condensed financial statements. Certain comparative figures have been restated and/or reclassified to conform to the current year IFRS presentation. See notes 2 and 13 for more details.
Opsens Inc.
Page 2
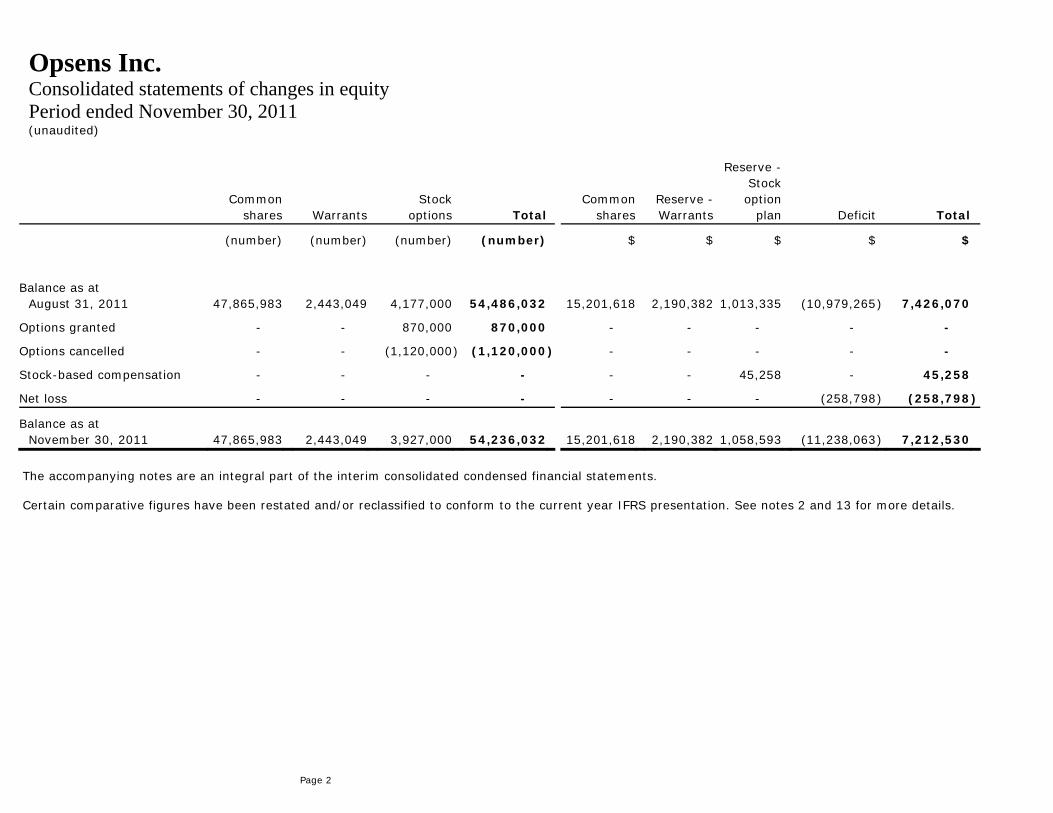
Consolidated statements of changes in equity Period ended November 30, 2011 (unaudited)
Common shares Warrants
Stock options Total
Common shares
Reserve -Warrants
Reserve - Stock option
plan Deficit Total
(number) (number) (number) (number) $ $ $ $ $
Balance as at August 31, 2011
47,865,983
2,443,049
4,177,000
54,486,032
15,201,618
2,190,382 1,013,335 (10,979,265 ) 7,426,070
Options granted - - 870,000 870,000 - - - - -
Options cancelled - - (1,120,000 ) (1,120,000 ) - - - - -
Stock-based compensation - - - - - - 45,258 - 45,258
Net loss - - - - - - - (258,798 ) (258,798 )
Balance as at November 30, 2011
47,865,983
2,443,049 3,927,000 54,236,032
15,201,618
2,190,382 1,058,593 (11,238,063 ) 7,212,530
The accompanying notes are an integral part of the interim consolidated condensed financial statements. Certain comparative figures have been restated and/or reclassified to conform to the current year IFRS presentation. See notes 2 and 13 for more details.
Opsens Inc.
Page 3
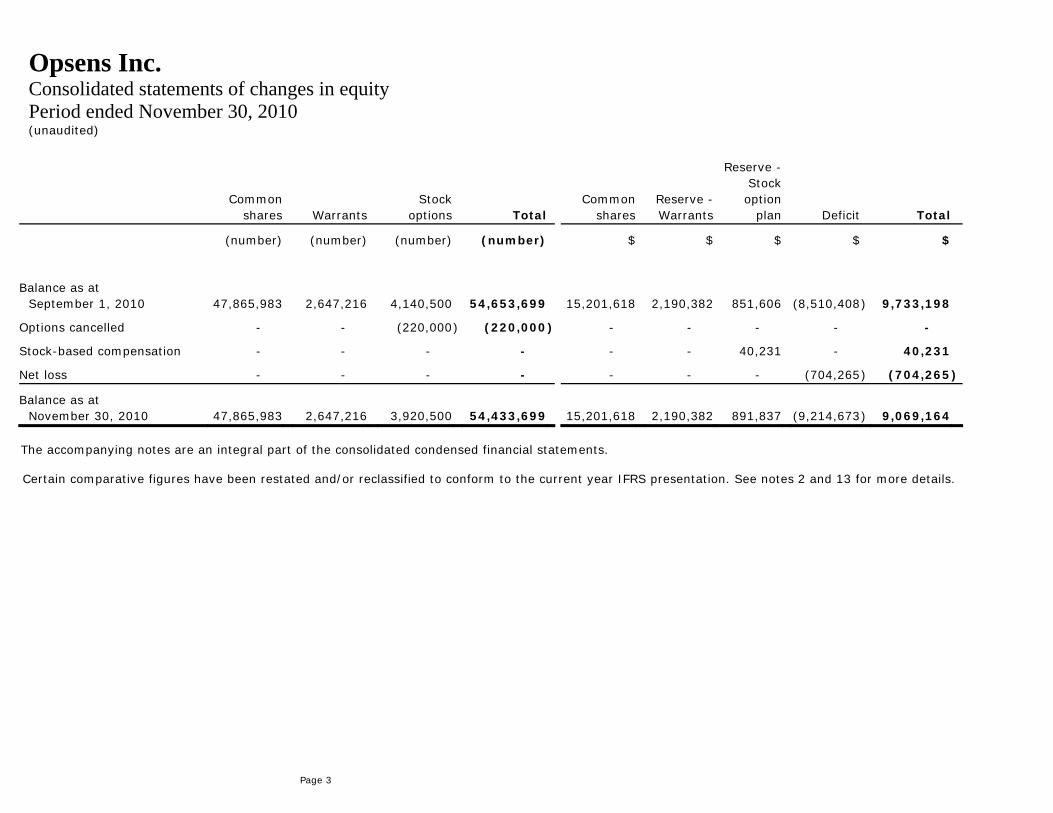
Consolidated statements of changes in equity Period ended November 30, 2010 (unaudited)
Common shares Warrants
Stock options Total
Common shares
Reserve - Warrants
Reserve - Stock option
plan Deficit Total
(number) (number) (number) (number) $ $ $ $ $
Balance as at September 1, 2010
47,865,983
2,647,216
4,140,500
54,653,699
15,201,618
2,190,382
851,606
(8,510,408 )
9,733,198
Options cancelled - - (220,000 ) (220,000 ) - - - - -
Stock-based compensation - - - - - - 40,231 - 40,231
Net loss - - - - - - - (704,265 ) (704,265 )
Balance as at November 30, 2010
47,865,983
2,647,216 3,920,500 54,433,699
15,201,618
2,190,382 891,837 (9,214,673 ) 9,069,164
The accompanying notes are an integral part of the consolidated condensed financial statements. Certain comparative figures have been restated and/or reclassified to conform to the current year IFRS presentation. See notes 2 and 13 for more details.
Opsens Inc.
Page 4
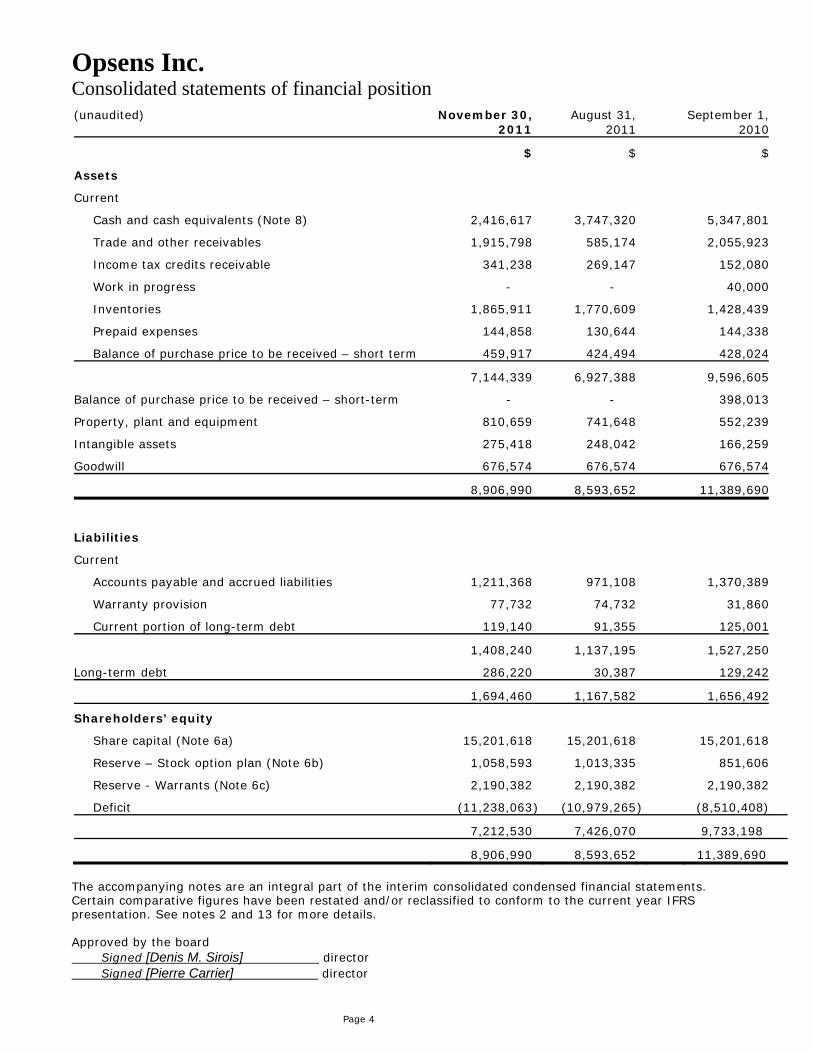
Consolidated statements of financial position (unaudited)
November 30, 2011
August 31, 2011
September 1, 2010
$ $ $
Assets
Current
Cash and cash equivalents (Note 8) 2,416,617 3,747,320 5,347,801
Trade and other receivables 1,915,798 585,174 2,055,923
Income tax credits receivable 341,238 269,147 152,080
Work in progress - - 40,000
Inventories 1,865,911 1,770,609 1,428,439
Prepaid expenses 144,858 130,644 144,338
Balance of purchase price to be received – short term 459,917 424,494 428,024
7,144,339 6,927,388 9,596,605
Balance of purchase price to be received – short-term - - 398,013
Property, plant and equipment 810,659 741,648 552,239
Intangible assets 275,418 248,042 166,259
Goodwill 676,574 676,574 676,574
8,906,990 8,593,652 11,389,690
Liabilities
Current
Accounts payable and accrued liabilities 1,211,368 971,108 1,370,389
Warranty provision 77,732 74,732 31,860
Current portion of long-term debt 119,140 91,355 125,001
1,408,240 1,137,195 1,527,250
Long-term debt 286,220 30,387 129,242
1,694,460 1,167,582 1,656,492
Shareholders’ equity
Share capital (Note 6a) 15,201,618 15,201,618 15,201,618
Reserve – Stock option plan (Note 6b) 1,058,593 1,013,335 851,606
Reserve - Warrants (Note 6c) 2,190,382 2,190,382 2,190,382
Deficit (11,238,063 ) (10,979,265 ) (8,510,408)
7,212,530 7,426,070 9,733,198
8,906,990 8,593,652 11,389,690 The accompanying notes are an integral part of the interim consolidated condensed financial statements. Certain comparative figures have been restated and/or reclassified to conform to the current year IFRS presentation. See notes 2 and 13 for more details. Approved by the board Signed [Denis M. Sirois] director Signed [Pierre Carrier] director
Opsens Inc.
Page 5
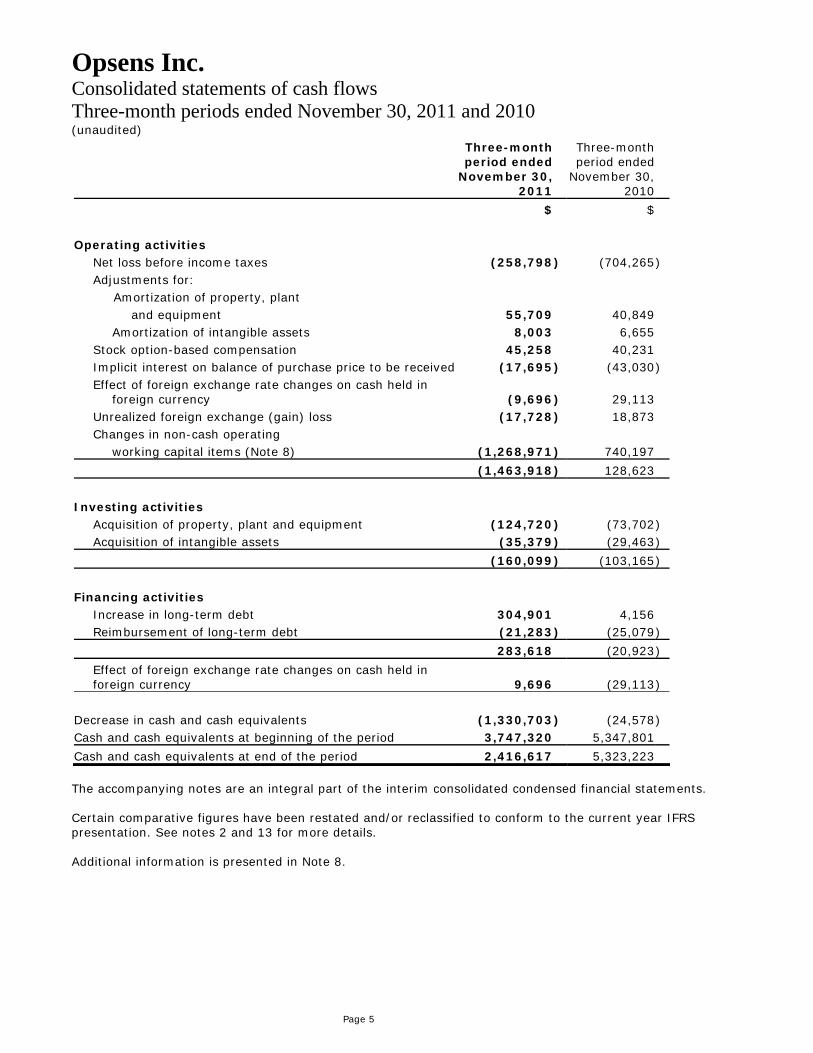
Consolidated statements of cash flows Three-month periods ended November 30, 2011 and 2010 (unaudited) Three-month
period ended November 30,
2011
Three-month period ended
November 30, 2010
$ $ Operating activities Net loss before income taxes (258,798 ) (704,265 ) Adjustments for: Amortization of property, plant and equipment 55,709 40,849 Amortization of intangible assets 8,003 6,655 Stock option-based compensation 45,258 40,231 Implicit interest on balance of purchase price to be received (17,695 ) (43,030 ) Effect of foreign exchange rate changes on cash held in foreign currency
(9,696
)
29,113
Unrealized foreign exchange (gain) loss (17,728 ) 18,873 Changes in non-cash operating working capital items (Note 8) (1,268,971 ) 740,197
(1,463,918 ) 128,623
Investing activities Acquisition of property, plant and equipment (124,720 ) (73,702 ) Acquisition of intangible assets (35,379 ) (29,463 )
(160,099 ) (103,165 )
Financing activities Increase in long-term debt 304,901 4,156 Reimbursement of long-term debt (21,283 ) (25,079 )
283,618 (20,923 )
Effect of foreign exchange rate changes on cash held in foreign currency
9,696
(29,113
)
Decrease in cash and cash equivalents (1,330,703 ) (24,578 ) Cash and cash equivalents at beginning of the period 3,747,320 5,347,801
Cash and cash equivalents at end of the period 2,416,617 5,323,223 The accompanying notes are an integral part of the interim consolidated condensed financial statements. Certain comparative figures have been restated and/or reclassified to conform to the current year IFRS presentation. See notes 2 and 13 for more details. Additional information is presented in Note 8.
Opsens Inc.
Page 6
Notes to the consolidated condensed financial statements November 30, 2011 and 2010 (unaudited)
1. Description of business Opsens inc. (the “Company”) is incorporated under Business Corporation Act (Quebec). The Company specializes in developing and manufacturing technical and scientific instruments. The head office of the Company is located at 125-2014, Cyrille-Duquet, Québec (Québec), Canada.
2. Accounting policies, critical accounting estimates and judgements The significant accounting policies used to prepare these financial statements are summarized below. Statement of Compliance These interim consolidated condensed financial statements (the “consolidated condensed financial statements “) were prepared under International Financial Reporting Standards (“IFRS”) as issued by the International Accounting Standards Board (“IASB”) and are in compliance with International Accounting Standard 34 – Interim Financial Reporting (“IAS 34”). As these interim consolidated condensed financial statements represent the first set of financial statements under IFRS, they were prepared using the principles of IFRS 1 - First-Time Adoption if IFRS (“IFRS 1”). Accordingly, certain information and footnote disclosure normally included in annual financial statements prepared in accordance with IFRS have been omitted or condensed. In addition, a reconciliation between previous Generally Accepted Accounting Principles (“Canadian GAAP”) and IFRS is available in note 13, as required by IFRS 1 in the year of adoption. Principles of consolidation The interim consolidated condensed financial statements include the accounts of the Company and those of its wholly-owned subsidiary Opsens Solutions Inc. from the acquisition date. Unaudited interim consolidated condensed financial statements The interim consolidated condensed financial statements as at November 30, 2011 and for the three-month periods ended November 30, 2011 and 2010 are unaudited. However, in the opinion of management, all adjustments, consisting solely of normal recurring adjustments, considered necessary for a fair presentation of the consolidated results of operations for the period presented, have been included. Consolidated results for the interim periods presented are not necessarily indicative of the results that may be expected for the year. These consolidated condensed financial statements have been approved by the Board of Directors on January 16, 2012. Presentation Currency and Foreign Currency Translation The consolidated condensed financial statements are presented in Canadian dollars, which is also the functional currency of the Company. Foreign currency transactions are translated into Canadian dollars as follows: monetary assets and liabilities are translated at the exchange rates in effect at the financial position date, non-monetary assets and liabilities are translated at historical rates, revenues and expenses are translated at the exchange rates in effect at the time of the transaction and exchange gains or losses resulting from translation are carried to earning.
Opsens Inc.
Page 7
Notes to the consolidated condensed financial statements November 30, 2011 and 2010 (unaudited)
2. Accounting policies (continued) Cash and cash equivalents Cash and cash equivalents include cash and short-term investments redeemable anytime or with a maturity of three months or less beginning on the acquisition date. Inventories The cost of inventories is essentially determined using the moving average method. The cost of work in progress and finished goods comprises the cost of raw materials and an applicable share of the cost of labour and manufacturing overhead based on normal production capability. Inventories are valued at the lower of cost and net realizable value. When impairment is recognized, a new assessment of net realizable value is performed in each subsequent period. When the circumstances that justified writing down the inventories below cost no longer exist, or when there is a clear indication of an increase in net realizable value due to a change in the economic situation, the amount of the write-down is reversed such that the new carrying amount is the lower of the cost or the revised net realizable value. Property, plant and equipment and intangible assets
Property, plant and equipment and intangible assets with finite lives are recorded at their acquisition cost. Amortization is provided using the declining balance method based on their useful lives using the straight-line method, at the following annual rates: Property, plant and equipment and intangible assets Office furniture and equipment 10 years Production equipment 7 years Automotive equipment 7 years Research and development equipment 7 years Research and development computer equipment 3 years Computer equipment 3 years Leasehold improvements Lease term Intangible assets with limited lives
Patents Term of underlying
patent, 5 to 20 years Software 3 years Intangible assets with indefinite lives Intangible assets with indefinite lives are recorded at cost and are tested for impairment annually or more frequently if events or changes in circumstances indicate a potential impairment in value. The excess of the carrying value over the fair value is recorded in loss. Impairment of long-lived assets Long-lived assets held are reviewed annually or more frequently when events or changes in circumstances cause its carrying value to exceed its recoverable value, being the greater of fair value less cost to sell and value-in-use. An impairment loss is calculated as the exces of carrying value over recoverable value..
Opsens Inc.
Page 8
Notes to the consolidated condensed financial statements November 30, 2011 and 2010 (unaudited)
2. Accounting policies (continued) Goodwill Goodwill representing the excess of purchase price over fair value of the net identifiable assets of acquired businesses is tested for impairment annually or more frequently when an event or circumstance occurs that indicates that goodwill might be impaired. When the carrying amount exceeds the fair value, an impairment loss is recognized in the statement of loss in an amount equal to the excess. Goodwill is not deductible for tax purposes. Revenue recognition Opsens Inc. reportable segment revenues related to the sale of products are recognized when persuasive evidence of an arrangement exists, delivery has occurred, the price to the buyer is fixed or determinable and collection is reasonably assured. Opsens Solutions Inc. reportable segment revenues related to the sale or products and sensor installation services are recognized when persuasive evidence of an arrangement exists, on site installation has occurred, the price to the buyer is fixed or determinable and collection is reasonably assured. For contract revenues earned over a long period, revenues are recorded using the percentage of completion method. Therefore, these revenues are recognized proportionately with the degree of completion of the work. The Company uses the efforts expended method to calculate the degree of completion of work based on the number of hours incurred as at the balance sheet date compared to the estimated total number of hours. Work in progress is valued by taking into consideration the number of hours worded but not yet invoiced and the payments received. Losses are recorded as soon as they become apparent. Government assistance and income tax credits for research and development Government grants are recorded when there is reasonable assurance that the Company has complied with and will continue to comply with all the conditions of the grant. Non-repayable grants or contributions related to operating expenses are included in the statement of loss when the related expenses are incurred. Grants related to capital expenditures are netted against the related assets when acquired. The Company is also eligible for income tax credits for scientific research and experimental development (SR&ED) awarded by the federal and provincial governments. The portion of SR&ED credits immediately receivable is accounted for in the year during which the related costs or capital expenses are incurred. The portion of SR&ED credits not immediately receivable is accounted for in the year during which these costs or expenses are incurred, provided the Company has reasonable assurance that these credits will be recovered. Income tax credits are applied against expenses or related assets. Recorded income tax credits are based on management’s estimates of amounts expected to be recovered and are subject to an audit by the taxation authorities. Stock-based compensation and other stock-based payments The Company uses the fair value method to assess the fair value of stock options or warrants as at their date of allocation. The fair value is determined using the Black-Scholes option pricing model and is recognized through net income over the vesting period with an offset to the corresponding shareholder’s equity account. When stock options or warrants are exercised, the corresponding account and the proceeds received by the Company are credited to share capital.

Opsens Inc.
Page 9
Notes to the consolidated condensed financial statements November 30, 2011 and 2010 (unaudited)
2. Accounting policies (continued) Income taxes The Company accounts for income taxes using the tax liability method. Under this method, future income tax assets and liabilities are recognized for deductible or taxable temporary differences between the carrying value and the tax value of the assets and liabilities based on the enacted or substantially enacted tax rates expected to apply to the year in which the differences are expected to reverse. The Company establishes a valuation allowance against future income tax assets if, based on available information, it is more likely than not that some or all the future income tax assets will not be realized. Foreign currency translation Monetary assets and liabilities denominated in foreign currencies are translated at the exchange rate prevailing at the balance sheet date while non-monetary items are translated at the historical rate. Revenues and expenses denominated in foreign currencies are recorded at the average rate of exchange prevailing during the period, except for depreciation and amortization, which is translated at the historical rate. Foreign exchange gains or losses are included in expenses for the year. Loss per share Loss per share is determined using the weighted average number of outstanding shares during the period. The Company uses the treasury stock method to calculate the diluting effect of share purchase options and warrants. Reconciliations of the numerators and the denominators used in the calculation of the basic and diluted loss are disclosed in accordance with the IFRS. Financial instruments Cash and cash equivalents, accounts receivable, balance of purchase price and income tax credits receivable are classified as loans and receivables. They are recorded at amortized cost, which, at initial recognition corresponds to fair value. Subsequent revaluations of accounts receivable are recorded at amortized cost, which generally corresponds to the initially recognized amount less any allowance for doubtful accounts. The Company has chosen to classify its financial liabilities (accounts payable, accrued liabilities, and long-term debt) as other liabilities. Financial liabilities are initially measured at cost, and subsequent revaluations are recorded at amortized cost using the effective interest rate method. Transaction fees related to “other liabilities” are capitalized and presented against long-term debt. They are amortized using the effective interest rate and are recorded in the income statement.
Opsens Inc.
Page 10
Notes to the consolidated condensed financial statements November 30, 2011 and 2010 (unaudited)
2. Accounting policies (continued) Critical accounting estimates and judgements In preparing these consolidated condensed financial statements under IFRS, management is required to make judgments, estimates and assumptions about the carrying amounts of assets and liabilities that are not readily apparent from other sources. The estimates and associates assumptions are based on historical experience and other factors that are considered to be relevant. Actual results may differ from theses estimates. The significant judgments made by management in preparing the interim consolidated condensed financial statements using accounting policies of the Company and the main sources of estimation uncertainty should be the same as those that will be applied to the first IFRS annual consolidated financial statements. The following are the critical judgements and key sources of estimation:
• Recoverability of intangible assets • Inventory evaluation • Useful lives of property, plant and equipment • Government assistance and research and development tax credits
For all these items, relevant accounting policies are discussed in the other parts of Note 2. The estimates and underlying assumptions are reviewed on an ongoing basis. Revisions to accounting estimates are recognised in the period in which the estimates is revised if the revision affects only that period, or in the period of the revision and future periods if the revision affects both the current and future periods.
3. Future Accounting Changes
IFRS 9 - Financial Instruments, issued in November 2009, introduces new requirements for the classification and measurement of financial assets, financial liabilities and for derecognition. IFRS 9 will be effective for annual periods beginning on January 1, 2015, with earlier application permitted. IFRS 9 requires all recognized financial assets that are within the scope of IAS 39 - Financial Instruments: Recognition and Measurement to be subsequently measured at amortized cost or fair value. Specifically, debt investments that are held within a business model whose objective is to collect the contractual cash flows, and that have contractual cash flows that are solely payments of principal and interest on the principal outstanding are generally measured at amortized cost at the end of subsequent accounting periods. All other debt investments and equity investments are measured at their fair values at the end of subsequent accounting periods. The Company is required to adopt IFRS 9 for the annual period beginning September 1, 2015. Since the Company does not expect to hold financial assets other than cash and cash equivalents, it does not expect that the adoption of IFRS 9 will have a significant impact on its financial statements.
Opsens Inc.
Page 11
Notes to the consolidated condensed financial statements November 30, 2011 and 2010 (unaudited)
3. Future Accounting Changes (continued) IFRS 13 - Fair value measurement, issued in May 2011, establishes a single framework for measuring fair value where such measure is required under other standards. IFRS 13 will be effective for the annual period beginning on September 1, 2013, with earlier application permitted. IFRS 13 will apply for both financial and nonfinancial items measured at fair value. Under IFRS 13, the fair value is defined as the price that would be received to sell an asset or paid to transfer a liability in an orderly transaction between market participants at the measurement date. The Company will adopt IFRS 13 for the annual period beginning September 1, 2013. A detailed review will be completed in the future in order to determine if this Standard will have significant impacts. In May 2011, the IASB issued IFRS 10 - Consolidated Financial Statements, IFRS 11 - Joint Ventures, IFRS 12 - Disclosures of Involvement with Other Entities, and amended IAS 27 - Separate Financial Statements and IAS 28 - Investments in Associates and Joint Ventures, all applicable for annual period beginning on or after September 1, 2013. A detailed review will be completed in the future in order to determine if this Standard will have significant impacts. In June 2011, the IASB published an amendment to IAS 19 - Employee Benefits. As the Company does not provide benefits in the scope of this amendment, there will be no impact. In June 2011, the IASB also issued an amendment to IAS 1 - Presentation of Items of Other Comprehensive Income that will be effective for the annual period beginning on September 1, 2012. This amendment provides an option to present comprehensive income in either one single continuous statement or in two separate but consecutive statements. It also requires items of other comprehensive income items to be grouped into those that will and will not be reclassified to profit and loss in the future. Earlier application of this standard is permitted. The company is currently evaluating the impact of this standard.
4. Financial instruments Cash equivalents and temporary investments The Company is exposed to various types of risks in the management of its cash and cash equivalents, including those related to the use of financial instruments. To manage these risks, controls were put in place, particularly those related to investment policy. The investment policy is approved by the board of directors. The Company’s investment policy aims primarily to protect capital, while considering return on investment and income taxes.
Market risk Market risk is the risk that the value of a financial instrument will fluctuate as a result of changes in the parameters underlying their measurement, particularly interest rates and market prices. Interest rate risk Interest rate risk exists when interest rate fluctuations modify the cash flows of the Company’s investments. The Company owns investments with fixed interest rates. As of November 30, 2011, the Company was holding more than 81.0% (78.4% as at August 31, 2011; 81.4% as at September 1, 2010) of its cash equivalents in all time redeemable term-deposit.
Opsens Inc.
Page 12
Notes to the consolidated condensed financial statements November 30, 2011 and 2010 (unaudited)
4. Financial instruments (continued) Financial charges (income)
2011 2010
$ $
Interest and bank charges 6,481 2,790
Interest on long-term debt 3,092 5,628
Loss (gain) on foreign currency translation
(24,298 ) 39,934
Interest income (31,615 ) (61,612 )
(46,340 ) (13,260 ) Credit risk The use of financial instruments can create a credit risk that is the risk of financial loss resulting from a counterparty’s inability or refusal to fully discharge its contractual obligations. The Company’s credit risk management policies include the authorization to carry out investment transactions with recognized financial institutions, with credit ratings of at least A and higher, in either bonds, money market funds or guaranteed investment certificates. Consequently, the Company manages credit risk by complying with established investment policies. Concentration risk Concentration risk exists when investments are made with multiple entities that share similar characteristics or when a large investment is made with a single entity. As of November 30, 2011, the Company was holding more than 81.0% (78.4% as at August 31, 2011; 81.4% as at September 1, 2010) of its cash equivalents portfolio in all time redeemable term-deposit. Operational credit risk The Company provides credit for a conventional period of 30 days to its customers in the normal course of business. Credit evaluations are performed on an ongoing basis of all its accounts receivable and an allowance for doubtful accounts is recorded when those accounts are deemed uncollectible. As at November 30, 2011, three major customers represent 76.4% (69.7% as at August 31, 2011; 66.1% as at September 1, 2010) of the Company’s accounts receivable. As at November 30, 2011, 0.4% (10.8% as at August 31, 2011; 23.8% as at September 1, 2010) of the accounts receivable were of more than 90 days whereas 84.4% (55.8% as at August 31, 2011; 61.5% as at September 1, 2010) of those were with less than 30 days. The maximum exposure to the risk of credit for receivable corresponded to their book value. On November 30, 2011, the bad debt provision was established at $3,082 ($3,082 on August 31, 2011; $6,110 on September 1, 2010). Management considers that substantially all receivables are fully collectible as most of our customers are large corporations with good credit standing and no history or default. Interest rate and cash flow risk The Company is exposed to interest rate fluctuations on certain long-term debt that bears interest at variable rates. The Company does not actively manage this risk. Assuming the cash equivalents and long-term debt as reported on November 30, 2011 and 2010 had been the same throughout the period, a hypothetical 1% interest rate increase would have had an unfavourable impact of $260 and $201 on the net loss for the three-month period ended November 30, 2011 and 2010. The net loss would have had an equal but opposite effect for a hypothetical 1% interest rate decrease.
Opsens Inc.
Page 13
Notes to the consolidated condensed financial statements November 30, 2011 and 2010 (unaudited)
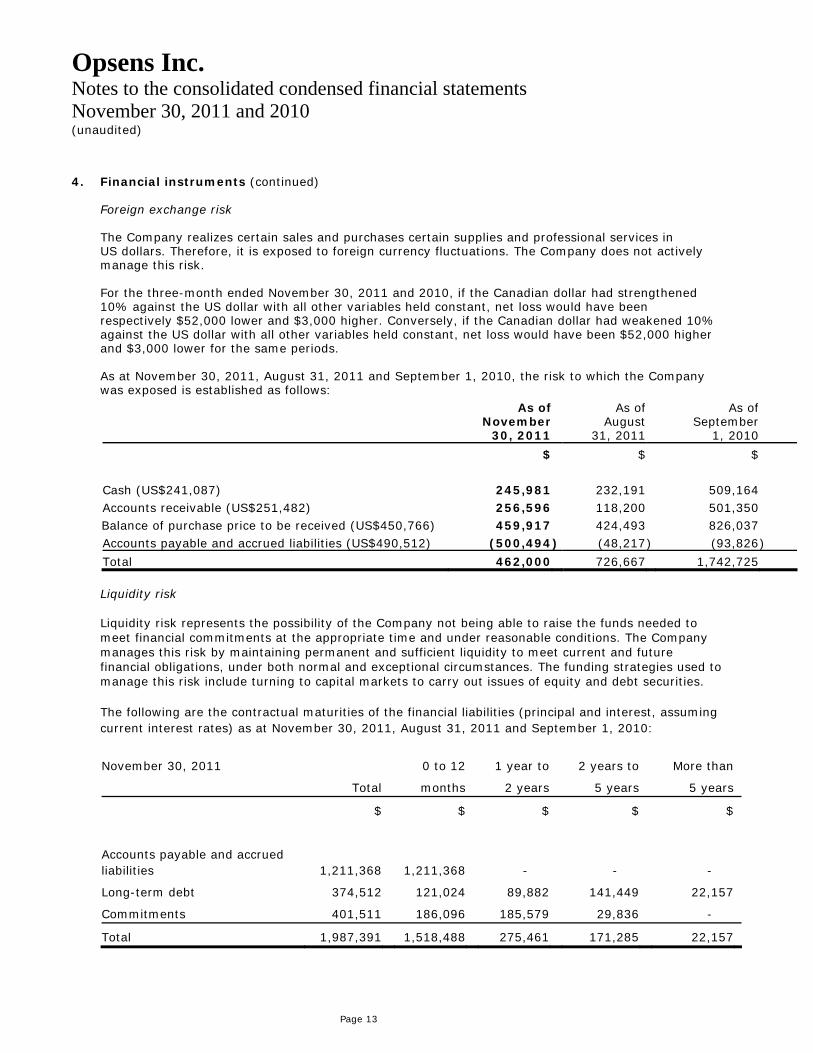
4. Financial instruments (continued) Foreign exchange risk The Company realizes certain sales and purchases certain supplies and professional services in US dollars. Therefore, it is exposed to foreign currency fluctuations. The Company does not actively manage this risk. For the three-month ended November 30, 2011 and 2010, if the Canadian dollar had strengthened 10% against the US dollar with all other variables held constant, net loss would have been respectively $52,000 lower and $3,000 higher. Conversely, if the Canadian dollar had weakened 10% against the US dollar with all other variables held constant, net loss would have been $52,000 higher and $3,000 lower for the same periods. As at November 30, 2011, August 31, 2011 and September 1, 2010, the risk to which the Company was exposed is established as follows:
As of November
30, 2011
As of August
31, 2011
As of September
1, 2010
$ $ $
Cash (US$241,087) 245,981 232,191 509,164 Accounts receivable (US$251,482) 256,596 118,200 501,350 Balance of purchase price to be received (US$450,766) 459,917 424,493 826,037 Accounts payable and accrued liabilities (US$490,512) (500,494 ) (48,217 ) (93,826 )
Total 462,000 726,667 1,742,725 Liquidity risk Liquidity risk represents the possibility of the Company not being able to raise the funds needed to meet financial commitments at the appropriate time and under reasonable conditions. The Company manages this risk by maintaining permanent and sufficient liquidity to meet current and future financial obligations, under both normal and exceptional circumstances. The funding strategies used to manage this risk include turning to capital markets to carry out issues of equity and debt securities. The following are the contractual maturities of the financial liabilities (principal and interest, assuming current interest rates) as at November 30, 2011, August 31, 2011 and September 1, 2010:
November 30, 2011 0 to 12 1 year to 2 years to More than
Total months 2 years 5 years 5 years
$ $ $ $ $
Accounts payable and accrued liabilities 1,211,368 1,211,368 - - -
Long-term debt 374,512 121,024 89,882 141,449 22,157
Commitments 401,511 186,096 185,579 29,836 -
Total 1,987,391 1,518,488 275,461 171,285 22,157
Opsens Inc.
Page 14
Notes to the consolidated condensed financial statements November 30, 2011 and 2010 (unaudited)
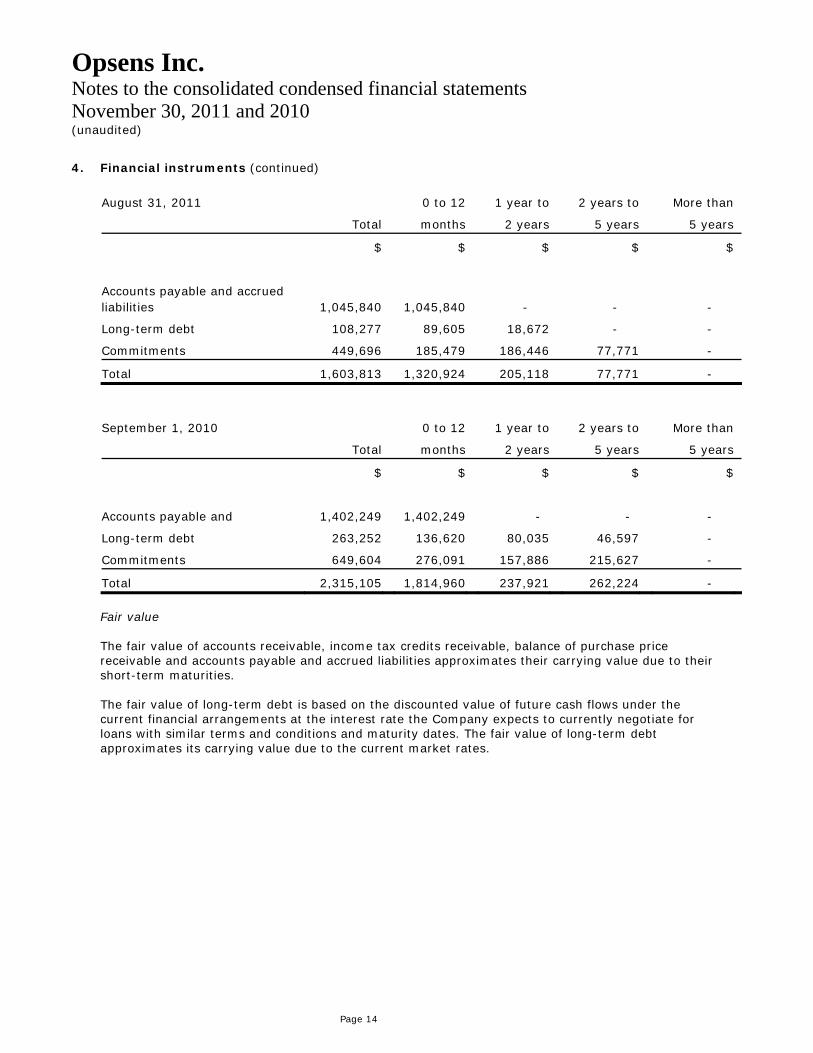
4. Financial instruments (continued)
August 31, 2011 0 to 12 1 year to 2 years to More than
Total months 2 years 5 years 5 years
$ $ $ $ $
Accounts payable and accrued liabilities 1,045,840 1,045,840 - - -
Long-term debt 108,277 89,605 18,672 - -
Commitments 449,696 185,479 186,446 77,771 -
Total 1,603,813 1,320,924 205,118 77,771 -
September 1, 2010 0 to 12 1 year to 2 years to More than
Total months 2 years 5 years 5 years
$ $ $ $ $
Accounts payable and 1,402,249 1,402,249 - - -
Long-term debt 263,252 136,620 80,035 46,597 -
Commitments 649,604 276,091 157,886 215,627 -
Total 2,315,105 1,814,960 237,921 262,224 -
Fair value The fair value of accounts receivable, income tax credits receivable, balance of purchase price receivable and accounts payable and accrued liabilities approximates their carrying value due to their short-term maturities. The fair value of long-term debt is based on the discounted value of future cash flows under the current financial arrangements at the interest rate the Company expects to currently negotiate for loans with similar terms and conditions and maturity dates. The fair value of long-term debt approximates its carrying value due to the current market rates.
Opsens Inc.
Page 15
Notes to the consolidated condensed financial statements November 30, 2011 and 2010 (unaudited)
5. Capital management The Company uses its capital to finance marketing expenses, research and development activities, administrative and working capital and capital assets. Historically, the Company has financed activities through rounds of public and private financing, debt financing as well as government grants. The Company believes that its current liquid assets are sufficient to finance its activities on the short-term. The Company has an authorized line of credit for a maximum amount of $200,000, $50,000 of which is available at all times and which does not take into consideration the margining. When using the line of credit in an amount varying from $50,000 and $100,000, the available credit is limited to an amount that is equal to 75% of Canadian accounts receivable and 65% of foreign accounts receivable plus 50% of inventories of raw materials and finished goods. If the amount used exceeds $100,000, the credit available is limited to an amount equal to 75% of Canadian accounts receivable and 90% of ensured foreign accounts receivable plus 50% of inventories of raw materials and finished goods. This line of credit bears interest at the financial institution’s prime rate plus 2% and is repayable on a weekly basis by $5,000 tranches. It is secured by a first-rank movable hypothec for an amount of $750,000 on the universality of receivables and inventories. Under the terms and conditions of the credit agreement, the Company is subject to certain covenants with respect to maintaining minimum financial ratios. These ratios also apply to long-term debt valued of $214, 540 as of November 30, 2011. The covenants are met as of November 30, 2011. The credit line was not used at the end of the period. The Company also has credit cards for a maximum amount of $75,000 to finance its current operations. The balance used on these credit cards bears interest at the financial institution’s prime rate plus 4%.
Opsens Inc.
Page 16
Notes to the consolidated condensed financial statements November 30, 2011 and 2010 (unaudited)
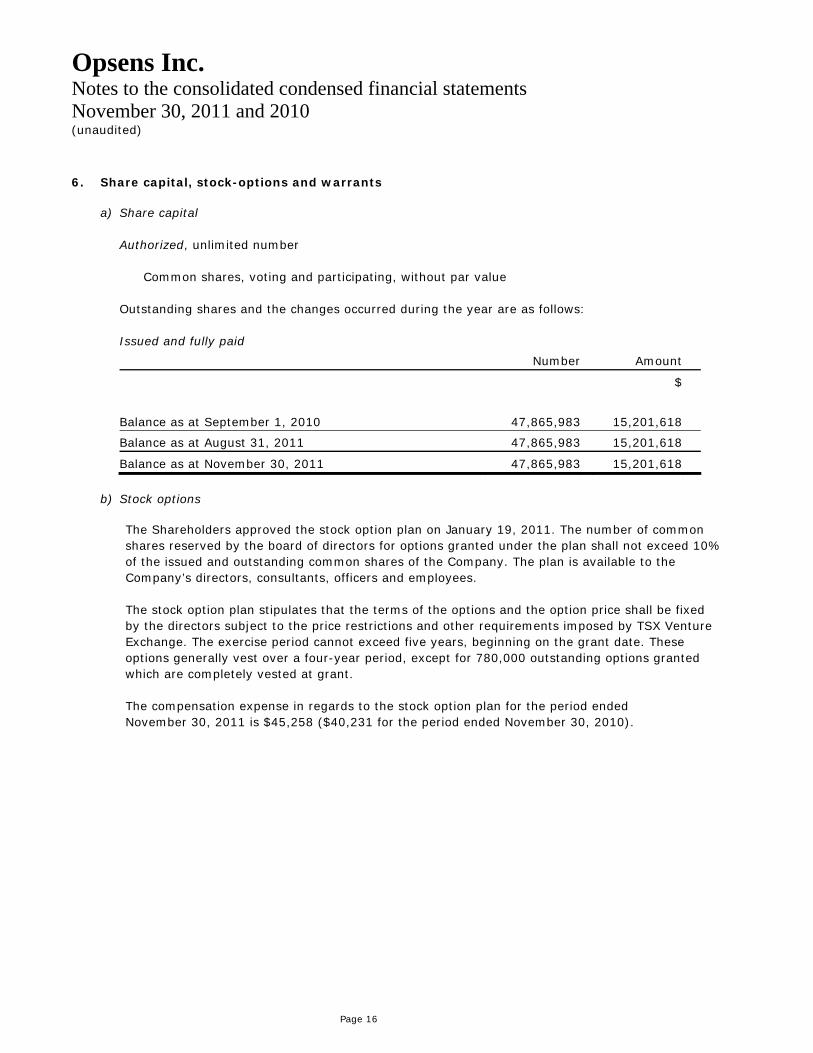
6. Share capital, stock-options and warrants a) Share capital
Authorized, unlimited number
Common shares, voting and participating, without par value
Outstanding shares and the changes occurred during the year are as follows: Issued and fully paid
Number Amount
$
Balance as at September 1, 2010 47,865,983 15,201,618
Balance as at August 31, 2011 47,865,983 15,201,618
Balance as at November 30, 2011 47,865,983 15,201,618
b) Stock options
The Shareholders approved the stock option plan on January 19, 2011. The number of common shares reserved by the board of directors for options granted under the plan shall not exceed 10% of the issued and outstanding common shares of the Company. The plan is available to the Company’s directors, consultants, officers and employees. The stock option plan stipulates that the terms of the options and the option price shall be fixed by the directors subject to the price restrictions and other requirements imposed by TSX Venture Exchange. The exercise period cannot exceed five years, beginning on the grant date. These options generally vest over a four-year period, except for 780,000 outstanding options granted which are completely vested at grant. The compensation expense in regards to the stock option plan for the period ended November 30, 2011 is $45,258 ($40,231 for the period ended November 30, 2010).
Opsens Inc.
Page 17
Notes to the consolidated condensed financial statements November 30, 2011 and 2010 (unaudited)
6. Share capital, stock-options and warrants (continued)
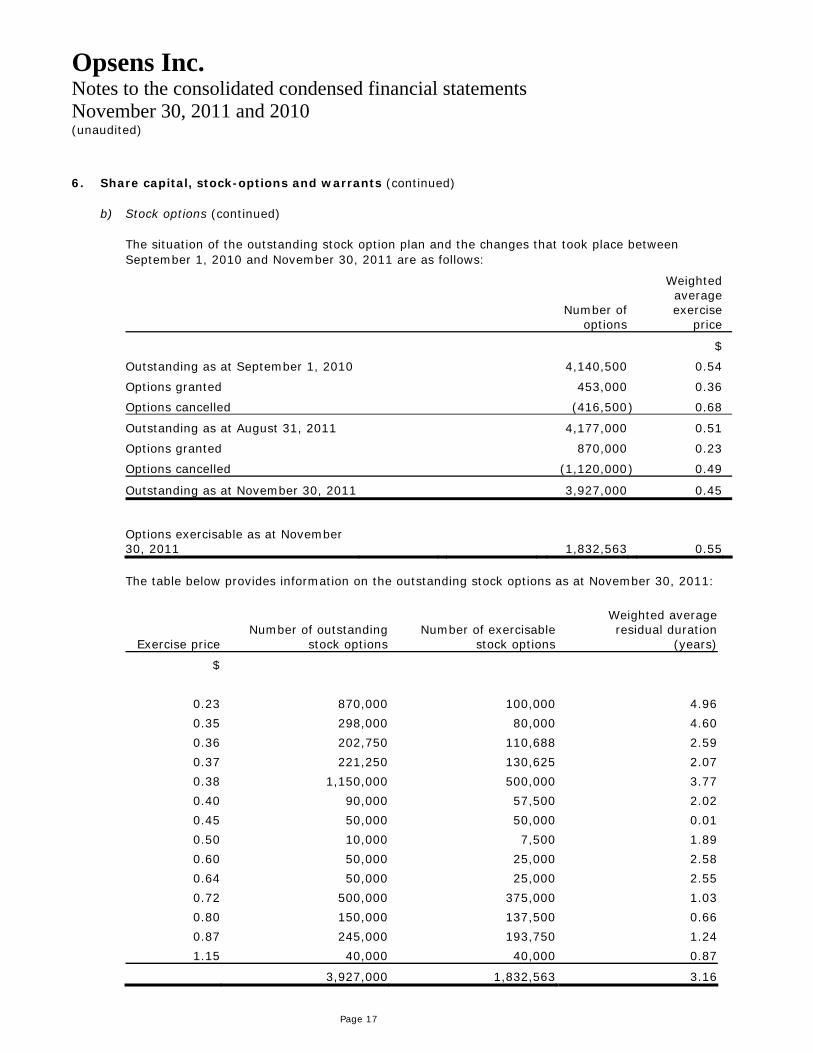
b) Stock options (continued) The situation of the outstanding stock option plan and the changes that took place between September 1, 2010 and November 30, 2011 are as follows:
Number of options
Weighted average exercise
price
$
Outstanding as at September 1, 2010 4,140,500 0.54
Options granted 453,000 0.36
Options cancelled (416,500 ) 0.68
Outstanding as at August 31, 2011 4,177,000 0.51
Options granted 870,000 0.23
Options cancelled (1,120,000 ) 0.49
Outstanding as at November 30, 2011 3,927,000 0.45
Options exercisable as at November 30, 2011
1,832,563 0.55
The table below provides information on the outstanding stock options as at November 30, 2011:
Exercise price Number of outstanding
stock options Number of exercisable
stock options
Weighted average residual duration
(years)
$
0.23 870,000 100,000 4.96
0.35 298,000 80,000 4.60
0.36 202,750 110,688 2.59
0.37 221,250 130,625 2.07
0.38 1,150,000 500,000 3.77
0.40 90,000 57,500 2.02
0.45 50,000 50,000 0.01
0.50 10,000 7,500 1.89
0.60 50,000 25,000 2.58
0.64 50,000 25,000 2.55
0.72 500,000 375,000 1.03
0.80 150,000 137,500 0.66
0.87 245,000 193,750 1.24
1.15 40,000 40,000 0.87
3,927,000 1,832,563 3.16
Opsens Inc.
Page 18
Notes to the consolidated condensed financial statements November 30, 2011 and 2010 (unaudited)
6. Share capital, stock-options and warrants (continued)
c) Warrants
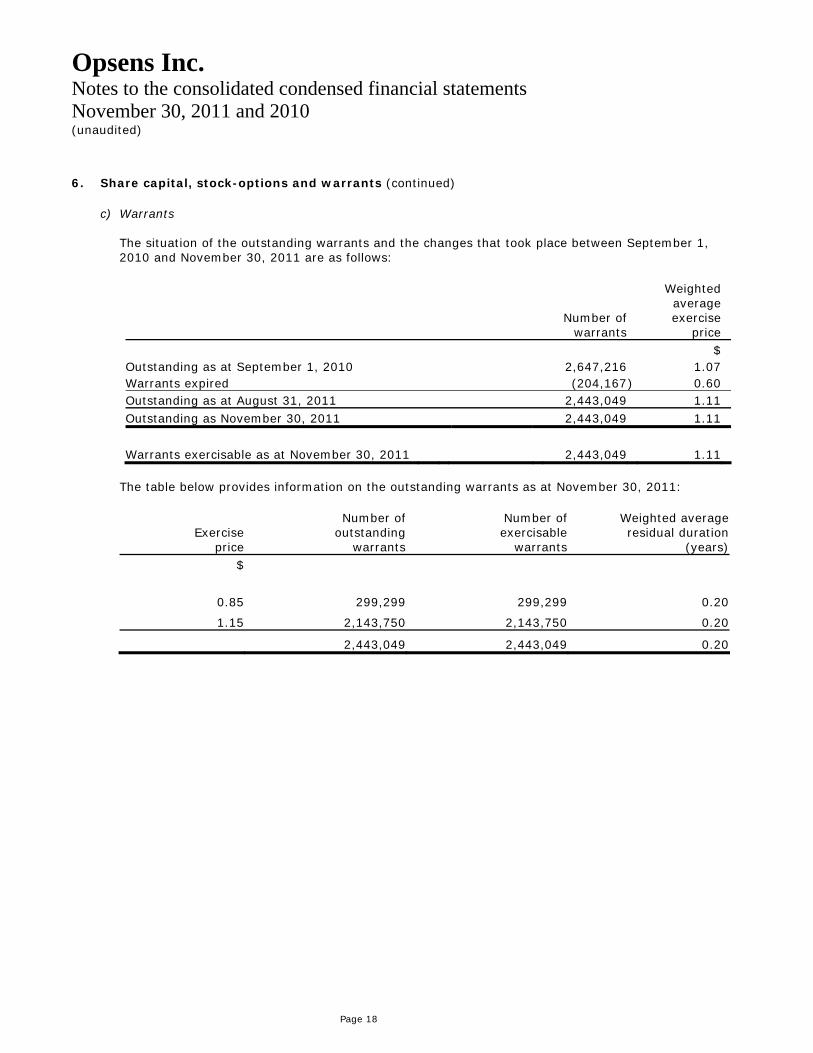
The situation of the outstanding warrants and the changes that took place between September 1, 2010 and November 30, 2011 are as follows:
Number of
warrants
Weighted average exercise
price
$ Outstanding as at September 1, 2010 2,647,216 1.07 Warrants expired (204,167 ) 0.60 Outstanding as at August 31, 2011 2,443,049 1.11 Outstanding as November 30, 2011 2,443,049 1.11
Warrants exercisable as at November 30, 2011 2,443,049 1.11
The table below provides information on the outstanding warrants as at November 30, 2011:
Exercise price
Number of outstanding
warrants
Number of exercisable
warrants
Weighted average residual duration
(years) $
0.85 299,299 299,299 0.20
1.15 2,143,750 2,143,750 0.20
2,443,049 2,443,049 0.20
Opsens Inc.
Page 19
Notes to the consolidated condensed financial statements November 30, 2011 and 2010 (unaudited)
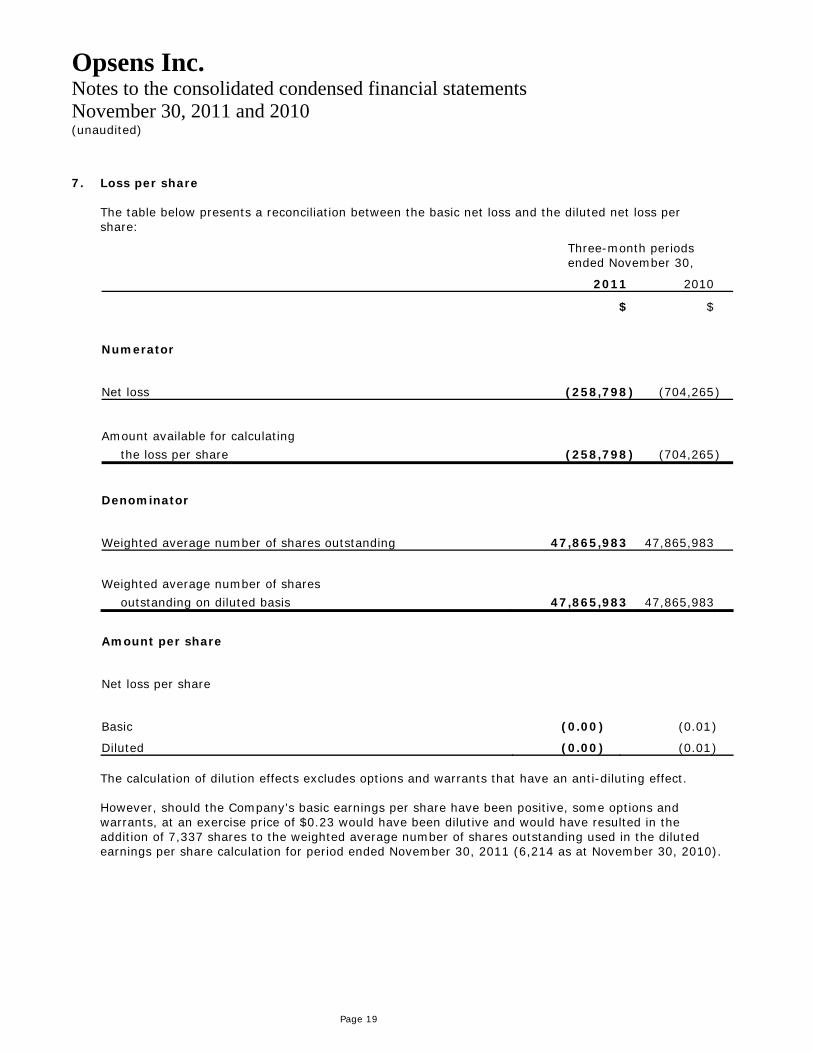
7. Loss per share The table below presents a reconciliation between the basic net loss and the diluted net loss per share:
Three-month periods ended November 30,
2011 2010
$ $
Numerator
Net loss (258,798 ) (704,265 )
Amount available for calculating
the loss per share (258,798 ) (704,265 )
Denominator
Weighted average number of shares outstanding 47,865,983 47,865,983
Weighted average number of shares
outstanding on diluted basis 47,865,983 47,865,983
Amount per share
Net loss per share
Basic (0.00 ) (0.01 )
Diluted (0.00 ) (0.01 ) The calculation of dilution effects excludes options and warrants that have an anti-diluting effect. However, should the Company's basic earnings per share have been positive, some options and warrants, at an exercise price of $0.23 would have been dilutive and would have resulted in the addition of 7,337 shares to the weighted average number of shares outstanding used in the diluted earnings per share calculation for period ended November 30, 2011 (6,214 as at November 30, 2010).
Opsens Inc.
Page 20
Notes to the consolidated condensed financial statements November 30, 2011 and 2010 (unaudited)
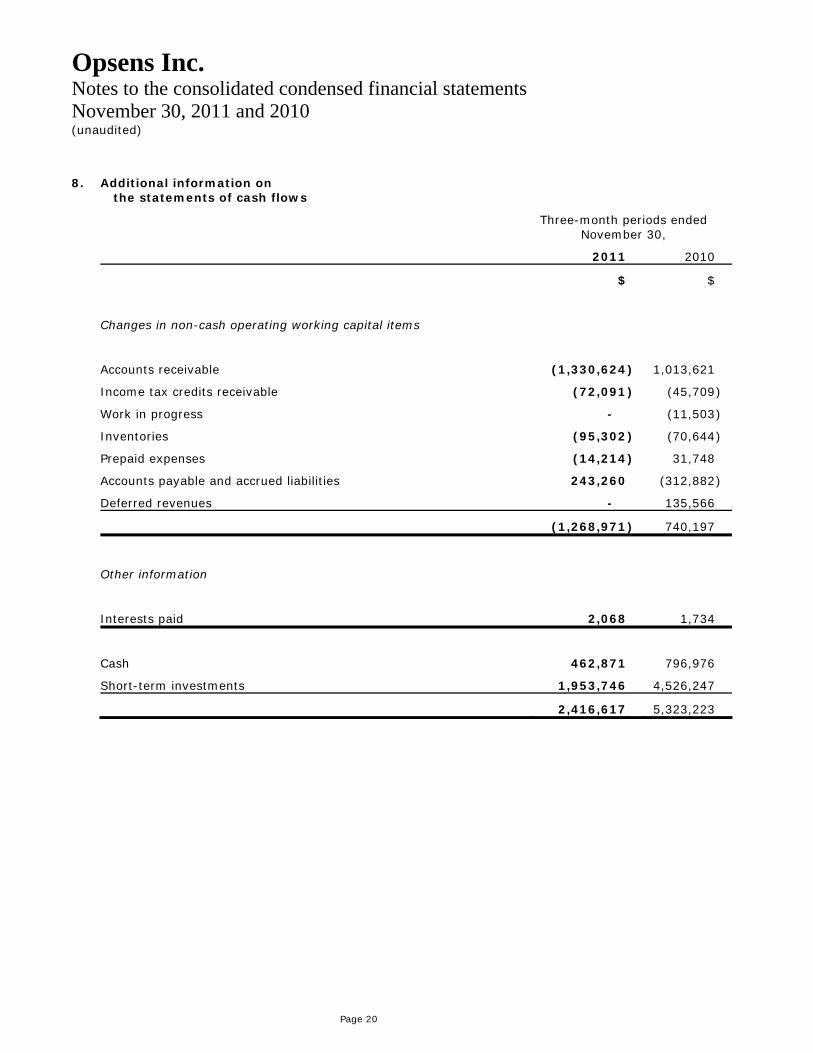
8. Additional information on the statements of cash flows
Three-month periods ended November 30,
2011 2010
$ $
Changes in non-cash operating working capital items
Accounts receivable (1,330,624 ) 1,013,621
Income tax credits receivable (72,091 ) (45,709 )
Work in progress - (11,503 )
Inventories (95,302 ) (70,644 )
Prepaid expenses (14,214 ) 31,748
Accounts payable and accrued liabilities 243,260 (312,882 )
Deferred revenues - 135,566
(1,268,971 ) 740,197
Other information
Interests paid 2,068 1,734
Cash 462,871 796,976
Short-term investments 1,953,746 4,526,247
2,416,617 5,323,223
Opsens Inc.
Page 21
Notes to the consolidated condensed financial statements November 30, 2011 and 2010 (unaudited)
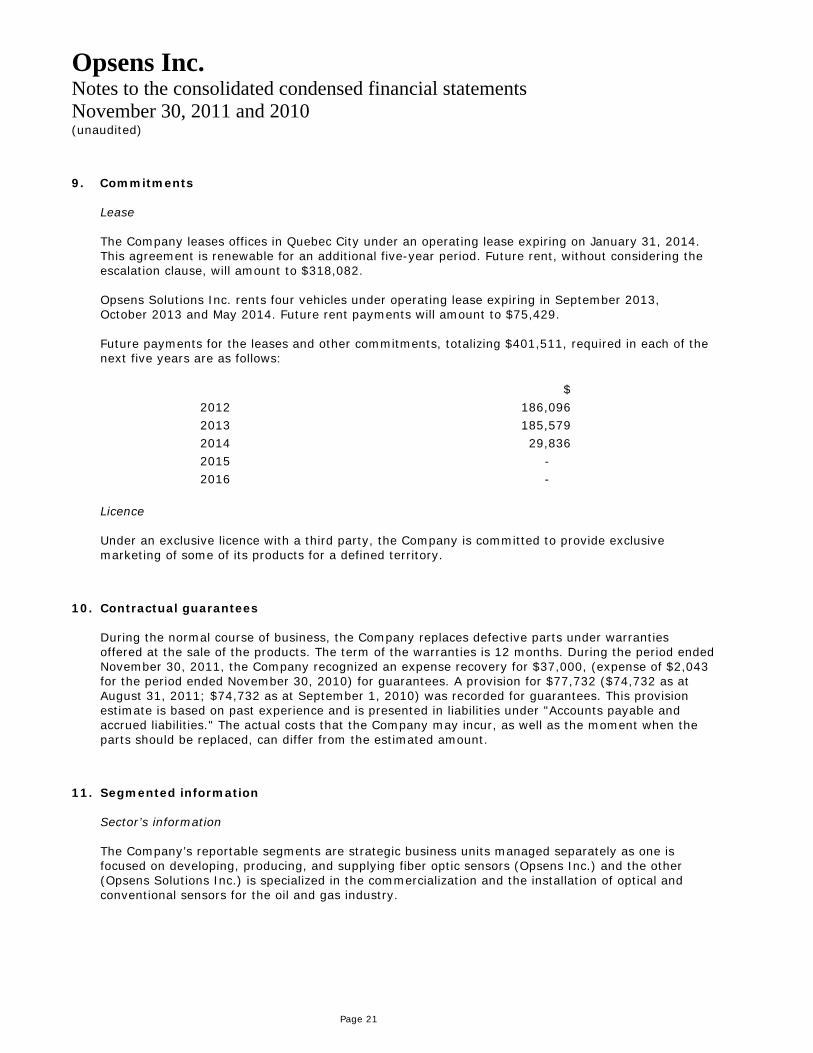
9. Commitments Lease The Company leases offices in Quebec City under an operating lease expiring on January 31, 2014. This agreement is renewable for an additional five-year period. Future rent, without considering the escalation clause, will amount to $318,082. Opsens Solutions Inc. rents four vehicles under operating lease expiring in September 2013, October 2013 and May 2014. Future rent payments will amount to $75,429. Future payments for the leases and other commitments, totalizing $401,511, required in each of the next five years are as follows:
$ 2012 186,096 2013 185,579 2014 29,836 2015 - 2016 -
Licence Under an exclusive licence with a third party, the Company is committed to provide exclusive marketing of some of its products for a defined territory.
10. Contractual guarantees During the normal course of business, the Company replaces defective parts under warranties offered at the sale of the products. The term of the warranties is 12 months. During the period ended November 30, 2011, the Company recognized an expense recovery for $37,000, (expense of $2,043 for the period ended November 30, 2010) for guarantees. A provision for $77,732 ($74,732 as at August 31, 2011; $74,732 as at September 1, 2010) was recorded for guarantees. This provision estimate is based on past experience and is presented in liabilities under "Accounts payable and accrued liabilities." The actual costs that the Company may incur, as well as the moment when the parts should be replaced, can differ from the estimated amount.
11. Segmented information Sector’s information The Company’s reportable segments are strategic business units managed separately as one is focused on developing, producing, and supplying fiber optic sensors (Opsens Inc.) and the other (Opsens Solutions Inc.) is specialized in the commercialization and the installation of optical and conventional sensors for the oil and gas industry.
Opsens Inc.
Page 22
Notes to the consolidated condensed financial statements November 30, 2011 and 2010 (unaudited)
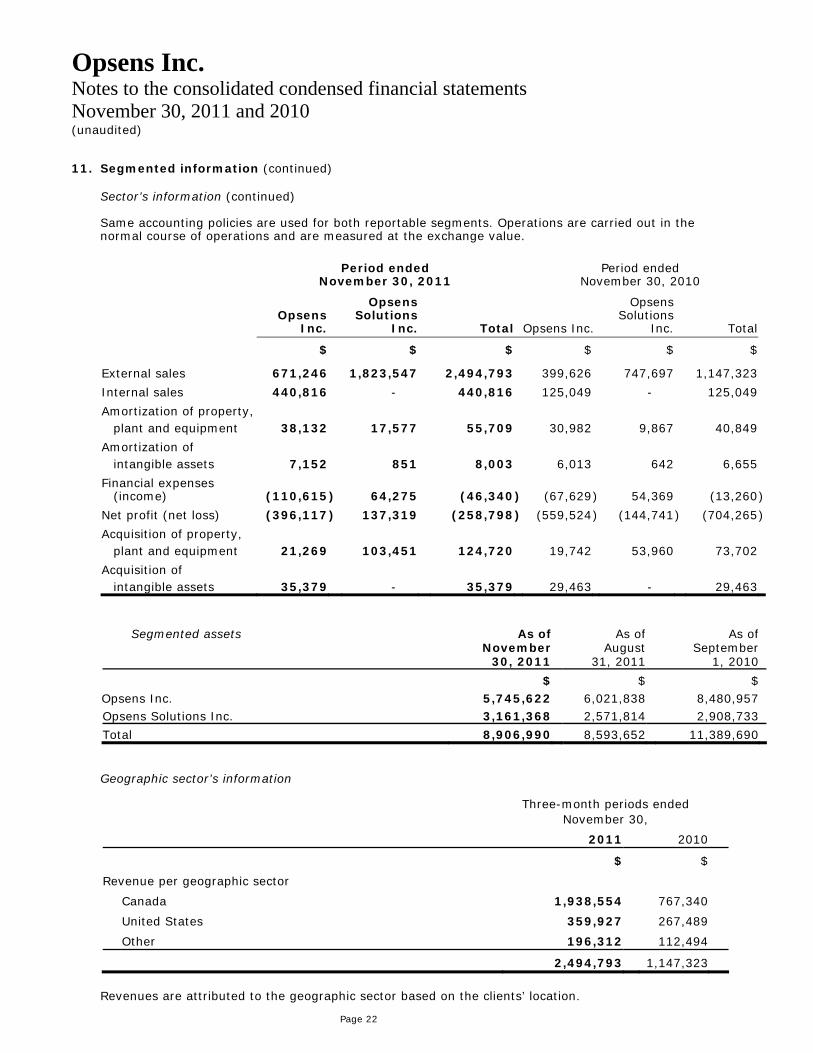
11. Segmented information (continued) Sector’s information (continued) Same accounting policies are used for both reportable segments. Operations are carried out in the normal course of operations and are measured at the exchange value.
Period ended November 30, 2011
Period ended November 30, 2010
Opsens
Inc.
Opsens Solutions
Inc. Total Opsens Inc.
Opsens Solutions
Inc. Total
$ $ $ $ $ $
External sales 671,246 1,823,547 2,494,793 399,626 747,697 1,147,323
Internal sales 440,816 - 440,816 125,049 - 125,049
Amortization of property, plant and equipment 38,132 17,577 55,709 30,982 9,867 40,849
Amortization of intangible assets 7,152 851 8,003 6,013 642 6,655
Financial expenses (income) (110,615 ) 64,275 (46,340 ) (67,629 ) 54,369 (13,260 )
Net profit (net loss) (396,117 ) 137,319 (258,798 ) (559,524 ) (144,741 ) (704,265 )
Acquisition of property, plant and equipment 21,269 103,451 124,720 19,742 53,960 73,702
Acquisition of intangible assets 35,379 - 35,379 29,463 - 29,463
Segmented assets As of November
30, 2011
As of August
31, 2011
As of September
1, 2010
$ $ $ Opsens Inc. 5,745,622 6,021,838 8,480,957 Opsens Solutions Inc. 3,161,368 2,571,814 2,908,733
Total 8,906,990 8,593,652 11,389,690 Geographic sector’s information
Three-month periods ended November 30,
2011 2010
$ $
Revenue per geographic sector
Canada 1,938,554 767,340
United States 359,927 267,489
Other 196,312 112,494
2,494,793 1,147,323
Revenues are attributed to the geographic sector based on the clients’ location.
Opsens Inc.
Page 23
Notes to the consolidated condensed financial statements November 30, 2011 and 2010 (unaudited)
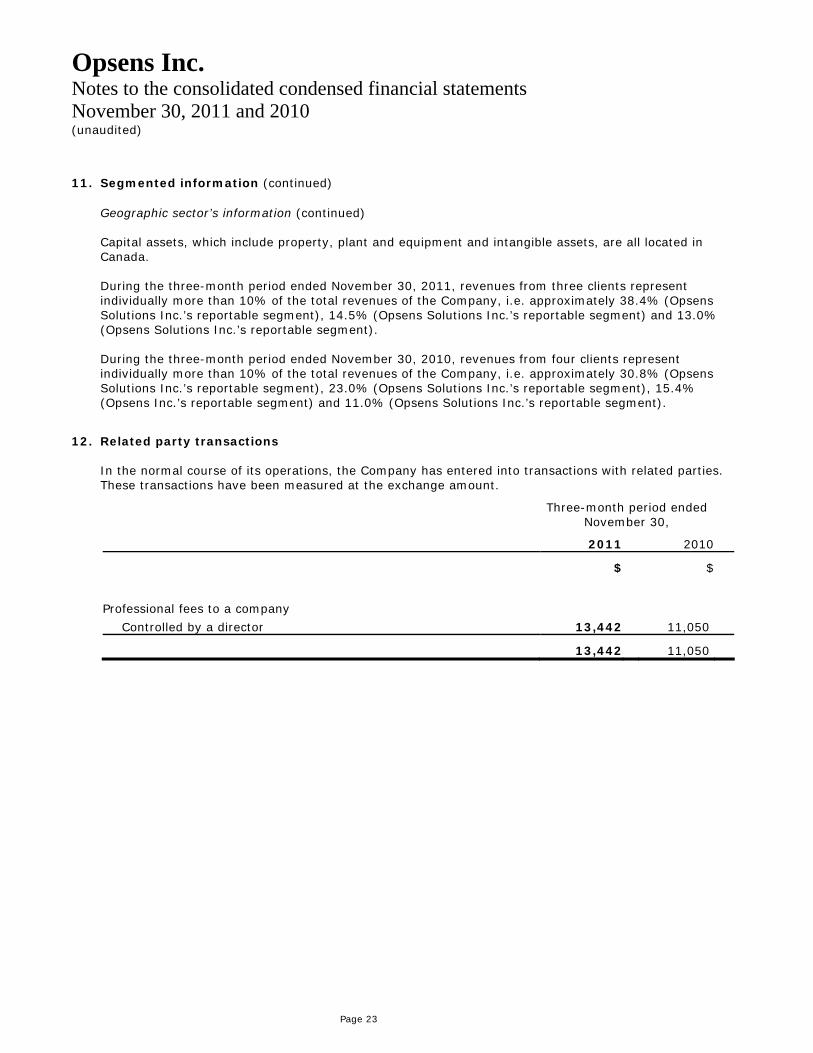
11. Segmented information (continued) Geographic sector’s information (continued) Capital assets, which include property, plant and equipment and intangible assets, are all located in Canada. During the three-month period ended November 30, 2011, revenues from three clients represent individually more than 10% of the total revenues of the Company, i.e. approximately 38.4% (Opsens Solutions Inc.’s reportable segment), 14.5% (Opsens Solutions Inc.’s reportable segment) and 13.0% (Opsens Solutions Inc.’s reportable segment). During the three-month period ended November 30, 2010, revenues from four clients represent individually more than 10% of the total revenues of the Company, i.e. approximately 30.8% (Opsens Solutions Inc.’s reportable segment), 23.0% (Opsens Solutions Inc.’s reportable segment), 15.4% (Opsens Inc.’s reportable segment) and 11.0% (Opsens Solutions Inc.’s reportable segment).
12. Related party transactions In the normal course of its operations, the Company has entered into transactions with related parties. These transactions have been measured at the exchange amount.
Three-month period ended November 30,
2011 2010
$ $
Professional fees to a company
Controlled by a director 13,442 11,050
13,442 11,050
Opsens Inc.
Page 24
Notes to the consolidated condensed financial statements November 30, 2011 and 2010 (unaudited)
13. First-time adoption of IFRS
These consolidated condensed financial statements are the Company's first interim consolidated condensed financial statements prepared under IFRS. The Company adopted IFRS on September 1, 2011, with a date of transition on September 1, 2010. The Corporation's IFRS accounting policies presented in Note 2 have been consistently applied in preparing the interim consolidated condensed financial statements for the reporting period ended November 30, 2011, the comparative information and the opening consolidated statement of financial position at the date of transition. The Company has applied the requirements of IFRS 1 in preparing these first IFRS consolidated interim condensed financial statements. The effects of the transition to IFRS on equity and total comprehensive loss are presented in this section and are further explained in the notes that accompany the tables. First-time adoption exemptions applied IFRS 1 sets forth guidance for the initial adoption of IFRS. Under IFRS 1 the standards are applied retrospectively at the transitional date with all adjustments to assets and liabilities taken to retained earnings unless certain IFRS 1 optional exemptions are applied from full retrospective application. The Company has applied the following choices relating to the optional exemptions permitted by IFRS 1 to its opening statement of financial position dated September 1, 2010: Share-based payment transactions IFRS 1 encourages, but does not require, first-time adopters to retrospectively apply IFRS 2 Share-based Payments to equity instruments that were granted subsequent to November 7, 2002, and vested before September 1, 2010. The Company has elected not to apply IFRS 2 to awards that were granted and vested prior to September 1, 2010. Deemed costs IFRS 1 includes an optional exemption that relieves first-time adopters from the requirement to recreate cost information for property, plant and equipment and intangible assets. Given the type of capital assets held, the Company did not use this exemption and accounted for them as at the transition date at their amortized cost in accordance with IAS 16 – Property, Plant and Equipment (“IAS 16”), rather than at their fair value on this date. The adjustments are explained in the reconciliations thereafter. Designation of previously recognized financial instruments IFRS 1 permits first-time adopters to re-designate financial instruments on the transition date. The company reviewed the classification of its financial instruments and decided to maintain its prior designation under IFRS.
Opsens Inc.
Page 25
Notes to the consolidated condensed financial statements November 30, 2011 and 2010 (unaudited)
13. First-time adoption of IFRS (continued) Business Combination IFRS 1 permits first-time adopters not to retrospectively apply IFRS 3 - Business Combinations to past business combinations (business combinations that occurred before the date of transition to IFRS and for which purchase price allocation was finalized). For this reason, the Company decided not to retrospectively restate business combinations that occurred prior to September 1, 2010. First-time adoption mandatory exceptions applied Estimates In accordance with IFRS 1, an entity’s estimates under IFRS at the date of transition to IFRS must be consistent with estimates made for the same date under previous GAAP, unless there is objective evidence that those estimates were in error. The Company’s IFRS estimates as of September 1, 2010 are consistent with its Canadian GAAP estimates for the same date. Reconciliations and presentation differences IFRS employs a conceptual framework that is similar to Canadian GAAP. However, significant differences exist in certain matters of recognition, measurement and disclosure. While adoption of IFRS has not changed the Company’s actual cash flows, it has resulted in changes to the Company’s reported financial position and results of operations. In order to allow the users of the financial statements to better understand these changes, the following tables show the total effect of the transition on the Company’s Canadian GAAP statement of comprehensive income and the statement of financial position and show reconciliations of the comprehensive loss and the equity to IFRS, with the resulting differences explained. Certain presentation differences between previous GAAP and IFRS have no impact on reported income or total equity. As can be seen in the following tables, some line items are described differently (renamed) under IFRS compared to previous GAAP, although the assets and liabilities included in these line items are unaffected. The presentation in accordance with IFRS differs from the presentation in accordance with Canadian GAAP. Impairment tests performed under IAS 36 - Impairment of assets as of September 1, 2010 and August 31, 2011 did not give rise to any impairment loss. An explanation of how the transition from GAAP to IFRS has affected the Company’s statement of financial position and comprehensive income is set out as follows:
Opsens Inc.
Page 26
Notes to the consolidated condensed financial statements November 30, 2011 and 2010 (unaudited)
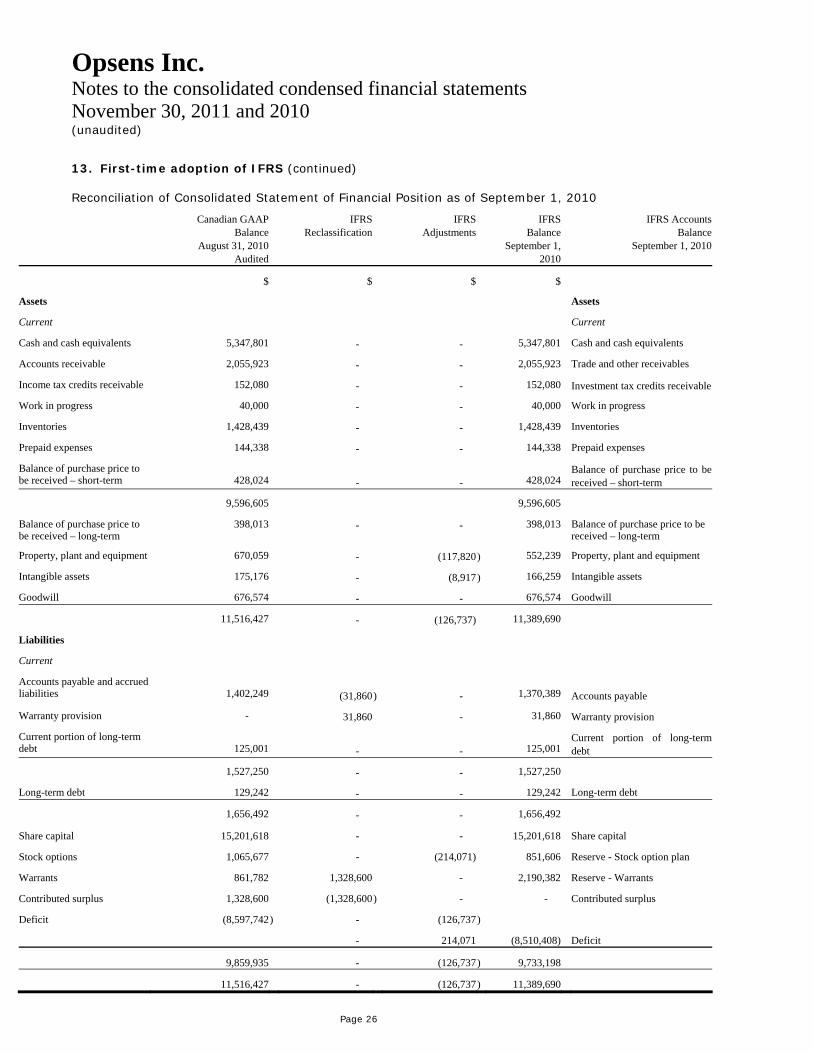
13. First-time adoption of IFRS (continued) Reconciliation of Consolidated Statement of Financial Position as of September 1, 2010
Canadian GAAP Balance
August 31, 2010 Audited
IFRSReclassification
IFRSAdjustments
IFRSBalance
September 1, 2010
IFRS AccountsBalance
September 1, 2010
$ $ $ $
Assets Assets
Current Current
Cash and cash equivalents 5,347,801 - - 5,347,801 Cash and cash equivalents
Accounts receivable 2,055,923 - - 2,055,923 Trade and other receivables
Income tax credits receivable 152,080 - - 152,080 Investment tax credits receivable
Work in progress 40,000 - - 40,000 Work in progress
Inventories 1,428,439 - - 1,428,439 Inventories
Prepaid expenses 144,338 - - 144,338 Prepaid expenses
Balance of purchase price to be received – short-term
428,024
- -
428,024
Balance of purchase price to be received – short-term
9,596,605 9,596,605
Balance of purchase price to be received – long-term
398,013 - - 398,013 Balance of purchase price to be received – long-term
Property, plant and equipment 670,059 - (117,820) 552,239 Property, plant and equipment
Intangible assets 175,176 - (8,917) 166,259 Intangible assets
Goodwill 676,574 - - 676,574 Goodwill
11,516,427 - (126,737) 11,389,690
Liabilities
Current
Accounts payable and accrued liabilities
1,402,249
(31,860
) -
1,370,389
Accounts payable
Warranty provision - 31,860 - 31,860 Warranty provision
Current portion of long-term debt
125,001
- -
125,001
Current portion of long-term debt
1,527,250 - - 1,527,250
Long-term debt 129,242 - - 129,242 Long-term debt
1,656,492 - - 1,656,492
Share capital 15,201,618 - - 15,201,618 Share capital
Stock options 1,065,677 - (214,071) 851,606 Reserve - Stock option plan
Warrants 861,782 1,328,600 - 2,190,382 Reserve - Warrants
Contributed surplus 1,328,600 (1,328,600) - - Contributed surplus
Deficit (8,597,742 ) - (126,737)
- 214,071 (8,510,408) Deficit
9,859,935 - (126,737) 9,733,198
11,516,427 - (126,737) 11,389,690
Opsens Inc.
Page 27
Notes to the consolidated condensed financial statements November 30, 2011 and 2010 (unaudited)
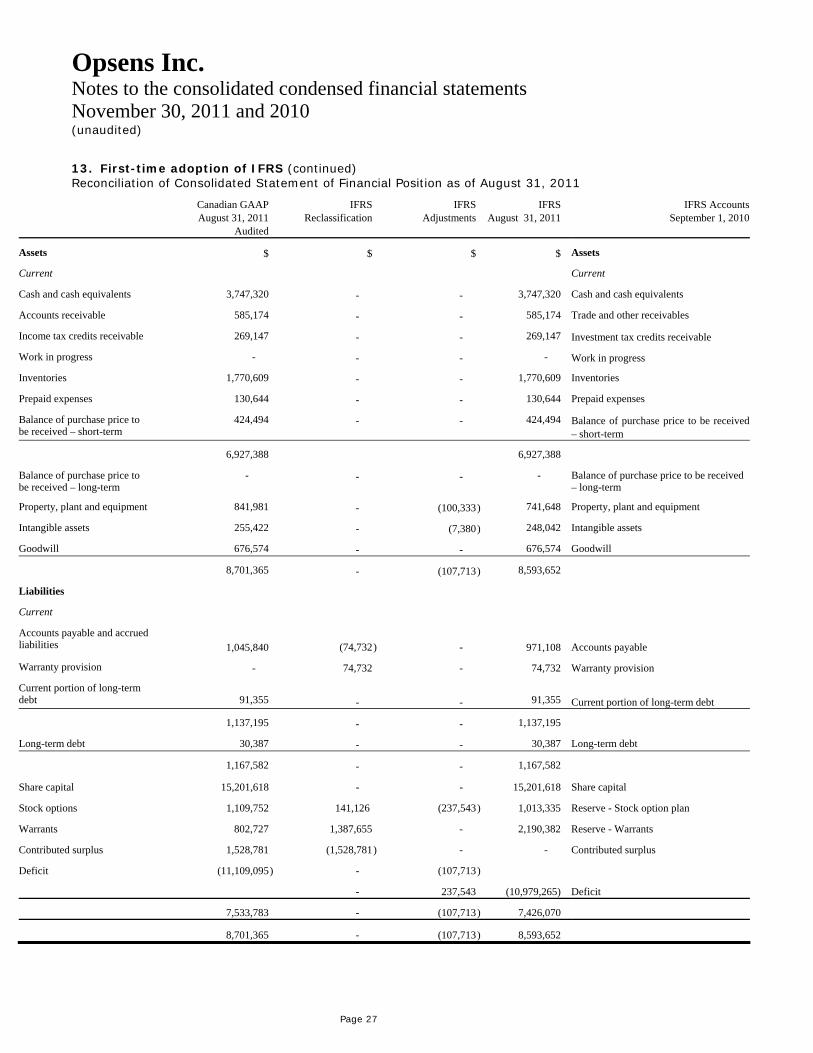
13. First-time adoption of IFRS (continued) Reconciliation of Consolidated Statement of Financial Position as of August 31, 2011
Canadian GAAP August 31, 2011
Audited
IFRSReclassification
IFRSAdjustments
IFRSAugust 31, 2011
IFRS AccountsSeptember 1, 2010
Assets $ $ $ $ Assets
Current Current
Cash and cash equivalents 3,747,320 - - 3,747,320 Cash and cash equivalents
Accounts receivable 585,174 - - 585,174 Trade and other receivables
Income tax credits receivable 269,147 - - 269,147 Investment tax credits receivable
Work in progress - - - - Work in progress
Inventories 1,770,609 - - 1,770,609 Inventories
Prepaid expenses 130,644 - - 130,644 Prepaid expenses
Balance of purchase price to be received – short-term
424,494 - - 424,494 Balance of purchase price to be received – short-term
6,927,388 6,927,388
Balance of purchase price to be received – long-term
- - - - Balance of purchase price to be received – long-term
Property, plant and equipment 841,981 - (100,333) 741,648 Property, plant and equipment
Intangible assets 255,422 - (7,380) 248,042 Intangible assets
Goodwill 676,574 - - 676,574 Goodwill
8,701,365 - (107,713) 8,593,652
Liabilities
Current
Accounts payable and accrued liabilities 1,045,840 (74,732) - 971,108
Accounts payable
Warranty provision - 74,732 - 74,732 Warranty provision
Current portion of long-term debt
91,355
- -
91,355
Current portion of long-term debt
1,137,195 - - 1,137,195
Long-term debt 30,387 - - 30,387 Long-term debt
1,167,582 - - 1,167,582
Share capital 15,201,618 - - 15,201,618 Share capital
Stock options 1,109,752 141,126 (237,543) 1,013,335 Reserve - Stock option plan
Warrants 802,727 1,387,655 - 2,190,382 Reserve - Warrants
Contributed surplus 1,528,781 (1,528,781) - - Contributed surplus
Deficit (11,109,095 ) - (107,713)
- 237,543 (10,979,265) Deficit
7,533,783 - (107,713) 7,426,070
8,701,365 - (107,713) 8,593,652
Opsens Inc.
Page 28
Notes to the consolidated condensed financial statements November 30, 2011 and 2010 (unaudited)
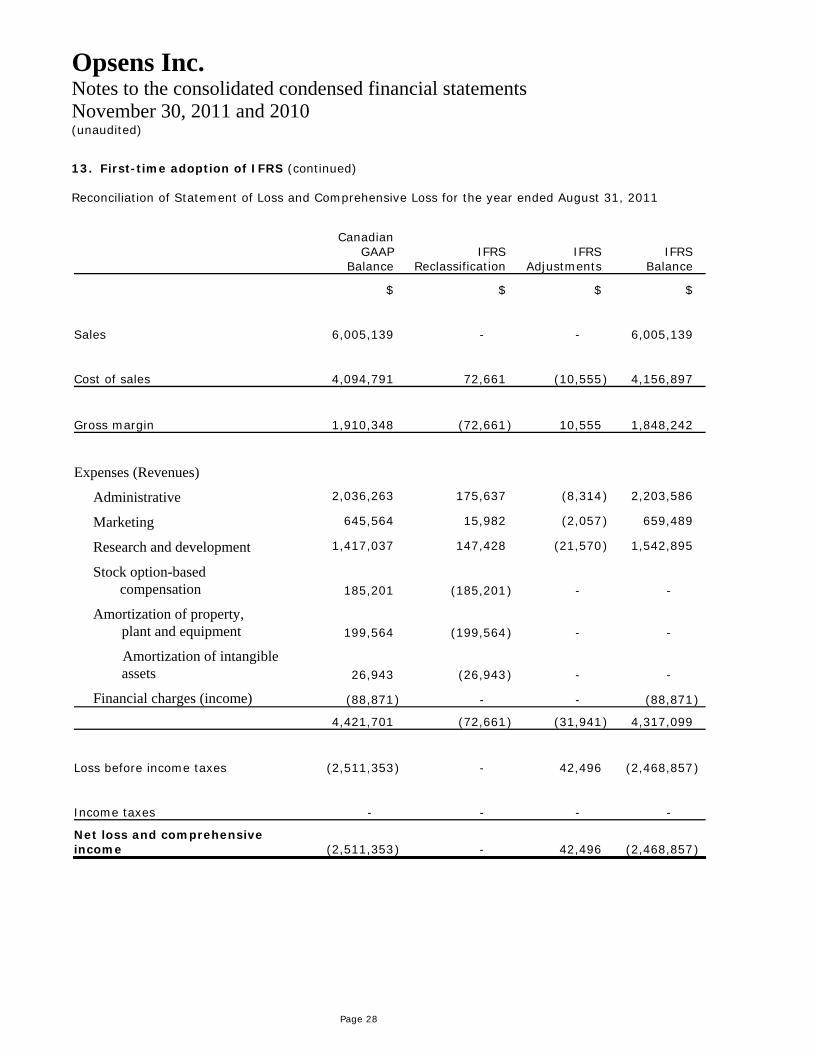
13. First-time adoption of IFRS (continued) Reconciliation of Statement of Loss and Comprehensive Loss for the year ended August 31, 2011 Canadian
GAAP Balance
IFRS
Reclassification
IFRS
Adjustments
IFRS
Balance
$ $ $ $
Sales 6,005,139 - - 6,005,139
Cost of sales 4,094,791 72,661 (10,555 ) 4,156,897
Gross margin 1,910,348 (72,661 ) 10,555 1,848,242
Expenses (Revenues)
Administrative 2,036,263 175,637 (8,314 ) 2,203,586
Marketing 645,564 15,982 (2,057 ) 659,489
Research and development 1,417,037 147,428 (21,570 ) 1,542,895
Stock option-based compensation 185,201 (185,201 ) - -
Amortization of property, plant and equipment 199,564 (199,564 ) - -
Amortization of intangible assets 26,943 (26,943 ) - -
Financial charges (income) (88,871 ) - - (88,871 )
4,421,701 (72,661 ) (31,941 ) 4,317,099
Loss before income taxes (2,511,353 ) - 42,496 (2,468,857 )
Income taxes - - - -
Net loss and comprehensive income (2,511,353 ) - 42,496 (2,468,857 )
Opsens Inc.
Page 29
Notes to the consolidated condensed financial statements November 30, 2011 and 2010 (unaudited)
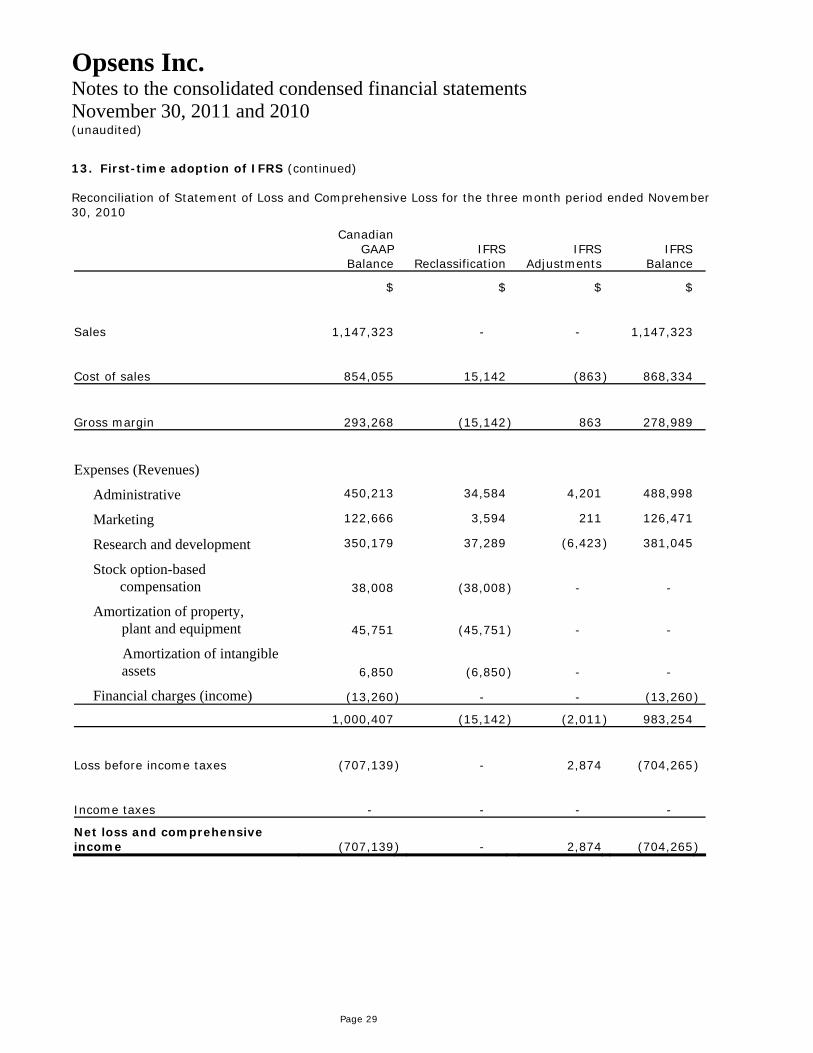
13. First-time adoption of IFRS (continued) Reconciliation of Statement of Loss and Comprehensive Loss for the three month period ended November 30, 2010
Canadian GAAP
Balance
IFRS
Reclassification
IFRS
Adjustments
IFRS
Balance
$ $ $ $
Sales 1,147,323 - - 1,147,323
Cost of sales 854,055 15,142 (863 ) 868,334
Gross margin 293,268 (15,142 ) 863 278,989
Expenses (Revenues)
Administrative 450,213 34,584 4,201 488,998
Marketing 122,666 3,594 211 126,471
Research and development 350,179 37,289 (6,423 ) 381,045
Stock option-based compensation 38,008 (38,008 ) - -
Amortization of property, plant and equipment 45,751 (45,751 ) - -
Amortization of intangible assets 6,850 (6,850 ) - -
Financial charges (income) (13,260 ) - - (13,260 )
1,000,407 (15,142 ) (2,011 ) 983,254
Loss before income taxes (707,139 ) - 2,874 (704,265 )
Income taxes - - - -
Net loss and comprehensive income (707,139 ) - 2,874 (704,265 )
Opsens Inc.
Page 30
Notes to the consolidated condensed financial statements November 30, 2011 and 2010 (unaudited)
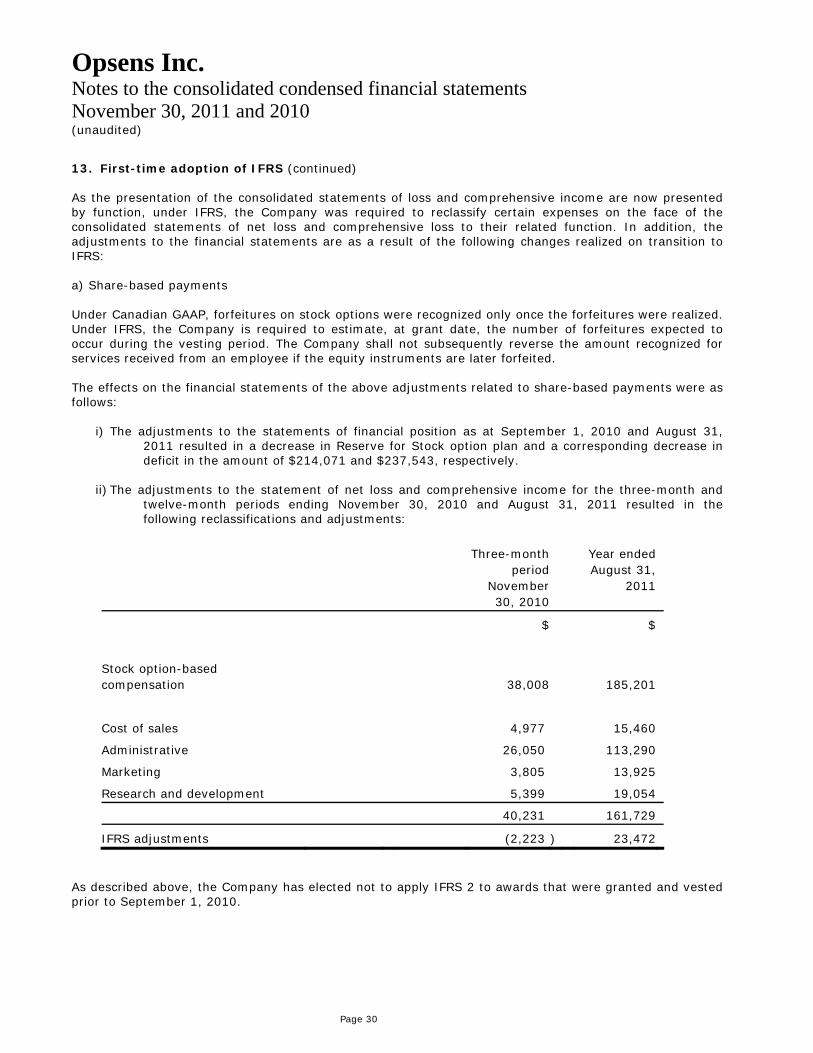
13. First-time adoption of IFRS (continued) As the presentation of the consolidated statements of loss and comprehensive income are now presented by function, under IFRS, the Company was required to reclassify certain expenses on the face of the consolidated statements of net loss and comprehensive loss to their related function. In addition, the adjustments to the financial statements are as a result of the following changes realized on transition to IFRS: a) Share-based payments Under Canadian GAAP, forfeitures on stock options were recognized only once the forfeitures were realized. Under IFRS, the Company is required to estimate, at grant date, the number of forfeitures expected to occur during the vesting period. The Company shall not subsequently reverse the amount recognized for services received from an employee if the equity instruments are later forfeited. The effects on the financial statements of the above adjustments related to share-based payments were as follows:
i) The adjustments to the statements of financial position as at September 1, 2010 and August 31, 2011 resulted in a decrease in Reserve for Stock option plan and a corresponding decrease in deficit in the amount of $214,071 and $237,543, respectively.
ii) The adjustments to the statement of net loss and comprehensive income for the three-month and twelve-month periods ending November 30, 2010 and August 31, 2011 resulted in the following reclassifications and adjustments:
Three-month period
November 30, 2010
Year ended August 31,
2011
$ $
Stock option-based compensation
38,008
185,201
Cost of sales 4,977 15,460
Administrative 26,050 113,290
Marketing 3,805 13,925
Research and development 5,399 19,054
40,231 161,729
IFRS adjustments (2,223 ) 23,472
As described above, the Company has elected not to apply IFRS 2 to awards that were granted and vested prior to September 1, 2010.
Opsens Inc.
Page 31
Notes to the consolidated condensed financial statements November 30, 2011 and 2010 (unaudited)
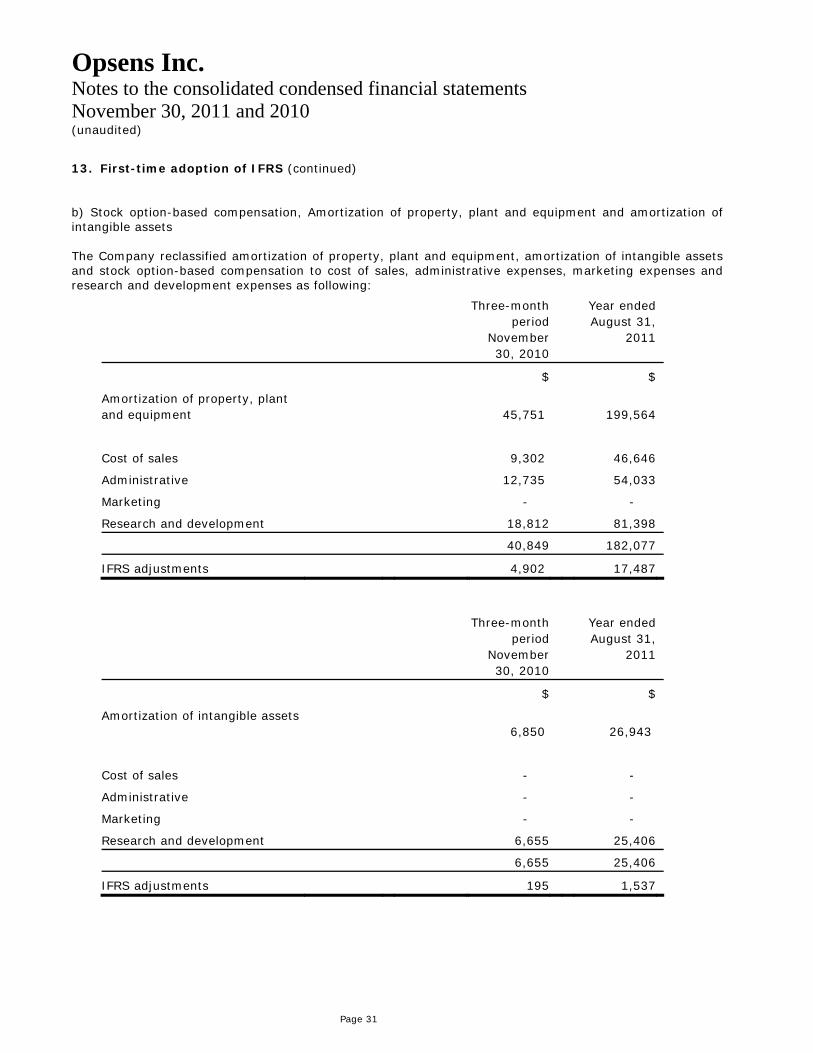
13. First-time adoption of IFRS (continued) b) Stock option-based compensation, Amortization of property, plant and equipment and amortization of intangible assets The Company reclassified amortization of property, plant and equipment, amortization of intangible assets and stock option-based compensation to cost of sales, administrative expenses, marketing expenses and research and development expenses as following:
Three-month period
November 30, 2010
Year ended August 31,
2011
$ $
Amortization of property, plant and equipment
45,751
199,564
Cost of sales 9,302 46,646
Administrative 12,735 54,033
Marketing - -
Research and development 18,812 81,398
40,849 182,077
IFRS adjustments 4,902 17,487
Three-month period
November 30, 2010
Year ended August 31,
2011
$ $
Amortization of intangible assets 6,850
26,943
Cost of sales - -
Administrative - -
Marketing - -
Research and development 6,655 25,406
6,655 25,406
IFRS adjustments 195 1,537
Opsens Inc.
Page 32
Notes to the consolidated condensed financial statements November 30, 2011 and 2010 (unaudited)
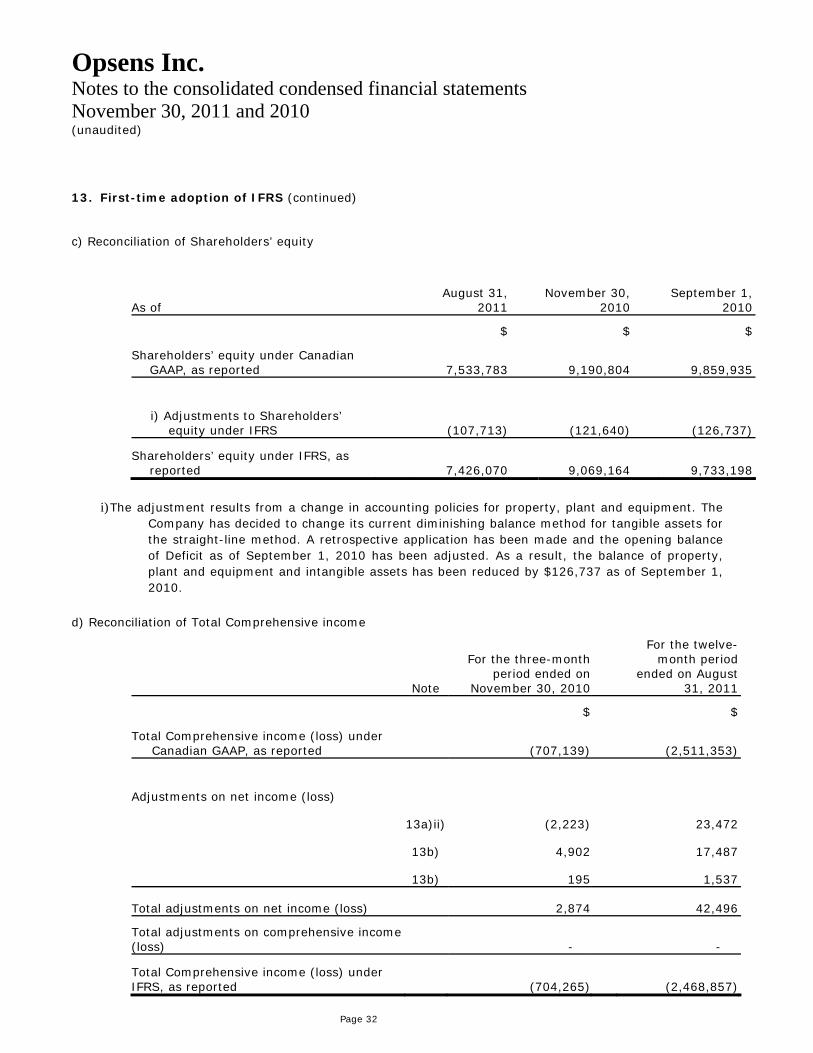
13. First-time adoption of IFRS (continued) c) Reconciliation of Shareholders’ equity
As of August 31,
2011 November 30,
2010 September 1,
2010
$ $ $
Shareholders’ equity under Canadian GAAP, as reported 7,533,783 9,190,804 9,859,935
i) Adjustments to Shareholders’ equity under IFRS (107,713) (121,640) (126,737)
Shareholders’ equity under IFRS, as reported 7,426,070 9,069,164 9,733,198
i) The adjustment results from a change in accounting policies for property, plant and equipment. The Company has decided to change its current diminishing balance method for tangible assets for the straight-line method. A retrospective application has been made and the opening balance of Deficit as of September 1, 2010 has been adjusted. As a result, the balance of property, plant and equipment and intangible assets has been reduced by $126,737 as of September 1, 2010.
d) Reconciliation of Total Comprehensive income
Note
For the three-month period ended on
November 30, 2010
For the twelve-month period
ended on August 31, 2011
$ $
Total Comprehensive income (loss) under Canadian GAAP, as reported (707,139) (2,511,353)
Adjustments on net income (loss)
13a)ii) (2,223) 23,472
13b) 4,902 17,487
13b) 195 1,537
Total adjustments on net income (loss) 2,874 42,496
Total adjustments on comprehensive income (loss) - -
Total Comprehensive income (loss) under IFRS, as reported (704,265) (2,468,857)
Opsens Inc.
Page 33
Notes to the consolidated condensed financial statements November 30, 2011 and 2010 (unaudited)
13. First-time adoption of IFRS (continued) e) Contributed surplus
The contributed surplus has been reclassified according to the nature of the different elements of which it consists. An amount of $1,328,600 was recorded in the contributed surplus under Canadian GAAP following the expiry of warrants. This amount has been reclassified in accordance with IFRS requirements as of September 1, 2010. An amount of $1,387,655 has also been reclassified to “Reserve – Warrants” as of August 31, 2011.
14. Contingencies On March 9, 2011, Opsens stated that it would vigorously defend itself against a lawsuit filed by ACIST Medical Systems Inc., a Delaware corporation (ACIST), alleging the improper use of alleged ACIST confidential information in connection with Opsens’ EasyWire device and certain patent applications Opsens has filed, including U.S. Patent Application No. 12/725,951 and International Application No. PCT/CA2010/000396 (the “Applications”). ACIST’s lawsuit seeks unspecified monetary damages, and further seeks that Opsens assign or abandon the Applications and cease development and testing of its EasyWire device. Opsens has denied all of ACIST’s legal claims in its Answer to the lawsuit filed in the United States District Court for the District of Minnesota. Opsens maintains that ACIST’s lawsuit is entirely without merit and looks forward to proving its case in Court.
15. Subsequent events On January 16, 2012, Opsens’ Board of Directors also authorized the grant of a total of 100,000 stock options to a director. Under the provisions of Opsens’ stock option plan, each stock option granted entitles the holder to subscribe to one Opsens’ common share at the latest on January 15, 2017 and at a price equal to 0.20$ per share. The stock options granted to the director entitle the holder to subscribe immediately to Opsens’ common shares.