interim consolidated ancial statements...
81
int erim consolidated fin ancial statements March 31, 2000 and 1999 The information of the Financial Statements are available in English, Portuguese and Spanish at our site: http://www.itau.com.br/ri Banco Itaú S.A.
Transcript of interim consolidated ancial statements...
�
interimconsolidated
financialstatementsMarch 31, 2000and 1999
The information of the FinancialStatements are available in English,Portuguese and Spanish at our site:
http://www.itau.com.br/ri
Banco Itaú S.A.
1
Banco Itaú S.A. – Management Report
To our stockholders:
We hereby submit the Management Report and financial statements of Banco Itaú S.A.and its subsidiaries for the 1st quarter of the year 2000. The presentation of this reportcomplies with the regulations of the Central Bank of Brazil and the Comissão de ValoresMobiliários (the Brazilian Securities and Exchange Commission).
RESULTS AND MARKET CAPITALIZATION
Banco Itaú's consolidated net income totaled R$ 365 million in the quarter, representingannualized 26.1 % return on equity. In comparison with recurring net income for the sameperiod in 1999 (R$ 226 million), a 61.7 % increase was recorded.
It is important to point out that in 2000/first quarter Banco Itaú ran up foreign exchangelosses of R$ 69 million, accounted for in the operating income as resulting from currencydevaluation in Reais of permanent investments abroad. The opposite situation hadoccurred in 1999/first quarter, when the Bank obtained an extraordinary net income of R$535 million from such investments, due to the Brazilian monetary authorities' decision tomodify the foreign exchange policy. As a result, the total net income in that period came toR$ 761 million.
Consolidated net income per batch of one thousand shares of Banco Itaú's capital stocktotaled R$ 3.10, while book value was R$ 51.97. Banco Itaú paid shareholders the amountof R$ 139 million in the form of interest on stockholders’ equity.
At the end of the quarter, the Bank's preferred stock was quoted at R$ 155.00 per batch ofone thousand shares. As a result, Itaú's market capitalization came to R$ 16,566 million,the highest among all of the Latin American banks.
STOCKHOLDERS' EQUITY
Consolidated stockholders' equity totaled R$ 6,125 million at the end of the period, an 18.2% increase over March 1999. Own working capital, totaling R$ 3,518 million and the 20.8% risk-based capital ratio attest to Itaú's sound financial structure.
Banco Itaú's fixed-asset ratio corresponded to 61.9 %, at the end of the period, well belowthe maximum 80% allowed by the Central Bank of Brazil. Had the new criteria set forth inthe Central Bank's Resolution 2,674 been adopted — such Resolution has not yet beenofficially approved —, basically allowing the inclusion of stock investments registered inthe bank's own portfolio or through investment funds, and the use of consolidated resultsof subsidiaries, then the index would have corresponded to 51.7 %. As for theconsolidated results of the financial companies, the index would have corresponded to67.1 %.

2
FUNDING AND RESOURCES UNDER MANAGEMENT
Banco Itaú's own free resources added to those raised or managed amounted to aconsolidated R$ 77,366 million at the end of the quarter. This figure is 12.7 % higher thanthe one recorded for March 1999. Of this amount, R$ 34,135 million corresponds toinvestment funds and other resources under management, which in turn increased by 32.4%.
Banco Itaú and Banco Matrix entered into a partnership for the co-management of 48funds hitherto managed by Matrix, in Brazil and abroad, the assets of which amount to R$1,800 million. Itaú assumed the direct management of these funds with the objective ofsupplementing, diversifying and broadening its derivatives fund portfolio, withoutincreasing the operating costs. The related value has not been consolidated into Itaú'sfigures yet because there are still bureaucratic procedures to be complied with.Banco Itaú, through its Grand Cayman branch, carried out two Eurobond placements onthe international market in the year 2000. The last such issue was on April 13, andamounted to US$ 150 million, maturing in one year, with an 8.0 % coupon/ year. Theissue was launched at a discount, representing a final yield of 8.08 % a year for investors,corresponding to 166 basic points above one-year Treasuries. Ever since the Asian crisis,this was the lowest cost registered for a foreign funding transaction for such maturity term.
ASSETS AND LOANS
Itaú's consolidated assets at the end of the quarter amounted to R$ 54,094 million.
The consolidated portfolio of loans, leasing operations, advances, guarantees, and creditgranting operations amounted to R$ 20,241 million, an 11.5 % increase in comparison withMarch 1999. The portfolio totaled R$ 28,668 million, when investments in securities issuedby companies, including financial ones, were added to the former amount, correspondingto a 20.1 % increase over March 1999.
The total value of securities issued by the National Treasury or the Central Bankcorresponded to R$ 9,738 million at the end of the quarter, confirming the Bank's highliquidity level.
CREDIT RISK POLICY
According to the Central Bank's Resolution 2,682, Banco Itaú started to classify credit risksbased on assessments of customers and operations. The object was to make provisionfor credit losses. On the balance sheet, the provision in excess, above the minimumrequired amount, was R$ 625 million. On the income statement, provision for credit losses,net of credit recoveries, had an impact of R$ 61 million on the quarter's result, dropping byR$ 168 million, when compared with the same period in 1999.
The current credit process, coupled with the more stable macroeconomic scenariopredicted for this year, will permit the expansion of the credit portfolios, while maintainingthe same liquidity level.

3
INTERNET
New sites, focusing on specific needs and segments were made available this quarter, inline with Itaú's investments in the Internet for the benefit of the bank's clients. The newsites are: (1) Small-sized Companies, which provides products and services for thisimportant segment of the economy; (2) Itaú Investnet Personnalité, which provides ItaúPersonnalité clients with access to information, simulations and the management of theirinvestments; and (3) Investor Relations, which facilitates the obtaining of the bank'scorporate data by its shareholders and institutional investors.
In addition to the ongoing improvement of the Bank's other sites and of Itaú BanklineInternet, Itaú's customers have two new services at their disposal: Itaú i-Mail and Itaú i-Cellbank, through which they can get their current and savings account balances andstatements by e-mail and mobile phone. Itaú is actively and continuously analyzingpartnership alternatives in the Internet business.
HUMAN RESOURCES
Banco Itaú and its subsidiary companies employed 39,072 people at the end of thequarter. Payroll (fixed and variable remuneration), plus social charges and benefits,totaled R$ 517 million. The Bank’s employee benefits accounted for R$ 38 million of thisamount. The Plano de Aposentadoria Complementar (Supplementary Retirement Plan),offered by Fundação Itaubanco, deserves to be mentioned. These figures indicate monthlyaverage wages and social charges of R$ 4,000 per employee in the quarter.
AUDIT COMMITTEE
After the Internal Control Committee was set up as a statutory body, in 1999, BancoItaú S.A's General and Extraordinary Shareholders' Meeting, held on April 24, decidedto set up the Statutory Audit Committee. This decision was in line with themanagement, transparency and corporate governance process. The following peoplewere elected as full members of the Statutory Audit Committee:
! Gustavo Jorge Laboissiere Loyola (Graduate Degree in Economics from theUniversity of Brasília, Master's and Doctorate Degree in Economics from FundaçãoGetúlio Vargas, former president of the Central Bank of Brazil.);
! Iran Siqueira Lima (Economist and accountant, Ph.D. Degree in comptrolling andaccounting from the University of São Paulo, former director of the Central Bank ofBrazil); and
! Alberto Sozin Furuguem (Economist, former director of the Central Bank of Brazil).
The three new members are highly qualified professionals, with renowned expertise onthe financial market.

4
The Statutory Audit Committee will be installed and the members will take office assoon as the Central Bank of Brazil approves the decisions of the General ShareholdersMeeting.
ANNOUNCEMENT
It is with great regret that we record the death of Olavo Franco Bueno Júnior, Senior VicePresident and Member of the Board of Directors of Banco Itaú, who passed away on April1, 2000. Mr. Bueno's professional career with the Itaú Group spanned a period of morethan 30 years. During the time he worked for the Bank, he was able to show his uniqueprofessional talents and dedication in all the positions he held or on missions that he wasasked to undertake. In the last five years, he successfully modernized and restructured theFinancial Area, adapting it to today's complex financial world and, once again, remindingus of his outstanding qualities.
We also regret to announce the death of Professor Américo Oswaldo Campíglia, acolleague who was Chief Executive Officer of “Itaucred” from 1952 to 1988 and a Memberof the Bank's Advisory Board since 1988.
We regret the inestimable loss of our tireless companions with whom we spent years offruitful cooperation.
ACKNOWLEDGEMENTS
We would like to thank our shareholders for their indispensable trust and support for theon-going growth achieved by Itaú. We would also like to acknowledge the work of ouremployees and collaborators and thank them for their efforts, which have allowed the Bankto obtain impressive results, and constantly improve its products and services. Our specialthanks go to our customers for their trust and loyalty, which we have always made a pointof rewarding by offering high quality and conveniently differentiated services that meettheir financial servicing requirements.
(Approved at the Meeting of the Board of Directors on May 8, 2000)

5
2000 1999
Current and long term assets 51.091.878 51.661.597 Cash and cash equivalents 1.496.118 2.003.007 Interbank funds applied 4.013.295 8.039.317
Money market 2.256.735 5.488.083 Interbank deposits 1.756.560 2.556.694 Valuation Allowance - (5.460)
Securities 15.830.564 13.693.154 Own portfolio 14.070.863 12.678.137 Subject to repurchase commitments 1.988.046 1.106.796 Subject to forward commitments:
Open contracts and premiums 11.284 77.401 Subject to External Funding 228.578 - Deposited with the Central Bank 324.473 608.788 Privatization certificates 95.894 2 Valuation allowance (888.574) (777.970)
Interbank accounts 6.367.653 6.658.072 Pending settlements 2.225.729 3.057.280 Compulsory deposits:
Central Bank deposits 4.078.068 3.535.248 National Housing System 63.527 63.773
Interbank repasses - 338 Correspondents 329 1.433
Interbranch accounts 3.333 1.342 Third party funds in transit 1.569 882 Own funds in transit 1.764 460
Loan operations 13.890.694 12.673.272 Loans:
Public sector 619.170 185.457 Private sector 14.503.757 13.741.084 (Allowance for loan losses) (1.232.233) (1.253.269)
Leasing operations 554.328 397.575 Lease receivables:
Public sector - 1.859 Private sector 588.574 450.600 (Allowance for lease losses) (34.246) (54.884)
Other receivables 8.550.802 7.735.309 Foreign exchange portfolio 3.117.351 2.703.583 Income receivable 468.685 525.961 Securities clearing accounts 632.754 571.495 Specific Credits 3.518 5.531 Other 4.349.403 3.953.823 (Allowance for losses) (20.909) (25.084)
Other assets 385.091 460.549 Short-term investments 3.993 2.875 Assets received in settlement of debt 323.112 233.498 (Valuation allowance) (151.725) (68.087) Prepaid expenses 209.711 292.263
Permanent assets 3.001.663 2.883.366 Investments 594.054 477.559
Subsidiaries and affiliates: Domestic 173.903 125.444 Foreign 142.443 87.651
Other investments 282.436 273.117 (Allowance for losses) (4.728) (8.653)
Fixed assets 2.225.649 2.288.344 Property for own use 2.473.296 2.504.034 Other fixed assets for own use 1.676.843 1.516.090 Accumulated depreciation (1.924.490) (1.731.780)
Deferred expenses 181.960 117.463 Goodwill to be amortized 2.120 865 Deferred installation expenses 317.617 215.528 Accumulated amortization (137.777) (98.930)
Total assets 54.093.541 54.544.963
See the accompanying notes to the financial statements.
Assets

6
Liabilities 2000 1999
Current and long term liabilities 45.527.219 47.144.466 Deposits 22.131.021 21.526.852
Demand deposits 4.163.950 3.373.226 Savings accounts 14.674.345 15.108.061 Interbank deposits 16.696 300.986 Time deposits 3.276.030 2.744.579
Money market repurchase commitments 4.289.307 3.599.380 Own portfolio 2.425.951 1.923.910 Third party portfolio 1.863.356 1.675.470
Acceptances and debentures 3.139.584 4.957.250 Debentures 1.140.486 3.228.321 Foreign Borrowings in Securities 1.999.098 1.728.929
Interbank accounts 2.170.674 2.862.944 Pending settlements 2.064.035 2.755.188 Interbank on-lending 1.026 28.092 Correspondents 105.613 79.664
Interbranch accounts 332.899 388.861 Third party funds in transit 321.753 366.045 Own funds in transit 11.146 22.816
Borrowing 3.570.308 4.449.505 Borrowings from domestic - Other institutions 460.748 224.301 Foreign currency trade finance borrowings 3.109.560 4.225.204
On-lending borrowings from public institutions 1.899.840 1.450.451 Federal Development Bank (BNDES) 1.226.497 599.597 CEF 1 1 Federal Capital Goods Financing Agency (FINAME) 672.535 849.919 Other institutions 807 934
Foreign currency on-lending borrowings 161 - Foreign currency on-lending borrowings 161 -
Other liabilities 7.993.425 7.909.223 Collection of taxes and contributions 456.771 964.757 Foreign exchange portfolio 1.989.092 1.243.042 Corporate and statutory contributions 174.200 230.326 Taxes and social security contributions 817.239 857.208 Due in connection with securities dealing 503.904 875.036 Technical provision of insurance, pension plans and capitalization operations - Vinculated 331.980 250.652 Financial and development funds 98 104 Others 3.720.141 3.488.098
Technical provision of insurance, pension plans and capitalization operations - Not vinculated 1.904.201 1.750.178
Deferred income 142.581 113.699 Deferred income 142.581 113.699
Minority interest in consolidated subsidiaries 394.722 354.708
Stockholders' equity 6.124.818 5.181.912 Capital:
Domestic 1.975.208 1.603.721 Foreign 524.792 396.279
Capital reserves 264.394 415.770 Revaluation reserves 12.434 15.461 Retained income 3.458.703 2.852.647 (Treasury shares) (110.713) (101.966)
Total liabilities 54.093.541 54.544.963

7
2000 1999
Income from financial operations 1.964.933 3.388.469
Loans 901.801 1.400.369 Leases 144.630 166.485 Securities portfolio 862.624 1.709.370 Trade finance and foreign exchange portfolio 7.351 22.981 Compulsory deposits 48.527 89.264
Expenses of financial operations (938.717) (2.474.163)
Deposits, money market and interbank funds (588.277) (1.548.320) Borrowings and on-lending (81.721) (520.798) Leases (115.967) (105.824) Provision for loan losses (152.752) (299.221)
Net income from financial operations 1.026.216 914.306
Other operating income (expenses) (486.285) (475.687)
Banking service fees 801.635 696.519 Capitalization, insurance and pension plans premiums 465.884 456.090 Expenses in constituting technical provisions of insurance, (103.480) (83.789) capitalization and pension plan operations Insurance claims (181.952) (235.913) Selling expenses - Insurance (50.260) (57.863) Pension plan benefits expense (41.796) (28.361) Salaries and employee benefits (516.626) (474.968) Other administrative expenses (639.026) (574.900) Tax expenses (141.141) (154.898) Equity share in income of subsidiaries and affiliates (53.074) 31.931 Other operating income 99.786 184.543 Other operating expenses (126.235) (234.078)
Operating income 539.931 438.619
Non operating income 9.884 (2.523)
Income before income tax and social contribution and profit sharing 549.815 436.096
Income tax and social contribution Due on operations for the years (162.055) (299.993) Deferred related to temporary additions 3.864 169.926
Extraordinary results - 534.683
Profit sharing (28.531) (22.547)
E Employees (23.150) (19.298) D Directors - Statutories (5.381) (3.249)
Minority interest 2.182 (57.565)
Net income 365.275 760.600
Number of outstanding shares 117.844.337.341 117.803.569.740 (*)Net income per thousand shares - R$ 3,10 6,46Stockholders' equity per thousand shares - R$ 51,97 43,99
(*) Number of shares adjusted for better comparability due to the split performed in 1999
See the accompanying notes to the financial statements.
8
Three-month periods ended March 31, 2000 and 1999
(In thousands of reais)
1 Presentation of the financial statements
The consolidated financial statements of Banco Itaú S.A. and its subsidiaries (ITAÚCONSOLIDATED) have been prepared in accordance with accounting practices derived fromthe Brazilian Corporation Law and instructions issued by the Brazilian Securities and ExchangeCommission (CVM) and the Central Bank of Brazil (BACEN), which include the use ofestimates necessary to calculate accounting provisions.
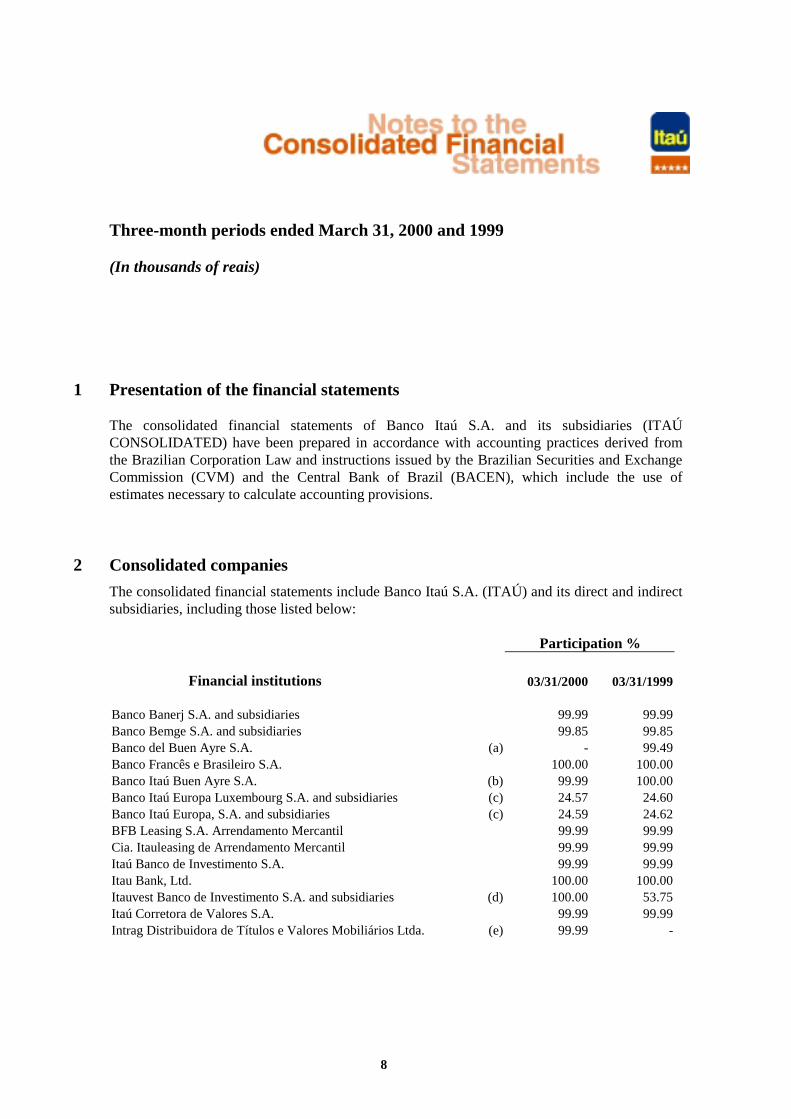
2 Consolidated companies
The consolidated financial statements include Banco Itaú S.A. (ITAÚ) and its direct and indirectsubsidiaries, including those listed below:
Participation %
Financial institutions 03/31/2000 03/31/1999
Banco Banerj S.A. and subsidiaries 99.99 99.99Banco Bemge S.A. and subsidiaries 99.85 99.85Banco del Buen Ayre S.A. (a) - 99.49Banco Francês e Brasileiro S.A. 100.00 100.00Banco Itaú Buen Ayre S.A. (b) 99.99 100.00Banco Itaú Europa Luxembourg S.A. and subsidiaries (c) 24.57 24.60Banco Itaú Europa, S.A. and subsidiaries (c) 24.59 24.62BFB Leasing S.A. Arrendamento Mercantil 99.99 99.99Cia. Itauleasing de Arrendamento Mercantil 99.99 99.99Itaú Banco de Investimento S.A. 99.99 99.99Itau Bank, Ltd. 100.00 100.00Itauvest Banco de Investimento S.A. and subsidiaries (d) 100.00 53.75Itaú Corretora de Valores S.A. 99.99 99.99Intrag Distribuidora de Títulos e Valores Mobiliários Ltda. (e) 99.99 -

9
Non-financial institutions
Afinco Ltda. and subsidiaries 99.88 99.99Armazéns Gerais Itaú Ltda. 99.78 99.78Credicard S.A. Administradora de Cartões de Crédito andsubsidiaries (f) 33.28 33.33Redecard S.A. (f) 31.89 32.02Itaú Capitalização S.A. and subsidiaries 99.85 99.99Itaucard Administradora de Cartões de Crédito e Imobiliária Ltda. 99.85 99.99Itaú Gráfica Ltda. 99.85 99.99Itaú Previdência e Seguros S.A. 99.85 99.99Itaú Rent Administração e Participações S.A. 99.85 99.99Itaú Seguros S.A. and subsidiaries 95.83 95.98Itaúsa Export S.A. and subsidiaries (c) 27.98 28.03
(a) The investment was incorporated by Banco Itaú Argentina S.A. on October 5, 1999.(b) New name of Banco Itaú Argentina S.A., after incorporation of Banco del Buen Ayre S.A.(c) Subsidiaries included in the consolidation, with the authorization of the Brazilian Securites and
Exchange Comission (CVM) to better present the business of the Group. Subsidiaries controlled byItaúsa - Investimentos Itaú S.A. (ITAÚSA).
(d) New name of Itaú Bankers Trust Banco de Investimento S.A. - IBT which since September 10, 1999 isfully controlled by ITAÚ.
(e) The investment was acquired from ITAUSA on August 31, 1999.(f) The investments are proportionally included in the consolidation financial statements.
3 Summary of significant accounting practices
a. Basis of consolidation
All material intercompany profits, transactions and balances have been eliminated onconsolidation.

10
b. Securities
Securities are recorded at the lower of price-level restated cost and adjusted by a provision toreflect its market value.
c. Interbank funds applied, loan operations, traded receivable discounted, financingremunerated deposits, money market repurchase commitments and otherreceivables and payables
Transactions subject to monetary correction or foreign exchange rates are recorded at presentvalue calculated “pro rata die” based on the variation of the contractual index. Real estateloans are adjusted to present value based on the discounted cash flow of future installments.Transactions with predetermined remuneration rates are recorded at their redemption value,adjusted for any unearned income/expenses.
d. Allowance for loan losses
The balance of the allowance for loan losses was constituted based on an analysis of creditrisk in the loan portfolio in amounts considered sufficient to cover possible losses.
e. Fixed assets
Fixed assets are stated at cost of acquisition or construction less accumulated depreciation,monetarily corrected at December 31, 1995. For insurance, pension plan and capitalizationsubsidiaries, fixed assets are adjusted to market value, through revaluations supported byappraisal reports. Depreciation and amortization are recorded using the straight line method,based on monetarily corrected cost over the useful lives of depreciable assets at thefollowing annual rates:
%Buildings used in operations 4Installations, furnishings, equipment and Security and communications systems 10 to 25EDP systems 20 to 50

11
f. Deferred expenses
Deferred organization and expansion expenses represent improvements in third partyproperties and are amortized linearly amortized over the respectively rental periods, andacquisition and development of logistic, which are amortized on a straight-line basis in fiveyears.
g. Income tax, social contribution, PIS and COFINS
The provisions were calculated utilizing the appropriate calculation base consideringpertinent legislation for each tax at the rates shown below:
03/31/2000 03/31/1999
Income tax 15.00% 15.00%Additional income tax 10.00% 10.00%Social contribution 8.00% 8.00%Additional social contribution 1.00% (*) -PIS 0.65% 0.65%COFINS 3.00% 3.00%
(*) Effective until December 31, 2002. Since February 1, 2000, the additional was decreased from 4% to 1%.
Amounts subject to litigation have been fully provided.
(In thousands of reais)
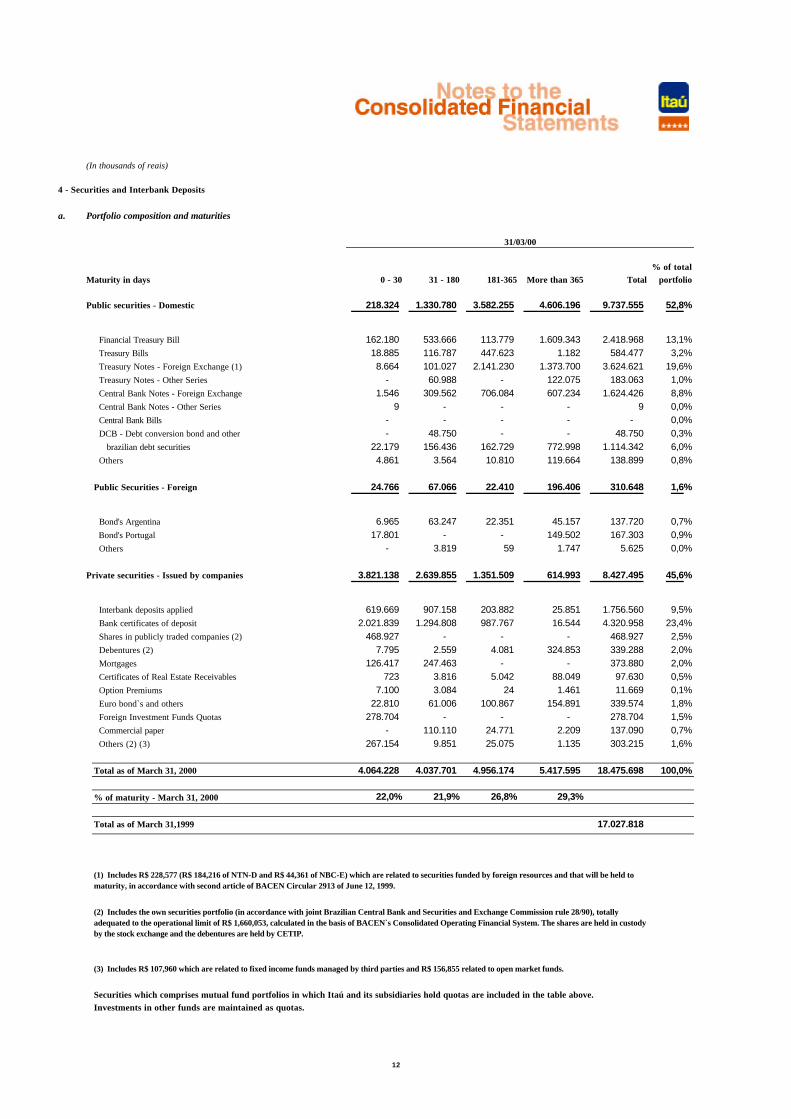
4 - Securities and Interbank Deposits
a. Portfolio composition and maturities
% of totalMaturity in days 0 - 30 31 - 180 181-365 More than 365 Total portfolio
Public securities - Domestic 218.324 1.330.780 3.582.255 4.606.196 9.737.555 52,8%
Financial Treasury Bill 162.180 533.666 113.779 1.609.343 2.418.968 13,1% Treasury Bills 18.885 116.787 447.623 1.182 584.477 3,2% Treasury Notes - Foreign Exchange (1) 8.664 101.027 2.141.230 1.373.700 3.624.621 19,6% Treasury Notes - Other Series - 60.988 - 122.075 183.063 1,0% Central Bank Notes - Foreign Exchange 1.546 309.562 706.084 607.234 1.624.426 8,8% Central Bank Notes - Other Series 9 - - - 9 0,0% Central Bank Bills - - - - - 0,0% DCB - Debt conversion bond and other - 48.750 - - 48.750 0,3% brazilian debt securities 22.179 156.436 162.729 772.998 1.114.342 6,0% Others 4.861 3.564 10.810 119.664 138.899 0,8%
ForeignPublic Securities - Foreign 24.766 67.066 22.410 196.406 310.648 1,6%
Bond's Argentina 6.965 63.247 22.351 45.157 137.720 0,7% Bond's Portugal 17.801 - - 149.502 167.303 0,9% Others - 3.819 59 1.747 5.625 0,0%
Private securities - Issued by companies 3.821.138 2.639.855 1.351.509 614.993 8.427.495 45,6%
Interbank deposits applied 619.669 907.158 203.882 25.851 1.756.560 9,5% Bank certificates of deposit 2.021.839 1.294.808 987.767 16.544 4.320.958 23,4% Shares in publicly traded companies (2) 468.927 - - - 468.927 2,5% Debentures (2) 7.795 2.559 4.081 324.853 339.288 2,0% Mortgages 126.417 247.463 - - 373.880 2,0% Certificates of Real Estate Receivables 723 3.816 5.042 88.049 97.630 0,5% Option Premiums 7.100 3.084 24 1.461 11.669 0,1% Euro bond`s and others 22.810 61.006 100.867 154.891 339.574 1,8% Foreign Investment Funds Quotas 278.704 - - - 278.704 1,5% Commercial paper - 110.110 24.771 2.209 137.090 0,7% Others (2) (3) 267.154 9.851 25.075 1.135 303.215 1,6%
Total as of March 31, 2000 4.064.228 4.037.701 4.956.174 5.417.595 18.475.698 100,0%
% of maturity - March 31, 2000 22,0% 21,9% 26,8% 29,3%
Total as of March 31,1999 17.027.818
Securities which comprises mutual fund portfolios in which Itaú and its subsidiaries hold quotas are included in the table above. Investments in other funds are maintained as quotas.
31/03/00
(2) Includes the own securities portfolio (in accordance with joint Brazilian Central Bank and Securities and Exchange Commission rule 28/90), totally adequated to the operational limit of R$ 1,660,053, calculated in the basis of BACEN`s Consolidated Operating Financial System. The shares are held in custody by the stock exchange and the debentures are held by CETIP.
(1) Includes R$ 228,577 (R$ 184,216 of NTN-D and R$ 44,361 of NBC-E) which are related to securities funded by foreign resources and that will be held to maturity, in accordance with second article of BACEN Circular 2913 of June 12, 1999.
(3) Includes R$ 107,960 which are related to fixed income funds managed by third parties and R$ 156,855 related to open market funds.
12

13
b. Changes in the valuation allowance for securities
Balances as of December 31, 1998 271,526Provisions 128,190Write-offs: (126,173)• Reversals (21,477)• Losses for sales ( 104,696)
Balances as of March 31, 1999 273,543Additional provision (*) 509,887
Balances as of March 31, 1999 with the additional provision 783,430
Balances as of December 31, 1999 156,401Write-offs: ( 13,727)! Reversals ( 11,695)! Losses for sales ( 2,032)
Balances as of March 31, 2000 142,674Additional provision (*) 745,900
Balances as of December 31, 2000 with the additional provision 888,574
(*) Additional provisions were constituted to cover the risk of future price fluctuations.
c. Summary
03/31/2000 03/31/1999
Securities and interbank deposits 18,475,698 17,027,818Valuation allowance ( 888,574) ( 783,430)
Net book value 17,587,124 16,244,388

14
5 Loan and leasing portfolio
a. Summary
03/31/2000 03/31/1999
Loan and leasing operations 15,711,501 14,379,000Other receivables (1) 168,491 153,879Advances on exchange contracts (2) 1,512,988 1,314,184
Total 17,392,980 15,847,063
Endorsements and sureties (3) 2,847,560 2,302,048
Total with endorsements and sureties 20,240,540 18,149,111
(1) Composed by honored endorsements and sureties, receivable for advances, comissions, debtors on purchase of assets and receivables.
(2) Advances on exchange contracts are recorded in other liabilities.
(3) Endorsements and sureties are recorded in memorandum accounts.
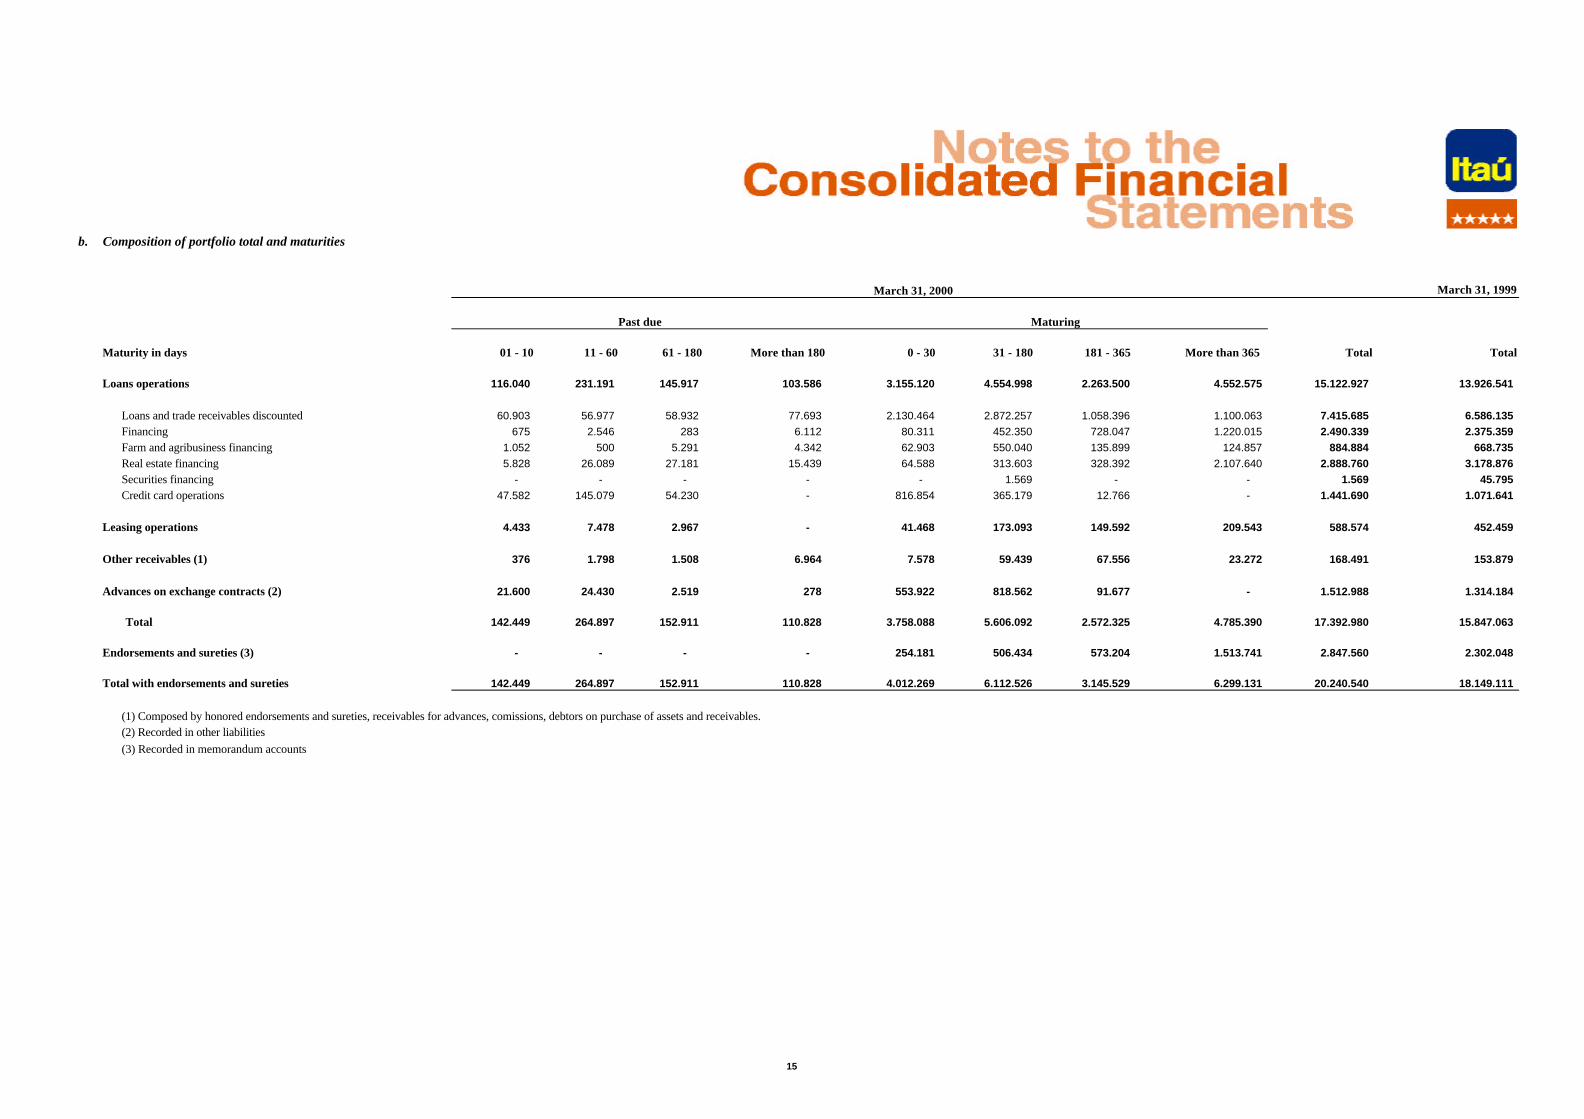
b. Composition of portfolio total and maturities
March 31, 1999
Maturity in days 01 - 10 11 - 60 61 - 180 More than 180 0 - 30 31 - 180 181 - 365 More than 365 Total Total
Loans operations 116.040 231.191 145.917 103.586 3.155.120 4.554.998 2.263.500 4.552.575 15.122.927 13.926.541
Loans and trade receivables discounted 60.903 56.977 58.932 77.693 2.130.464 2.872.257 1.058.396 1.100.063 7.415.685 6.586.135 Financing 675 2.546 283 6.112 80.311 452.350 728.047 1.220.015 2.490.339 2.375.359 Farm and agribusiness financing 1.052 500 5.291 4.342 62.903 550.040 135.899 124.857 884.884 668.735 Real estate financing 5.828 26.089 27.181 15.439 64.588 313.603 328.392 2.107.640 2.888.760 3.178.876 Securities financing - - - - - 1.569 - - 1.569 45.795 Credit card operations 47.582 145.079 54.230 - 816.854 365.179 12.766 - 1.441.690 1.071.641
Leasing operations 4.433 7.478 2.967 - 41.468 173.093 149.592 209.543 588.574 452.459
Other receivables (1) 376 1.798 1.508 6.964 7.578 59.439 67.556 23.272 168.491 153.879
Advances on exchange contracts (2) 21.600 24.430 2.519 278 553.922 818.562 91.677 - 1.512.988 1.314.184
Total 142.449 264.897 152.911 110.828 3.758.088 5.606.092 2.572.325 4.785.390 17.392.980 15.847.063
Endorsements and sureties (3) - - - - 254.181 506.434 573.204 1.513.741 2.847.560 2.302.048
Total with endorsements and sureties 142.449 264.897 152.911 110.828 4.012.269 6.112.526 3.145.529 6.299.131 20.240.540 18.149.111
(1) Composed by honored endorsements and sureties, receivables for advances, comissions, debtors on purchase of assets and receivables.(2) Recorded in other liabilities
(3) Recorded in memorandum accounts
Past due Maturing
March 31, 2000
15

16
c. Concentration of credit (*)
Risk % of Total
Largest debtor 695,469 3.420 largest debtors 4,128,400 20.450 largest debtors 6,398,700 31.6100 largest debtors 8,279,648 40.9
(*) Balances include endorsements and sureties.

17
d. Composition of thecredit portfolio by business sector
March 31, 2000
Public sector 695,926
Industry 695,926
Chemicals and petrochemicals 695,469
Others 457
Private sector 19,544,614
Industry 6,140,868
Steel, mettallurgy and heavy industry 1,426,117
Chemicals and petrochemicals 936,232
Food and beverages 1,064,531
Paper and pulp 506,973
Light and heavy vehicles 451,800
Electrical and electronics 426,728
Textiles and clothing 198,754
Autoparts and accessories 121,314
Fertilizers, insecticides, and crop protection 217,747
Pharmaceuticals 98,998
Others 691,674
Commerce 995,777
Services 3,703.855
Financial 1,076,628
Energy, telecommunications, and others 1,453,256
Other 1,173,971
Housing 2,888,760
Individuals 2,487,811
Businesses 400,949
Primary sector 945,932
Farming and livestock 400,353
Mining 545,579
Other - individuals 4,457,372
Credit cards 1,441,690
Other 3,015,682
Other - Businesses 412,050
Total 20,240,540
e. Allowance for loan losses
On December 21, 1999, BACEN introduced new criterion for the classification of creditrights from credit operations and leases through Resolution 2,682 including theestablishment of provisions for loans losses and disclosures of information relating to the

18
portfolio in the notes to the financial statements, these measures have to be applied afterMarch 2000.
The new criteria introduced by this Resolution includes:
• Financial institutions are required to classify loan operations by level of risk, based onconsistent and verifiable criteria.
• Non-accrual loans and overdue loan operations are no longer presented separately in thebalance sheet. The balances at March 31, 1999 have been reclassified for purposes ofcomparison.
• A provision has to be made, once the loans has been provided, based on a periodicanalysis of the quality of the client/loan and not just in the event of default as requiredby the Regulations in force until February 29, 2000.
• Write-offs can only be made 360 days after the due date of the credit or 720 days foroperations that mature after a period of 36 months.

19
Although BACEN Resolution 2697 of February 24, 2000 permits financial institutions to begradually introduced to the criteria of BACEN Resolution 2682, ITAÚ CONSOLIDATED financial statements at March 31, 2000 reflect these criteria, already.
BACEN Circular 2974 of February 24, 2000 provided that the adjustments from thedifference from providing for operations contracted to December 31, 1999, from applyingcriteria established under BACEN Resolutions 2682 and 2697 have to be recorded inretained earnings. The adoption of new criteria by ITAÚ CONSOLIDATED has not resultedin any adjustments to be made in retained earnings.
I - Changes in the allowance for loan losses
Balances as of December 31, 1999 1,253,371
Provisions for the period 152,752Write-offs made up to February 29, 2000 (118,735)
Balances as of March 31, 2000 1,287,388
Specific provision (1) 321,599Generic provision (2) 341,162Excess provision 624,627
(1) For operations for which installments are overdue more than 14 days, with renegotiationmade, or under the responsibility of companies in the process of debt rehabilitation orbankruptcy.
(2) For operations not covered by the previous item, but due to the classification of the client orthe operation.
The balance of the provision at March 31, 2000 was equivalent to 7.4% of the loan portfolio.

20
II - Provision for loan losses by risks level
Risk levelsCredit
portfolioMinimum provision
requiredExcess
provisionExisting
provision
Specific Generic AA 4,906,983 - - A 6,021,657 - 30,104 B 3,506,932 2,284 32,786 C 1,530,268 7,819 38,086 D 723,475 11,686 60,660 E 90,347 26,295 809 F 298,218 40,976 108,132 G 39,920 26,034 1,910 H 275,180 206,505 68,675
Total 17,392,980 321,599 341,162 624,627 1,287,388
III – Main Accounts Comparative, as of March 31, 2000, related to the criteria ofResolutions n° 1748/90 and 2682/99.
Creditportfolio
Non-accrual and
overdueloans (*)
Minimum provisionrequired
Existingprovision (*)
Excessprovision
Specific Generic
Prior situation (Res. 1748) 17,121,513 271,467 271,467 - 1,287,388 1,015,921 Effects of new criteria adoption 271,467 (271,467) 50,132 341,162 - (391,294) Present situation (Res. 2682) 17,392,980 - 321,599 341,162 1,287,388 624,627
(*) Without including the effects of write-offs made on March 2000, amounting to R$ 38,321,which were not made in the accelerated way (61 days after recorded as non-accrual loan) asrequired by Resolution n° 2682/99.

21
f. Credit recoveries offset against the provision for loan losses
Three-month period ended March 31, 1999 70,264
• Renegotiations 24,482
• Receipts 45,782
Three-month period ended March 31, 2000 92,141
• Renegotiations 31,685
• Receipts 60,456
On March 31, 2000, the balances of renegotiated credits amounted to R$ 308.479 (R$ 241.253 inMarch 31, 1999).
6 Investments - Composition
03/31/2000 03/31/1999
Investments in subsidiaries and affiliates:
Domestic 173,903 125,444
Duraflora S.A. (1) 32,259 32,053
Union Carbide do Brasil S.A. (2) 36,082 30,558
AGF Brasil Seguros S.A. 77,196 44,321
Serasa 27,104 17,055
Others 1,262 1,457
Foreign 142,443 87,651
· BPI - SGPS S.A. (BPI) 142,443 87,651
Other investments: 282,436 273,117
Tax incentive investments 217,978 204,398
Equity securities 17,977 16,003
Shares and quotas 26,419 31,030
Others 20,062 21,686(1) Investments arising from tax incentives(2) Investment resulting from the usage of privatization currencies

22
7 Foreign exchange operations
03/31/2000 03/31/1999
Assets - Other receivables 3,117,351 2,703,583
Exchange purchases pending settlement 2,300,321 2,113,081Foreign currency bills exchange and term documents 20,484 19,918Exchange sale rights 1,140,461 710,529(-) Local currency advances received (371,706) (184,728)Income receivable on advances granted 27,791 44,783
Liabilities - Other liabilities 1,989,092 1,243,042
Exchange sales pending settlement 1,138,468 696,269Exchange purchases obligations 2,349,244 1,851,551(-) Advances on exchange contract (1,512,988) (1,314,184)Others 14,368 9,406
Memorandum accountsImport credits outstanding 23,803 39,398

23
8 Income and social contribution taxes
a. Income tax and social contribution due on operations for the period are shown below:
03/31/2000 03/31/1999
Net income before income tax and social contribution 549,815 436,096
Taxes payable (income tax and social contribution ) at rates of 25% e 9% (8%in 1999) respectively (*) (186,937) (143,912)
Increases/Decreases in income tax and socialcontribution payable as the result of:
Permanent (inclusions)/exclusions 44,645 (46,720)
Equity share in income of subsidiaries and affiliates 18,045 10,537
Non-deductible expenses and provisions (20,248) (129,837)
Interest on capital 46,848 72,580
Temporary (inclusions)/exclusions (8,348) (97,111)
Allowance for loan losses 19,084 93,561
Labor provisions, tax contingencies and other expenses (27,432) (190,672)
Other adjustments (11,415) (12,250)
Income tax of foreign branches and subsidiaries (11,415) (12,250)
Income tax and social contribution from operations of the year (162,055) (299,993)
Withholding tax on distribution of interest on capital (20,793) (33,053)
Total income tax and social contribution (182,848) (333,046)
(*) Effective until December 31, 2002. Since February 1, 2000, the additionalwas decreased from 4% to 1%

24
b. The composition of accounting adjustments, which refer to temporary additions to deferredincome and social contribution taxes is shown below:
03/31/2000 03/31/1999
Deferred income tax and socialcontribution related to temporary additions 3,864 169,926
Tax credits Constitution over temporary inclusions/exclusions 3,508 97,111 Constitution over tax loss carry 10,537 83,087 Reversal over initial balance of tax loss carry/write-off and others (10,181) (10,272)
c. The balances of tax credits and deferred tax liabilities (income tax and social contribution)as of March 31, 2000 were comprised as follows:
PriorPeriod Changes
Presentperiod
Tax credits:Temporary differences:
Provision for loan losses 544,335 ( 26,379) 517,956Valuations allowance Securities/Interbank Deposits 159,785 20,956 180,741Provisions for interest on capital 116,048 4,590 120,638Provision for tax contingencies 87,131 5,185 92,316Provision for labor contingencies 95,658 8,879 104,537Provision for civil contingencies 35,273 7,686 42,959Real Estate allowances 51,315 (1,025) 50,290Tax losses 201,802 ( 1,582) 200,220Other 237,700 19,315 218,385
Total 1,529,047 ( 1,005) 1,528,042
25
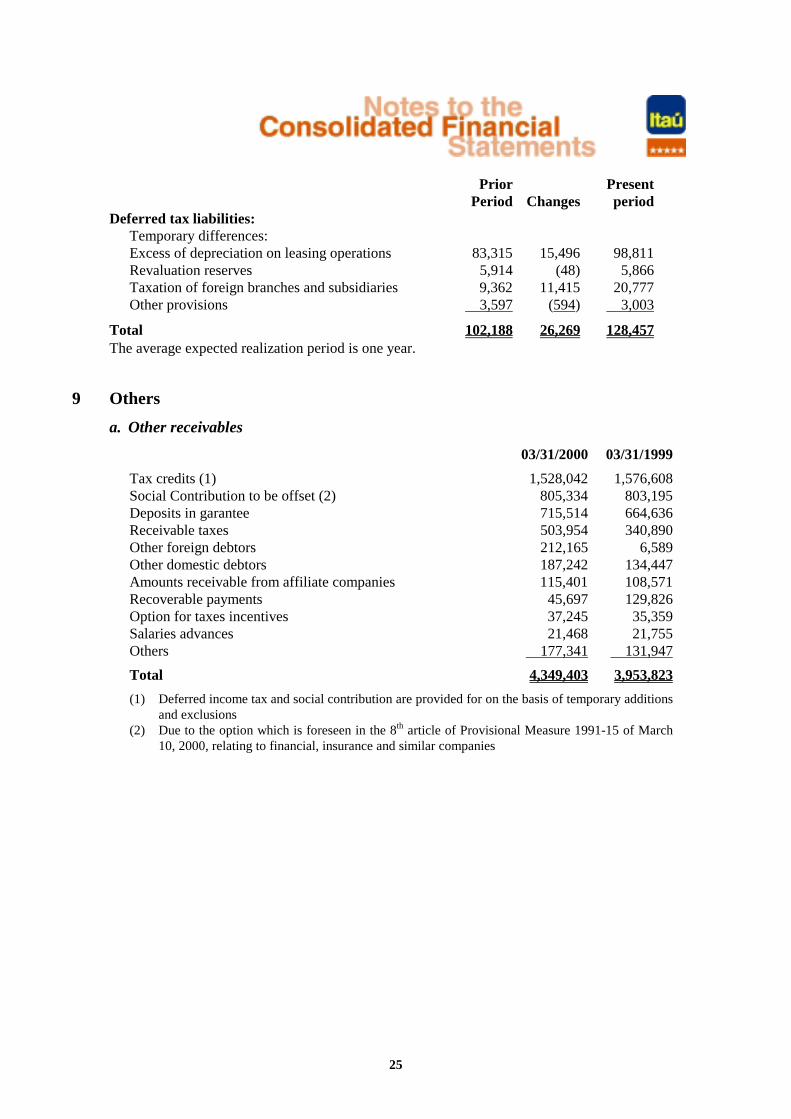
PriorPeriod Changes
Presentperiod
Deferred tax liabilities:Temporary differences:Excess of depreciation on leasing operations 83,315 15,496 98,811Revaluation reserves 5,914 (48) 5,866Taxation of foreign branches and subsidiaries 9,362 11,415 20,777Other provisions 3,597 (594) 3,003
Total 102,188 26,269 128,457The average expected realization period is one year.
9 Others
a. Other receivables
03/31/2000 03/31/1999
Tax credits (1) 1,528,042 1,576,608Social Contribution to be offset (2) 805,334 803,195Deposits in garantee 715,514 664,636Receivable taxes 503,954 340,890Other foreign debtors 212,165 6,589Other domestic debtors 187,242 134,447Amounts receivable from affiliate companies 115,401 108,571Recoverable payments 45,697 129,826Option for taxes incentives 37,245 35,359Salaries advances 21,468 21,755Others 177,341 131,947
Total 4,349,403 3,953,823
(1) Deferred income tax and social contribution are provided for on the basis of temporary additionsand exclusions
(2) Due to the option which is foreseen in the 8th article of Provisional Measure 1991-15 of March10, 2000, relating to financial, insurance and similar companies

26
b. Other liabilities
03/31/2000 03/31/1999
Credit card companies 1,069,260 793,330Provision for contingent liabilities 1,024,589 943,049Provision for labour liabilities 454,892 236,227Other foreign creditors 270,166 218,368Salaries and employee benefits 196,554 255,583Liabilities for official agreement insurance 70,281 121,732Insurance companies 58,210 65,227Provision for payments 43,934 72,944Values to be paid - Affiliate companies 39,837 5,504Others 492,418 776,134
Total 3,720,141 3,488,098
c. Other operating income
03/31/2000 03/31/1999
Income from insurance operations 30,847 21,482Recovery of charges and expenses 11,663 15,035Equity share of subsidiaries and affiliates not originatedfrom earnings 8,118 34,131Reversal of Operational Provisions 5,761 40,115Monetary variation of assets 4,934 1,334Revenues related to real estate loans 1,178 2,485Others 37,285 69,961
Total 99,786 184,543
27
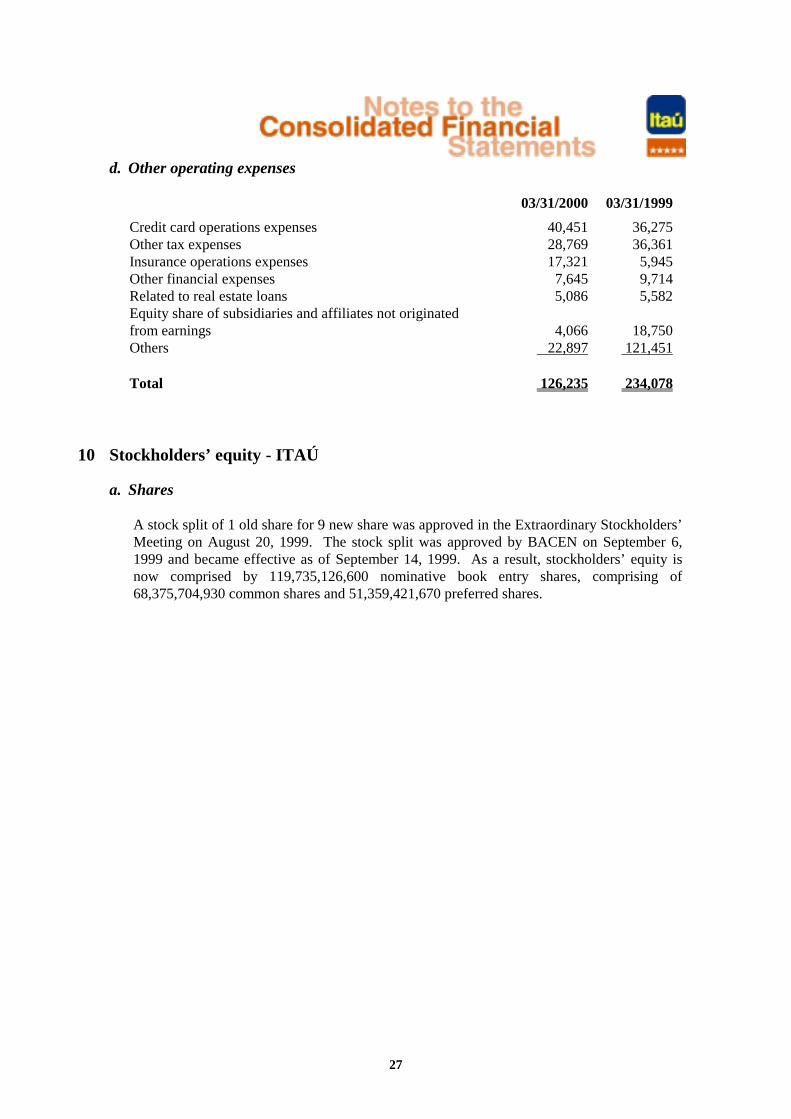
d. Other operating expenses
03/31/2000 03/31/1999
Credit card operations expenses 40,451 36,275Other tax expenses 28,769 36,361Insurance operations expenses 17,321 5,945Other financial expenses 7,645 9,714Related to real estate loans 5,086 5,582Equity share of subsidiaries and affiliates not originatedfrom earnings 4,066 18,750Others 22,897 121,451
Total 126,235 234,078
10 Stockholders’ equity - ITAÚ
a. Shares
A stock split of 1 old share for 9 new share was approved in the Extraordinary Stockholders’Meeting on August 20, 1999. The stock split was approved by BACEN on September 6,1999 and became effective as of September 14, 1999. As a result, stockholders’ equity isnow comprised by 119,735,126,600 nominative book entry shares, comprising of68,375,704,930 common shares and 51,359,421,670 preferred shares.
28
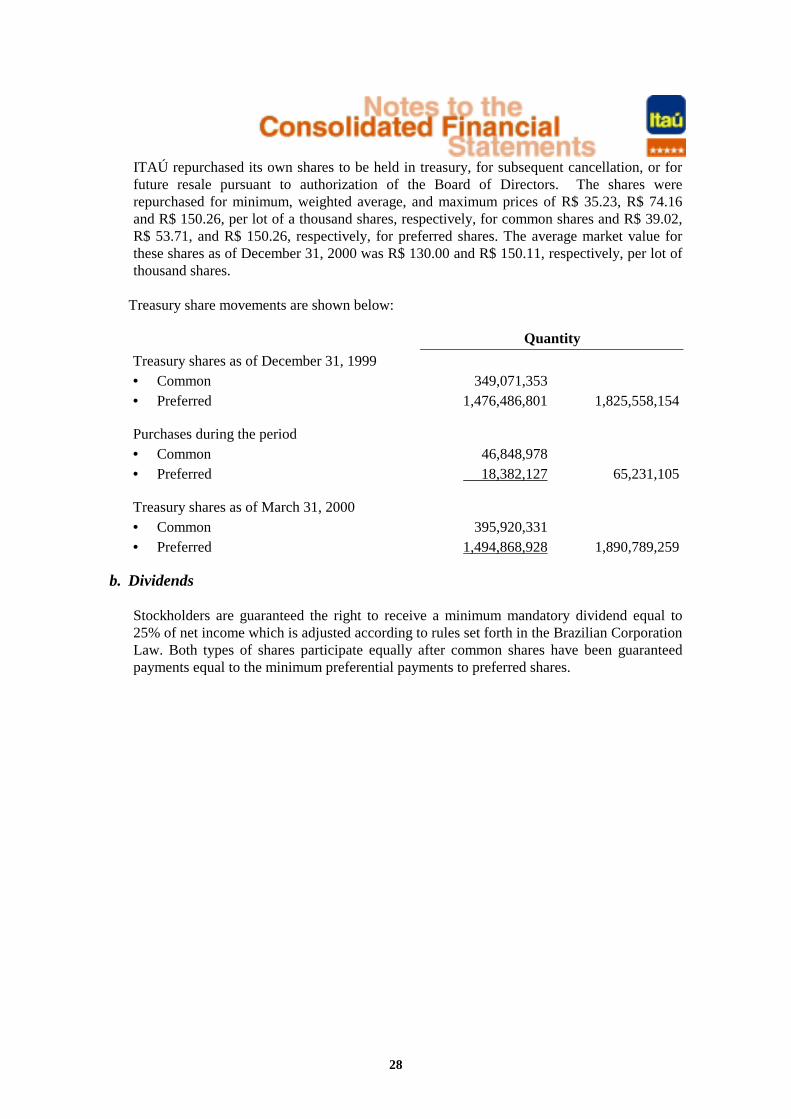
ITAÚ repurchased its own shares to be held in treasury, for subsequent cancellation, or forfuture resale pursuant to authorization of the Board of Directors. The shares wererepurchased for minimum, weighted average, and maximum prices of R$ 35.23, R$ 74.16and R$ 150.26, per lot of a thousand shares, respectively, for common shares and R$ 39.02,R$ 53.71, and R$ 150.26, respectively, for preferred shares. The average market value forthese shares as of December 31, 2000 was R$ 130.00 and R$ 150.11, respectively, per lot ofthousand shares.
Treasury share movements are shown below:
Quantity
Treasury shares as of December 31, 1999• Common 349,071,353• Preferred 1,476,486,801 1,825,558,154
Purchases during the period• Common 46,848,978• Preferred 18,382,127 65,231,105
Treasury shares as of March 31, 2000• Common 395,920,331• Preferred 1,494,868,928 1,890,789,259
b. Dividends
Stockholders are guaranteed the right to receive a minimum mandatory dividend equal to25% of net income which is adjusted according to rules set forth in the Brazilian CorporationLaw. Both types of shares participate equally after common shares have been guaranteedpayments equal to the minimum preferential payments to preferred shares.

29
In 1997, the system of monthly advances against the minimum mandatory dividend wassubstituted by a monthly advance against the payment of interest on capital. As of June 1,1999, the amount of the advance was raised to R$ 0.75 (seventy-five cents) per thousandshare lot. Due to 900% share split, deliberated on the Extraordinary Stockholder’s Generalmeeting of August 20, 1999, the antecipation changed to R$ 0.075 per thousand share lot.
11 Related parties
Transactions between related parties were entered into for amounts and terms in accordance withnormal market practices and terms as well as under reciprocal conditions. Transactions withconsolidated companies consolidated were eliminated from the consolidated financialstatements. Other operations with companies not included in the consolidation were immaterial.
12 Financial instruments
a. Derivatives
In relation to transactions involving derivatives, ITAÚ has sough to meet the principal needsof its Corporate customers to manage market risks, resulting mainly, from fluctuations in theinterest and exchange rates, an has developed an internal control systems to monitor theserisks in an appropriate manner.
ITAÚ’s policy is to minimize market risks resulting from derivative operations. As such, theBank avoids taking positions which are subject to fluctuations due to market factors and onlyemploys instruments that permit risk control, which is the responsibility of an independentarea within ITAÚ.

30
Most derivative contracts negotiated with customers are swap and future operations, whichare all registered at the BM&F or CETIP, and involve pre-fixed rates, interbank depositsrates, exchange variations or price indices. BM&F futures contracts involving interbankrates, and U.S. dollars are principally used to hedge financing operation offered to customerswith maturities or in currencies which are mismatched with the resources used to fund theseoperations.
The notional values for these financial instruments are recorded in memorandum accounts,and the adjustments/premiums are recorded in balance sheet accounts.

31
The amounts related to positions in future, swap and options operations were as follows:
Memorandum account notional valueBalance sheet account amount
receivable/received (payable/paid)
03/31/2000 03/31/1999 03/31/2000 03/31/1999
Future contracts 6,953,822 4,802,034 12,567 13,125
Purchase commitments: 3,421,765 2,026,491 (2,737) (4,723) Foreign currency 456,075 322,864 (1,133) (3,840) Interbank market 2,716,909 - (18) - Indices 243,474 1,702,382 (1,562) (865) Others 5,307 1,245 (24) (18)
Commitments to sell: 3,532,057 2,775,543 15,304 17,848
Foreign currency 1,658,012 1,151,325 7,070 2,535 Interbank market 581,549 - 79 - Indices 1,040,893 1,623,686 5,640 15,306 Shares 246,432 - 2,480 - Others 5,171 532 35 7
Swap contracts 124,684 (150,690)
Assets position: 8,014,411 11,192,120 192,599 285,402
Foreign currency 597,718 442,436 623 70,457 Interbank market 3,435,029 4,053,259 98,745 150,525 Prefixed 3,550,918 5,695,526 68,466 48,073 Indices 32,454 25,863 - - Others 398,292 975,036 24,765 16,347
Liability position: 7,889,727 11,342,810 (67,915) (436,092)
Foreign currency 2,279,858 2,474,745 (4,272) (242,301) Interbank market 3,682,302 5,893,421 (27,271) (183,769) Prefixed 1,513,485 2,067,691 (27,532) (7,421) Indices 193,680 66,155 (8,135) (1,684) Others 220,402 840,798 (705) (917)
32
Memorandum account notional valueBalance sheet account amount
receivable/received (payable/paid)
03/31/2000 03/31/1999 03/31/2000 03/31/1999
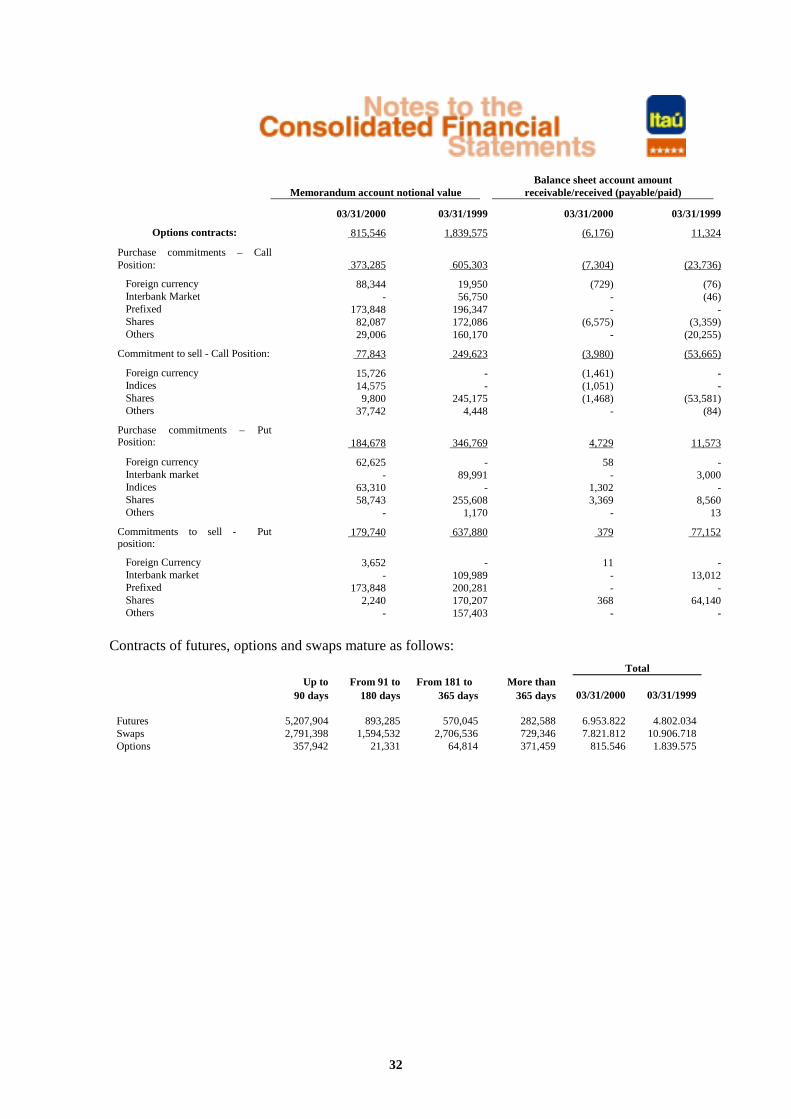
Options contracts: 815,546 1,839,575 (6,176) 11,324
Purchase commitments – CallPosition: 373,285 605,303 (7,304) (23,736)
Foreign currency 88,344 19,950 (729) (76) Interbank Market - 56,750 - (46) Prefixed 173,848 196,347 - - Shares 82,087 172,086 (6,575) (3,359) Others 29,006 160,170 - (20,255)
Commitment to sell - Call Position: 77,843 249,623 (3,980) (53,665)
Foreign currency 15,726 - (1,461) - Indices 14,575 - (1,051) - Shares 9,800 245,175 (1,468) (53,581) Others 37,742 4,448 - (84)
Purchase commitments – PutPosition: 184,678 346,769 4,729 11,573
Foreign currency 62,625 - 58 - Interbank market - 89,991 - 3,000 Indices 63,310 - 1,302 - Shares 58,743 255,608 3,369 8,560 Others - 1,170 - 13
Commitments to sell - Putposition:
179,740 637,880 379 77,152
Foreign Currency 3,652 - 11 - Interbank market - 109,989 - 13,012 Prefixed 173,848 200,281 - - Shares 2,240 170,207 368 64,140 Others - 157,403 - -
Contracts of futures, options and swaps mature as follows:
TotalUp to From 91 to From 181 to More than
90 days 180 days 365 days 365 days 03/31/2000 03/31/1999
Futures 5,207,904 893,285 570,045 282,588 6.953.822 4.802.034Swaps 2,791,398 1,594,532 2,706,536 729,346 7.821.812 10.906.718Options 357,942 21,331 64,814 371,459 815.546 1.839.575

33
b. Market value
The financial statements were prepared based on the assumption of normal continuity in theoperations of ITAÚ and its subsidiaries.
The recorded values of each financial instrument whether included or not in the balancesheet, when compared with the values that might be obtained in an active market, or in theabsence of such markets, using the net present value of adjusted discounted future cash flowsbased on the prevailing market interest rate, are close to the corresponding market value, orits value is not available, except for the amounts included:
Recorded value Market valueUnrealized
Gain / (Loss)
03/31/2000 03/31/1999 03/31/2000 03/31/1999 03/31/2000 03/31/199
9
Interbank deposits: 1,756,560 2,551,234 1,778,179 2,565,289 21,619 14.055
Securities and derivatives: 15,950,382 13,554,154 16,899,964 14,082,599 949,582 528,445
Securities – BACEN’s Circular2,913/99 228,577 - 232,853 - 4,276 -- NTN - D 184,216 - 188,492 - 4,276 -- NBC - E 44,361 - 44,361 - - -Other securities 15,601,987 13,693,153 16,508,566 14,270,013 906,579 576,860Derivatives-differential receivable/payable 119,818 (138,999) 158,545 (187,414) 38,727 ( 48,415)
Loan operations 13,895,649 12,641,204 13,913,562 12,635,615 17,913 ( 5,589)
Participation in BPI 142,443 87,651 455,043 414,734 312,600 327,083
Other investments 277,708 264,463 279,940 264,346 2,232 ( 117)
Time and interbank deposits and Debentures 6,432,400 8,013,951 6,291,073 7,768,372 141,327 245,579
Treasury shares 110,713 101,966 275,864 162,396 165,151 60,430
Total Unrealized Gain / (Loss) 1,610,424 1.169.886
(*) Includes unrealized gains (losses) relating to minority interests amounting to R$ 148,934,(R$ 246,546 at March 31, 1999).

34
To obtain the market values for these Financial Instruments, the following criteria were adopted:
• Interbank deposits, certificates of bank deposit and mortgage securities, the latter twoincluded in “Securities” were determined on the basis of their nominal values, monetarilycorrected to maturity and discounted to present value using interest futures market rates, 367-day swap market rates for pre-fixed securities, and fixed interest securities market rates forpost-fixed securities published in the Gazeta Mercantil on April 3, 2000;
• Public securities, included in “Securities” were determined on the basis of actual tradesregistered with BACEN/DICEL/SELIC (Special System for Settlement and Custody), inaccordance with lists held by ANDIMA (the National Association of Open MarketInstitutions);
• Investment fund quotas included in “Securities” were determined on the basis of net valueper quota on the balance sheet date;
• Publicly traded shares when included in “Securities” were valued using the average pricequota of the last trading day of the month if available, or on the basis of the most recentquotations for the companies’ shares published in the daily bulletin of each Stock Exchange;
• Loans with maturities of over 90 days were calculated on the basis of their net present value,determined by means of future cash flows discounted using market interest rates on thebalance sheet date, when available; the effects of hedges (swap contracts) are also taken intoaccount;
• Other investments and equity shares in foreign subsidiaries and affiliates are determined onthe basis of stock market quotations, book value per share and auction quotation;
• Time and interbank deposits and debentures, when available, were calculated on the basis oftheir present value, determined by means of future cash flows discounted using interestfutures market rates, 367-day swap market for pre-fixed securities, and fixed incomesecurities market rates for post-fixed securities published in the Gazeta Mercantil on April 3,2000; the effects of hedges (swap contracts) are also taken into account.
35
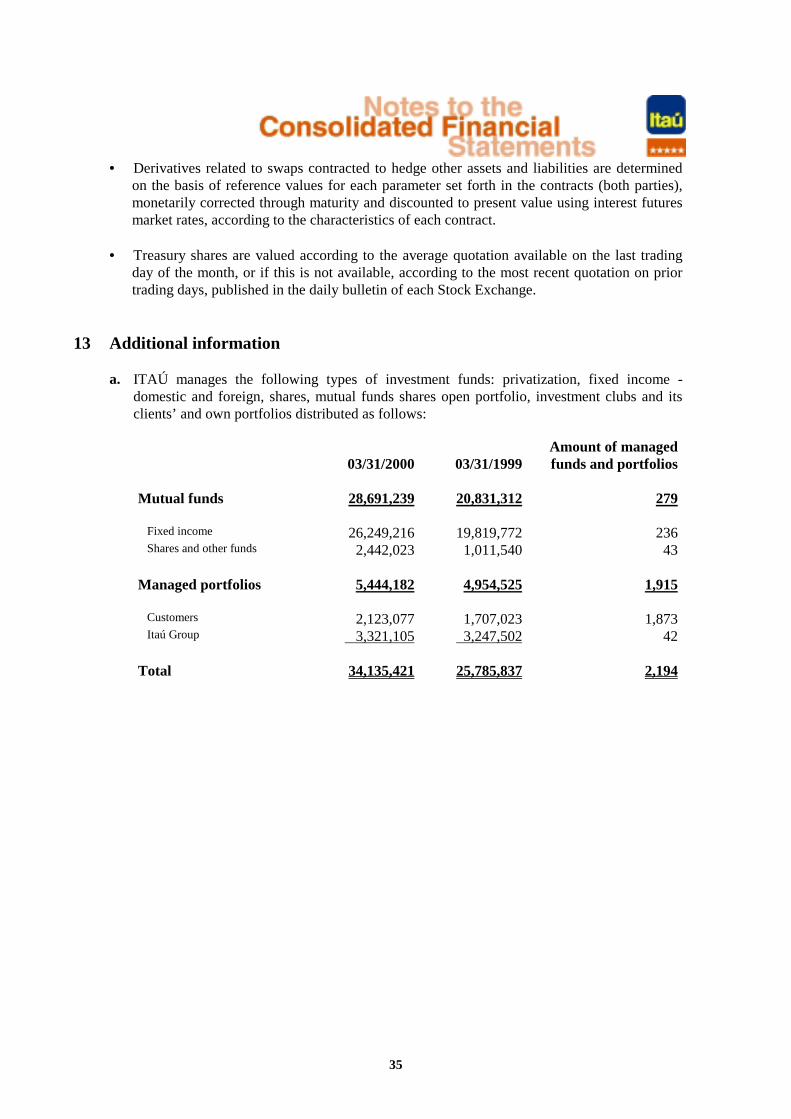
• Derivatives related to swaps contracted to hedge other assets and liabilities are determinedon the basis of reference values for each parameter set forth in the contracts (both parties),monetarily corrected through maturity and discounted to present value using interest futuresmarket rates, according to the characteristics of each contract.
• Treasury shares are valued according to the average quotation available on the last tradingday of the month, or if this is not available, according to the most recent quotation on priortrading days, published in the daily bulletin of each Stock Exchange.
13 Additional information
a. ITAÚ manages the following types of investment funds: privatization, fixed income -domestic and foreign, shares, mutual funds shares open portfolio, investment clubs and itsclients’ and own portfolios distributed as follows:
03/31/2000 03/31/1999Amount of managedfunds and portfolios
Mutual funds 28,691,239 20,831,312 279
Fixed income 26,249,216 19,819,772 236 Shares and other funds 2,442,023 1,011,540 43
Managed portfolios 5,444,182 4,954,525 1,915
Customers 2,123,077 1,707,023 1,873 Itaú Group 3,321,105 3,247,502 42
Total 34,135,421 25,785,837 2,194

36
b. The balances vinculated to foreign currency were:
In thousand of reais
03/31/2000 03/31/1999
Foreign investments 2,625,548 2,260,673Net value of assets and liabilities indexed in foreigncurrency including derivatives 13,846 331,352
Net foreign exchange position 2,639,394 2,592,025
c. ITAÚ and its subsidiaries sponsor complementary pension plans managed by FundaçãoItaubanco and Fundação Bemge de Seguridade Social - FASBEMGE (closed private pensionfunds), for the purpose of granting lifetime income (in the case of FASBEMGE also for thepurpose of death benefits) to complement the retirement pension paid by social security.The contributions amounted to R$ 14.854 (R$ 9.145 in March 31, 1999). The actuarialliabilities are calculated in accordance with the actuarial models established in the plans’Technical Notes, which call for compound capitalization and defined benefits, and are fullycovered by the technical provisions for expired and unexpired risks. The contribution rateincreases in accordance with the participant’s salary.
d. ITAÚ has established an Employee Stock Options Plan to provide an incentive forexecutives to focus on the future success of Itaú over the medium and long terms timehorizons. As of March 31, 2000 ITAÚ has granted 3.021.800.000 preferred shares. Thesestock options may be exercised as follows: 282,000,000 as of January 1, 1998, 597,000,000shares as of January 1, 1999, 533,000,000 shares as of January 1, 2002 and 578,500,000shares as of January 1, 2003 and 498,100,000 shares as of January 1, 2004 and 533,200,000shares as of January 1, 2005. Up to March 31, 2000, 835,952,060 shares have beenexercised.
e. During the first quarter of 2000, R$ 380,123 (R$ 798,318 in March 31, 1999) were collectedand provisioned in ITAÚ CONSOLIDATED related to taxes and contributions of income,revenues and salaries. Moreover, taxes on financial intermediation were collected fromclients in the amount of R$ 762,582 (R$ 513,557 in March 31, 1999) in ITAÚCONSOLIDATED.
37
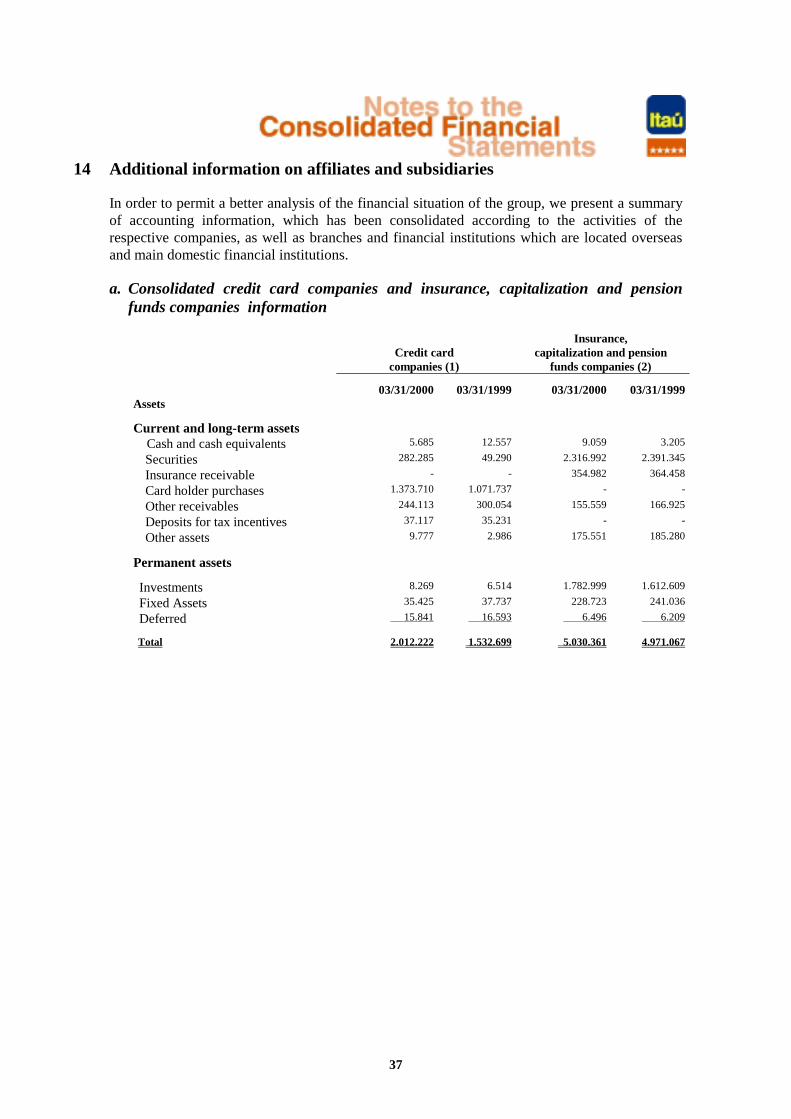
14 Additional information on affiliates and subsidiaries
In order to permit a better analysis of the financial situation of the group, we present a summaryof accounting information, which has been consolidated according to the activities of therespective companies, as well as branches and financial institutions which are located overseasand main domestic financial institutions.
a. Consolidated credit card companies and insurance, capitalization and pensionfunds companies information
Insurance,Credit card capitalization and pension
companies (1) funds companies (2)
03/31/2000 03/31/1999 03/31/2000 03/31/1999Assets
Current and long-term assets Cash and cash equivalents 5.685 12.557 9.059 3.205
Securities 282.285 49.290 2.316.992 2.391.345
Insurance receivable - - 354.982 364.458
Card holder purchases 1.373.710 1.071.737 - -
Other receivables 244.113 300.054 155.559 166.925
Deposits for tax incentives 37.117 35.231 - -
Other assets 9.777 2.986 175.551 185.280
Permanent assets
Investments 8.269 6.514 1.782.999 1.612.609
Fixed Assets 35.425 37.737 228.723 241.036
Deferred 15.841 16.593 6.496 6.209
Total 2.012.222 1.532.699 5.030.361 4.971.067

38
Liabilities
Current and long-term liabilities
Technical provisions - Vinculated - - 332.158 250.652
Insurance operations payable - - 68.233 46.576
Borrowings 124.782 159.234 - -
Taxes and social security contributions 33.623 28.191 117.938 213.596
Payable amounts - Stores 737.764 500.492 - -
Banking Financing - Card holders 536.297 481.459 - -
Credit Card - Annuity revenues 82.398 75.682 - -
Other liabilities 157.856 141.161 106.703 179.463
Technical provisions - Not vinculated - - 1.904.201 1.750.178
Minority interest in consolidated subsidiaries - - 1.199 17.283
Stockholders’ equityCapital and reserves 267.346 102.765 2.438.934 2.289.507
Income for the period 72.156 43.715 60.995 223.812
Total 2.012.222 1.532.699 5.030.361 4.971.067
(1) Includes Banerjcard Administradora de Cartões de Crédito Ltda., BFB Administradorade Cartões de Crédito e Serviços Ltda., Itaucard Administradora de Cartões de Crédito eImobilária Ltda., Bemge Administradora de Cartões de Crédito Ltda. and proportionally,Credicard Comercial e Importadora Ltda., Credicard S.A. Administradora de Cartões deCrédito, and Redecard S.A.
(2) Includes Banerj Seguros S.A., Itaú Capitalização S.A., Itaú Previdência e Seguros S.A.and Itaú Seguros S.A., Bemge Seguradora S.A. and Investprev Seguros e PrevidênciaS.A. (proportionally consolidated) - Companies regulated by the Insurance CompanyRegulatory Agency (SUSEP).

(In thousands of reais)
b. Foreign branches/financial institutions
Banco Itaú Europa S.A. consolidated (3)
Banco Itaú Europa Luxembourg S.A. Consolidated (4) Itau Bank, Ltd. Other Non- Financial (5) Foreign Consolidated (6)
03/31/2000 03/31/1999 03/31/2000 03/31/1999 03/31/2000 03/31/1999 03/31/2000 03/31/1999 03/31/2000 03/31/1999 03/31/2000 03/31/1999 03/31/2000 03/31/1999 03/31/2000 03/31/1999Assets
Current and long-term assets:Cash and cash equivalents 19,435 9,932 179,515 233,224 13,734 7,356 13,106 1 488 5,580 2,057 8,883 2,975 1,508 229,766 266,276 Interbank funds applied 57,073 795,206 87,622 234,832 650,018 748,335 - 59,865 - 328,497 55 19,317 - 148,934 794,768 1,931,239 Money market 57,073 125,634 87,622 51,660 - - - 52,881 - 108,567 - - - - 144,695 230,175 Interbank deposits - 669,572 - 183,172 650,018 748,335 - 6,984 - 219,930 55 19,317 - 148,934 650,073 1,701,064 Securities 3,543,271 1,266,956 256,041 164,017 496,624 342,750 161,306 - 580,957 363,297 50,228 16,778 87,650 24,532 4,934,735 2,126,137 - Brazil 1,900,115 1,150,613 118,321 - 70,355 36,995 5,332 - 407,903 177,591 39,389 16,757 28,602 24,190 2,570,017 1,406,146 - Federal government 806,953 365,783 - - - 14,615 - - 214,398 167,807 - - 2,641 - 1,023,992 548,205 - Financial institutions 1,093,162 784,830 118,321 - 70,355 22,380 5,332 - 193,505 9,784 39,389 16,757 25,961 24,190 1,546,025 857,941 - Others 1,643,156 116,343 137,720 164,017 426,269 305,755 155,974 - 173,054 185,706 10,839 21 59,048 342 2,364,718 719,991 Interbank and interbranch accounts - 5 1,741 - - - - - - - 886 - - - 2,627 5 Loans and leasing 2,019,146 2,062,112 597,892 608,167 857,655 500,808 50,460 51,829 188,842 252,913 21,867 - 1,554 14,720 3,709,947 3,471,667 Foreign trading loans 1,090,854 2,060,286 82,087 - 532,084 497,863 216 1,363 181,955 126,742 - - 540 13,721 1,887,736 2,875,130 Others 928,292 1,826 515,805 608,167 325,571 2,945 50,244 50,466 6,887 126,171 21,867 - 1,014 999 1,822,211 596,537 Prepaid expenses 25,853 2,652 2,351 1,533 315 30,377 118 220 356 - - - 47 240 28,677 34,940 Other assets 106,460 64,519 73,582 21,184 11,729 2,705 3,804 45 54,312 18,457 - - 401,116 356,435 642,767 463,346
Permanent assets:Investments - - 175 172 51 - 1,625 - - - - 874 735,764 407,781 144,006 88,526 Fixed Assets 805 961 116,841 118,478 3,834 4,341 648 711 78 91 111 70 523 396 122,840 125,044 Deferred 151 309 13,726 17,776 355 - 322 417 31 21 15 17 151 - 14,864 18,540
Total 5,772,194 4,202,652 1,329,486 1,399,383 2,034,315 1,636,672 231,389 113,088 825,064 968,856 75,219 45,939 1,229,780 954,546 10,624,997 8,525,720
LiabilitiesCurrent and long-term liabilities
Deposits 407,931 67,994 860,076 800,421 1,570,129 13,607 186,146 88,541 152,415 163,549 20,556 - 22,815 - 3,085,454 998,484 Demand deposits 14,881 6,093 106,990 94,860 1,674 811 93,035 53,950 38,421 35 1,942 - - - 217,200 155,505 Savings deposits - - 301,210 283,036 - - - - - - - - - - 301,210 283,036 Interbank deposits - - - 43,262 - - - - - - - - - - - 43,262 Times deposits 393,050 61,901 451,876 379,263 1,568,455 12,796 93,111 34,591 113,994 163,514 18,614 - 22,815 - 2,567,044 516,681 Money market 647,322 393,862 - - 4,833 1,398,418 - - 259,511 253,532 2,835 - - 27,885 914,501 1,766,683 Acceptances and debentures 1,279,424 918,858 - - 39,872 - - - - - - - 537 7,208 1,277,138 926,066 Borrowings 1,898,218 1,509,904 83,216 99,570 3,692 - - - 43,871 92,522 - - 124,117 17,388 2,128,011 1,701,044 Other liabilities 183,053 159,745 128,604 191,233 110,791 31,705 7,070 2,722 31 127,954 14 1,430 103,125 143,248 477,899 816,345
Deferred income 39,211 9,520 - - 542 - - - 5,589 10,061 - - 1,630 845 46,783 20,426
Minority Interest in consolidated subsdiaries - - - - - - 1 - - - - - - - 69,663 35,999
Stockholders’ equity Capital and reserves 1,307,746 1,117,428 271,795 313,914 299,442 188,678 36,191 21,201 352,755 313,471 50,742 43,686 958,198 737,918 2,596,743 2,214,197 Income for the period 9,289 25,341 (14,205) (5,755) 5,014 4,264 1,981 624 10,892 7,767 1,072 823 19,358 20,054 28,805 46,476
Total 5,772,194 4,202,652 1,329,486 1,399,383 2,034,315 1,636,672 231,389 113,088 825,064 968,856 75,219 45,939 1,229,780 954,546 10,624,997 8,525,720
(1) Includes Grand Cayman and New York Branches(2) New name of Banco Itaú Argentina S.A., after incorporation of Banco del Buen Ayre S.A.(3) Banco Itaú Europa, S.A., BIE - Bank & Trust, Ltd., Itaú Europa, SGPS, S.A.(4) Banco Itaú Europa Luxembourg S.A., BIE - Fund Management Company, S.A., BIEL Holding AG
(6) The foreign consolidated information are presented net of the elimination.
Foreign branches (1) Banco Itaú Buen Ayre S.A. (2)IFE - Banco do Estado Minas
Gerais S.A. (Uruguay)
(5) Afinco - Americas Madeira, SGPS Ltda., Banctec Informática S.A., BFB Overseas Inc., BFB Overseas Cayman, Ltd., Externalizacion Global S.A., Inversora del Buen Ayre S.A., Itaú Europa, SGPS, S.A., Itaú Sociedad Gerente de Fondos Comunes de Inversion S.A., Itaúsa Portugal - SGPS, S.A., ITH Zux Cayman Company Ltd., Itaú Leasing de Chile Ltda., Zux Cayman Company Ltd., Zux SGPS, S.A., BIEL Holding AG, IPI Ita[usa Portugal Invest. Ltda.
39

40
c. Main financial institutions in the country
BANERJ (1) BEMGE (2)
03/31/2000 03/31/1999 03/31/2000 03/31/1999AssetsCurrent and long-term assets Cash and cash equivalents 234,451 240,191 50,196 35,151
Interbank funds applied 2,069,656 2,420,665 796,761 4,142,038
Securities 481,186 584,394 4,453,125 1,965,949
Interbank accounts 431,934 492,275 149,792 167,831
Interbranch accounts 1,758 - 23 460
Loan and leasing operations 825,829 433,802 2,316,290 127,774
Other receivables 294,519 210,424 1,959,305 626,682
Other assets 7,275 20,253 184,183 8,127
Permanent assets Investments 8,899 9,278 309,331 7,900
Fixed assets 145,661 131,268 859,335 71,611
Deferred expenses 131,309 137,923 93,731 5,370
Total 4,632,477 4,680,473 11,172,072 7,158,893
LiabilitiesCurrent and long-term liabilities Deposits 2,765,124 3,621,109 3,376,347 1,396,834
Money market repurchase commitments 510,148 1,879 127,603 67,083
Acceptance and endorsements - - 484,324 -
Interbank accounts 136,957 56,642 38,318 84,453
Interbranch accounts 5,106 10,210 1,107 3,358
Borrowings 95,573 24,164 223,119 13,032
On-lending borrowings from public Institutions 808 935 2,748 9,244
Technical provisions for insurance operations – Vinculated - 19,865 331,980 8,906
Other liabilities 406,020 443,543 2,398,200 4,070,481
41
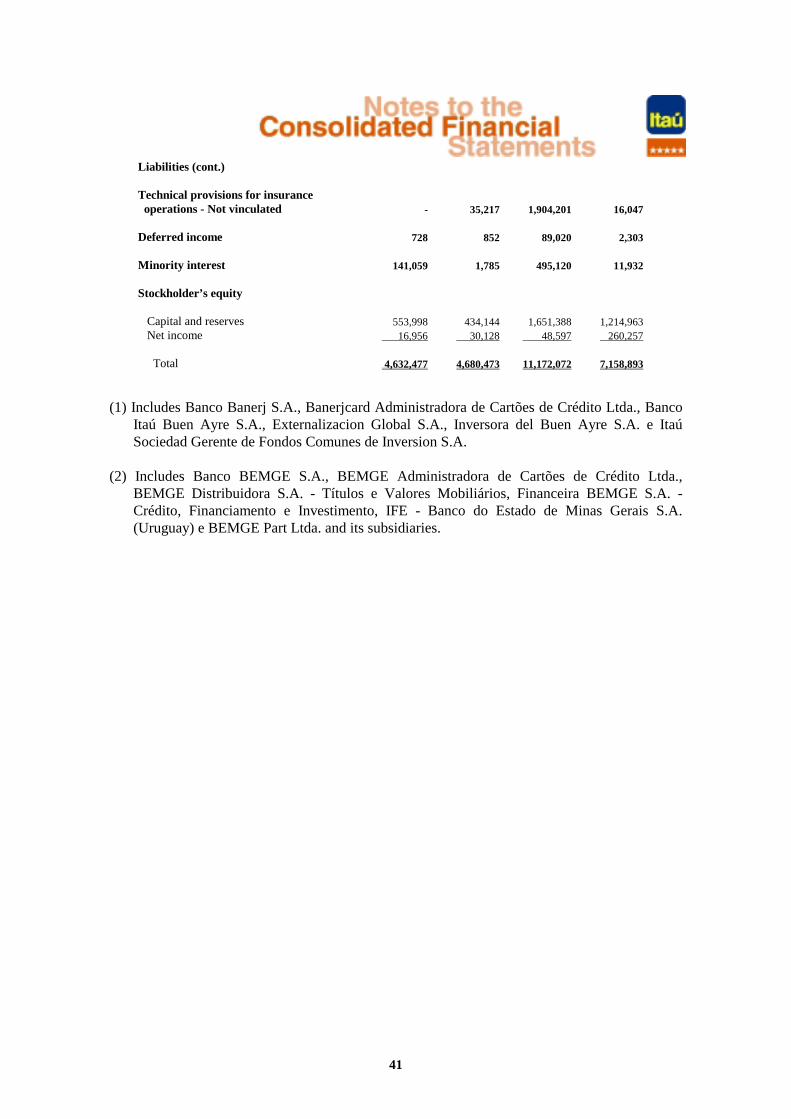
Liabilities (cont.)
Technical provisions for insurance operations - Not vinculated - 35,217 1,904,201 16,047
Deferred income 728 852 89,020 2,303
Minority interest 141,059 1,785 495,120 11,932
Stockholder’s equity
Capital and reserves 553,998 434,144 1,651,388 1,214,963 Net income 16,956 30,128 48,597 260,257
Total 4,632,477 4,680,473 11,172,072 7,158,893
(1) Includes Banco Banerj S.A., Banerjcard Administradora de Cartões de Crédito Ltda., BancoItaú Buen Ayre S.A., Externalizacion Global S.A., Inversora del Buen Ayre S.A. e ItaúSociedad Gerente de Fondos Comunes de Inversion S.A.
(2) Includes Banco BEMGE S.A., BEMGE Administradora de Cartões de Crédito Ltda.,BEMGE Distribuidora S.A. - Títulos e Valores Mobiliários, Financeira BEMGE S.A. -Crédito, Financiamento e Investimento, IFE - Banco do Estado de Minas Gerais S.A.(Uruguay) e BEMGE Part Ltda. and its subsidiaries.
42
The Administrative Council and StockholdersBanco Itaú S.A.São Paulo -SP
We have performed a special review of the interim consolidated report of Banco Itaú S.A. andits subsidiaries for the three-month period ended March 31, 2000, comprising the consolidatedbalance sheet, the consolidated statement of income, the performance report and relevantdisclosures, which were prepared in accordance with the accounting practices derived fromBrazilian Corporation Law.
Our review was performed in conformity with the specific norms establish by the BrazilianInstitute of Accountants (IBRACON), jointly with the Federal Accounting Council, andconsisted principally of: (a) inquiries and discussions with management responsible for theaccounting, financial and operational areas of the Bank and its subsidiaries, regarding theprincipal criteria adopted in the preparation of the interim reports; and; (b) review ofinformation and subsequent events that have or may have a relevant effect on the financialsituation and the operations of Banco Itaú S.A. and its subsidiaries.
On the basis of our review we are not aware of any significant modifications that should bemade to the aforementioned interim consolidated report for it to be in conformity withaccounting practices derived from Brazilian Corporation Law, applied in accordance with rulesof the Brazilian Securities Commission specifically applicable to the preparation of interimreports.
May 8, 2000
KPMG Auditores IndependentesCRC 2SP014428/O-6
José Marcelo Bessan Alberto Spilborghs NetoAccountant CRC 1SP129705/O-0 Accountant CRC1SP167455/O-0

Banco Itaú S.A.Consolidated
Management ‘s Discussion & AnalysisFirst Quarter of 2000
20002000
44
Consolidated
Highlights
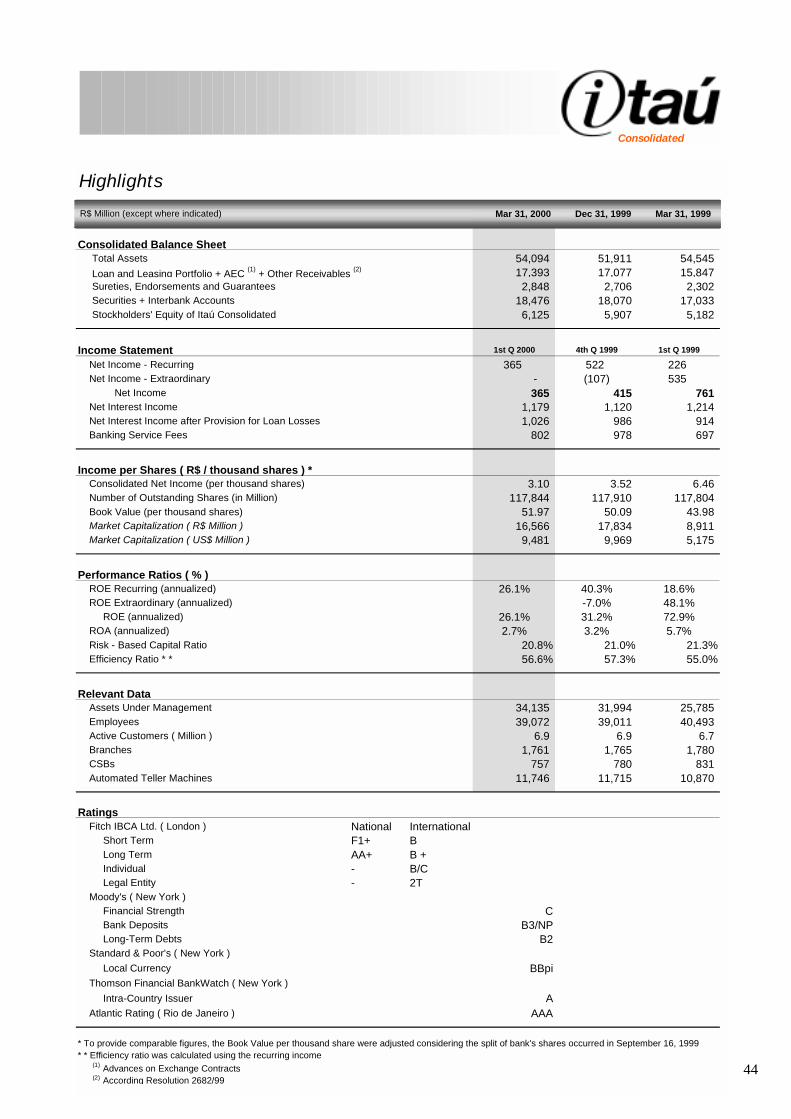
Consolidated Balance Sheet Total Assets 54,094 51,911 54,545 Loan and Leasing Portfolio + AEC
(1) + Other Receivables
(2) 17,393 17,077 15,847 Sureties, Endorsements and Guarantees 2,848 2,706 2,302 Securities + Interbank Accounts 18,476 18,070 17,033 Stockholders' Equity of Itaú Consolidated 6,125 5,907 5,182
Income Statement 1st Q 2000 4th Q 1999 1st Q 1999
Net Income - Recurring 365 522 226 Net Income - Extraordinary - (107) 535
Net Income 365 415 761 Net Interest Income 1,179 1,120 1,214 Net Interest Income after Provision for Loan Losses 1,026 986 914 Banking Service Fees 802 978 697
Income per Shares ( R$ / thousand shares ) * Consolidated Net Income (per thousand shares) 3.10 3.52 6.46 Number of Outstanding Shares (in Million) 117,844 117,910 117,804 Book Value (per thousand shares) 51.97 50.09 43.98 Market Capitalization ( R$ Million ) 16,566 17,834 8,911 Market Capitalization ( US$ Million ) 9,481 9,969 5,175
Performance Ratios ( % ) ROE Recurring (annualized) 26.1% 40.3% 18.6% ROE Extraordinary (annualized) -7.0% 48.1%
ROE (annualized) 26.1% 31.2% 72.9% ROA (annualized) 2.7% 3.2% 5.7% Risk - Based Capital Ratio 20.8% 21.0% 21.3% Efficiency Ratio * * 56.6% 57.3% 55.0%
Relevant Data Assets Under Management 34,135 31,994 25,785 Employees 39,072 39,011 40,493 Active Customers ( Million ) 6.9 6.9 6.7 Branches 1,761 1,765 1,780 CSBs 757 780 831 Automated Teller Machines 11,746 11,715 10,870
R$ Million (except where indicated)
Ratings Fitch IBCA Ltd. ( London ) National International
Short Term F1+ BLong Term AA+ B +Individual - B/CLegal Entity - 2T
Moody's ( New York )Financial Strength CBank Deposits B3/NPLong-Term Debts B2
Standard & Poor's ( New York )
Local Currency BBpi Thomson Financial BankWatch ( New York )
Intra-Country Issuer A Atlantic Rating ( Rio de Janeiro ) AAA
* To provide comparable figures, the Book Value per thousand share were adjusted considering the split of bank's shares occurred in September 16, 1999* * Efficiency ratio was calculated using the recurring income
(1) Advances on Exchange Contracts(2) According Resolution 2682/99
Mar 31, 2000 Dec 31, 1999 Mar 31, 1999
45
Consolidated
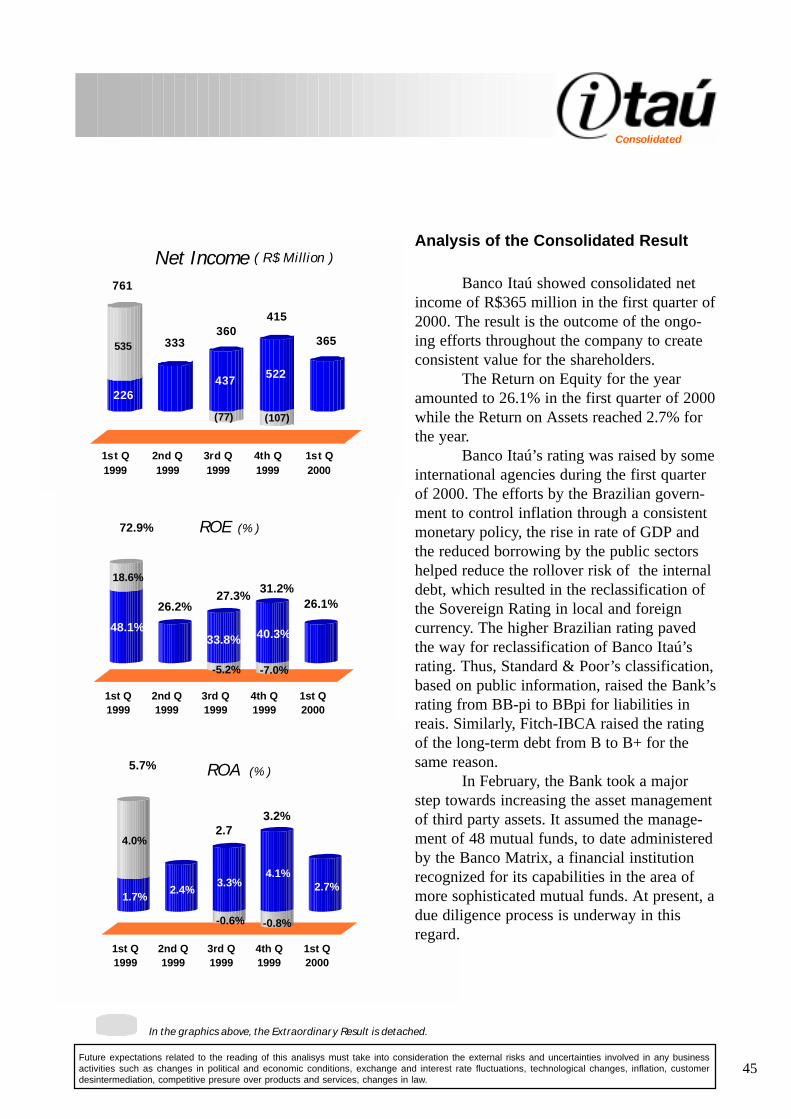
1.7%
4.0%
2.4%3.3%
-0.6%
4.1%
-0.8%
2.7%
1st Q1999
2nd Q1999
3rd Q1999
4th Q1999
1st Q2000
ROA (% )
3.2%2.7
5.7%
In the graphics above, the Extraordinary Result is detached.
226
535 333
437
(77)
522
(107)
365
1st Q1999
2nd Q1999
3rd Q1999
4th Q1999
1st Q2000
Net Income ( R$ Million )
415360
761
Future expectations related to the reading of this analisys must take into consideration the external risks and uncertainties involved in any businessactivities such as changes in political and economic conditions, exchange and interest rate fluctuations, technological changes, inflation, customerdesintermediation, competitive presure over products and services, changes in law.
Analysis of the Consolidated Result
Banco Itaú showed consolidated netincome of R$365 million in the first quarter of2000. The result is the outcome of the ongo-ing efforts throughout the company to createconsistent value for the shareholders.
The Return on Equity for the yearamounted to 26.1% in the first quarter of 2000while the Return on Assets reached 2.7% forthe year.
Banco Itaú’s rating was raised by someinternational agencies during the first quarterof 2000. The efforts by the Brazilian govern-ment to control inflation through a consistentmonetary policy, the rise in rate of GDP andthe reduced borrowing by the public sectorshelped reduce the rollover risk of the internaldebt, which resulted in the reclassification ofthe Sovereign Rating in local and foreigncurrency. The higher Brazilian rating pavedthe way for reclassification of Banco Itaú’srating. Thus, Standard & Poor’s classification,based on public information, raised the Bank’srating from BB-pi to BBpi for liabilities inreais. Similarly, Fitch-IBCA raised the ratingof the long-term debt from B to B+ for thesame reason.
In February, the Bank took a majorstep towards increasing the asset managementof third party assets. It assumed the manage-ment of 48 mutual funds, to date administeredby the Banco Matrix, a financial institutionrecognized for its capabilities in the area ofmore sophisticated mutual funds. At present, adue diligence process is underway in thisregard.
48.1%
18.6%
26.2%
33.8%
-5.2%
40.3%
-7.0%
26.1%
1st Q1999
2nd Q1999
3rd Q1999
4th Q1999
1st Q2000
ROE (% )
31.2%27.3%
72.9%

46
Consolidated
Stock Market Performance
Banco Itaú preferred shares weretrading at the end of the first quarter of 2000 atR$155.00 per lot of 1,000 shares, remainingsteady during the period. Market capitaliza-tion, which also takes into account the valueof ordinary shares, amounted to R$16,566
million, a decrease of 7.1% from December1999. Consolidated net income per thousandshares amounted to R$3.10 for the quarter.Share value per thousand reached R$51.97,rising 3.75% over the share value at December1999.
Market Capitalization, Stockholders’ Equity andConsolidated Net Income (1)
6,1255,9075,8015,5635,182
16,56617,834
11,1099,9148,911226
333 360415
365
02,000
4,0006,000
8,000
10,00012,000
14,00016,000
18,00020,000
1Q99 2Q99 3Q99 4Q99 1Q000
100
200
300
400
500
600
700
800Consolidated Stockholders' Equity
Market Capitalization
Consolidated Net Income
R$ Million
(1) Net Income of Quarter; Stockholders’ Equity and Market Capitalization as of period ended.
761
Ext
raor
dina
ry R
esul
t (2)
(2) In the first quarter of 1999, the Banco Itaú has Extraordinary Result of R$ 535 million, related to the valorization ofpermanent Bank investments abroad.
Cons
olid
ated
Net
Inco
me
Mar
ket C
apita
lizat
ion,
Sto
ckho
lder
s’ E
quity
Collor Plan
Real Plan
Mexican Crisis
Asian Crisis
Russian Crisis
Preferred Shares AppreciationEvolution of US$ 100 Invested in March 31, 1990
The Reinvestiment of Dividends received in Banco itaú was not taken into consideration US$
90 91 92 93 94 95 96 97 98 99 00
Real Devaluation
US$100
0
4,000
8,000
12,000
16,000
20,000
Annual Appreciation ( in US$ ):10 YEARS (Average) 66.94 %5 YEARS (Average) 35.41 %12 MONTHS (Average) 81.78 %2000 2.55 %
Average Annual Appreciation of 66.94% in the last 10 years
US$ 16,884
47
Consolidated
Analysis of the 2000 First Quarter Re-sults
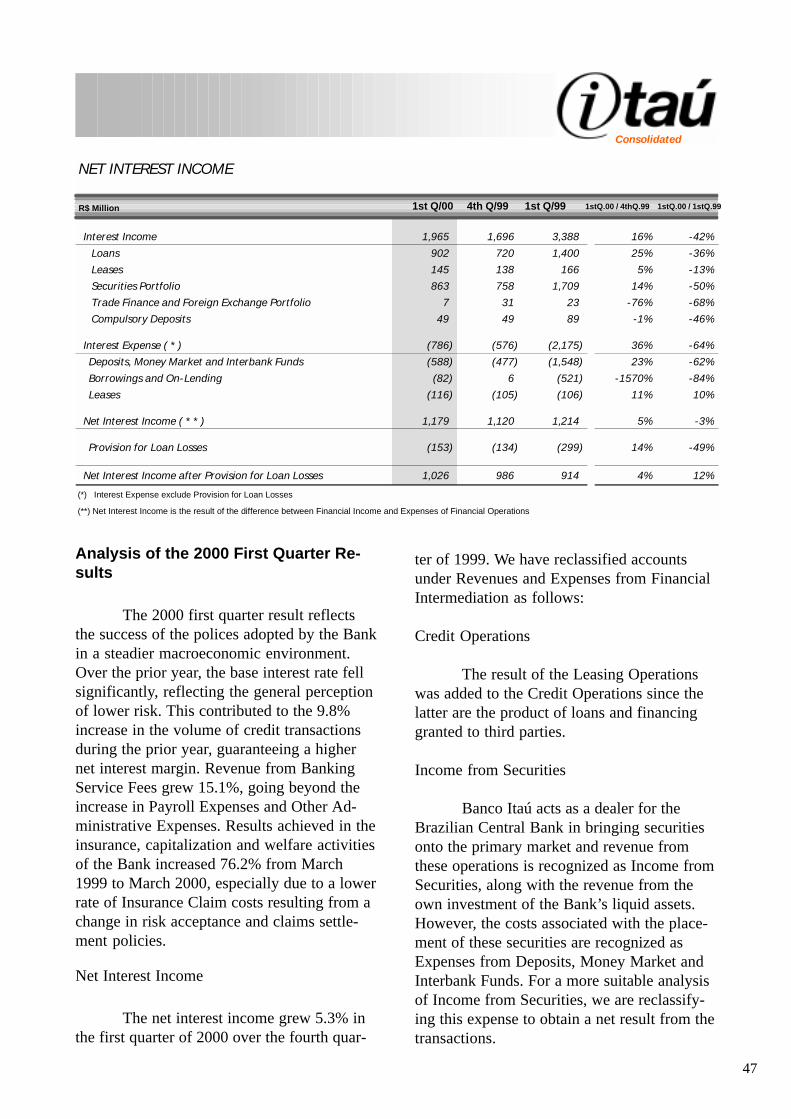
The 2000 first quarter result reflectsthe success of the polices adopted by the Bankin a steadier macroeconomic environment.Over the prior year, the base interest rate fellsignificantly, reflecting the general perceptionof lower risk. This contributed to the 9.8%increase in the volume of credit transactionsduring the prior year, guaranteeing a highernet interest margin. Revenue from BankingService Fees grew 15.1%, going beyond theincrease in Payroll Expenses and Other Ad-ministrative Expenses. Results achieved in theinsurance, capitalization and welfare activitiesof the Bank increased 76.2% from March1999 to March 2000, especially due to a lowerrate of Insurance Claim costs resulting from achange in risk acceptance and claims settle-ment policies.
Net Interest Income
The net interest income grew 5.3% inthe first quarter of 2000 over the fourth quar-
ter of 1999. We have reclassified accountsunder Revenues and Expenses from FinancialIntermediation as follows:
Credit Operations
The result of the Leasing Operationswas added to the Credit Operations since thelatter are the product of loans and financinggranted to third parties.
Income from Securities
Banco Itaú acts as a dealer for theBrazilian Central Bank in bringing securitiesonto the primary market and revenue fromthese operations is recognized as Income fromSecurities, along with the revenue from theown investment of the Bank’s liquid assets.However, the costs associated with the place-ment of these securities are recognized asExpenses from Deposits, Money Market andInterbank Funds. For a more suitable analysisof Income from Securities, we are reclassify-ing this expense to obtain a net result from thetransactions.
NET INTEREST INCOME
Interest Income 1,965 1,696 3,388 16% -42% Loans 902 720 1,400 25% -36% Leases 145 138 166 5% -13% Securities Portfolio 863 758 1,709 14% -50% Trade Finance and Foreign Exchange Portfolio 7 31 23 -76% -68% Compulsory Deposits 49 49 89 -1% -46%
Interest Expense ( * ) (786) (576) (2,175) 36% -64% Deposits, Money Market and Interbank Funds (588) (477) (1,548) 23% -62% Borrowings and On-Lending (82) 6 (521) -1570% -84% Leases (116) (105) (106) 11% 10%
Net Interest Income ( * * ) 1,179 1,120 1,214 5% -3%
Provision for Loan Losses (153) (134) (299) 14% -49%
Net Interest Income after Provision for Loan Losses 1,026 986 914 4% 12%
(*) Interest Expense exclude Provision for Loan Losses
(**) Net Interest Income is the result of the difference between Financial Income and Expenses of Financial Operations
R$ Million 1st Q/00 4th Q/99 1st Q/99 1stQ.00 / 4thQ.99 1stQ.00 / 1stQ.99

48
Consolidated
REALLOCATED NET INTEREST INCOME
Loans 902 720 1,400 25% -36%Leases 29 34 61 -15% -53%
Total of Loans 930 753 1,461 24% -36%Securities Portfolio 863 758 1,709 14% -50%Repurchase Commitments Expenses (163) (43) (331) 277% -51%
Total of Securities Portfolio 699 715 1,379 -2% -49%Trade Finance and Foreign Exchange Portfolio 7 31 23 -76% -68%
Total of Trade Finance and Foreign Exchange Portfolio 7 31 23 -76% -68%Adjusted Expenses of Deposits, Money Market and Interbank Funds (425) (434) (1,218) -2% -65%Compulsory Deposits 49 49 89 -1% -46%Borrowings and On-Lending (82) 6 (521) -1570% -84%
Total of Funding Expenses (458) (380) (1,649) 21% -72%
Net Interest Income 1,179 1,120 1,214 5% -3%
R$ Million 1stQ.00 / 4thQ.99 1stQ.00 / 1stQ.99 1st Q/00 4th Q/99 1st Q/99
Income from Foreign Exchange
This item was not reclassified.
Borrowings, Deposits, Money Market andInterbank Funds
The expenses with Borrowings, De-posits, Money Market and Interbank FundsOperations were added to the expenses of onBorrowings, Assignment and Pass-ThroughOperations. We have subtracted the Expenses
from Repurchase Agreements from Borrow-ings, Deposits, Money Market and InterbankFunds Operations as described under theIncome from Securities item.
Considering that part of the depositsmust by law be deposited with the CentralBank and that they have the same financialcosts as the funds to which they relate, wehave deducted the revenue with MandatoryApplications from the total of the Expensesfrom Borrowings, Deposits, Money Marketand Interbank Funds. Therefore, we have thefollowing considerations:
An analysis of the chart of the Reallo-cation of the Net Interest Income shows thatthe strategy adopted by the Bank to broadenits credit portfolio while rigorously control-ling the risks associated thereto has resulted inraising the institution’s overall spread. Overthe last 12 months the credit portfolio rose9.8% and the impact of the rise on income isnow being seen. Alongside the growth in thevolume of credit transactions, the Bank hasbeen making its products more attractive andcompetitive by reducing the financial costs ofobtaining them. As in the fourth quarter of1999, the interest rates for various products ofthe Bank fell into line with the low rates ofdelinquency, significantly lowering theserates. The volatility of the foreign exchange
rate continues to determine changes both ininterest income and expense. However, thesefluctuations did not have a great impact on thenet income.
The adjusted result from Securitieswas R$699 million, a decrease of 2.2% Theresult was affected by the drop in earningsfrom investment mutual fund and variableincome securities, the consequence of lowervaluation of the shares during the period.
In the first quarter of 2000, the ForeignExchange Results reached a level in tune withthe minor fluctuations in the exchange ratecreated by a scenario with relatively lowvolatility that did not produce opportunitiesfor significant gains. This scenario can beviewed against the ones recorded during some

49
Consolidated
of the 1999 periods in which arbitrage oppor-tunities arose following the freeing of theexchange rate and the subsequent positiveresponse of the economic indicators on thedomestic front. The volume of foreign ex-change carried out in the first quarter of 2000
was US$ 27,685 million, a 15% increase fromthe previous quarter.
Thus, the Annualized Rate of NetInterest Margin has been showing an upwardtrend in the last quarters, mostly due to thechange in the mix of its elements, as can beseen in the following chart.
ANALYSIS OF REALLOCATED NET INTEREST INCOME
Income from Loans 902 720 1,400 Income from Leases 29 34 61
A ) Income from Loans and Leases 930 753 1,461
Securities Portfolio 699 715 1,379 Trade Finance and Foreign Exchange Portfolio 7 31 23
B ) Income from Securities + Trade Finance and Foreign Exchange 707 746 1,402
C ) Interest Income 1,637 1,499 2,863
D ) Interest Expense (458) (380) (1,649)
E ) Net Interest Income 1,179 1,120 1,214
Average Loans 15,068 14,427 12,967 Average Leases 553 492 481 Average Other Receivables * 178 165 143 Average Advances on Exchange Contrats 1,435 1,433 1,265
F ) Average Loans * * 17,235 16,517 14,856
Average Cash and Cash Equivalents + Interbank Funds Applied 7,186 8,247 8,760 Average Securities Portfolio 14,856 14,389 13,949 Average Interbank and Interbranch Accounts 5,415 5,467 5,455 Average Loans Operations 17,235 16,352 14,713
G ) Average Earning Assets 44,691 44,455 42,878
Average Deposits 22,678 21,661 21,367 Average Acceptances and Debentures 3,046 4,115 4,688 Average Interbank and Interbranch Accounts 1,499 1,632 2,435 Average Borrowings 3,487 3,950 4,008 Average On-Lending Borrowings 1,883 1,715 1,336
H ) Average Funding Resources 32,593 33,074 33,834
Annual Average Ratio of Income from Loans and Leases = A/F 23.4% 19.5% 45.5%
Annual Average Ratio of Interest Income = C/G 15.5% 14.2% 29.5%
Annual Average Ratio of Interest Expense = D/H 5.7% 4.7% 21.0%
Annual Ratio of Net Interest Margin = E/G 11.0% 10.5% 11.8%
* Other Receivables are recorded under Credit Operations in accordance with Resolution 2682.
* * Loans Operations : Include Loans, Leasing and Advances on Exchange Contracts
Net Interest Income
Operation Volumes Average
Average Rate
R$ Million 1st Q/00 4th Q/99 1st Q/99
50
Consolidated
TYPE OF RATING DESCRIPTION
Client Rating / Operation Rating according to the Bank's internal criteria
Past Due RatingFollows Resolution 2682, which defines the rating of the operation according to the number of days past due.
Client's worst ratingIdentifies the worst rating among all operations of the client and is transmitted to all operations of that client
Economic Group's worst ratingIdentifies the worst rating among all operations of the economic group and is transmitted to all operations of that group.
Final RatingObtained through a comparison between all ratings, the worst of them prevailing, according to the materiality and importance principles of the worst rating
Provision for Loan Losses
On December 21, 1999, the BrazilianCentral Bank published Resolution 2682defining criteria for rating credit operationsbased on client and transaction risks. It alsosets up rules for recording a loan loss provi-sions, which, according to the new rules, shallnow be based on the lending transactionrating. Now operations are individualized,facilitating the determination of the spreadaccording to the rating of the client. In thisway, financial institutions, using the principlesset out in the regulation, may apply their ownrating classification or identify transactionsbased on overdue amounts by adopting con-sistent and verifiable criteria. Nine ratinglevels were established with nine delay peri-ods between 0 and 180 days, and nine provi-
sion rates were created between 0 and 100%.Write-off criteria were changed to 360 daysover the due date or 720 days for transactionswith terms over 36 months. These new ruleswill provide more safety and transparency tothe supply of credit by reducing the risk in thebanking industry of the country as a whole.
Generally accepted criteria in theapproval process for lending operations suchas level of indebtedness, financial and busi-ness outlook, income, equity and other legallyrecorded information are used in rating cli-ents.
The determination of the credit risklevel at Banco Itaú involves the assessment ofthe following types of rating:

51
Consolidated
RATING DESCRIPTION BACENRATING
%FUNDEDITAÚ
ExcellentCustomer/company with a solid financial/business record over the last years and top operating characteristics and management capabilities.
AA 0.0%
Very GoodCustomer/company with financial/business record and very good operating characteristics and management capabilities in the last years.
AA 0.0%
Good
Customer/company with financial/business record and good operating characteristics and management capabilities in the last years. Medium, Small and Micro companies and individuals with good financial behavior and low credit risk.
A 0.5%
Satisfactory
Customer/company with a satisfactory financial/business record in the last years, presenting a certain dependence on outlook of the market of operation. Medium, Small/Micro companies and individuals with satisfactory financial behavior and few serious and/or negative references.
B 1.0%
Monitored
Customer/company with a somewhat deficient operational flow and a financial/business outlook requiring ongoing follow-up. Medium, Small/Micro companies and individuals with financial behavior that must be followed-up periodically and with possible serious and/or negative references.
C 3.0%
Special
Client/company of a type or in a business branch with special features and whose operations are analyzed by the Credit Commission. For example: State-run enterprises, Financial Institutions, Insurance companies, not-for-profit entities.
B 1.0%
Not Operational/ Risk Reduction
Client/company with unstable management and a deficient financial/business outlook. Our stake must be reduced.. Medium, Small/Micro companies and individuals with poor financial behavior and serious and/or negative references.
D 10.0%
Specific Provision
Client/company with a deficient business/financial and/or management outlook, quite poor references, for which provisions were being funded even before Resolution 2682, and with a probable serious credit-risk problem.
F 50.0%
The assignments of credit risk levelsare revised periodically according to thevolume and type of risk. Banco Itaú has
specific rating criteria by type of client, ratedon a scale that shows the quality of the client.

52
Consolidated
For greater transparency, the Bank hassegregated provision accounts into two differ-ent groups: general accounts and specificaccounts. The general provisions come fromattributing an initial rating to the client or the
client’s transaction. After this step, in theevent of delays, bankruptcy, agreements orcomposition, the rating of transactions can bechanged by the creation of specific provisions.
Itaú Rating Bacen Rating % of Provision FundingExcellent AA 0%Very Good AA 0%Good A 0.5%Satisfactory and Special B 1%Monitored C 3%Risk Reduction D 10%
Specific Provision F 50%
OVERDUE ANALYSIS
ANALYSIS OF CUSTOMER RATING
NOT OVERDUE
COMPANIES WITH LOWEST RATINGS
CLIENTS WITH LOWEST RATINGS
FINAL RATING FOR PROVISION FOR LOAN LOSSES
QUALITY RATING ASSESSMENT/CONFIRMATION
RECORDING OF PROVISION FOR LOAN LOSSES
Up to 14 days AA - A15 to 30 days B31 to 60 days C61 to 90 days D91 to 120 days E121 to 150 days F151 to 180 days GOver 180 days H
Up to 14 days AA
Specific Provision Generic Provision

53
Consolidated
R$ Million
Level CreditPortfolio
Minimum Provision RequiredGeneric
ExistingProvisionSpecific
ExcessProvision
AA 4,907 0 0A 6,022 0 30B 3,507 2 33C 1,530 8 38D 723 12 61E 90 26 1F 298 41 108G 40 26 2H 275 207 69
To t al 17,393 322 341 625 1,287
Provision for Loan Losses by Risk Level
Central Bank also determined that adjust-ments to the provisions should be recordeddirectly to the Retained Earnings on the Share-holders’ Equity account and not go throughincome. However, Banco Itaú has not adoptedthis procedure, meeting the new rules of CentralBank without the need for additional expensesto the Provision for Loan Losses or adjustmentsto Shareholders’ Equity. In addition to having aquality loan portfolio, the Bank had been keep-ing a high surplus in the provision for doubtfulloans, so the transition was made without havingan impact on income or shareholders’ equity.Also, Banco Itaú was already assigning variousrisk levels to most of its loan operations. Loanoperations in the Corporate, Company and mostof the retail transactions areas, both for individu-als and entities, were rated. All that remained tobe done was to homogenize the rating classifica-tion used by Banco Itaú to the one of CentralBank.
During the first quarter of 2000, theexpenses for the Provision for Loan Losses rose14.1%, due to a slight rise in the mortgageportfolio delinquency rate. The delinquency ratewas 2.6% during the quarter, reflecting theefforts and advances in the management of
credit risk. Write-offs through Feburary 29,2000 amounted to R$119 million and therecovery of loans offset by the Provision forLoan Losses amounted to R$92 million forthe quarter.
At March 31, 2000, the Bankshowed a balance in the Provision for LoanLosses of R$1,287 million, equal to 7.4%of loan operations. The amount was com-prised of R$663 million as required byResolution 2682 and R$625 million insurplus. The mandatory provision was madeup of R$341 million in general provision,that is, recorded in accordance with theinitial risk rating of the clients and transac-tion, and R$322 million in specific provi-sion, recorded based on delays, agreements,bankruptcy or composition.
The implementation of the newResolution caused a decrease of 38.6% inthe surplus balance of the provision, sinceby maintaining the previous situation, thebalance would have been R$1,017 million.In the same manner, Non-Accrual Loanswould have amounted to R$227 million andthe Overdue Loans Operations would havebeen R$43 million.

54
Consolidated
EEEEEvvvvvolution of the Prolution of the Prolution of the Prolution of the Prolution of the Prooooovision fvision fvision fvision fvision for Loan Loor Loan Loor Loan Loor Loan Loor Loan Losssssssssseeeeesssss
Provision for Loan Losses - Effects from Resolution 2682 / 99R$ Million
ExcessProvision
2.6
15.2
3.2
5.74.9
4.53.7
6.8
3.2 3.2 3.0
2.3 2.02.30
2
4
6
8
10
12
14
16
Mar
-95
Jun-9
5
Sep
-95
Dec
-95
Mar
-96
Jun-9
6
Sep
-96
Dec
-96
Mar
-97
Jun-9
7
Sep
-97
Dec
-97
Mar
-98
Jun-9
8
Sep
-98
Dec
-98
Mar
-99
Jun-9
9
Sep
-99
Dec
-99
Mar
-00
Not taken in account portion of credits receivables that is issued in Provision for Loan Losses
Ratio of Default = percentage of credits that are 11 to 30 days overdue in relation credits that are 11 to 30 days
Both indexes are calculated the same way and show the ratio between the value of overdue and unpaid installments in a givenperiod and the total installments due in the same period.The difference is that the first one (blue line) includes in the two terms of the division all those contracts that have or not beenwritten off against Provision for Loan Losses; whereas the second one (red line) extracts from the two terms of the division thosecontracts that have been written off against Provision for Loan Losses.
Ratio of Default ( % )
Prior Situation (Res. 1.748) 17,122 271 271 1,287 1,016
Effects of criteria adoption 271 (271) 50 341 (391)
Present Situation (Res. 2.682) 17,393 322 341 1,287 625
(*)The effect of the March 2000 write-offs are not recorded in the amount of R$ 38 Million. Write-offs stopped being taken on an accelerated basis (61 days in Nonperforming Loans) pursuant to Resolution Nr. 2682/99
LeLeLeLeLevvvvvelelelelel CreditPortfolio
Minimum Provision RequiredGeneric
ExistingProvision (*)Specific
Credits in Liquidationand Past Due (*)
R$ Million
Balances at December 31, 1999 1,253
Provision for the period 153
Write-Offs made up to February 29, 2000 (119)
Balances as of March 31, 2000 1,287
Specific Provision (1) 322
Generic Provision (2) 341
Excess Provision 625
(1) For portions of transactions overdue by more than 14 days, with completed compositions or that are the responsibility of companies with agreements or in bankruptcy proceedings.
(2) For transaction not included under the preceding item based on the customer or transaction rating.

55
Consolidated
MOVEMENT OF THE PROVISION FOR LOAN LOSSES MAINTAINING THE PREVIOUS CRITERIA OFRESOLUTION 2682
417% 448% 453% 532% 477%
1st Q
/99
2nd Q
/99
3rd Q
/99
4th Q
/99
1st Q
/00
Coverage R atio ( Provisions / Overdue Credits + Non Accrual Loans )
WR ITE-OFF CHANGES
1.9%1.8%
2.0%
1.6%
1.4%
119
190140
265
306
0.0%
0.2%
0.4%
0.6%
0.8%
1.0%
1.2%
1.4%
1.6%
1.8%
2.0%
1st Q/99 2nd Q/99 3rd Q/99 4th Q/99 1st Q/000
50
100
150
200
250
300
350
Overdue Credits + Non Accrual Loans / Loans Write-off (R$Million)
Beginning Balances (1,253) (1,310) (1,303) (1,333) (1,340)Expenses allocated as: (153) (134) (146) (235) (299) Provision for Loan Losses (153) (134) (146) (235) (299) Extraordinary Results 0 0 0 0 0Write-off 119 190 140 265 306End Balances (1,287) (1,253) (1,310) (1,303) (1,333)
Beginning Balances of Non-accrual Loans 196 251 249 279 313New Operations included 150 134 143 235 272Write-off 119 190 140 265 306End Balances of Non-accrual Loans 227 196 251 249 279
Recoveries 92 80 86 40 70
1st Q/ 00 4th Q/ 99 3rd Q/ 99 2nd Q/ 99 1st Q/ 99
PROVISION FOR LOAN LOSSES CONSOLIDATED (R$ Million)
Provision for Loan Losses (a) (1,287) (1,253) (1,310) (1,303) (1,333)Non-accrual Loans (b) + Overdue Loan (c) 271 236 289 291 320General Provisions (a - b - c) (1,017) (1,017) (1,021) (1,012) (1,013)
Loans Operations ( * ) 17,393 17,077 15,878 15,135 15,847
(Non-accrual Loans + Overdue Loan) / Loans 2% 1% 2% 2% 2%Provision for Loan Losses / Loans 7% 7% 8% 9% 8%Cov. Ratio ( Prov. for Loan Losses / Non-accrual Loans + Overd.Loan) 477% 532% 453% 448% 417%Additional Provision / Loans 6% 6% 6% 7% 6%
( * ) Loans Operations: include Loans, Leasing and Advances on Exchange Contracts
1st Q/ 00 2nd Q/ 99 1st Q/ 994th Q/ 99 3rd Q/ 99
PROVISION FOR LOAN LOSSES CONSOLIDATED (R$ Million)

56
Consolidated
56%
24%
90%
36%
102%
36%
101%
23%
107%
41%
117%
38%
Dec/95 Dec/96 Dec/97 Dec/98 Dec/99 Mar/00
Service Fees Compared to Salariesand Employees Expenses
Banking Service Fees Mutual Fund Management Fees
80%
126%138%
124%148% 155%
100%
Mutual Fund Management Fees 207 352 156 -41% 33% Collection Fees 52 57 52 -9% 0% Current and Saving Account Service Fees 140 148 133 -5% 5% Collection Fees Agreements with Public Co. 41 66 35 -38% 17% Interbank Tariff 35 36 31 -3% 13% Loans 45 46 35 -2% 29% Credit Cards 190 190 148 0% 28% Other Services 92 85 106 8% -13%
Total 802 978 697 -18% 15%
R$ Million 1st Q./00 4th Q./99 1st Q./991stQ.00/4thQ.99
1stQ.00/1stQ.99
Banking Service Fees
In the first quarter of 2000, BankingService Fees amounted to R$802 million, rep-resenting a decrease of 18% over the amountof the fourth quarter of 1999.
The coverage ratio, obtained by divid-ing Banking Service Fees by Payroll Ex-penses, reached 155%, showing the success ofthe measures implemented in the last yearsaimed at improving Itaú’s performance in pro-viding services to its clients.
by 6.7% in this period, corresponding to avolume of R$ 2 billion. The Bank’s marketshare was 11.25% in March of 2000. How-ever, a comparison of Banking Service Feesfor the first quarter of 2000 and fourth quarterof 1999 shows a decrease of 41%, as a resultof the reduction in performance fees chargedfrom certain exclusive mutual funds.
The Bank will be offering the Matrixfunds throughout its distribution network, in-cluding to the Corporate, Middle Market, Pri-vate Banking and Institutional segments byadding the expertise of its highly specializedteam and its technical capability in controllingrisk in the search for improved performances.Matrix will act as the investment advisor tomaintain the features of the funds arising fromthe negotiation. This broadens the supply ofdifferentiated product by diversifying andcomplementing the portfolio of mutual fundsderivatives without increasing by the sametoken operating costs.
With this move, the Bank consolidatedits leadership position in the management ofthird party funds, particularly in the deriva-tives area, by offering even more sophisti-cated products than the ones available to date.This new family of mutual funds has R$1.1billion in equity in Brazil and R$0.7 billionabroad.
Assets Management
Fees from Assets Managementamounted to R$207 in the first quarter of2000, an increase of 33% over the first quarterof 1999. The resources managed by Itaú rose
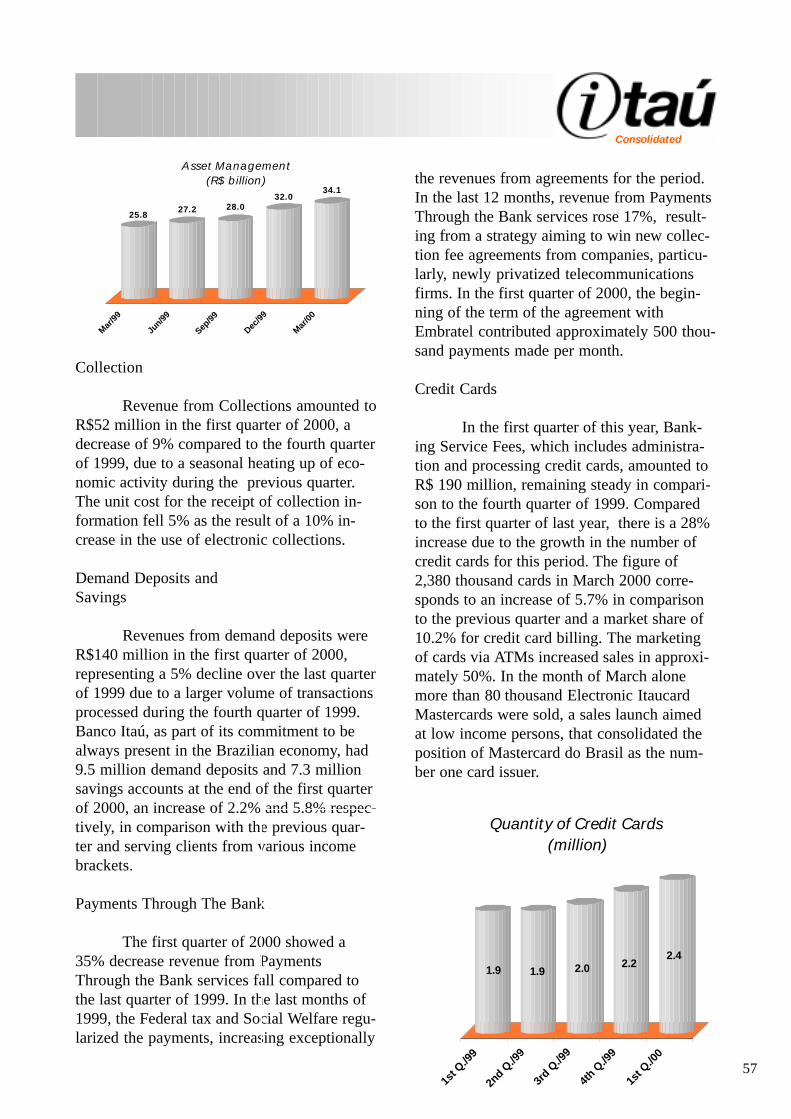
57
Consolidated
Collection
Revenue from Collections amounted toR$52 million in the first quarter of 2000, adecrease of 9% compared to the fourth quarterof 1999, due to a seasonal heating up of eco-nomic activity during the previous quarter.The unit cost for the receipt of collection in-formation fell 5% as the result of a 10% in-crease in the use of electronic collections.
Demand Deposits andSavings
Revenues from demand deposits wereR$140 million in the first quarter of 2000,representing a 5% decline over the last quarterof 1999 due to a larger volume of transactionsprocessed during the fourth quarter of 1999.Banco Itaú, as part of its commitment to bealways present in the Brazilian economy, had9.5 million demand deposits and 7.3 millionsavings accounts at the end of the first quarterof 2000, an increase of 2.2% and 5.8% respec-tively, in comparison with the previous quar-ter and serving clients from various incomebrackets.
Payments Through The Bank
The first quarter of 2000 showed a35% decrease revenue from PaymentsThrough the Bank services fall compared tothe last quarter of 1999. In the last months of1999, the Federal tax and Social Welfare regu-larized the payments, increasing exceptionally
the revenues from agreements for the period.In the last 12 months, revenue from PaymentsThrough the Bank services rose 17%, result-ing from a strategy aiming to win new collec-tion fee agreements from companies, particu-larly, newly privatized telecommunicationsfirms. In the first quarter of 2000, the begin-ning of the term of the agreement withEmbratel contributed approximately 500 thou-sand payments made per month.
Credit Cards
In the first quarter of this year, Bank-ing Service Fees, which includes administra-tion and processing credit cards, amounted toR$ 190 million, remaining steady in compari-son to the fourth quarter of 1999. Comparedto the first quarter of last year, there is a 28%increase due to the growth in the number ofcredit cards for this period. The figure of2,380 thousand cards in March 2000 corre-sponds to an increase of 5.7% in comparisonto the previous quarter and a market share of10.2% for credit card billing. The marketingof cards via ATMs increased sales in approxi-mately 50%. In the month of March alonemore than 80 thousand Electronic ItaucardMastercards were sold, a sales launch aimedat low income persons, that consolidated theposition of Mastercard do Brasil as the num-ber one card issuer.
25.827.2 28.0
32.034.1
Mar/99
Jun/99
Sep/99
Dec/99
Mar/00
Asset Management(R$ billion)
1.9 1.9 2.0 2.22.4
1st Q
./99
2nd Q
./99
3rd Q
./99
4th Q
./99
1st Q
./00
Quantity of Credit Cards (million)

58
Consolidated
INSURANCE, CAP ITALIZ ATION AND P ENSION P LAN OP ERATIONS
Cap it alizat io n P re m iu m s , In s u ran ce an d P e n s io n P lan s 466 545 456 -15% 2%Exp enses in Co nstituting Tech nical Prov isio ns o f Cap italization (103) (174) (84) -41% 24%Insurance Claim s (182) (193) (236) -6% -23%Selling Expen ses (50) (55) (58) -9% -13%Pensio n Plan s Ben ef its Expen ses (42) (34) (28) 23% 47%
P art ial Re s u lt o f In s u r an ce , Cap it alizat io n an d P e n s io n P lan s 88 88 50 0% 76%
R$ Million 1st Q/00 4th Q/99 1st Q/99 1stQ.00 / 4thQ.99 1stQ.00 / 1stQ.99
The chart above shows the behavior ofthe partial results of insurance, capitalizationand social welfare, marking a balance in thefirst quarter of 2000 in relation to the fourthquarter of 1999. However, these amounts donot reflect the net profits of Insurance, Capi-talization and Pension Plan companies, sincethe financial results arising from applicationsof reserves are allocated in the net interestincome.
Te c h n ical P ro v is io n s o f In s u r an ce ,Cap it alizat io n an d P e n s io n P lan s - Vin cu lat e d
R$ million 31-Mar-00 31-Dec-99 31-Mar-99
Insurance 268 267 213
Cap italizatio n 1 1 2
Pen sio n Plans 63 57 36
TOTAL 332 325 251
R$ Million Mar-2000 Dec-1999 Mar-1999
Te ch n ical P ro v is io n s o f In s u ran ce ,
Cap it alizat io n an d P e n s io n P lan s - No t Vin cu lat e d
R$ million 31-Mar-00 31-Dec-99 31-Mar-99
Insuran ce 525 540 617
Cap italizat ion 822 891 785
Pension Plan s 558 514 349
TOTAL 1,904 1,945 1,750
R$ Million Mar-2000 Dec-1999 Mar-1999

59
Consolidated
Note 2 :
Underwriting Margin = Earned Premiums - Insurance Claims - Commercialization Expenses - Other Operating Expenses / Income
During the first quarter of 2000, therewas a 5.6% increase in the partial result frominsurance compared to the previous quarter.The growth is due essentially to the revisedpolicies of risk acceptance and loss write-offsthat reduced Expenses from Insurance Claims.In the fourth quarter of 1999, expensesamounted to R$193 million, going to R$ 182million in the first quarter of 2000. The adop-tion of new policies generally meant a dimi-nution in premium volume. Thus, PremiumsEarned decreased 4.1% in the first quarter of2000 over the previous quarter.
The decrease in Insurance Claimsbecomes more significant when compared tothe result of the first quarter of 1999, a varia-tion of 22.9%.
The Combined Ratio (Note 1) of theconglomerate’s insurance companies reached101.4% in the first quarter of 2000, develop-ing significantly when compared to the104.3% of the fourth quarter of 1999 and tothe 108.0% of the first quarter of 1999.
As in the case of the Combined Ratio,the underwriting margin (Note 2) developedpositively in the first quarter of 2000, mainlydue to the result of the margin automobilesector, which changed from R$ 8.6 million inthe fourth quarter of 1999 to R$ 15.4 millionin the first quarter of 2000.
In this way, as already stated, theimprovements implemented in risk acceptanceand insurance fraud detection caused theclaims ratios to fall, bringing positive effectsto Itaú Seguros despite the drop in the volumeof Premiums Earned.
Revenues from Insurance Premiums 281 286 293
Expenses in constituting technical provisions of insurance 17 24 39
Earned Premiums 298 310 331
Insurance Claims (182) (193) (236)
Selling expenses - Insurance (50) (55) (58)
Partial Result of Insurance 65 62 38
R$ Mill ion 1st Q/00 4th Q/99 1st Q/99
INSURANCE OPERAINSURANCE OPERAINSURANCE OPERAINSURANCE OPERAINSURANCE OPERATIONSTIONSTIONSTIONSTIONS
Note 1 :( Insurance Claims + Commercialization Expenses + Administrative Expenses + Other Operating Expenses/Income )
Combined Ratio =( Earned Premiums )
(*) Non proporcional reinsurance is not recorded
1ST QUARTER/1999
COMPOSITION OF RETEINED PREMIUMS (*) - INSURANCE
1ST QUARTER/2000 4TH QUARTER/1999
48%
26%
9%
6%
11%
VEHICLES LIFE
PROPERTY TRANSPORTATION
OTHER
45%
26%
9%
6%
14%
VEHICLES LIFE
PROPERTY TRANSPORTATION
OTHER
54%
22%
9%
4%11%
VEHICLES LIFE
PROPERTY TRANSPORTATION
OTHER
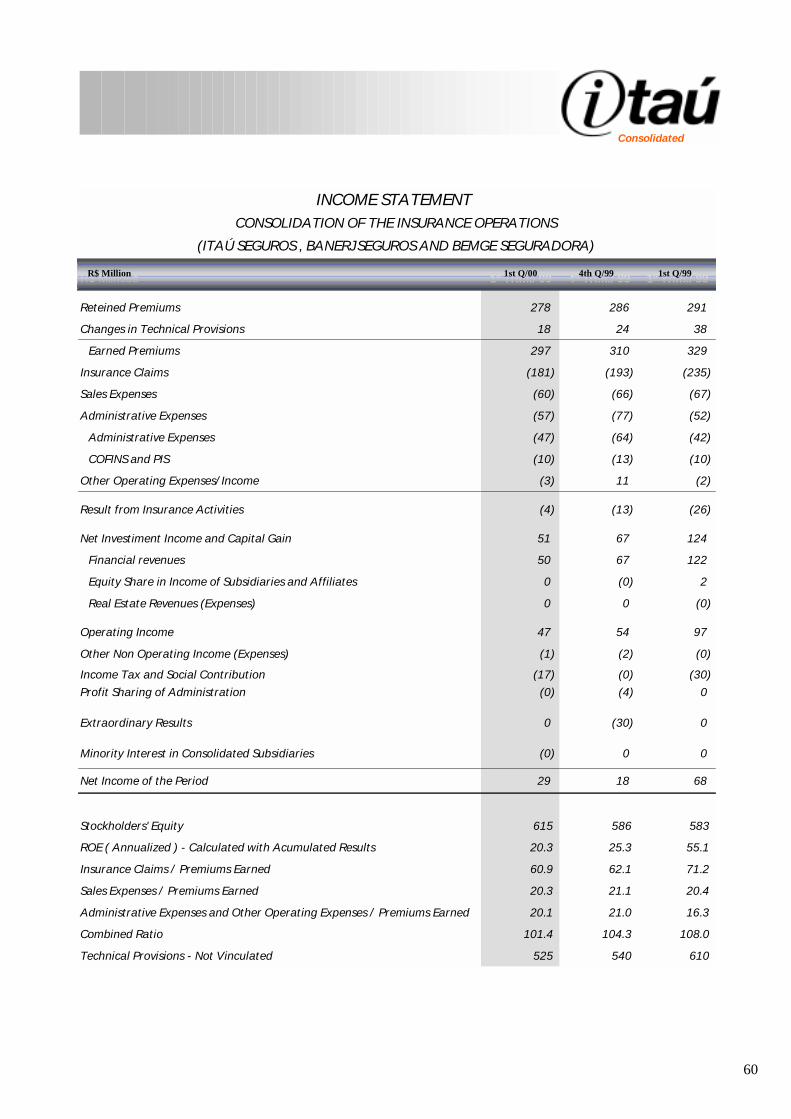
60
Consolidated
R$ Milhões 1º Trim./ 00 4º Trim./ 99 1º Trim./ 99
Reteined Premiums 278 286 291
Changes in Technical Provisions 18 24 38
Earned Premiums 297 310 329
Insurance Claims (181) (193) (235)
Sales Expenses (60) (66) (67)
Administrative Expenses (57) (77) (52)
Administrative Expenses (47) (64) (42)
COFINS and PIS (10) (13) (10)
Other Operating Expenses/Income (3) 11 (2)
Result from Insurance Activities (4) (13) (26)
Net Investiment Income and Capital Gain 51 67 124
Financial revenues 50 67 122
Equity Share in Income of Subsidiaries and Affiliates 0 (0) 2
Real Estate Revenues (Expenses) 0 0 (0)
Operating Income 47 54 97
Other Non Operating Income (Expenses) (1) (2) (0)
Income Tax and Social Contribution (17) (0) (30)Profit Sharing of Administration (0) (4) 0
Extraordinary Results 0 (30) 0
Minority Interest in Consolidated Subsidiaries (0) 0 0
Net Income of the Period 29 18 68
Stockholders' Equity 615 586 583
ROE ( Annualized ) - Calculated with Acumulated Results 20.3 25.3 55.1
Insurance Claims / Premiums Earned 60.9 62.1 71.2
Sales Expenses / Premiums Earned 20.3 21.1 20.4
Administrative Expenses and Other Operating Expenses / Premiums Earned 20.1 21.0 16.3
Combined Ratio 101.4 104.3 108.0
Technical Provisions - Not Vinculated 525 540 610
INCOME STATEMENT
(ITAÚ SEGUROS , BANERJ SEGUROS AND BEMGE SEGURADORA)
CONSOLIDATION OF THE INSURANCE OPERATIONS
R$ Million 1st Q/00 4th Q/99 1st Q/99

61
Consolidated
Number of Capitalization Plans ( Thousand )
1,5761,347 1,603
1,562
1,117
-
400
800
1,200
1,600
Dec-9
6
Mar
-97
Jun-
97
Sep-9
7
Dec-9
7
Mar
-98
Jun-
98
Sep-9
8
Dec-9
8
Mar
-99
Jun-
99
Sep-9
9
Dec-9
9
Mar
-00
Number of Pension Plans ( Thousand )
246
43
240267
259
-50
100150200250300
Dec-9
6
Mar
-97
Jun-
97
Sep-9
7
Dec-9
7
Mar
-98
Jun-
98
Sep-9
8
Dec-9
8
Mar
-99
Jun-
99
Sep-9
9
Dec-9
9
Mar
-00
Technical Provisions - Capitalization Plans ( R $ M illion)
769786
835
683
497
0
200
400
600
800
1000
Dec-9
6
Mar
-97
Jun-
97
Sep-9
7
Dec-9
7
Mar
-98
Jun-
98
Sep-9
8
Dec-9
8
Mar
-99
Jun-
99
Sep-9
9
Dec-9
9
Mar
-00
Technical Provisions - Pension Plans ( R $ M illion )
620569
488
31847
0100200300400500600700
Dec-9
6
Mar
-97
Jun-
97
Sep-9
7
Dec-9
7
Mar
-98
Jun-
98
Sep-9
8
Dec-9
8
Mar
-99
Jun-
99
Sep-9
9
Dec-9
9
Mar
-00
The Partial Result of Capitalization inthe first quarter of 2000 was 6.4% greater thanthe fourth quarter of last year. The PICCarnaval campaign (monthly payments ofR$40,00) during the months of January andFebruary 2000 lead to the placement of 220thousand plans.
Capitalization income was quite highin the fourth quarter due to the Super PICMillenium Campaign (single R$1,000.00payment) that took place from September toDecember 1999 with the placement of 135thousand plans – 67 thousand in September1999 and 68 thousand during the last quarterof 1999.
Expenses from Changes in TechnicalProvisions were also affected by the decreasein capitalization income.
The Partial Result of Pension Planswas affected by the 15.8% decrease in pensionplan revenue that went from R$ 91 million inthe fourth quarter of 1999 to R$ 76 million inthe first quarter of 2000. The seasonal natureof contributions to pension plans, aimed attaking advantage of the tax incentive in theIncome Tax return, boosted the income in thelast quarter of 1999.
The decline in Expenses from Changesin Technical Provisions also stems from theseasonal nature of the contributions andwithdraws.
P ENSION P LANS OP ERATIONS
Re v e n u e s f ro m P e n s io n P lan s 76 91 67
Exp enses in con stituting techn ical (34) (51) (41)
p ro v isio n s o f Pen sio n Plan
Pen sion Plan s b ene f its exp enses (42) (34) (28)
P art ial Re s u lt o f P e n s io n P lan s 1 6 (2)
Sto ckh o ld e rs' Eq u ity 42 41 36
To tal Assets 673 628 430
R$ Million 1st Q/00 4th Q/99 1st Q/99
CAP ITALIZ ATION OP ERATIONS
Cap it aliz at io n P r e m iu n s 109 168 96
Exp en ses in co n stitutin g tech n ical
p ro v isio n s o f Cap italizatio n (87) (147) (81)
P ar t ial Re s u lt o f Cap it aliz at io n 22 21 15
Sto ckh o ld ers' Eq uity 1,885 1,854 1,851
To tal Assets 2,744 2,796 2,763
R$ Million 1st Q/00 4th Q/99 1st Q/99

62
Consolidated
Administrative Expenses
Payroll Expenses
Payroll Expenses went down 9.6% inthe first quarter of 2000 to R$ 517 million. Inthe last quarter of 1999, the improvement ofcriteria used in recording employee-relatedprovisions resulted in greater spending fromrecording them.
Banco Itaú’s workforce remainedsteady and at the end of March 2000 therewere 39,072 employees as compared to39,011 employees at December 1999.
Human Resources Development Programs
Banco Itaú hired 146 university andyoung graduates, with a strong educational
background and much potential for profes-sional growth, from the best Brazilian univer-sities in the first quarter of 2000. Graduationand post-graduate incentives were madeavailable to 1,794 employees during theperiod. R$5 million were invested in humanresources development programs in the firstquarter, as compared to R$6.8 million in theprevious quarter.
Employee Benefits
In the first quarter of 2000, benefitsoffered to Banco Itaú employees amounted toR$ 83 million, rising 6.4% over the fourthquarter of 1999.
Number of EmployeesCOMPANY Dec./95 Dec./96 Dec./97 Dec./98 Dec./99 Mar./00
Banco Itaú Buen Ayre (*) 238 414 641 1,598 1,696 1,657
Bemge - - - 6,296 2,557 1,951
Banerj - - 5,624 3,463 2,873 2,780
Itaú and Others 36,398 30,954 29,998 30,273 31,885 32,684
Total 36,636 31,368 36,263 41,630 39,011 39,072
(*) Due to the acquisition, the information of Banco Itaú Argentina and Banco del Buen Ayre were consolidated.
R$ Million 1st Q/ 2000 4th Q/ 1999 1st Q/ 19991stQ.00/ 4thQ.99
1stQ.00/ 1stQ.99
Payroll Expenses 517 572 475 -10% 9%Other Administrative Expenses 639 657 575 -3% 11%
Premises 77 81 85 -5% -9%
Materials 22 28 20 -21% 10%Data Processing and Telecom. 110 109 125 1% -12%
Third Part Services 76 80 51 -5% 49%Travels 6 8 5 -25% 20%
Security 22 22 20 0% 10%Marketing 50 68 31 -26% 61%
Transportation 45 44 39 2% 15%Depreciation and Amortization 97 96 79 1% 23%Financial System 's Services 58 63 55 -8% 5%
Other Expenses 76 58 65 31% 17%
Total 1,156 1,229 1,050 -6% 10%

63
Consolidated
Automation and Expansion of the Service Network
Other Administrative Expenses
Other Administrative Expensesamounted to R$ 639 million in the first quar-ter of 2000, falling 2.7% under the fourthquarter of 1999.
At the end of 1999, the campaigns —Banco Itaú Digital, Super PIC of theMillenium, Itaucard and the new brand,Banco Itaú Buen Ayre — were intensified,thereby increasing marketing expenses for theperiod.
Additional purchases for the Y2K BugContingency Plan added to the expensesrelated to the year ended events, also contrib-uted to the increase in Expenses for Materialsin the fourth quarter of 1999.
In the same quarter, the Expenses forThird Party Services were greater due toconsulting services contracted to strengthenthe market positioning of the Corporate andPension Plan areas and the Banco Itaú BuenAyre.
Expenses for Transport, essentiallyserving the network branches, ATM and CSB(Customer Site Branches) network, remainedstable between the periods.
Automation and Expansion of the ServiceNetwork
In the first quarter of 2000, BancoItaú’s clients made 322.3 million electronictransactions. Convenience transactions al-ready represent 70% of operations that may betransferred to Self-Service transactions.
During the first quarter of 2000, Home& Office Bank Transaction grew 9.5%. The1.2 million clients of record carried out 33.4million transactions, and 11.4 million opera-tions have been made through Internet HomeBanking, against R$ 8.2 million operationsrecorded in the previous quarter.
0%
20%
40%
60%
80%
100%
Jun/85
Dec/85
Jun/86
Dec/86
Jun/87
Dec/87
Jun/88
Dec/88
Jun/89
Dec/89
Jun/90
Dec/90
Jun/91
Dec/91
Jun/92
Dec/92
Jun/93
Dec/93
Jun/94
Dec/94
Jun/95
Dec/95
Jun/96
Dec/96
Jun/97
Dec/97
Jun/98
Dec/98
Jun/99
Dec/99
Mar/00
ATM Automated Programmed Debit ItaufoneBankfone Bankline Direct Connection Bankline - InternetItaufax Point on Sale/ Redeshop Teller Transactions (*)
Evolution of Transactions

64
Consolidated
VOLUME OF SELF-SERVICE TRANSACTIONS (*)
(Quantity in Million)
Period ATMAutomated
ProgrammedDebit
Itaufone BankfoneBankline
Direct Connection
Bankline Internet
ItaufaxPoint on
Sale / Redeshop
Total
1988 107 10 23 - 2 - - - 142 1989 186 12 31 - 3 - - - 232 1990 218 12 36 - 6 - - - 272 1991 211 19 37 - 9 - - - 276 1992 309 27 42 6 16 - 1 - 401 1993 422 39 46 24 26 - 4 - 561 1994 524 54 46 59 36 - 10 1 730 1995 493 78 66 54 42 - 13 3 749 1996 526 98 75 53 41 - 13 7 813 1997 533 123 97 44 50 - 14 14 875 1998 559 138 119 41 68 8 15 23 971 1999 624 160 125 41 83 24 16 34 1,1074th Q/99 161 42 31 10 22 8 4 11 289 1st Q/00 156 43 33 11 22 11 4 10 290 (*) Only Banco Itaú
7870 73
69
57 5864
58 58 57 57
1991
1992
1993
1994
1995
1996
1997
1998
1999
4th Q
/99
1st Q
/00
Efficiency Ratio (%) (*)
(*) For the eff iciency ratio calculation, only recurring results w ere considered.
Efficiency Ratio
The Efficiency Ratio has been devel-oping positively, showing that the ongoingefforts by the Bank to improve efficiency have
been successful. In the first three months of2000, the ratio was 56.6%, an improvementover the 57.3% of the last quarter of last year.
Efficiency Ratio =(Salaries and Employee Benefits + Other Administrative Expenses)
(Net Income from Fianancial Operations + Provision for Loan Losses + Banking Service Fees + Capitalization Premiuns, Insurance and Pension Plans Premiuns - Expenses in Constituing
Techinical Provisions of Insurance, Capitalization and Pension Plan Operations - Insurance Claims - Commerecialization Expenses - Pension Plan Benefits Expenses - Other Operating
Expenses + Other Operating Income)

65
Consolidated
DOLLAR ( SALE PRICE )DOLLAR ( SALE PRICE )DOLLAR ( SALE PRICE )DOLLAR ( SALE PRICE )DOLLAR ( SALE PRICE )
MONTH R$
Dec-98 1.2087Mar-99 1.7220Jun-99 1.7695Sep-99 1.9223Dec-99 1.7890Mar-00 1.7473
Tax Expenses
Tax Expenses in the first quarter of2000 amounted to R$ 141 million, an increaseof 92.3% over the previous quarter. Thecontributing factors to this change were thefollowing:
As of 1 January 2000, ProvisionalMeasure 1991-16/00 revoked the possibilityof offsetting one third of the COFINS actuallypaid with the Social Welfare Contribution duefor the period, increasing the tax expenses;
During the months of January andFebruary, Expenses for IPTU (Building,Territory and Urban Tax) were recorded,arising from the total discounted amount ofthe tax due.
Equity Share in the Income ofSubsidiaries and Affiliates
Equity Share in the Income of Subsid-iaries and Affiliates in the first quarter of 2000reflects the fluctuations in the value of the real
in relation to the dollar during the period.Similar to what happened during the fourthquarter of 1999, changing dollar prices had animpact on the Bank’s permanent investmentsabroad, resulting in a foreign exchange loss ofR$ 69 million and contributing to the negativeresult for the period.
Non-operating Income
For the first quarter of this year, theNon-operating Income of Banco Itaúamounted to R$ 10 million, representing asignificant change in comparison to the R$115million expense of the previous quarter. Thatquarter was marked by a significant additionalprovision for real estate not for own use atmarket price, as a consequence of the revisionand prioritizing of the criteria used in makingthe provision.
Income Tax and Social Welfare Contri-bution
The first three months of 2000, unlikethe last quarter of 1999, showed a net expensefor Income Tax and Social Welfare Contribu-tion. This was due to two factors:
The net revenue of the Income Tax andSocial Welfare Contribution, seen in thefourth quarter of 1999, stemmed basicallyfrom tax impact on the payment of interest onstockholders’equity as a result of the recogni-tion of additional remuneration of stockhold-ers, which is deductible for tax purposes.
BPI SGPS 9 6 2 50% 350%Variation in exchange rates for permanent investiments abroad (69) (207) 34 -67% -303%Others 7 7 (4) 0% -275%
TOTAL (53) (194) 32 -73% -266%
EQUITY SHARE IN INCOME OF SUBSIDIARIES AND AFFILIATES
(R$ Million) 1stQ.00 /
4thQ.991stQ.00 /1stQ.99
1st Q/00 4th Q/99 1st Q/99

66
Consolidated
At the beginning of 2000, such an event didnot occur in the same proportion.
Also, as of Feburary 1, tax legislationreduced the percentage of the Social WelfareContribution over taxable Income from fourpercentage points to one percentage point.Henceforth, a 9% rate of the CSLL is in effect,whereas it was formerly 12%.
Itaú Corretora
Itaú Corretora de Valores brokered avolume of more than R$ 6.3 billion in shareson the BOVESPA during the first quarter of2000. This volume represented a market shareof 5.64% and positioned Itaú Corretora as thesecond largest broker in terms of volume forthe period, an increase of 179% over the sameperiod last year.
Itaú Corretora is investing in hiringprofessionals in all areas of the company andespecially in the area of investment analysisand buy-sell operations of shares over theInternet (HomeBroker). The site for Internetoperations will be launched shortly during thesecond quarter of 2000.
Liquidity and Funding
At first quarter-end of 2000, the bal-ances in Cash and Cash Equivalents, Inter-bank Funds Applied and Securities amountedto R$ 21,340 million, representing a decreaseof 6.2% under the final balance of 1999.
During the first quarter there weresome significant changes in the composition
and volume of the portfolio. Cash and cashequivalents, added to interbank funds applied,went down from R$ 8,863 million in Decem-ber to R$ 5,509 million in March, a 37.8%decrease. The change arose mainly from thetransfer of some securities to the Securitiesitem, mainly to the Bank Deposit Certificatesportfolio which rose to R$ 1,680 million.
In regard to the balance in Deposits, itfell 4.7% in the first quarter of 2000. Part ofthe resources previously placed in demanddeposits were moved to mutual funds, re-corded under off-balance accounts. Thus, thebalance of resources in mutual funds andmanaged portfolios amounted to R$ 34,135million in the period.
Since the requirement for compulsorydeposits on resources in mutual funds wasabolished in August 1999, the fund industryhas experienced steady growth. Instructions302 and 326 from the Securities and Ex-change Commission and Memorandum 2958from the Central Bank, published during thefirst quarter of 2000, guarantee shareholdersaccess to clear and precise information on therisks and possibilities of return on appliedfunds as well as require greater transparencyfrom managers with regards to market andcredit risks. In anticipation of these newrequirements, Banco Itaú had been using theprocedures that became obligatory under therecent legislation.
Memorandum 2969 of the CentralBank reduced the percentage for compulsoryset asides for demand deposits from 65% to55% as of March 20. The liquidity across thenational financial system was thus broadenedby approximately R$3 billion.

67
Consolidated
LIQUIDITLIQUIDITLIQUIDITLIQUIDITLIQUIDITYYYYY
Obs: Securities which comprise mutual fund portfolios in which Itaú and its subsidiaries hold quotas are included above.Investments in third parties funds remain classifield in Mutual Funds.
R$ Million Var.Mar. 00 / Dec. 99 Mar 31, 2000 Dec 31, 1999
We present below a chart with the liquidity position of the Bank, by Cash and CashEquivalents, Interbank Funds Applied and Securities.
Obs.: Securities which comprise mutual fund portfolios in which Itaú and its subsidiaries hold quotas areincluded above.Investments in third parties remain classified in Mutual Funds.
Cash and Cash Equivalents 1,496 1,622 -7.8%
Interbank Funds Applied 4,013 7,240 -44.6%
Money Market 2,257 3,954 -42.9%Interbank deposits 1,757 3,286 -46.5%
Securities 16,719 14,783 13.1%
Public Securities - Brazil 9,738 9,320 4.5% Indexes 2,651 3,107 -14.7% Fixed Income 584 201 190.8% Foreign Currency 5,249 4,979 5.4% DCB - Debt conversion bond and other brazilian debt securities 1,114 926 20.4% Privatization Currencies 92 104 -11.1% Others 47 4 982.2%Public Securities - Other Countries 311 262 18.6% Bond's Argentina 138 57 142.8% Bond's Portugal 167 200 -16.2% Others 6 5 3.6%Private Securities 6,671 5,201 28.3% Bank certificates of deposit 4,321 2,641 63.6% Shares in publicly traded companies 469 497 -5.6% Debentures 339 218 55.3% Mortgages 374 783 -52.2% Options Premiums 12 31 -62.2% Euro Bond’s and others 340 454 -25.3% Others 817 577 41.5%
SUBTOTAL 22,229 23,646 -6.0%
Valuation Allowance (889) (902) -1.5%
TOTAL 21,340 22,743 -6.2%

68
Consolidated
EXTERNAL FUNDING OF BEXTERNAL FUNDING OF BEXTERNAL FUNDING OF BEXTERNAL FUNDING OF BEXTERNAL FUNDING OF BANCO ITANCO ITANCO ITANCO ITANCO ITAAAAAÚ S.A. (OperÚ S.A. (OperÚ S.A. (OperÚ S.A. (OperÚ S.A. (Operations with Pations with Pations with Pations with Pations with Pararararartietietietieties)s)s)s)s)
BREAKDOBREAKDOBREAKDOBREAKDOBREAKDOWN OF DEPWN OF DEPWN OF DEPWN OF DEPWN OF DEPOOOOOSITSITSITSITSITS BS BS BS BS BY MAY MAY MAY MAY MATURITTURITTURITTURITTURITYYYYY
We present below the composition of the Deposits by aging.
In January, Itaú issued US$100 millionin Fixed Rate Notes at an issue price of100.432% of the face value with a 9.25%coupon per year and a yield of 8.812% peryear. In February, more than US$100 million
were again attracted through Fixed RateNotes, this time with an 8.75% coupon peryear, an issue price of 99.641% and a yield of8.95% per year, which reflected the percep-tion of a lesser degree of risk for the period.
( R$ Million ) 0-30 31-180 181-365 +365 Total Total
Demand deposits ( * ) 4,164 0 0 0 4,164 4,547
Saving deposits 14,659 15 0 0 14,674 14,829
Interbank deposits 17 0 0 0 17 283
Time deposits 1,395 1,567 277 37 3,276 3,566
TOTAL 20,235 1,582 277 37 22,131 23,226
( * ) Demand Deposits Include Local and Foreign Currency Deposits.
Mar 31, 2000 Dec 31, 1999Maturity in Days
INSTRUMENT Issue Coordinator AmountUS$ Issue Date Expire Date Coupon
%Spread over Treasury
at Issue (%)
Position in March 31, 2000
Fixed Rate Notes ABN Amro 150,000,000 Apr 19, 1999 Apr 19, 2000 10.50000 6.07000Fixed Rate Notes UBS Ltd. 100,000,000 Apr 28, 1997 Apr 28, 2000 8.25000 1.69000Promissory Notes Banco Itaú S.A. Cayman Branch 20,000,000 May 06, 1999 May 02, 2000 10.50000 5.70700Physical CD (*) Itau Bank Ltd 9,000,000 Jan 25, 2000 May 02, 2000 6.40000 0.75000Promissory Notes Banco Itaú S.A. Cayman Branch 10,000,000 Jun 24, 1999 Jun 23, 2000 9.00000 3.83200Fixed Rate Notes Bankers Trust Co. 100,000,000 Jul 11, 1997 Jul 11, 2000 7.50000 1.37500Fixed Rate Notes ABN Amro 100,000,000 May 17, 1999 Nov 17, 2000 10.00000 5.15700Fixed Rate Notes Barclays Capital 100,000,000 Aug 23, 1999 Feb 23, 2001 9.25000 4.10200Fixed Rate Notes Barclays Capital 100,000,000 Jan 19, 2000 Feb 23, 2001 9.25000 2.85000Fixed Rate Notes Merrill Lynch 100,000,000 Mar 14, 2000 Mar 14, 2002 8.75000 2.35000
TOTAL 789,000,000
(*) Spread O ver Libor.
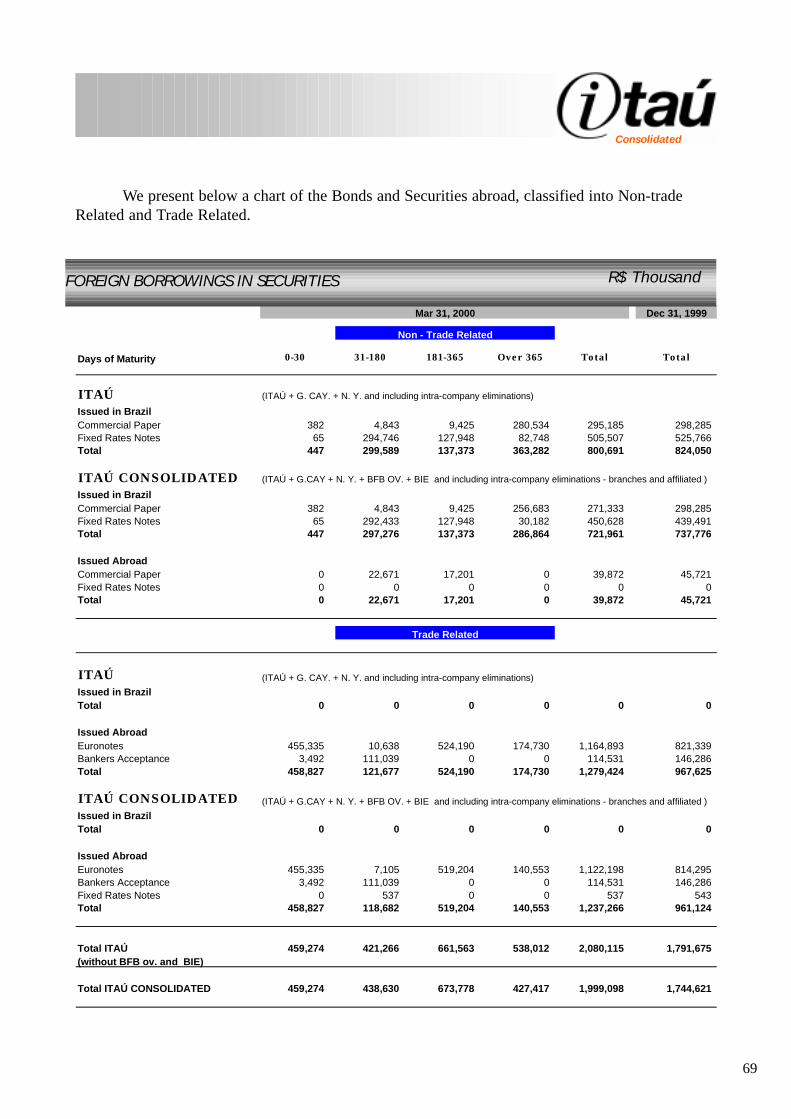
69
Consolidated
Mar 31, 2000 Dec 31, 1999
Days of Maturity 0-30 31-180 181-365 Over 365 Total Total
ITAÚ (ITAÚ + G. CAY. + N. Y. and including intra-company eliminations)
Issued in Brazil Commercial Paper 382 4,843 9,425 280,534 295,185 298,285Fixed Rates Notes 65 294,746 127,948 82,748 505,507 525,766Total 447 299,589 137,373 363,282 800,691 824,050
ITAÚ CONSOLIDATED (ITAÚ + G.CAY + N. Y. + BFB OV. + BIE and including intra-company eliminations - branches and affiliated )
Issued in BrazilCommercial Paper 382 4,843 9,425 256,683 271,333 298,285Fixed Rates Notes 65 292,433 127,948 30,182 450,628 439,491Total 447 297,276 137,373 286,864 721,961 737,776
Issued AbroadCommercial Paper 0 22,671 17,201 0 39,872 45,721Fixed Rates Notes 0 0 0 0 0 0Total 0 22,671 17,201 0 39,872 45,721
Non - Trade Related
ITAÚ (ITAÚ + G. CAY. + N. Y. and including intra-company eliminations)
Issued in BrazilTotal 0 0 0 0 0 0
Issued AbroadEuronotes 455,335 10,638 524,190 174,730 1,164,893 821,339Bankers Acceptance 3,492 111,039 0 0 114,531 146,286Total 458,827 121,677 524,190 174,730 1,279,424 967,625
ITAÚ CONSOLIDATED (ITAÚ + G.CAY + N. Y. + BFB OV. + BIE and including intra-company eliminations - branches and affiliated )
Issued in BrazilTotal 0 0 0 0 0 0
Issued AbroadEuronotes 455,335 7,105 519,204 140,553 1,122,198 814,295Bankers Acceptance 3,492 111,039 0 0 114,531 146,286Fixed Rates Notes 0 537 0 0 537 543Total 458,827 118,682 519,204 140,553 1,237,266 961,124
Total ITAÚ 459,274 421,266 661,563 538,012 2,080,115 1,791,675(without BFB ov. and BIE)
Total ITAÚ CONSOLIDATED 459,274 438,630 673,778 427,417 1,999,098 1,744,621
Trade Related
We present below a chart of the Bonds and Securities abroad, classified into Non-tradeRelated and Trade Related.
FOREIGN BORROWINGS IN SECURITIES R$ Thousand

70
Consolidated
LLLLLOOOOOANS AND GUANS AND GUANS AND GUANS AND GUANS AND GUARANTEES IN LARANTEES IN LARANTEES IN LARANTEES IN LARANTEES IN LOCAL CURRENCYOCAL CURRENCYOCAL CURRENCYOCAL CURRENCYOCAL CURRENCY
R$ Million Mar 31, 2000 Dec 31, 1999 Mar 31, 1999 Var.(%) Var. (%) Dec 31, 1999 Mar 31, 1999
CONSOLIDCONSOLIDCONSOLIDCONSOLIDCONSOLIDAAAAATED FUNDING IN LTED FUNDING IN LTED FUNDING IN LTED FUNDING IN LTED FUNDING IN LOCAL CURRENCYOCAL CURRENCYOCAL CURRENCYOCAL CURRENCYOCAL CURRENCY
We present below a comparative chart of the consolidated resources and the credits andcollateral in Brazilian currency.
Loans / Financing 5,479 5,316 4,347 3.1 26.0Loans / Financing - Real estate 2,885 2,985 3,176 (3.3) (9.1)Farm Financing 885 932 658 (5.1) 34.6Leases 566 504 451 12.3 25.6On-Lending BNDES 1,364 1,333 1,056 2.3 29.1Other Credits (1) 4,847 4,984 4,558 (2.7) 6.3Interbank Fund Applied 1,089 1,142 849 (4.7) 28.3Public securities and Money market 4,681 6,584 8,815 (28.9) (46.9)Endorsements and Sureties 2,300 2,349 2,150 (2.1) 7.0
T O T A L 24,096 26,129 26,060 (7.8) (7.5)
(1) Include: Securities (except public securities), endorsement and sureties and income receivable.
Var. (%) Var (%)Dec 31, 1999 Mar 31, 1999R$ Million Mar 31, 2000 Dec 31, 1999 Mar 31, 1999
Demand deposits 3,951 4,344 3,218 (9.0) 22.8 Savings account 14,373 14,553 14,825 (1.2) (3.0) Technical Prov. of Insurance, Pension Plans and Capitalization 2,236 2,270 2,001 (1.5) 11.8 Time deposits 709 1,229 2,232 (42.3) (68.2) Other Funding from Clients (1) 2,503 1,656 4,908 51.1 (49.0) Mutual Funds - Fixed Income 25,978 23,711 19,427 9.6 33.7 Mutual Funds - Shares and other funds 2,349 1,637 956 43.5 145.7 Asset Managment 5,444 6,241 4,954 (12.8) 9.9 On-Lending Borrowings - BNDES 1,383 1,357 1,005 1.9 37.6 Other Funding from the Market (2) 3,392 4,315 2,090 (21.4) 62.2 Own Working Capital 1,104 945 589 16.8 87.6
T O T A L 63,422 62,258 56,205 1.9 12.8
(1) Include: Acceptances and Endorsements, Collection of Taxes and Contribution, Borrowings and Foreign Exchange Portfolio(2) Include: Interbank Deposits and Money Market Repurchase Commitments

71
Consolidated
Main Loans and GuarMain Loans and GuarMain Loans and GuarMain Loans and GuarMain Loans and Guarantantantantantee in Fee in Fee in Fee in Fee in Forororororeign Curreign Curreign Curreign Curreign Currencyencyencyencyency
Main Programes and Funding in Foreign Currency
In regard to the foreign exchange capitalization, we present below the main credits andcollateral, as well as the main programs and resources of Banco Itaú.
Financing and Guarantees Linked to Trade-Related - Export 1,615 1,627 1,858
Financing and Guarantees Linked to Trade-Related - Import 651 763 992
Other Local Financing of Foreign Subsidiaries 544 503 563
Bond's Portugal 95 109 105
Private Securities (OECD) 79 88 56
Interbank Deposits (OECD) 1,291 1,249 1,042
DCB's / EIB's / IDU's / Globals Bond's 553 445 425
Bonus / CD's / Securities and Investiment Funds 490 328 96
Bond's Argentina 79 32 52
On-Lending - Resolution 63 / 2148 / 2312 757 764 605
Clients 260 353 289
NTN-D 295 203 107
Bonus / Clients 202 208 209
Total 6,154 5,907 5,794
UUUUUS$ MillionS$ MillionS$ MillionS$ MillionS$ Million Mar 2000 Dec 1999 Mar 1999
UUUUUS$ MillionS$ MillionS$ MillionS$ MillionS$ Million Mar 2000 Dec 1999 Mar 1999
Commercial Lines and Structural Funding to Trade Related 2,088 2,166 2,413
Money Market Funding 439 471 377
Structural and Financial International Funding 2,309 1,974 1,674
Funding from Brazilian Interbank Market 10 10 40
Own Working Capital 1,381 1,356 1,199
Total 6,227 5,977 5,704

72
Consolidated
ASSETS
R$ Million
CONSOLIDATEDBUSINESS IN BRAZIL
LOCALCURRENCY
TOTAL FOREIGNCURRNCY
BUSINESSABROAD CONSOLIDATED CONSOLIDATED
MARCH 31, 2000 MARCH 31,1999
DECEMBER 31,1999
LIABILITIES CONSOLIDATEDBUSINESS IN BRAZIL
LOCALCURRENCY
TOTAL FOREIGNCURRENCY
BUSINESSABROAD CONSOLIDATED CONSOLIDATED
MARCH 31, 2000 MARCH 31,2000
DECEMBER 31,1999
Cash and Cash Equivalents 1,496 1,267 522 745 230
Interbank Funds Applied 4,013 3,223 3,201 22 795Money Market 2,257 2,112 2,112 0 145
Interbank deposits 1,757 1,111 1,089 22 650
Securities 15,831 12,066 6,833 5,233 4,935
Interbank and interbranch accounts 6,371 6,368 6,368 0 3
Loan and Leasing Operations 14,445 11,712 10,007 1,705 3,710
Other Assets 8,936 8,510 6,183 2,327 671Foreign Exchange Portfolio 3,117 3,063 764 2,299 54
Other 5,819 5,447 5,419 28 617
Permanent Assets 3,002 5,347 2,721 2,626 282Investments 594 3,079 454 2,626 144
Fixed Assets 2,226 2,103 2,103 0 123
Diferred Expenses 182 165 165 0 15
54,094 48,494 35,836 12,658 10,625
DERIVATIVES - CALL POSITIONFutures 340
Options 0
Swaps 590
13,588
TOTAL
TOTAL ASSETS after ADJUSTMENTS
2,003 1,622
8,039 7,2405,488 3,954
2,551 3,286
13,693 13,881
6,659 4,459
13,071 14,522
8,196 7,2482,704 1,838
5,492 5,410
2,883 2,939478 588
2,288 2,198
117 153
54,545 51,911
21,527 23,2263,373 4,547
15,108 14,829301 283
2,745 3,566
3,599 5,063
4,957 2,952
3,252 494
4,450 3,404
1,450 1,866
7,909 6,5291,243 5636,666 5,966
1,750 1,945
114 121
355 404
5,182 5,9074,421 4,037
761 1,869
54,545 51,911
Deposits 22,131 19,051 19,050 1 3,085Demand deposits 4,164 3,952 3,951 1 217Savings 14,674 14,373 14,373 0 301Interbank 17 17 17 0 0Time 3,276 709 709 0 2,567
Money Market Repurchase Commitments 4,289 3,375 3,375 0 915
Acceptances and Debentures 3,140 3,036 1,142 1,895 1,277
Interbank and Interbranch Accounts 2,504 2,504 2,395 109 0
Borrowings 3,570 2,276 117 2,159 2,128
On-Lending Borrowings 1,900 1,962 1,383 579 0
Other Liabilities 7,993 7,840 6,290 1,551 478Foreign Exchange Portfolio 1,989 1,936 789 1,147 53Others 6,004 5,904 5,500 403 425
Technical Provisions of Insurance, Pension Plans and Capitalization - Not Vinculated 1,904 1,904 1,904 0 0
Deferred Income 143 96 96 0 47
Minoritary Interest in Consolidated Subsidiaries 395 325 325 0 70
Stockholders' Equity 6,125 6,125 6,125 0 2,626Capital and reserves 5,760 5,760 5,760 0 2,597Net Income 365 365 365 0 29
54,094 48,494 42,201 6,293 10,625
DERIVATIVES - PUT POSITIONSFutures (Included Funds under Managment) 2,576
Options 0
Swap (Included Funds under Managment) 2,080
10,949
TOTAL
TOTAL PASSIVO
TOTAL LIABILITIES after ADJUSTMENT
Balance Sheet Consolidated by Currency and Location
We present below the balance sheet bycurrency that shows the balances tied to theBrazilian real and the balances tied to foreign
currencies. The net foreign exchange positionat 31 March 2000 amounted to R$2.639million, including the investments abroad.
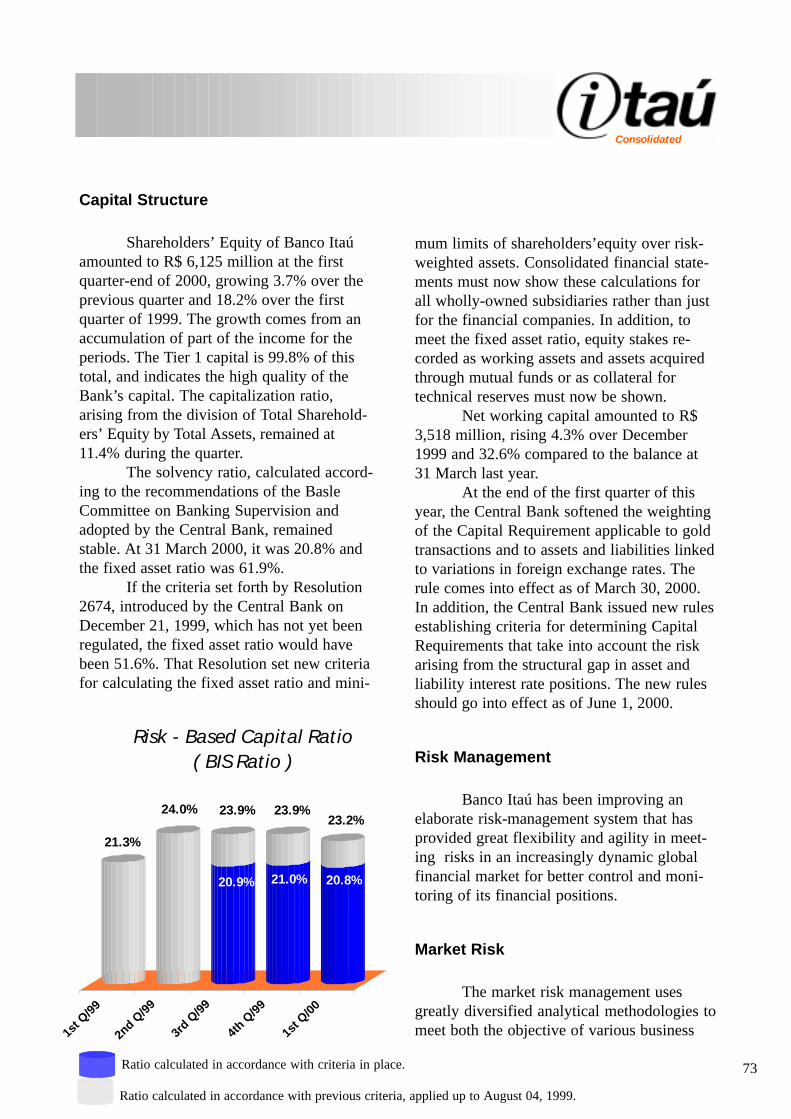
73
Consolidated
21.3%
24.0%
20.9%
23.9%
21.0%
23.9%
20.8%
23.2%
1st Q
/99
2nd Q
/99
3rd Q
/99
4th Q
/99
1st Q
/00
Risk - Based Capital Ratio ( BIS Ratio )
Ratio calculated in accordance with previous criteria, applied up to August 04, 1999.
Ratio calculated in accordance with criteria in place.
Capital Structure
Shareholders’ Equity of Banco Itaúamounted to R$ 6,125 million at the firstquarter-end of 2000, growing 3.7% over theprevious quarter and 18.2% over the firstquarter of 1999. The growth comes from anaccumulation of part of the income for theperiods. The Tier 1 capital is 99.8% of thistotal, and indicates the high quality of theBank’s capital. The capitalization ratio,arising from the division of Total Sharehold-ers’ Equity by Total Assets, remained at11.4% during the quarter.
The solvency ratio, calculated accord-ing to the recommendations of the BasleCommittee on Banking Supervision andadopted by the Central Bank, remainedstable. At 31 March 2000, it was 20.8% andthe fixed asset ratio was 61.9%.
If the criteria set forth by Resolution2674, introduced by the Central Bank onDecember 21, 1999, which has not yet beenregulated, the fixed asset ratio would havebeen 51.6%. That Resolution set new criteriafor calculating the fixed asset ratio and mini-
mum limits of shareholders’equity over risk-weighted assets. Consolidated financial state-ments must now show these calculations forall wholly-owned subsidiaries rather than justfor the financial companies. In addition, tomeet the fixed asset ratio, equity stakes re-corded as working assets and assets acquiredthrough mutual funds or as collateral fortechnical reserves must now be shown.
Net working capital amounted to R$3,518 million, rising 4.3% over December1999 and 32.6% compared to the balance at31 March last year.
At the end of the first quarter of thisyear, the Central Bank softened the weightingof the Capital Requirement applicable to goldtransactions and to assets and liabilities linkedto variations in foreign exchange rates. Therule comes into effect as of March 30, 2000.In addition, the Central Bank issued new rulesestablishing criteria for determining CapitalRequirements that take into account the riskarising from the structural gap in asset andliability interest rate positions. The new rulesshould go into effect as of June 1, 2000.
Risk Management
Banco Itaú has been improving anelaborate risk-management system that hasprovided great flexibility and agility in meet-ing risks in an increasingly dynamic globalfinancial market for better control and moni-toring of its financial positions.
Market Risk
The market risk management usesgreatly diversified analytical methodologies tomeet both the objective of various business

74
Consolidated
strategies and the control of corporate risks.Among them, we point out the following:structural analysis of the gap between assetsand liabilities (Structural Gap), analysis ofpotential losses (Value at Risk: VaR) andpotential risks from extremely unfavorablemarket conditions (VaR-stress).
One of the main techniques for quanti-fying risk is to measure the potential increase(or decrease) of the value of assets (liabilities)due to a change in market factors that may beestimated statistically or projected through apoor market outlook. Statistical models arevalidated on a daily basis through backtestingtechniques and high-risk scenarios are fre-quently revised to guarantee that market risksare never underestimated.
Aiming to guarantee the consistency ofthe use of risk control, historical simulationson risk positions are also carried out to verifythe quality of the result measured by the othermethods used.
The data of the consolidated corporateportfolio, presented in the table below, pro-vide a good view of the market risks managedby the Bank’s businesses. The risk positionrepresented by the Structural Gap tends to be
more stable, due mainly to the fact of beingdefined by assets and liabilities linked toclient operations. Consequently, the VaRlinked to the Structural Gap is more sensitiveto oscillations in market parameters.
In the first quarter of 2000, variousmarkets showed a reduction in volatility, dueto greater economic stability. As a conse-quence, there was a reduction of VaR in thePré and TR Risk factors. In regard to the VaRof the Foreign Exchange Coupon Risk Factor,its increase stems from Itaú’s Foreign Ex-change Portfolio greater exposure to market.
In the table below, we present the VaRof risk positions of the Proprietary TradingDesk at 31 March 2000 compared to the finalposition in 1999, where a small increase in theGlobal VaR can be seen. The area of changeof the Global VaR in the first quarter of 2000was substantially lower than during 1999,indicating a more conservative risk-manage-ment approach.
Table 2 - VaR* of Proprietary Trading Desk (in R$ Million)
VaR BY TRADING DESK Mar 31, 2000 Dec 31, 1999
National Currency Desk 0.4 0.3 Foreign Currency Desk 4.6 5.2 Floating Rate Desk 4.9 2.8 Impact of Diversification (3.6) (2.9)
Global VaR 6.3 5.4 Maximum Global VaR 7.1 21.9 Minimum Global VaR 1.1 0.4
(*) VaR is related to the maximum potential loss of 1 day, within aconfidence interval of 99%.
Table 1 - VaR* of Structural GAP (In R$ Million)
VaR BY RISK FACTOR Mar 31, 2000 Dec 31, 1999
Fixed Rate 3.8 6.0 Referential Rate (TR) 28.7 41.9 Foreign Exchange 49.3 18.8 Impact of Diversification (14.7) (19.7)
Global VaR 67.0 47.0 (*) VaR is related to the maximum potential loss of 1 day, within aconfidence interval of 99%.

75
Consolidated
Liquidity Risk
Liquidity management at Banco Itaúcomprises analysis and daily follow-up tosupply the funds necessary for operationalactivities and for taking advantage of businessopportunities that arise. At the same time, theprocess seeks to preserve the Bank’s capitalthrough the transformation of surplus re-sources into remunerated assets by optimizingthe use of available funds.
Operational Risk
Banco Itaú S/A has taken major ac-tions to prevent operational risk includingsetting up an Internal Control and ComplianceSystem and a Fraud and Illicit Bank ActivitiesPrevention Program.
Through the Itaú Internal Control andCompliance System, we strive to monitoractivities and financial, operational and man-agement information systems as well ascompliance with legal norms and applicableregulations.
The Fraud and Illicit Bank ActivitiesPrevention Program aims to protect the goodname, reputation and image of the Bank bythe avoidance of illegal and fraudulent activi-
ties. Also, it guarantees that the Bank is instrict agreement with all the statutes andregulations by adhering to recognized andacknowledged banking practices.
Credit Risk
Banco Itaú mantains a very high creditportfolio through the efficient management ofrisks in a consolidated and centralized man-ner. The decision-making process for grantingloans adopted by the Bank comprises deci-sion, formalization, monitoring and collectionphases, adapted to the client profile as, large,medium, micro or small companies, in addi-tion to individual profiles. The process ismade operational and controlled by sophisti-cated systems that constantly follow up thequality of the portfolio and guarantee securityin terms of policy compliance and normadherence, providing flexibility in the deci-sion of the business.
Currently, rating clients is the funda-mental tool not only in the credit decision-making process, where it is used as a param-eter for defining credit ceiling limits andcredit concession but also in pricing opera-tions and also helping in the definition of theamount for provision for doubtful debtors.

76
Consolidated
The Bank increased the balance ofloans by 1.2% during the first quarter of 2000.At 31 March 2000, the gross balance of loanswas R$ 17,393 million. The Bank broadenedcompetitiveness of various products duringthe period by reducing lending and financing
rates and extended the maturity dates of itsoperations. To comply with the norms ofResolution 2682, the balance of Other Receiv-ables was added to Credit Operations.
17,393
6,328
11,572
5,531 3,958
8,022
12,325
17.299
20,241
6,366
11,798
5,846 4,634
9,057
14,127
20.005
0
2,000
4,000
6,000
8,000
10,000
12,000
14,000
16,000
18,000
20,000
82 83 84 85 86 87 88 89 90 91 92 93 94 95 96 97 98 99 00
Credit Operations (**) RR$ Million *
Credit Operations Mar.00 Dez.99 Mar.99
Loans 15,123 15,220 13,927Leasing 589 534 452O.Receivables 168 187 154AEC 1,513 1,357 1,314Sub-total 17,393 17,299 15,847Guarantees 2,848 2,706 2,302Total 20,241 20,005 18,149
Credit Operations Mar.00 Dez.99 Mar.99
Loans 15,123 15,220 13,927Leasing 589 534 452O.Receivables 168 187 154AEC 1,513 1,357 1,314Sub-total 17,393 17,299 15,847Guarantees 2,848 2,706 2,302Total 20,241 20,005 18,149
( * ) In currency of Constant Purchasing Power as of December 31, 1995 until then, after whichthe calculation will be made in accordance to the Corporation Lawe ACC/ACE
Credit Operations(1)
Credit Operations and Guarantees(2)
( * * ) Until 1999 (Dec 31st); 2000 (Mar 31st)
( 1 ) Credit Operations: Loans, Leasings, Advances on Exchange Contracts (AEC) andOther Receivables
( 2 ) Guarantees: Endorsements, Sureties and Other Guarantees

77
Consolidated
In the ItIn the ItIn the ItIn the ItIn the Itaú Consaú Consaú Consaú Consaú Consolidatolidatolidatolidatolidated Sted Sted Sted Sted Statatatatatement, the tement, the tement, the tement, the tement, the top debop debop debop debop debtttttors arors arors arors arors are re re re re ratatatatated as fed as fed as fed as fed as folloolloolloolloollows:ws:ws:ws:ws:
Composition of the portfolio by business sector
Mar 31, 2000 Risk % Accum.CLASSIFICATION Risk % Accum.
Dec 31, 1999
Excellent 38.1% 38.1% 39.1% 39.1%Very Go o d 25.9% 64.0% 23.4% 62.5%Go o d 27.0% 91.0% 23.5% 86.0%Satisfacto ry 7.4% 98.3% 11.2% 97.2%Other Ratings 1.7% 100.0% 2.8% 100.0%
Variation (%)Dec/00-Mar/00
PUBLIC SECTOR 695 3.4% 588 3.0% 18.2%Chemical and Petrochemicals 695 3.4% 579 3.0% 20.0%Others - 0.0% 9 0.0% -100.0%
PRIVATE SECTOR 19,546 96.6% 19,008 97.0% 2.8%
INDUSTRY 6,142 30.3% 6,432 32.8% -4.5%Metalurgy, Siderurgy and Mechanics 1,426 7.0% 1,352 6.9% 5.5%Chemical and Petrochemicals 936 4.6% 991 5.1% -5.5%Food and Beverage 1,065 5.3% 1,028 5.2% 3.6%Pulping and Paper 507 2.5% 425 2.2% 19.3%Light and Heavy Vehicles 452 2.2% 640 3.3% -29.4%Eletronic 427 2.1% 410 2.1% 4.1%Textile and Footwear 199 1.0% 272 1.4% -26.8%Autoparts and Accessories 121 0.6% 120 0.6% 0.8%Fetilizers, Insecticides and Defensive 218 1.1% 221 1.1% -1.4%Pharmaceutical 99 0.5% 120 0.6% -17.5%Others 692 3.4% 853 4.4% -18.9%
COMMERCE 996 4.9% 945 4.8% 5.4%SERVICES 3,704 18.3% 3,366 17.2% 10.0%
Finance 1,077 5.3% 924 4.7% 16.6%Energy, Telecommunications and Others 1,453 7.2% 1,220 6.2% 19.1%Others 1,174 5.8% 1,222 6.2% -3.9%
REAL ESTATE 2,889 14.3% 2,929 14.9% -1.4%Individual 2,488 12.3% 2,532 12.9% -1.7%Companies 401 2.0% 397 2.0% 1.0%
PRIMARY SECTOR 945 4.7% 999 5.1% -5.4%Agriculture 400 2.0% 484 2.5% -17.4%Mining 545 2.7% 515 2.6% 5.8%
CONSUMER 3,016 14.9% 2,541 13.0% 18.7%CREDIT CARDS 1,442 7.1% 1,423 7.3% 1.3%OTHERS 412 2.0% 373 1.9% 10.5%
TOTAL 20,241 100.0% 19,596 100.0% 3.3%
Non Accrual Loans and Other Loans (no classif.) * 408
TOTAL GERAL 20,241 20,005
* The concept of CL Asset no longer existed as of 03/31/2000. This amount, incorporated into the portfolio, added toOther Loans in December '99 amounted to R$ 408 MM.
Mar 31, 2000 Dec 31, 1999R$ Million % %
We present below analytical charts containing the composition of the credit portfolio byindustry, the classification of the 100 top debtors, a comparison of the portfolio ranking by clientrating and concentration of top debtors.

78
Consolidated
CONCENTRACONCENTRACONCENTRACONCENTRACONCENTRATION OF LTION OF LTION OF LTION OF LTION OF LOOOOOAN AND LEASING PAN AND LEASING PAN AND LEASING PAN AND LEASING PAN AND LEASING PORORORORORTFOLIOTFOLIOTFOLIOTFOLIOTFOLIO
COMPCOMPCOMPCOMPCOMPARISON OF QUARISON OF QUARISON OF QUARISON OF QUARISON OF QUALITALITALITALITALITY OF PY OF PY OF PY OF PY OF PORORORORORTFOLIO: Small and medium-sized companieTFOLIO: Small and medium-sized companieTFOLIO: Small and medium-sized companieTFOLIO: Small and medium-sized companieTFOLIO: Small and medium-sized companies ands ands ands ands and
individualsindividualsindividualsindividualsindividuals
R$ Million
R$ Million
Mar 31, 2000 Dec 31, 1999 Variation (%) Risk % Accum. Risk % Accum.CLASSIFICATION
Exce llent 0 0.0% 0.0% 0 0.0% 0.0% 0.0%Very Go o d 31 0.4% 0.4% 0 0.0% 0.0% 0.0%Go o d 4,164 51.3% 51.6% 3,345 46.3% 46.3% 24.5%Satisfacto ry 1,944 23.9% 75.6% 1,931 26.7% 73.0% 0.7%To be Mo nito red 1,427 17.6% 93.1% 1,619 22.4% 95.5% -11.9%Red uce Risks 412 5.1% 98.2% 225 3.1% 98.6% 82.6%Specif ic Prov isio n 145 1.8% 100.0% 38 0.5% 99.1% 286.1%Special 621 0.0% 100.0% 64 0.9% 100.0% -99.0%
Su b t o t al 8,124 100.0% 7,222 100.0% 12.5%
In Pro cess o f classif icatio n 187 398 -52.9%PF (Argentina) 250 247 0.9%
To t al o f t h e s m all an d m e d ium -s iz e d co m p an ie s 8,561 7,867 8.8%
COMPCOMPCOMPCOMPCOMPARISON OF QUARISON OF QUARISON OF QUARISON OF QUARISON OF QUALITALITALITALITALITY OF PY OF PY OF PY OF PY OF PORORORORORTFOLIO: CorporTFOLIO: CorporTFOLIO: CorporTFOLIO: CorporTFOLIO: Corporatatatatateeeee
R$ Million Mar 31, 2000 Dec 31, 1999
Variation (%) Risk % Accum. Risk % Accum.CLASSIFICATION
Excellen t 4,080 35.4% 35.4% 4,156 35.7% 35.7% -2%Very Goo d 2,299 20.0% 55.4% 2,237 19.2% 54.9% 3%Goo d 3,314 28.8% 84.2% 2,931 25.2% 80.1% 13%Satisfactory 1,316 11.4% 95.6% 1,748 15.0% 95.1% -25%To b e Mon ito red 333 2.9% 98.5% 339 2.9% 98.0% -2%Red uce Risks 49 0.4% 98.9% 56 0.5% 98.5% -13%Sp ecif ic Prov isio n 81 0.7% 99.6% 101 0.9% 99.4% -20%Sp ecial 44 0.4% 100.0% 62 0.6% 100.0% -28%
Su b t o t al 11,516 100.0% 11,630 100.0% -1%
In Pro cess o f classif ication 164 99 66%
TOTAL CORP ORATE 11,680 11,729 0%
LARGESTGROUP
% ofTOTAL
20 LARGESTGROUP
% ofTOTAL
% ofTOTAL
% ofTOTAL
50 LARGESTGROUP
100 LARGESTGROUP TOTAL
Mar 31, 2000 695 3.4% 4,128 20.4% 6,399 31.6% 8,280 40.9% 20,241Dec 31, 1999* 587 3.0% 4,024 20.5% 6,461 33.0% 8,461 43.2% 19,596
* The concept of CL Asset no longer existed as of 03/31/2000. This amount, incorporated into the portfolio, added to Other Loans in December '99 amounted to R$ 408 MM.
�����������������������������������������������������������������������������������������������������������������������������������������������������������������������������������������������������������������������������������������������

79
Consolidated
Internet
The range of products and financialservices has been significantly broadened bythe Bank, particularly Internet-related onesthrough which it hopes to increase its clientbase and volume of business. The Internetnarrows the relationship channels with clients,creating solid bases to confront the challengesof the “new economy”. The gains in effi-ciency associated with this strategic position-ing are just beginning and will grow signifi-cantly in the near future. Making use of itshigh degree of knowledge about its clientsand based on its expertise in the segmentationprocess, Banco Itaú has been making efficientuse of the innumerable opportunities createdby the Internet by exploring the businessopportunities that arise from it. Also, the Bankhas been analyzing partnership proposals forInternet-development opportunities, privileg-ing the ones that best strengthen its position asa financial service provider and that reinforceits leadership positioning in technology byadding value for its Internet user clients.
Itaú Internet Banking grew 155% in1999 in terms of number of transactions,reaching a level of 509 thousand users. Tostrengthen the relationship with these clients,numerous products were launched or im-proved such as:• Itaú-mail, that sends clients e-mails with
information on demand accounts, savingsor investments automatically on a daily,weekly or monthly basis;
• i-cellbank, that provides clients with shortmessages via cell phone on such topics aschecking account balances;
• Itaú Shopline, a kind of virtual shoppingmall related to e-commerce;
• Payment of public utility and other publicservices such as IPVA (Vehicle Tax) andMandatory Car Insurance via Internet;
• Pre-approved loans.
Banco Itaú has also been investing innew products such as:• Itaú Investnet that provides information to
clients on mutual funds and allows themto simulate or make investments;
• Itaú Prevline, a private pension plan sitewhere users can obtain information onproducts, simulations and investment aswell as advice.
• Itaucard, a credit card site where clientscan obtain information on the benefits ofthe Itaucard, daily billing balances, billpaying and applications/approval for theItaucard and the MaxiConta Card.
Besides this, Banco Itaú has investedsignificantly in sites oriented toward specificmarket segments such as:• Itaú Private Bank with product and market
rate information, news, market overviewand monthly reports on investment forprivate banking clients;
• Itaú Personnalité with a focus onPersonnalité clients, information on prod-ucts and services;
• Itaú Empresas with product and servicesinformation targed at medium-size compa-nies;
• Pequena Empresa, similar to ItaúEmpresas, targeted to small companies
• Itaú e-Asset, for securities custody man-agement;
• Investor Relations, aimed at maintainingtransparent relations with the market andshareholders, providing up-to-date rel-evant information on the Bank.

80
Consolidated
Independent auditors’ report on supplementary information
The Administrative Council and StockholdersBanco Itaú S.A.São Paulo - SP
We have performed a special review, in conformity with the specific norms established by the BrazilianInstitute of Accountants (IBRACON), jointly with the Federal Accounting Council, of the interimreport of Banco Itaú S.A. and of the consolidated interim report of Banco Itaú S.A. and its subsidiariesfor the three-month period ended March 31,2000, and have issued our report thereon dated May 8,2000.
Our works were made for the purpose of reviewing the basic interim report of Banco Itaú S.A. andthe consolidated interim report of Banco Itaú S.A. and its subsidiaries taken as a whole. Thesupplementary information included in the accompanying Management’s Discussion and Analysis ispresented for purposes of additional analysis and is not a required part of the basic interim report.Such information has been subjected to the reviewing procedures applied in the special review of thebasic interim report and, based on our review we are not aware of any significant modifications thatshould be made to the Management’s Discussion and Analysis for it to be presented adequately, in allmaterial respects in relation to the basic interim report taken as a whole.
The Management’s Discussion and Analysis and this report are intended solely for the information ofthe Administrative Council, and others who have received the interim report referred to in the firstparagraph, for use in analyzing that interim report and should not to be used for any other purpose.
May 8, 2000
KPMG Auditores IndependentesCRC 2SP014428/O-6
José Marcelo Bessan Alberto Spilborghs NetoAccountant CRC 1SP129705/O-0 Accountant CRC1SP167455/O-0