Intergenerational Transfers in Form of Unpaid Work in Slovenia
Upload
nathaniel-cooperCategory
view
217download
0
Intergenerational Transfers in Broad Perspective
Ronald Lee
Demography and Economics
University of California, Berkeley

Ronald Lee, Univ Calif, Berkeley; Sept 13, 2005
1. Intergenerational transfers in an evolutionary context
• Parents in many species leave offspring after birth, with no parental care. Then:– Over the life course, each individual can use only the food it forages for
itself at each period and age– Rigid, restrictive budget constraint limits possibilities for development
• Two alternatives for relaxing budget constraint of young– 1. Bequests: parent leaves offspring a capital endowment
• paralyzed prey• a foraging territory • Large nutritious egg, etc.
– 2. Inter vivos intergenerational transfers: with overlapping generations, continuing parental care and investment in offspring is an option, allowing for:
• Postponement of nutritional independence• larger expenditures on growth and development• Pursuit of long term strategies with a high payoff, like brain development.
• I will emphasize inter vivos intergenerational transfers.

Ronald Lee, Univ Calif, Berkeley; Sept 13, 2005
The human evolutionary strategy: key features of contemporary hunter-gatherers
• Long period of child dependency, with heavy adult investments
• Short birth intervals relative to similar primates• Nonetheless overall fertility not high, due to late start. • A mother may have a number of dependent children at
the same time. • This strategy is feasible only with economic contributions
from other family members besides mother (cooperative breeders)– Father and other males– Grandmother and grandfather
Ronald Lee, Univ Calif, Berkeley; Sept 13, 2005
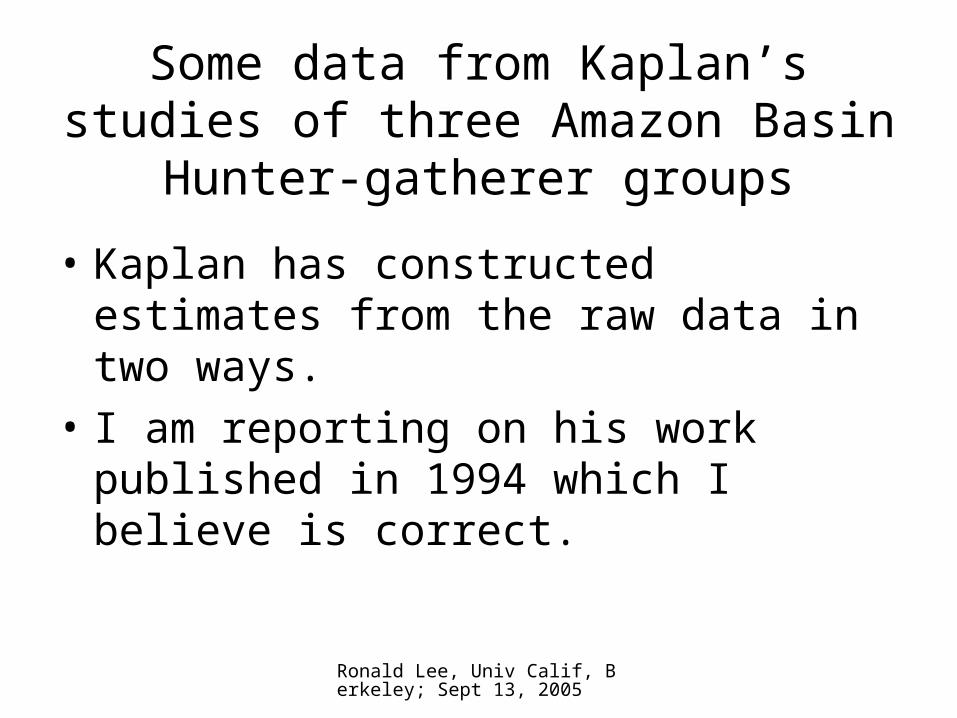
Some data from Kaplan’s studies of three Amazon Basin Hunter-gatherer
groups
• Kaplan has constructed estimates from the raw data in two ways.
• I am reporting on his work published in 1994 which I believe is correct.

Ronald Lee, Univ Calif, Berkeley; Sept 13, 2005
Production and Consumption by Age for the Average of Three Amazonian Hunter-gatherer Groups (Daily Calories)
0
1000
2000
3000
4000
5000
6000
7000
8000
0 10 20 30 40 50 60 70
Age
Cal
ori
es
Production
Consumption
Source: Calculated from Kaplan (1994), see Lee (2000).
Production and Consumption by Age Averaged Across Three Amazon Basin Hunter-Gatherer Groups (Daily Calories)
Production
Consumption
Nutritional independence after age 20

Ronald Lee, Univ Calif, Berkeley; Sept 13, 2005
Production and Consumption by Age for the Average of Three Amazonian Hunter-gatherer Groups (Daily Calories)
0
1000
2000
3000
4000
5000
6000
7000
8000
0 10 20 30 40 50 60 70
Age
Cal
ori
es
Production
Consumption
Source: Calculated from Kaplan (1994), see Lee (2000).
Production and Consumption by Age Averaged Across Three Amazon Basin Hunter-Gatherer Groups (Daily Calories)
Production
Consumption
Raising one child to maturity costs 10+ years of adult consumption

Ronald Lee, Univ Calif, Berkeley; Sept 13, 2005
Production and Consumption by Age for the Average of Three Amazonian Hunter-gatherer Groups (Daily Calories)
0
1000
2000
3000
4000
5000
6000
7000
8000
0 10 20 30 40 50 60 70
Age
Cal
ori
es
Production
Consumption
Source: Calculated from Kaplan (1994), see Lee (2000).
Production and Consumption by Age Averaged Across Three Amazon Basin Hunter-Gatherer Groups (Daily Calories)
Production
Consumption
Elderly remain net producers

Ronald Lee, Univ Calif, Berkeley; Sept 13, 2005
Production and Consumption by Age for the Average of Three Amazonian Hunter-gatherer Groups (Daily Calories)
0
1000
2000
3000
4000
5000
6000
7000
8000
0 10 20 30 40 50 60 70
Age
Cal
ori
es
Production
Consumption
Source: Calculated from Kaplan (1994), see Lee (2000).
Production and Consumption by Age Averaged Across Three Amazon Basin Hunter-Gatherer Groups (Daily Calories)
Production
Consumption
Population weighted average ages
Ac = 24 yrs
Ayl = 35 yrs

Ronald Lee, Univ Calif, Berkeley; Sept 13, 2005
Production and Consumption by Age for the Average of Three Amazonian Hunter-gatherer Groups (Daily Calories)
0
1000
2000
3000
4000
5000
6000
7000
8000
0 10 20 30 40 50 60 70
Age
Cal
ori
es
Production
Consumption
Source: Calculated from Kaplan (1994), see Lee (2000).
Production and Consumption by Age Averaged Across Three Amazon Basin Hunter-Gatherer Groups (Daily Calories)
Production
Consumption
3524
The average calorie is consumed by someone 11 years younger than the producer: income flows downward, from older to younger.

Ronald Lee, Univ Calif, Berkeley; Sept 13, 2005
2. Intergenerational transfers in a modern context
• As in past, transfers allow life course divergence of earnings and consumption.– young can be net consumers– Now old can also be net consumers –
something “new” in last 10,000 years.
• Terminology: I take intergenerational transfers to mean the same as inter-age transfers, not necessarily between discrete generations in the same family.

Ronald Lee, Univ Calif, Berkeley; Sept 13, 2005
Stylized human life cycle for surviving individuals
Age
Output per person per year
Labor earnings, y(x)
Consumption, c(x)
+ +
-
-
-
-

Ronald Lee, Univ Calif, Berkeley; Sept 13, 2005
How do these reallocations across age and time take place?
• By institution, through the family, the market and the state (public sector)
• By mechanism, through borrowing and lending, through investing in physical capital, and through transfers.

Ronald Lee, Univ Calif, Berkeley; Sept 13, 2005
Resource Reallocation Across Age and Time Form of Reallocation
Family
Institution
Market Public Sector
Capital HouseCarConsumer DurablesInventoriesEducation
Factories Inventories Farms
Social Infrastructure(Hospitals, Roads,Airports, Govt. Bldgs)
Transfers Child RearingCollege CostsGiftsBequestsHelp to Elderly
Government Debt Public EducationMedicaid, MedicareSocial SecurityFood StampsAFDC
Borrowing/Lending
Familial Loans"Transfers" with a quid pro quo
Credit Markets (mortgages, credit cards, bond issues)
Government Loans
Hunter-gatherers

Ronald Lee, Univ Calif, Berkeley; Sept 13, 2005
How can we measure and interpret this rich variety of resource flows across age and time?
• One strategy: measure each of these flows in detail, which requires:– Rich data from many sources– Strong assumptions, in some cases– But is surprisingly possible.
• An alternative indirect strategy: estimate broad patterns of production and consumption, and infer the flows that must have occurred.
• I will show methods and results for both approaches, time permitting, but start with second.

Ronald Lee, Univ Calif, Berkeley; Sept 13, 2005
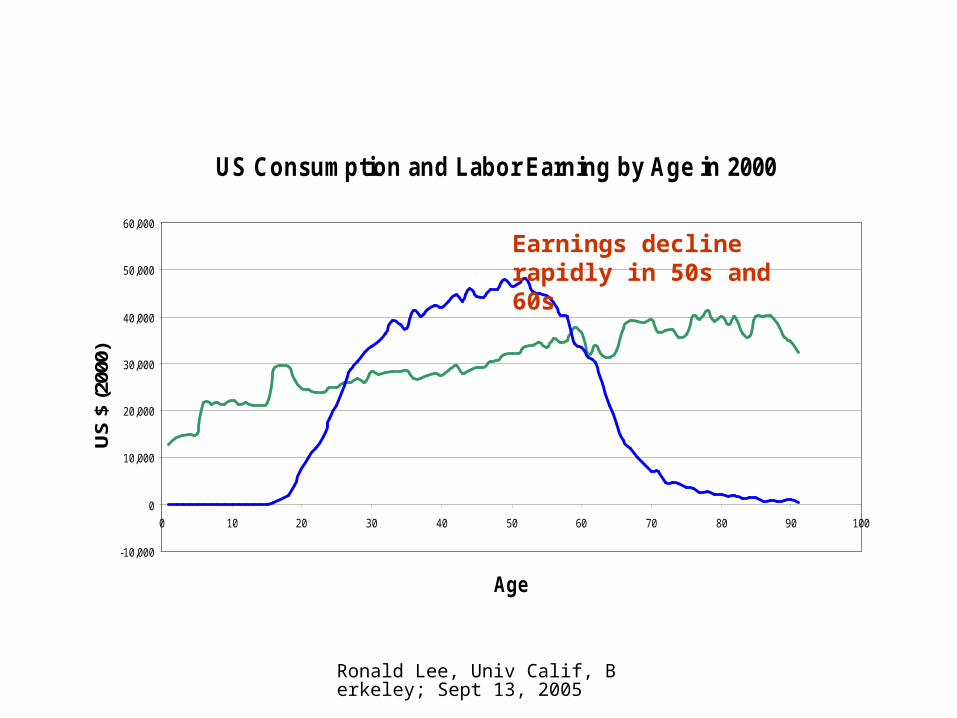
US Consumption and Labor Earning by Age in 2000
-10,000
0
10,000
20,000
30,000
40,000
50,000
60,000
0 10 20 30 40 50 60 70 80 90 100
Age
US
$ (
2000
)
labor earnings
consumption
Ronald Lee, Univ Calif, Berkeley; Sept 13, 2005
US Consumption and Labor Earning by Age in 2000
-10,000
0
10,000
20,000
30,000
40,000
50,000
60,000
0 10 20 30 40 50 60 70 80 90 100
Age
US
$ (
2000
)
labor earnings
consumption
Earnings decline rapidly in 50s and 60s

Ronald Lee, Univ Calif, Berkeley; Sept 13, 2005
US Consumption and Labor Earning by Age in 2000
-10,000
0
10,000
20,000
30,000
40,000
50,000
60,000
0 10 20 30 40 50 60 70 80 90 100
Age
US
$ (
2000
)
labor earnings
consumption
Consumption rises in old age

Ronald Lee, Univ Calif, Berkeley; Sept 13, 2005
US Consumption and Labor Earning by Age in 2000
-10,000
0
10,000
20,000
30,000
40,000
50,000
60,000
0 10 20 30 40 50 60 70 80 90 100
Age
US
$ (
2000
)
labor earnings
consumption
Pop wtd Average ages
Ac = 41 yrs
Ayl = 43 yrs

Ronald Lee, Univ Calif, Berkeley; Sept 13, 2005
4. Comparative Direction of Transfer Flows

Ronald Lee, Univ Calif, Berkeley; Sept 13, 2005
United States [Lee & Miller]-2
+3 2050
Ronald Lee, Univ Calif, Berkeley; Sept 13, 2005
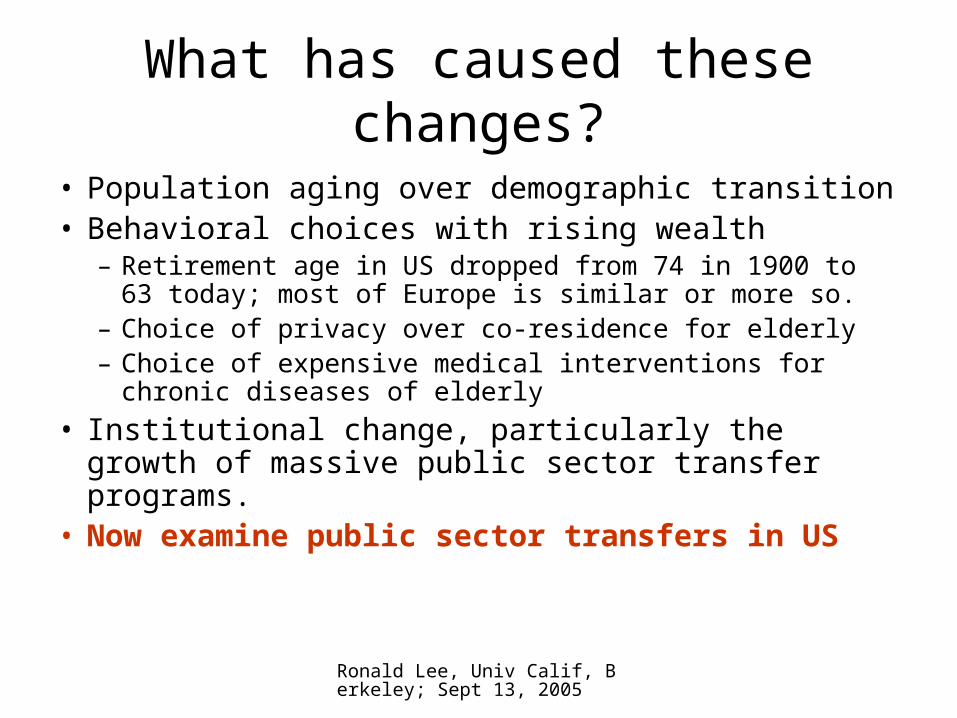
What has caused these changes?
• Population aging over demographic transition• Behavioral choices with rising wealth
– Retirement age in US dropped from 74 in 1900 to 63 today; most of Europe is similar or more so.
– Choice of privacy over co-residence for elderly– Choice of expensive medical interventions for chronic
diseases of elderly
• Institutional change, particularly the growth of massive public sector transfer programs.
• Now examine public sector transfers in US

Ronald Lee, Univ Calif, Berkeley; Sept 13, 2005
Resource Reallocation Across Age and Time Form of Reallocation
Family
Institution
Market Public Sector
Capital HouseCarConsumer DurablesInventoriesEducation
Factories Inventories Farms
Social Infrastructure(Hospitals, Roads,Airports, Govt. Bldgs)
Transfers Child RearingCollege CostsGiftsBequestsHelp to Elderly
Government Debt Public EducationMedicaid, MedicareSocial SecurityFood StampsAFDC
Borrowing/Lending
Familial Loans"Transfers" with a quid pro quo
Credit Markets (mortgages, credit cards, bond issues)
Government Loans
Rest of my talk
Ronald Lee, Univ Calif, Berkeley; Sept 13, 2005
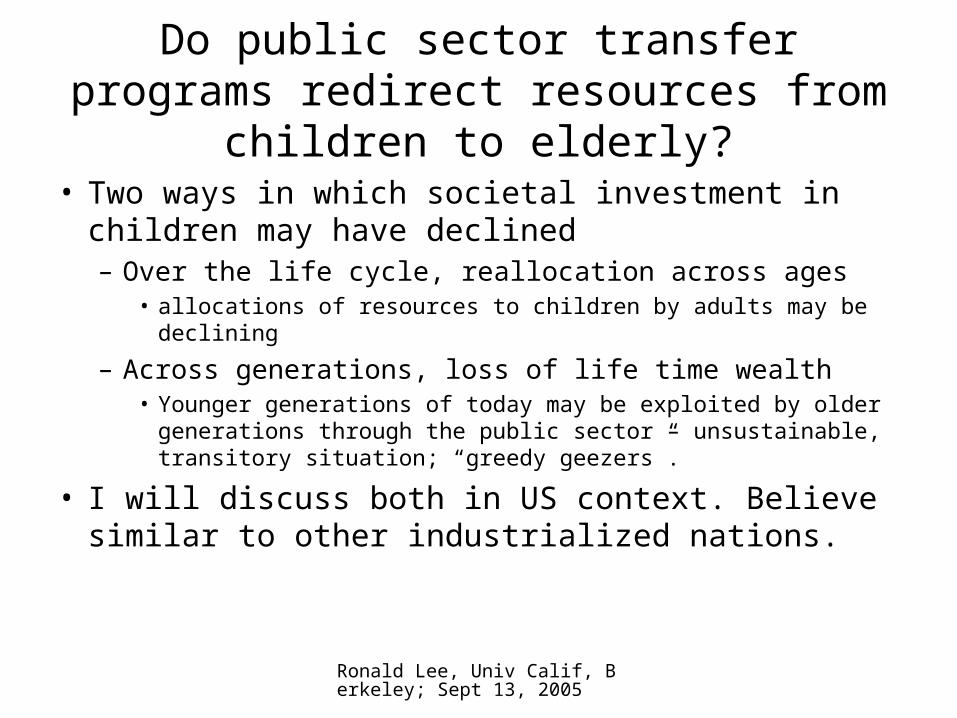
Do public sector transfer programs redirect resources from children to elderly?
• Two ways in which societal investment in children may have declined– Over the life cycle, reallocation across ages
• allocations of resources to children by adults may be declining
– Across generations, loss of life time wealth• Younger generations of today may be exploited by older
generations through the public sector – unsustainable, transitory situation; “greedy geezers”.
• I will discuss both in US context. Believe similar to other industrialized nations.

Ronald Lee, Univ Calif, Berkeley; Sept 13, 2005
5. The growth of public transfer programs in the US
• Examine changing age patterns of major govt transfer programs– Education– Pensions– Health Care
• Cross-sectional view

Ronald Lee, Univ Calif, Berkeley; Sept 13, 2005
Spending on Public Education, Social Security and Medicare as % of GDP, Actual 1850-2000; Projected to 2050

Ronald Lee, Univ Calif, Berkeley; Sept 13, 2005
The changing age profiles of taxes and benefits in the US: 1850, 1930 and 2000 (cross-sectional) (Soc Sec, Educ, Medicare)
1850
1930
2000
Relative to per capita GDP
0 80
Ronald Lee, Univ Calif, Berkeley; Sept 13, 2005
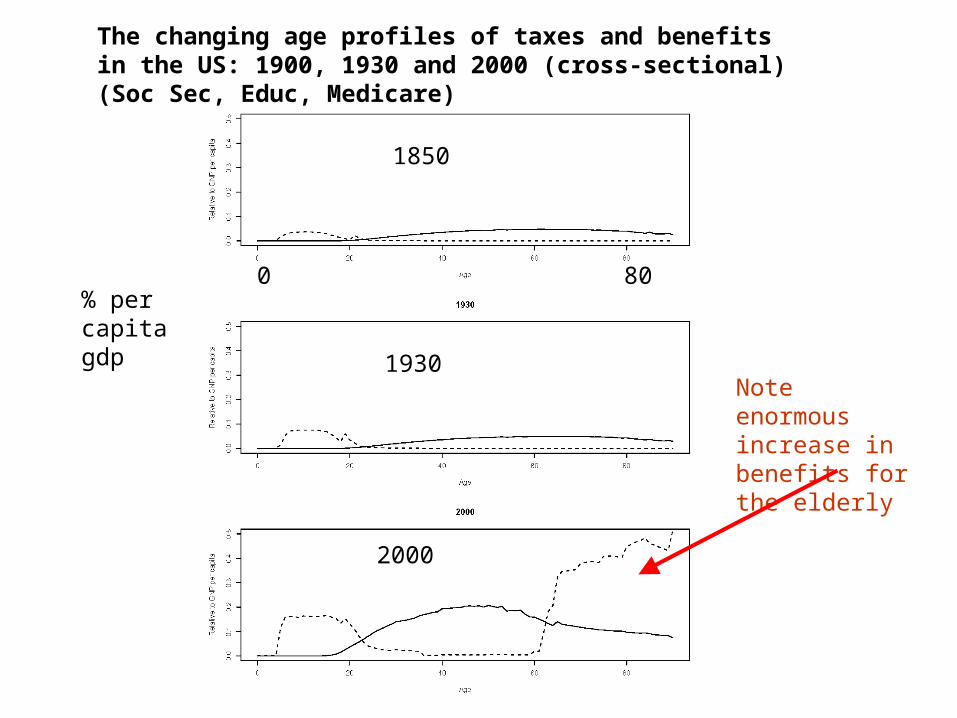
The changing age profiles of taxes and benefits in the US: 1900, 1930 and 2000 (cross-sectional) (Soc Sec, Educ, Medicare)
1850
1930
2000
% per capita gdp
0 80
Note enormous increase in benefits for the elderly

Ronald Lee, Univ Calif, Berkeley; Sept 13, 2005
Public Sector Transfer Flows Reversed Direction in the 1970s, and Their Size Increased Relative to GDP (Soc Sec, Ed, Medicare)
Ronald Lee, Univ Calif, Berkeley; Sept 13, 2005
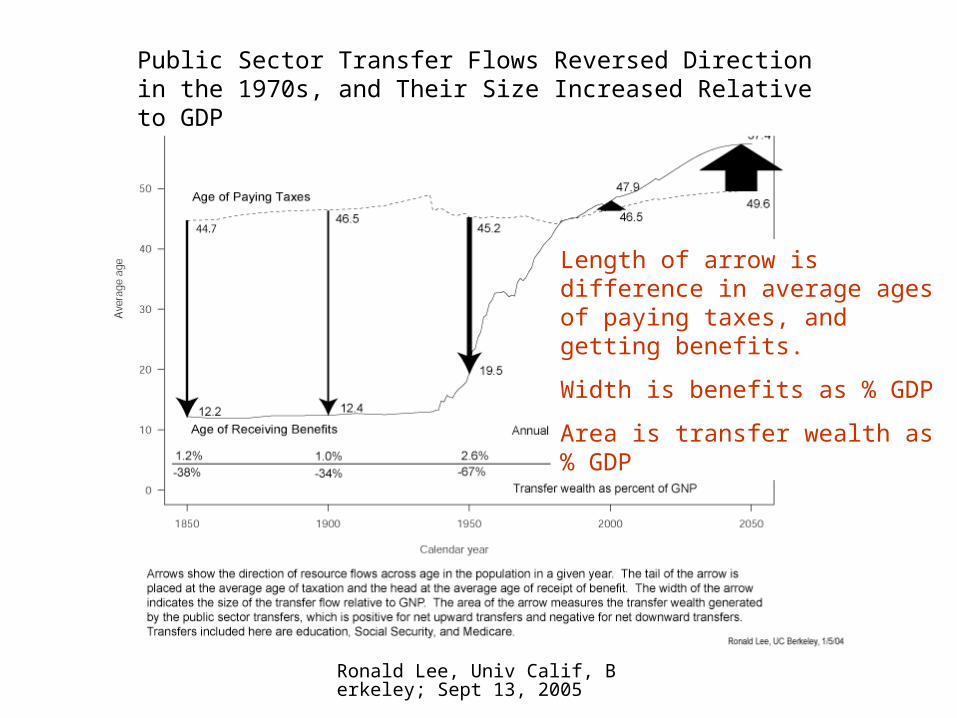
Public Sector Transfer Flows Reversed Direction in the 1970s, and Their Size Increased Relative to GDP
Length of arrow is difference in average ages of paying taxes, and getting benefits.
Width is benefits as % GDP
Area is transfer wealth as % GDP

Ronald Lee, Univ Calif, Berkeley; Sept 13, 2005
Public Sector Transfer Flows Reversed Direction in the 1970s, and Their Size Increased Relative to GDP
Programs will generate large transfer wealth by 2050 – 126% GDP (net of education).

Ronald Lee, Univ Calif, Berkeley; Sept 13, 2005
6. Intergenerational redistribution of these public sector transfers
• Do public transfer programs permit the current elderly to live well at the unfair expense of today’s youth and tomorrow’s newborns?
• “The living and well organized are taking money from the weak and unborn. Over the past few decades we have seen a gigantic transfer of wealth from struggling young families and the next generation to members of the AARP [Elderly].” (David Brooks, NYT, 2/5/05)
• Schematic view: Transfer programs and generational windfall gains

Ronald Lee, Univ Calif, Berkeley; Sept 13, 2005
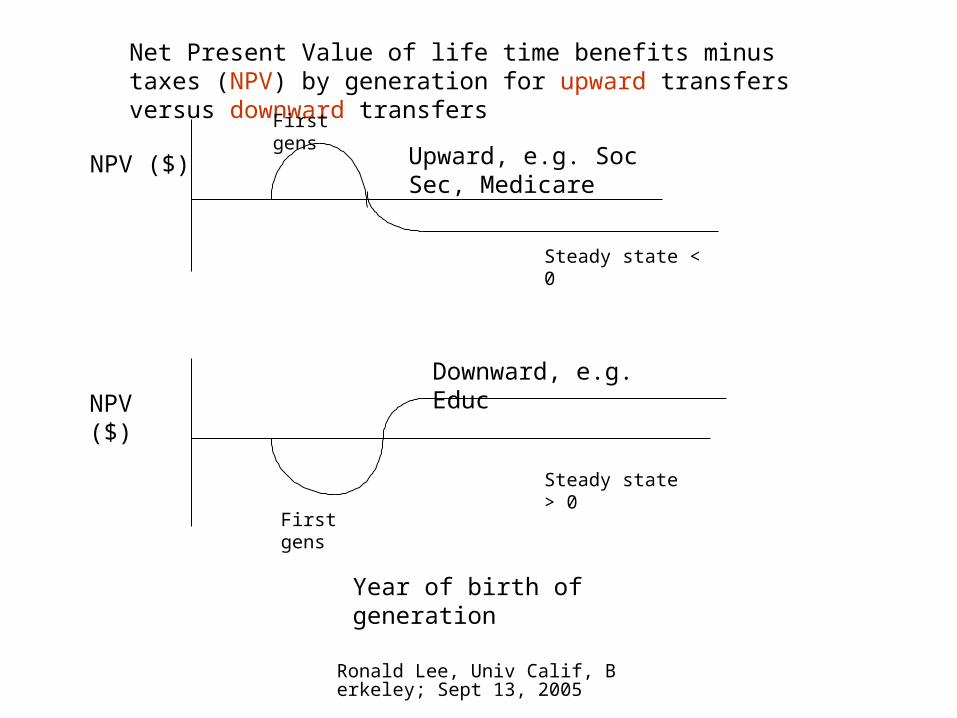
Net Present Value of life time benefits minus taxes (NPV) by generation for upward transfers versus downward transfers
Upward, e.g. Soc Sec, Medicare
NPV ($)
First gens
Steady state < 0
When upward transfers start up, first generations get a windfall gain; later generations pay the price with negative NPVs.
Year of birth of generation
Ronald Lee, Univ Calif, Berkeley; Sept 13, 2005
Net Present Value of life time benefits minus taxes (NPV) by generation for upward transfers versus downward transfers
Upward, e.g. Soc Sec, Medicare
Downward, e.g. Educ
NPV ($)
NPV ($)
Year of birth of generation
First gens
First gens
Steady state < 0
Steady state > 0
When downward transfers start up, the opposite happens: first generation loses, later ones gain.

Ronald Lee, Univ Calif, Berkeley; Sept 13, 2005
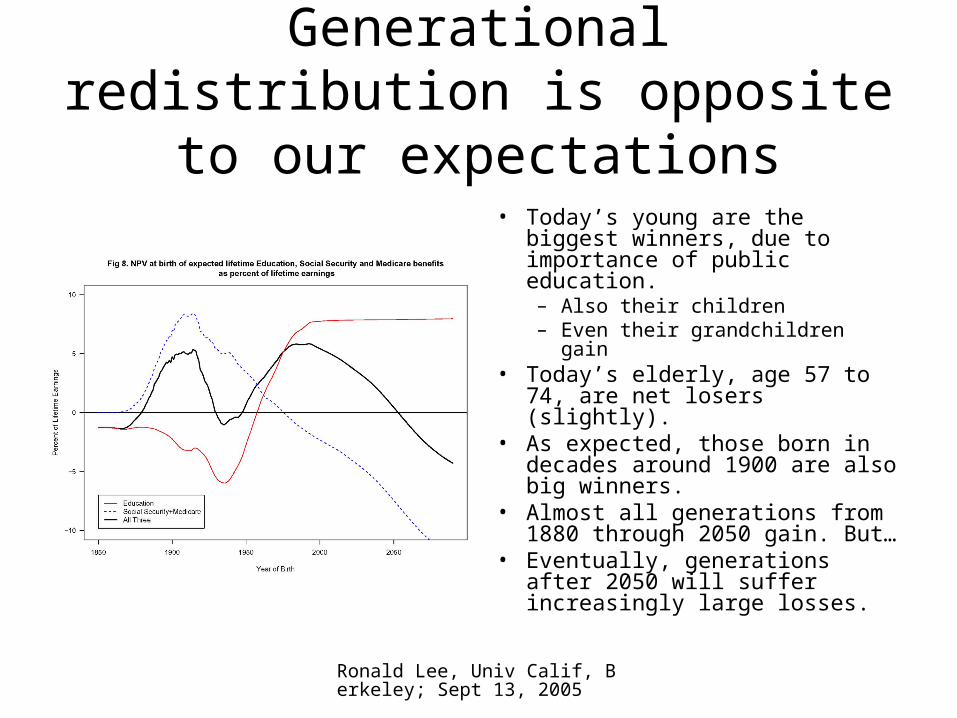
Net Present Value at birth of expected life time benefits for Social Security, Medicare and Public Education as % of lifetime earnings, for generations born 1850 to 2090
Total
Upward (pensions + Medicare)
Downward (public educ)

Ronald Lee, Univ Calif, Berkeley; Sept 13, 2005
Net Present Value at birth of expected life time benefits for Social Security, Medicare and Public Education as % of lifetime earnings, for generations born 1850 to 2090
Total
One dollar of education is worth $12 in old age.
Ronald Lee, Univ Calif, Berkeley; Sept 13, 2005
Generational redistribution is opposite to our expectations
• Today’s young are the biggest winners, due to importance of public education. – Also their children– Even their grandchildren gain
• Today’s elderly, age 57 to 74, are net losers (slightly).
• As expected, those born in decades around 1900 are also big winners.
• Almost all generations from 1880 through 2050 gain. But…
• Eventually, generations after 2050 will suffer increasingly large losses.

Ronald Lee, Univ Calif, Berkeley; Sept 13, 2005
7. Financial Pressures of Population Aging
• Hold age profiles of labor earnings and consumption constant at 2000 levels
• Multiply by changing population age distribution over 21st century.
• How would aggregate consumption need to change to maintain same ratio to labor earnings as in 2000?
• Calculate the support ratio, adjusted to 1.0 for 2000.

Ronald Lee, Univ Calif, Berkeley; Sept 13, 2005
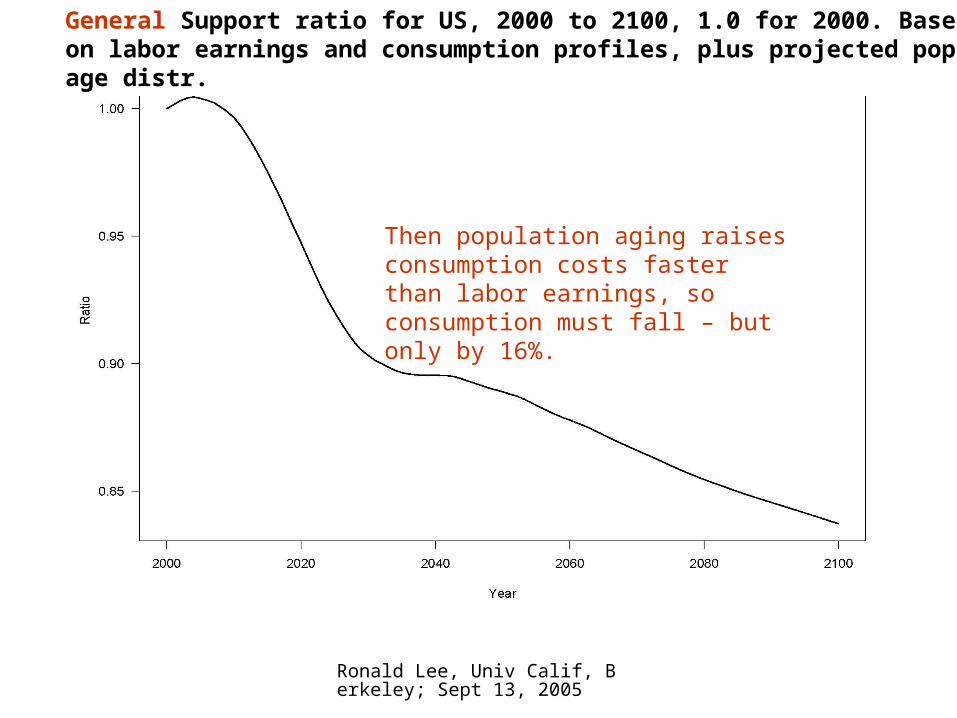
General Support ratio for US, 2000 to 2100, 1.0 for 2000. Based on labor earnings and consumption profiles, plus projected pop age distr.

Ronald Lee, Univ Calif, Berkeley; Sept 13, 2005
Initial slight increase, due to small cohorts turning 65
Support ratio for US, 2000 to 2100, normalized to 1.0 for 2000. Based on labor earnings and consumption profiles shown earlier, plus projected pop age distr.General Support ratio for US, 2000 to 2100, 1.0 for 2000. Based on labor earnings and consumption profiles, plus projected pop age distr.
Ronald Lee, Univ Calif, Berkeley; Sept 13, 2005
Then population aging raises consumption costs faster than labor earnings, so consumption must fall – but only by 16%.
Support ratio for US, 2000 to 2100, normalized to 1.0 for 2000. Based on labor earnings and consumption profiles shown earlier, plus projected pop age distr.General Support ratio for US, 2000 to 2100, 1.0 for 2000. Based on labor earnings and consumption profiles, plus projected pop age distr.

Ronald Lee, Univ Calif, Berkeley; Sept 13, 2005
Average effect on consumption averages < -.2%/yr over century
Support ratio for US, 2000 to 2100, normalized to 1.0 for 2000. Based on labor earnings and consumption profiles shown earlier, plus projected pop age distr.General Support ratio for US, 2000 to 2100, 1.0 for 2000. Based on labor earnings and consumption profiles, plus projected pop age distr.

Ronald Lee, Univ Calif, Berkeley; Sept 13, 2005
We can also use this same exercise to calculate the average ages of
consumption and earnings.

Ronald Lee, Univ Calif, Berkeley; Sept 13, 2005
Av age of consumption
Av age of labor earning
Average ages for Consumption and Labor Earning from the Same Data

Ronald Lee, Univ Calif, Berkeley; Sept 13, 2005
Direction of flows reverses in 2020, due solely to population aging
Average ages for Consumption and Labor Earning from the Same Data

Ronald Lee, Univ Calif, Berkeley; Sept 13, 2005
We can do similar calculations to find fiscal support ratio, based on taxes and benefits
• Here show benefits by age, for several major programs and in total

Ronald Lee, Univ Calif, Berkeley; Sept 13, 2005
Ronald Lee, Univ Calif, Berkeley; Sept 13, 2005
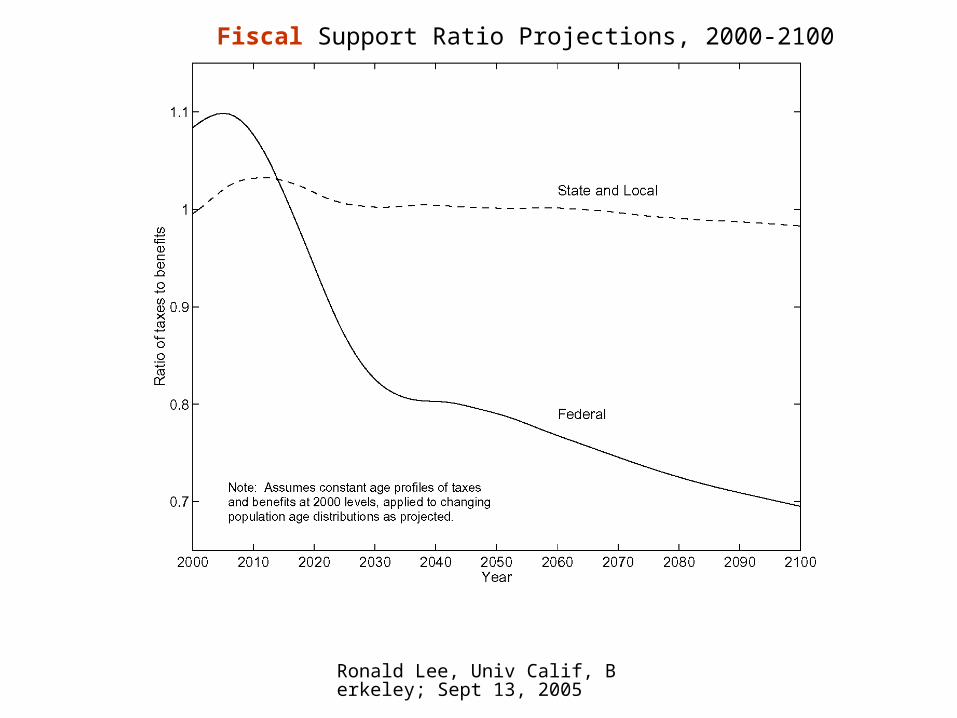
Fiscal Support Ratio Projections, 2000-2100
Ronald Lee, Univ Calif, Berkeley; Sept 13, 2005
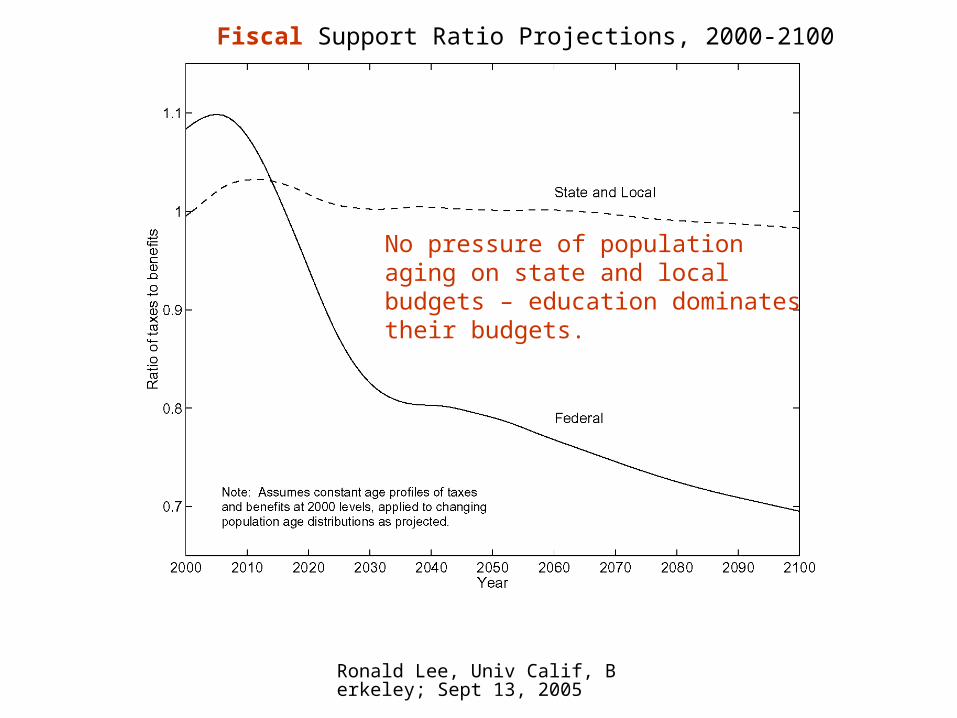
No pressure of population aging on state and local budgets – education dominates their budgets.
Fiscal Support Ratio Projections, 2000-2100

Ronald Lee, Univ Calif, Berkeley; Sept 13, 2005
There is major pressure on the Federal budget, which covers public pensions (Social Security) and health care for the elderly (Medicare)
Fiscal Support Ratio Projections, 2000-2100

Ronald Lee, Univ Calif, Berkeley; Sept 13, 2005
Full-blown fiscal projections also include projected changes in
relative costs of programs, such as rising costs of health care

Ronald Lee, Univ Calif, Berkeley; Sept 13, 2005
Total govt expenditures double relative to GDP
26% rises to 52%

Ronald Lee, Univ Calif, Berkeley; Sept 13, 2005
Expenditures on the elderly triple relative to GDP, from 8% to 26%

Ronald Lee, Univ Calif, Berkeley; Sept 13, 2005
But what will actually happen as populations age?
• Fiscal support ratio tells what benefits we could buy for given tax rate
• Population aging raises price of age-vector of benefits, relative to after tax income
• Expect to substitute away from these benefits as they get more expensive
• Reduce expenditures per elderly and per child, but net effect unknown

Ronald Lee, Univ Calif, Berkeley; Sept 13, 2005
Past experience in OECD consistent with this
• Gruber and Wise do cross-section time series analysis since 1960
• 1% increase in proportion elderly– Raises total expend on elderly by .5%– Reduces expend per elderly by .5%– No increase in total govt expends– Reduction in other expends, including kids
• Lindert does similar analysis, reaches similar conclusions, but less severe.

Ronald Lee, Univ Calif, Berkeley; Sept 13, 2005
8. Discussion
• Originally strongly downward transfers to children by all adults—age asymmetry.
• Now moved to symmetric life cycle – Upward transfers through public sector– Downward transfers within family– Net effect is balance and symmetry
• As population ages, strong fiscal and life cycle pressures from older populations may undercut public and private investments in kids

Ronald Lee, Univ Calif, Berkeley; Sept 13, 2005
Standardized net production by age for US today, and the average for three hunter-gatherer groups (Kaplan, Amazon Basin)

Ronald Lee, Univ Calif, Berkeley; Sept 13, 2005
Are we shortchanging our children for the sake of a pampered old age?
• Comparisons to our evolutionary past are interesting, but cannot guide us today.
• Nonetheless, we should be aware of these changes and their implications.
• Our individual and social choices about work, consumption and leisure, and resources for children and the elderly, should be informed and thoughtful.
• We should consider the options proactively, rather than leaving our existing institutions to grind out their own answers in an aging world.

Ronald Lee, Univ Calif, Berkeley; Sept 13, 2005
END