
Interference Removal on ICP-OES iCAP 7000 Plus Series · PDF filediffer for all spectra, this...
5
Interference Removal on ICP-OES iCAP 7000 Plus Series ICP-OES SmartNotes What is meant by the term interference? In ICP-OES we speak of interference when a result is biased either by other components in the sample itself or due to differences between samples and standards. When analyzing challenging samples, interferences can be a major source of uncertainty in trace determination of a wide range of elements. Strategies to reduce interferences on these analytes involve careful method development but also the help of advanced software tools. This note will clarify which types of interferences are possible in ICP-OES and what causes them but also how to identify, avoid and correct for interferences occurring during analyses.
-
Upload
truongdiep -
Category
Documents
-
view
218 -
download
0
Transcript of Interference Removal on ICP-OES iCAP 7000 Plus Series · PDF filediffer for all spectra, this...
Interference Removal on ICP-OES iCAP 7000 Plus Series ICP-OES
SmartNotesWhat is meant by the term interference?
In ICP-OES we speak of interference when a result is biased either by other components in the sample itself or due to differences between samples and standards. When analyzing challenging samples, interferences can be a major source of uncertainty in trace determination of a wide range of elements. Strategies to reduce interferences on these analytes involve careful method development but also the help of advanced software tools.
This note will clarify which types of interferences are possible in ICP-OES and what causes them but also how to identify, avoid and correct for interferences occurring during analyses.

What types of interferences are there?The three main types of interferences that are encountered during ICP-OES analysis are of spectral, physical and chemical nature.
Spectral interferences are characterized by an overlap (either partial or direct) of the analyte of interest by an interfering element. Also the background signal for determination of an analyte signal can be interfered. These interferences can lead to suppression or enhancement of signals, and thus, false negative or positive results which ultimately degrade the accuracy and precision of the method.
Physical interferences are characterized as a difference between the samples and calibration standards which affect the sample transport or nebulization. These differences can be in viscosity, density, or the matrix (from the sample itself or the digestion/preservation procedure).
Chemical interferences occur when there is a difference in the way that the sample and the calibration standard react in the plasma such as ionization, molecule formation and plasma loading. A special case of chemical interferences emerges when the sample contains a high concentration of easily ionized elements (alkali group elements).
What are background interferences?A spectral background is noise in the measurement, introduced by instrumental parameters, neighboring element wavelengths or effects of the sample matrix. Optical background radiation, as per definition, is dependent both on the temperature and nature of the surface of an object. The higher the temperature of an object, the higher the background radiation. If the object considered is a photo detector, one can easily understand why it has to be cooled – to reduce background radiation in the optical spectrum that is detected. But also the emitted light from the plasma consists of background radiation and other spectral wavelengths from elements in the sample can contribute to elevated background signals. In short, there are various sources for background interferences which cannot easily be controlled by the operator, however these can be corrected for.
How do I know there are interferences?Typically, the Quality Control standards and reference materials will indicate if sample results are out of range. Then, the source of the interference can become obvious in various instances of the sample set results.
Spectral interferences can be detected on multiple ways. Typically, in the sample results a spectrum of the signal intensity of the analyte is displayed (see also How does a typical spectrum originate?). This signal should be centered in the displayed array and have a Gaussian shape. If the signal peak is out of center or shows bumps one can assume that there is a spectral interference. Also, one has to make sure that there are no interferences on the background corrections points.
Figure 1. Interference on left background correction point in the spectral subarray of an analyte (from Thermo Scientific™ Qtegra™ Intelligent Scientific Data Solution™ (ISDS) Software).
Figure 2. Direct interference of two analytes (from Qtegra ISDS Software).
The spectrum from simultaneous ICP-OES spectrometers is usually laid out two-dimensionally. Spectral interferences can therefore be caused by wavelengths nearby the analyte wavelength or those coming from (other orders) above or below the analyte in the spectrum.
Another indication for interferences comes from multiple analyte wavelengths giving dissimilar results. In this case one wavelength is interfered while the other isn’t (or is in a different way by a different interfering analyte).
Physical and chemical interferences can be identified using an internal standard. An internal standard is an element that is not naturally present in the sample, is at a concentration which can be detected well by the method and needs to be added to all samples and calibration standards at the same amount. If the signal of the internal standard changes in the sample set this is very likely due to physical or chemical interferences.
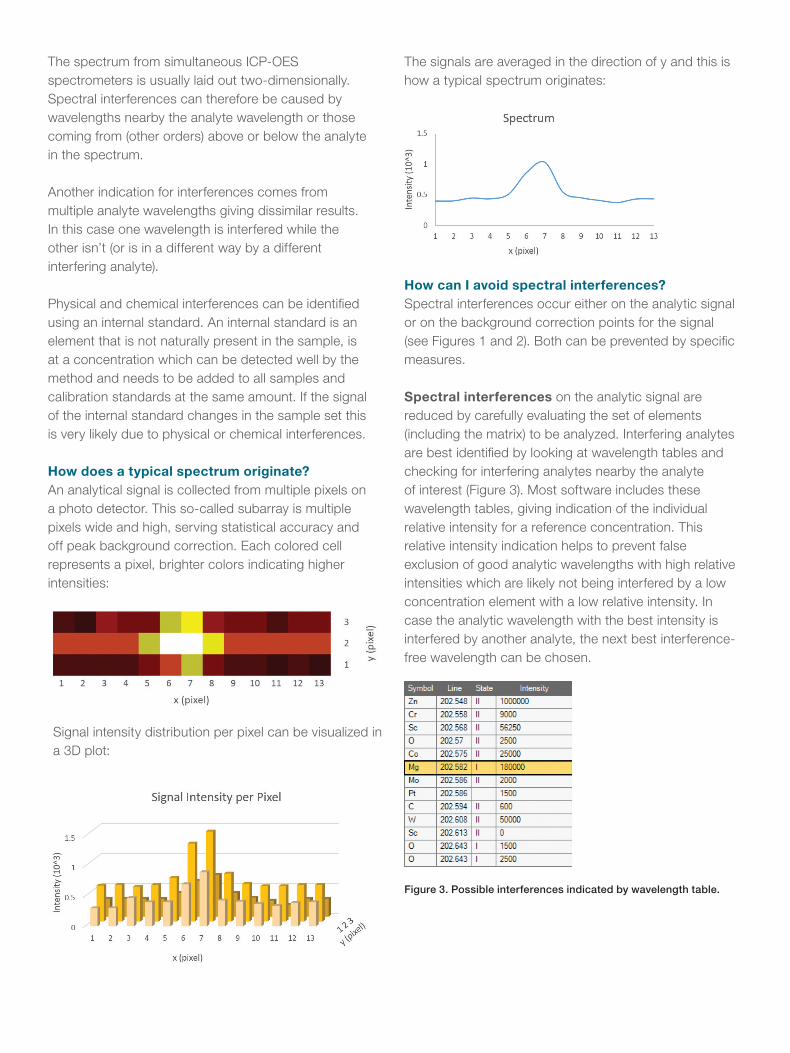
How does a typical spectrum originate?An analytical signal is collected from multiple pixels on a photo detector. This so-called subarray is multiple pixels wide and high, serving statistical accuracy and off peak background correction. Each colored cell represents a pixel, brighter colors indicating higher intensities:
Signal intensity distribution per pixel can be visualized in a 3D plot:
The signals are averaged in the direction of y and this is how a typical spectrum originates:
How can I avoid spectral interferences?Spectral interferences occur either on the analytic signal or on the background correction points for the signal (see Figures 1 and 2). Both can be prevented by specific measures.
Spectral interferences on the analytic signal are reduced by carefully evaluating the set of elements (including the matrix) to be analyzed. Interfering analytes are best identified by looking at wavelength tables and checking for interfering analytes nearby the analyte of interest (Figure 3). Most software includes these wavelength tables, giving indication of the individual relative intensity for a reference concentration. This relative intensity indication helps to prevent false exclusion of good analytic wavelengths with high relative intensities which are likely not being interfered by a low concentration element with a low relative intensity. In case the analytic wavelength with the best intensity is interfered by another analyte, the next best interference-free wavelength can be chosen.
Figure 3. Possible interferences indicated by wavelength table.

Typically, modern instruments can measure 70+ elements simultaneously with multiple wavelengths for each element without increasing analysis time by much. Therefore, selection of multiple wavelengths facilitates finding the right wavelength for analysis. As explained above, selecting analytic wavelengths is a very important part in method development, but also results in tedious manual labor. Advanced software solutions like Qtegra ISDS Software provide tools like the Element Finder plug-in for automatic selection of interference-free wavelengths, making method development much easier.
A special case of spectral interference is the so-called order overlap. When the spectrum is laid out two-dimensionally, element wavelengths that are below or above the analyte can contribute to the analyte signal or its background. To reduce this contribution, one can make the array smaller in which the signal is evaluated.
If the sample contains organic components, the resulting spectrum will be rich in carbon emission, producing a strong background in the high visible region (400-800 nm). This results in worse detection limits for example for sodium and lithium. The effect can be reduced by the addition of oxygen to the plasma gas. The oxygen burns the carbon in the sample, reducing background intensities in the visible range and improving detection limits for the elements observed in that region. Unfortunately, adding oxygen to the plasma gas also means introducing a strong carbon oxide spectrum, disturbing trace analysis of wavelengths below 240 nm, therefore it is not a universal solution to avoid interferences from organic matrices.
Background correction is typically done by setting appropriate background correction points on both sides of the analyte signal of interest. Like this, an averaged background for the analyte signal is calculated. If there is an interference on a background correction point, this can have two sources: the matrix of the sample type (e.g. an acid or organic solvent) or another analyte with varying concentration in the sample. To find out which type of interference is present, one can overlay the spectra of all analyzed solutions (including the calibration). If the background interference does not differ for all spectra, this is a matrix interference and the background correction points can be used. However, if the background interference signal is changing, another location for the background correction has to be selected.
In case no appropriate background correction point can be found in the displayed array, either a wider spectrum may offer additional positions for background correction or one has to go with one background correction point only. In general, careful selection of the background correction points as described above helps to avoid this kind of interference.
If I cannot avoid spectral interferences, how do I correct for them?Sometimes, e.g. when highest sensitivity is needed, a wavelength has to be chosen that is interfered by another analyte. This is mostly the case with very complex emission spectra, for example in environmental, metallurgical or geological applications. Two types of interferences can occur here. Wing overlaps are those where one analyte contributes to the signal of the other, but both peaks are visually separated. And then there are direct overlaps which are indicated by a bump in the Gaussian curve of the spectrum or sometimes this is not even visible (Figure 2). When wing overlaps occur, the integration area needs to be shifted slightly to the other wing of the analyte signal. In case of a direct spectral overlap, an inter-element correction (IEC) needs to take place. To set up an IEC for a method the interferent must first be identified. This can be done by checking wavelength tables manually, however some software features allow for easy identification by clicking on the interferent peak and direct visualization of the interfering wavelength in an implemented interference table (Figure 3). When the interfering element is identified, a primary wavelength has to be added to the method and a single element solution needs to be analyzed as a sample (to avoid further interferences, it must be a single element solution), which allows the apparent intensity of the interferent to be read as a false positive analyte intensity. An IEC correction factor can now be calculated from the intensities of the primary interferent and the analyte wavelengths. In advanced analytic software this calculation is done automatically and the factor is applied to all following results (Figure 4).
Figure 4. Example of iron interference on boron in soil samples. 100 ppm of iron contributes 0.25 ppm to B 249.773 nm. Inter-element correction (IEC) in Qtegra ISDS Software switched on (above) and switched off (below).

Find out more at thermofisher.com/ICP-OES
© 2017 Thermo Fisher Scientific Inc. All rights reserved. All trademarks are the property of Thermo Fisher Scientific and its subsidiaries unless otherwise specified. SN43351-EN 0617
Most chemical and physical interferences can be corrected for by matrix matching of samples and standards. A good indication of the efficiency of this procedure is an internal standard. Internal standards are used for dynamic drift corrections working by the principle of referencing all analyte signals to the performance of the signal of the internal standard. The correction is then applied to the sample in accordance with the suppression or enhancement of signal experienced by the internal standard element.
There are some necessary prerequisites for an internal standard:
• The internal standard cannot be present in the sample.
• The internal standard has to be added precisely and accurately to all solutions. (For accurate addition to all standards and samples, the internal standard may be added online during sample introduction.)
• The internal standard must react similarly to the analyte in the plasma – a matching of the state (ion or atom) and wavelength region (UV or visible) is very important.
• The internal standard wavelength must be interference free and background correction must be used appropriately.
As a last resort, when none of the above is possible or still leads to inaccurate results, the method of standard addition can be applied. In this method, the standard is added with different quantities to aliquots of one sample, therefore calibration takes place inside the sample. Linearity over the experienced calibration range is a necessary premise.
Now I know a lot about spectral interferences, but how about physical and chemical interferences? What are for example easily ionized elements?The elements present in the plasma are in the forms of both atoms and ions and exist in equilibrium. Analysis by ICP-OES can be performed using wavelengths either derived from these atoms or ions. Typical easily ionized elements (EIE) are alkali and earth alkali elements that have a very low ionization energy and therefore easily lose an electron under the influence of a plasma. The electrons that the EIE lose are available for other elements in the plasma forming more atoms. This causes a shift in the equilibrium between ions and atoms and results in an apparent change in the concentration of the analyte.
To avoid false results from the presence of easily ionized elements, an ionization buffer can be added to all solutions. Typically, cesium is used as an ionization buffer and added in excess so that the equilibrium in the plasma will be stabilized.
What about other physical and chemical interferences, how do I correct for those?In general, but especially also in the above case of easily ionized elements, the easiest step to minimize physical and chemical interferences is to dilute the sample. This will adjust the matrix of the sample to that of the standards but also decrease the concentration of components that may lead to e.g. ionization effects. However, dilution also always means a decrease of method detection limits. Therefore, sometimes another correction technique becomes necessary.