Interfacial Studies of Single-Fibre Aramid/Epoxy ... fileNe dengan panjang gelombang 623.8 nm dan...
14
Interfacial Studies of Single-Fibre Aramid/Epoxy Composites using Raman Spectroscopy I. Ahmad 1,* and R. J. Young 2 1 Pusat Pengajian Sains Kimia dan Teknologi Makanan Fakulti Sains dan Teknologi, Universiti Kebangsaan Malaysia (UKM) 43600 Bangi, Selangor, MALAYSIA 2 Manchester Materials Science Centre, UMIST, Manchester, M1 7HS UK * Corresponding author : [email protected] Abstract : The interfaces between the Twaron aramid fibre and polymer matrices have been studied using the technique of Raman Spectroscopy. Raman spectra were obtained from the aramid fibres, using 623.8 nm red line of He-Ne laser focused to a 5 μm spot on the surface of the fibre during fibre deformation. The linear strain-dependent shift of Raman bands obtained from the fibre in air is used to calibrate the Raman band shifts, obtained from the fibre embedded in the matrix during the pull-out process. The distribution of interfacial shear stress is then derived from the point-to-point variation of axial fibre strain using partial debonding model. The Twaron fibres used in this present study are two different Twaron 2200 high modulus fibres. The fibres employed had either no surface treatment (TNHM) or had been treated with epoxy-based adhesion-activating finish (TNHMA). It was found that the finish with an epoxy activation (TNHMA) improved the fibre/matrix adhesion compare to the fibre with no surface treatment (TNHM). There was also no evidence of debonding along the embedded fibre in the matrix for the TNHMA fibre. Abstrak : Kajian antaramuka di antara gentian aramid Twaron dan matriks polimer telah dilakukan menggunakan teknik spektroskopi raman. Spektrum raman diperolehi menggunakan pancaran laser He- Ne dengan panjang gelombang 623.8 nm dan diameter 5 μm yang dipancarkan pada permukaan gentian aramid semasa proses tarik-keluar (pull-out). Anjakan raman semasa ujian tersebut digunakan untuk mendapatkan nilai terikan pada permukaan gentian secara kaedah kalibrasi hubungan terikan linear- anjakan jalur raman yang diperolehi tanpa regangan. Penyebaran kekuatan ricih antaramuka sepanjang gentian di dalam matriks polimer kemudiannya diperolehi menggunakan model ‘partial-debonding’. Dua jenis gentian Twaron digunakan dalam kajian ini iaitu gentian tanpa rawatan (TNHM) dan gentian yang dirawat dengan pelekat-aktif epoksi (TNHMA). Didapati bahawa gentian TNHMA memperbaiki daya lekatan antaramuka gentian/matriks berbanding gentian TNHM. Keputusan juga menunjukkan bahawa tidak berlaku gelincir ricih untuk gentian TNHMA di mana gentian tidak boleh ditarik keluar sebaliknya putus apabila daya berlebihan dikenakan. Keywords: aramid, epoxy, pull-out, Raman spectroscopy Received : 14.05.04 ; accepted : 13.12.04 Introduction The study of interfaces in composite systems is essential for the development of an understanding of science and technology of composite materials. An important property of the interface that can greatly affect the mechanical behaviour is the strength of adhesive bonding between the phases. When a load is applied to a fibre-reinforced composite, the load is transferred between the fibre and the matrix through the interface [1]. Several micromechanical test methods have been developed to determine the interfacial properties of a composite by measuring the level of adhesion between a reinforcing fibre and a resin matrix [2,3,4]. One of these is the single fibre pull-out test using Raman spectroscopy based upon the deformation of a single-fibre partially embedded in a resin matrix until failure of either the fibre or the interface occurs. The level of interfacial adhesion is usually characterized by the interfacial shear strength (IFSS). Aramid fibres are ideal for the strain analysis using Raman Spectroscopy because they have well- defined Raman spectra and significant stress induced band shifts [5]. They have also become an important Malaysian Journal of Chemistry, 2004, Vol. 6, No. 1, 091 - 104
-
Upload
nguyenmien -
Category
Documents
-
view
216 -
download
0
Transcript of Interfacial Studies of Single-Fibre Aramid/Epoxy ... fileNe dengan panjang gelombang 623.8 nm dan...

Interfacial Studies of Single-Fibre Aramid/Epoxy Composites using Raman Spectroscopy
I. Ahmad1,∗∗∗∗ and R. J. Young2
1Pusat Pengajian Sains Kimia dan Teknologi Makanan Fakulti Sains dan Teknologi, Universiti Kebangsaan Malaysia (UKM)
43600 Bangi, Selangor, MALAYSIA 2Manchester Materials Science Centre, UMIST, Manchester, M1 7HS UK
∗ Corresponding author : [email protected]
Abstract : The interfaces between the Twaron aramid fibre and polymer matrices have been studied using the technique of Raman Spectroscopy. Raman spectra were obtained from the aramid fibres, using 623.8 nm red line of He-Ne laser focused to a 5 µm spot on the surface of the fibre during fibre deformation. The linear strain-dependent shift of Raman bands obtained from the fibre in air is used to calibrate the Raman band shifts, obtained from the fibre embedded in the matrix during the pull-out process. The distribution of interfacial shear stress is then derived from the point-to-point variation of axial fibre strain using partial debonding model. The Twaron fibres used in this present study are two different Twaron 2200 high modulus fibres. The fibres employed had either no surface treatment (TNHM) or had been treated with epoxy-based adhesion-activating finish (TNHMA). It was found that the finish with an epoxy activation (TNHMA) improved the fibre/matrix adhesion compare to the fibre with no surface treatment (TNHM). There was also no evidence of debonding along the embedded fibre in the matrix for the TNHMA fibre. Abstrak : Kajian antaramuka di antara gentian aramid Twaron dan matriks polimer telah dilakukan menggunakan teknik spektroskopi raman. Spektrum raman diperolehi menggunakan pancaran laser He-Ne dengan panjang gelombang 623.8 nm dan diameter 5 µm yang dipancarkan pada permukaan gentian aramid semasa proses tarik-keluar (pull-out). Anjakan raman semasa ujian tersebut digunakan untuk mendapatkan nilai terikan pada permukaan gentian secara kaedah kalibrasi hubungan terikan linear-anjakan jalur raman yang diperolehi tanpa regangan. Penyebaran kekuatan ricih antaramuka sepanjang gentian di dalam matriks polimer kemudiannya diperolehi menggunakan model ‘partial-debonding’. Dua jenis gentian Twaron digunakan dalam kajian ini iaitu gentian tanpa rawatan (TNHM) dan gentian yang dirawat dengan pelekat-aktif epoksi (TNHMA). Didapati bahawa gentian TNHMA memperbaiki daya lekatan antaramuka gentian/matriks berbanding gentian TNHM. Keputusan juga menunjukkan bahawa tidak berlaku gelincir ricih untuk gentian TNHMA di mana gentian tidak boleh ditarik keluar sebaliknya putus apabila daya berlebihan dikenakan. Keywords: aramid, epoxy, pull-out, Raman spectroscopy
Received : 14.05.04 ; accepted : 13.12.04
Introduction The study of interfaces in composite systems is
essential for the development of an understanding of science and technology of composite materials. An important property of the interface that can greatly affect the mechanical behaviour is the strength of adhesive bonding between the phases. When a load is applied to a fibre-reinforced composite, the load is transferred between the fibre and the matrix through the interface [1]. Several micromechanical test methods have been developed to determine the interfacial properties of a composite by measuring the
level of adhesion between a reinforcing fibre and a resin matrix [2,3,4]. One of these is the single fibre pull-out test using Raman spectroscopy based upon the deformation of a single-fibre partially embedded in a resin matrix until failure of either the fibre or the interface occurs. The level of interfacial adhesion is usually characterized by the interfacial shear strength (IFSS).
Aramid fibres are ideal for the strain analysis using Raman Spectroscopy because they have well-defined Raman spectra and significant stress induced band shifts [5]. They have also become an important
Malaysian Journal of Chemistry, 2004, Vol. 6, No. 1, 091 - 104

materials used both on their own and as a reinforcements in organic matrix composites. Their growing importance is due to the fibres’ excellent mechanical, physical and chemical properties, i.e. high strength and modulus, high-energy absorption and good chemical resistance [6].
This study has been undertaken to examine the interaction between aramid fibres with different surface treatment and epoxy matrix by using Raman spectroscopy. The linear strain-dependent shift of Raman bands obtained from the fibre in air is used to calibrate the Raman band shifts, obtained from the fibre embedded in an optically transparent matrix during the pull-out process. The distribution of interfacial shear stress is then derived from the point-to-point variation of axial fibre strain. The experimental fibre strain and shear stress distributions obtained using Raman technique are then compared with the predictions from the partial-debonding model. Stress Transfer Model 1. Elastic stress transfer
Piggott [7] proposed a shear-lag model which analyzed the transfer of elastic stress from the bonded fibre to the matrix during the pull-out process with a fibre embedded in a polymer over a length, Le and gripped at the point where it leaves the resin. Application of a strain to the fibre, εapp, in order to extract the fibre from the polymer matrix creates a stress distribution within the embedded region of the fibre that declines with a distance x from the polymer surface. If it assumed that there is no bonding across the fibre end, then the distribution of strain in a fibre of a radius r, is given by [8].
( )[ ]
[ ]nsrxLn e
f sinh/sinh
o
−ε=ε (1)
where εo is the nominal fibre axial strain at x = 0, x is the distance from the point where the fibre enters the resin block, εf is the axial strain in the embedded region of the fibre at distance x from the resin surface, and s is the fibre aspect ration, Le/r. The parameter n is given by
( )nE
E v Rr
m
f m
2
1=
+( ) ln (2)
where Em is the matrix modulus, Ef is the fibre modulus, vm is the matrix Poisson ratio and ln(R/r) can be considered to be a volume fraction parameter.
The corresponding interfacial shear stress, τ, is obtained from the consideration of the equilibrium of forces exerted on a differential fibre element of length dx [9]:
xr
E ff d
d
2
ε=τ (3)
Differentiation of Equation (1) and substitution into Equation (3) yields:
[ ][ ]ns
rxLnE
n ef sinh
/)(cosh2 o
−ε=τ (4)
2. Debonding Model
The interfacial shear stress is often evaluated from the load-displacement curve for the pull-out of the fibre from the matrix using the Kelly-Tyson pull-out model that assumes a constant shear stress along the fibre [10]:
τ = τi (5)
where τi is frictional shear stress. In the complete debonding model, it is assumed that the interface is debonded along the fibre in the matrix and stress is transferred from the fibre to the matrix via friction only.
For a pull-out specimen when the interface fails by debonding, a simple force balance gives [8]:
r
if τ−=σ 2dx
d (6)
Integration of Equation (6) with the boundary condition σf = 0 at distance x = Le yields:
)(2
xLrE e
f
if −τ=ε (7)
A constant shear stress at the interface implied through Equation (5) is due to the fibre strain in the embedded region decreasing from the point where the fibre enters the resin. 3. Partial Debonding Model The elastic and debonding theories proposed by Piggott [7] can be modified to model the partial debonding behaviour of single-fibre composites. Two expressions were derived for the pull-out test. For the debonded region, the stress distribution is similar to the Kelly-Tyson model. It can be seen using Raman
92 I. Ahmad and R. J. Young Interfacial Studies of Single-Fibre Aramid/Epoxy Composite using Raman Spectroscopy

technique that the linear decrease in strain in the debonded region is defined by an imaginary point x = i. Equation (7) then becomes;
( )xirE f
if −τ=ε 2
(8)
The first region along the embedded fibre,
from x = 0 to a distance x = ( )1 − m Le , is assumed
to be totally debonded. In this section, the interfacial shear stress, ISS, is considered constant and stress is transferred via friction.
In the second region the fibre matrix interface from x = (1 − m Le) to x = Le is assumed to be perfectly bonded. The axial strain in the bonded region is defined using Equation (1) with the continuity of axial stress at x = ( )1 − m Le to give:
( ) ( )[ ][ ]nms
rxmLnmLi
rEe
e
f
if sinh
/sinh)1(
2 −−−τ
=ε (9)
Differentiating Equation (8) and substituting into Equation (9) gives the interfacial shear stress in the region where there is no debonding, τ:
( ) ( )[ ]
[ ]nmsrxmLn
rLmin eei
sinh/cosh)1( −−−τ
=τ (10)
Figure 1 : Preparation of the single fibre pull-out specimen
93 I. Ahmad and R. J. Young Interfacial Studies of Single-Fibre Aramid/Epoxy Composite using Raman Spectroscopy

The bonded region behaves elastically with a maximum shear stress at the transition point between debonded and bonded regions before it decreases to zero towards the fibre ends. When the whole interface is debonded, the fibre is finally extracted from the resin. Experimental 1. Specimens
Two types of Twaron 2200 fibre were used. One was as-spun fibre (TNHM), and the other was adhesion-activation treated (TNHMA). Both fibres were high modulus Twaron supplied by Akzo Nobel Central Research, Arnhem, The Netherlands.
The as-spun fibres have no surface coatings at all. These fibres are not commercially available, since their frictional properties lead to difficult processing and handling of the yarn [11]. In the case of the adhesion-activation Twaron fibres, the finished is mixed with an epoxy (glycidylether of glycerol) and a hardener (piperazine) and then applied after a maturation of several hours. The treatment used for the adhesion activation Twaron fibres is described by Mahy et al. [11].
An epoxy resin, manufactured by Bakelite AG consisted of 100 parts by weight of hexandioldiglycidether resin (Rutapox L20) and 34 parts by weight of 3,3’-dimethyl-4,4’-diamino-dicyclohexyl- methane hardener (Rutadur SL). This resin was cured at room temperature for 24 hours before being cured in a vacuum oven at 60oC for 15 hours.
The single-fibre pull-out (SFPO) specimens were prepared using a silicone rubber moulds approximately 8 mm × 8 mm × 3 mm. A segment of the rubber, approximately 5 mm × 5 mm, was removed from the center of the mould with an adapted razor blade. A razor cut was made in the mould where the fibre was to be placed. A fibre was placed straight in the cut as shown in Figure 1. After curing, the epoxy could be separated from the mould and removed by bending the mould slightly. A smooth top surface combined with an angle of 90o between the top and the side surface was essential in the production of good specimens for Raman spectroscopy. The fibres were embedded with different embedded lengths from 600 µm to 1500 µm in the epoxy resin block to obtain a variety of specimen geometries.
2. Fibre characterisation 2.1. Wide-angle X-ray scattering (WAXS) 2.2.1. Patterns by film recording
The wide-angle X-ray scattering (WAXS) was obtained using Phillips PW1010 flat plate diffactometer operated at 40 kV and 30 mA. Bundles of parallel Twaron fibres were irradiated with nickel-
filtered CuKα radiation for a minimum time of 30 minutes. The results were recorded on X-ray sensitive film, which were placed 50 mm from the fibre. 2.2.2. Patterns by diffractometer recording
The fibres were also examined in a Phillips PW3710 based X-ray diffractometer operated at 40 kV and 50 mA. The X-rays used were nickel-filtered CuKα radiation with wavelength of 0.154 nm. Reading was taken between 2θ Bragg angles of 5o and 100o using a step size of 0.05o at a scan rate of 0.30o/min at room temperature. 3. Raman Spectroscopy
The samples were placed on the stage of a Nikon BGSC optical microscope connected to a set of collection optics to a SPEX 1403 double monochromator. Raman spectra were obtained during deformation of the aramid fibres both; individual fibre for the strain calibration factor and SFPO specimens using the 632.8 nm red line of a 15 mW He-Ne laser with 3s laser exposure time. The relationship between the vibration frequencies and the applied strain was been determined by measuring the dependence of Raman frequencies upon strain.
In this study a four-point bending rig was used to apply strain to individual Twaron fibres bonded onto poly(methyl methacrylate) (PMMA) strips (3 × 10 × 60) mm by a thin layer of a viscous solution of PMMA in chloroform. The strain-induced Raman
band shift, εν
∆∆
dd was calculated by deforming
the fibre in air. It was used later as a calibration factor to convert the Raman band position of deformed Twaron fibres in resin composites into strain.
The single fibre pull-out specimens were fixed individually on a small glass slide. The free fibre length approximately 400 µm was cemented between matrix resin block and paper card to make sure that the fibre was uniformly at the same level (Figure 1). All spectra were measured at a magnification of 50×. A highly sensitive Wright Instruments charge-coupled device (CCD) camera was use to collect the Raman spectra. The peak position of the strain sensitive 1610 cm-1 Raman band was used to map the fibre strain profiles at the various levels of applied fibre strain. Result and Discussion 1. Wide angle X-ray scattering (WAXS) 1.1. Pattern by film recording
WAXS patterns are characteristic of the crystal structure and orientation in a sample [12]. For polycrystalline polymer sample, the pattern is characterised by an oriented ring and partially-oriented samples show arcing of some of the rings.
94 I. Ahmad and R. J. Young Interfacial Studies of Single-Fibre Aramid/Epoxy Composite using Raman Spectroscopy

The WAXS pattern from the bundles of Twaron 2200 TNHM is shown in Figure 2(a). It can be seen that the pattern consists of a narrow spread of the arcs for each fibre. This pattern indicates that there is a high degree of orientation in the fibre. A similar flat-plate WAXS patterns was obtained for Twaron TNHMA
Figure 2(b) shows a high level of molecular orientation along the fibre axis. As seen in Figure 2, that the surface modification of Twaron fibre did not appear to change the molecular orientation for Twaron 2200 fibre.
(a)
(b)
Figure 2 Flat-plate WAXS patterns of Twaron 2200 fibres. a) TNHM b) TNHMA.
95 I. Ahmad and R. J. Young Interfacial Studies of Single-Fibre Aramid/Epoxy Composite using Raman Spectroscopy

1.2. Diffractometer patterns
The X-ray diffractometer trace for the Twaron HM fibres are shown in Figure 3. There are two well-defined crystalline peaks observed corresponding to Bragg reflections from the (110) and (200) crystals planes of the orthorhombic unit cell in the fibres [12]. Twaron TNHMA shows a similar peak position to Twaron TNHM fibres. The 2θ values at which the peaks occur and the radiation wavelength can be used to calculate value of the d-spacing using Bragg’s equation:
n dλ θ= 2 sin (11)
where n is an integer, λ is the radiation wavelength, d is the lattice spacing and θ is the diffraction angle. The measured d-spacing for Twaron TNHM and TNHMA were compared with the values from previous reports [12,13] as shown in Table 1. As shown in Table 1, there is no significant difference in the crystalline peaks of Twaron fibres. This confirms that the crystalline structure is similar to that reported in the literature [13].
Table 1 : The 2θ values, d-spacing and plane-types corresponding to the peaks from X-ray diffraction trace in Figure 3.
2θ d-spacing (Angstrom) Plane-type (hkl)
TNHM TNHMA TNHM TNHMA [13] [12]
20.92 20.87 4.24 4.25 4.30 110
22.97 22.97 3.87 3.87 3.86 200
0 5 10 15 20 25 30 35 40 45 500
4000
8000
12000
16000
20000
24000
28000(200)
(110)
Twaron (HM)
Inte
nsi
ty (
Arb
itra
ry u
nits
)
2θ (o)Figure 3 : WAXS diffractometer traces of Twaron TNHM fibres
96 I. Ahmad and R. J. Young Interfacial Studies of Single-Fibre Aramid/Epoxy Composite using Raman Spectroscopy
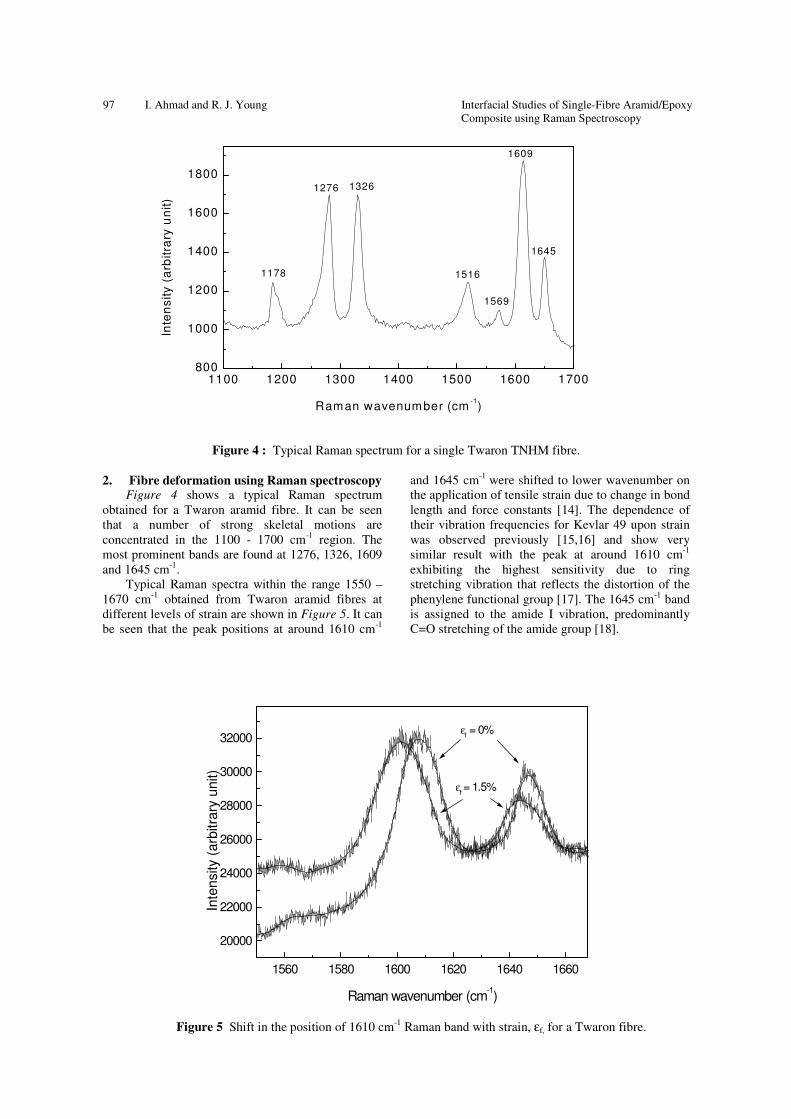
Figure 4 : Typical Raman spectrum for a single Twaron TNHM fibre.
2. Fibre deformation using Raman spectroscopy Figure 4 shows a typical Raman spectrum
obtained for a Twaron aramid fibre. It can be seen that a number of strong skeletal motions are concentrated in the 1100 - 1700 cm-1 region. The most prominent bands are found at 1276, 1326, 1609 and 1645 cm-1.
Typical Raman spectra within the range 1550 – 1670 cm-1 obtained from Twaron aramid fibres at different levels of strain are shown in Figure 5. It can be seen that the peak positions at around 1610 cm-1
and 1645 cm-1 were shifted to lower wavenumber on the application of tensile strain due to change in bond length and force constants [14]. The dependence of their vibration frequencies for Kevlar 49 upon strain was observed previously [15,16] and show very similar result with the peak at around 1610 cm-1 exhibiting the highest sensitivity due to ring stretching vibration that reflects the distortion of the phenylene functional group [17]. The 1645 cm-1 band is assigned to the amide I vibration, predominantly C=O stretching of the amide group [18].
1100 1200 1300 1400 1500 1600 1700800
1000
1200
1400
1600
1800
1645
1609
1569
1516
13261276
1178
Inte
nsity
(ar
bitr
ary
uni
t)
Raman wavenumber (cm -1)
1560 1580 1600 1620 1640 1660
20000
22000
24000
26000
28000
30000
32000
εf = 1.5%
εf = 0%
Inte
nsity
(arb
itrar
y un
it)
Raman wavenumber (cm-1)
Figure 5 Shift in the position of 1610 cm-1 Raman band with strain, εf, for a Twaron fibre.
97 I. Ahmad and R. J. Young Interfacial Studies of Single-Fibre Aramid/Epoxy Composite using Raman Spectroscopy

Table 2 : Strain dependence of the 1610 cm-1 aramid Raman band for the two types of Twaron fibre
Fibre d∆v/dε (cm-1/%)
TNHM -4.2 + 0.3
TNHMA -4.3 + 0.6
Table 2 shows the dependence of the position of the 1610 cm-1 aramid Raman band upon tensile strain for single Twaron filaments cemented to the surface of a Perspex beam deformed on a four-point bending rig [14] with the surface strain monitored by a strain gauge. The results exhibit a similar Raman shift with d∆v/dε for TNHM and TNHMA are -4.2 and -4.3 cm-
1/% respectively. 3. Single Fibre Pull-out (SFPO) Tests 3.1. Twaron 2200 without surface treatment (TNHM) Figure 6(a) shows the measured distributions of fibre strain along the fibres at various level of applied strain for Twaron (TNHM) with hot-cured Rutapox epoxy resin. The experimental data has been fitted to the theoretical curves (solid lines) calculated using
Equation (9). At low nominal strains, the strain distributions is similar to that predicted by the full-bonding model [7]. It can be seen that the debonding process started when the nominal fibre strain, εo, increased above 0.9%. The matrix crack initiated near the surface where fibre entered the matrix and debonded region clearly shown, with a linear decrease in fibre strain along the embedded fibre until the transition between bonded/debonded region, a. The strain distributions are similar to those predicted by the partial-debonding model. Application of further stress to the free fibre increased the length of the debonded region until the fibre was totally extracted from the matrix.
-100 0 100 200 300 400 500 600 700 800
0.00
0.25
0.50
0.75
1.00
1.25
1.50
1.75 ε o
0.0%
0.90%
1.08%
1.32%
1.56%
Str
ain
in fi
bre,
εf (
%)
Distance along fibre, x (µ m)
(a)
98 I. Ahmad and R. J. Young Interfacial Studies of Single-Fibre Aramid/Epoxy Composite using Raman Spectroscopy

(b)
Figure 6 : Variation of (a) fibre strain; (b) interfacial shear stress with distance along fibre at different nominal strains for a Twaron TNHM in Rutapox L20 epoxy matrix
The distribution of interfacial shear stress in Figure 6(b) was obtained using Equation (10). At high levels of applied fibre strain (εo ≥ 0.9%), it is apparent that the interfacial shear stress is constant in the debonded region. This is because the development of the interfacial shear stress in the debonded region is the direct result of frictional forces [19,20]. The linear debonded region in Figure 6(a) also shows the same levels of friction for each strain distribution. This is emphasised in
the corresponding interfacial shear stress, τ distribution in Figure 6(b) showing an approximately constant frictional shear stress,τi with τi is ~ 12 MPa. It can be seen that the maximum interfacial shear stress, τmax occurs at the transition between debond/bond region (Figure 6(b)). The maximum values of the interfacial shear stress, τmax, obtained from this experiment vary between 36 to 46 MPa.
Table 3 : Interfacial data from 2 Twaron TNHM fibre/Rutapox epoxy resin pull-out specimens
εo (%) a (µm) τi (MPa) τmax (MPa) 0.91 60 13.5 36.4 1.07 90 12.0 41.1 1.32 160 7.0 46.3 1.56 340 6.3 45.6 1.32 165 8.5 39.0 1.50 240 8.5 39.7 1.78 330 8.7 44.7 1.90 560 6.5 36.7
Average value of τi 8.9 + 2.6 - Average maximum value of τmax 45.5 + 2.0
-100 0 100 200 300 400 500 600 700 800-5
0
5
10
15
20
25
30
35
40
45
50
55
Distance along fibre, x (µ m)
ε o
0.90%
1.08%
1.32%
1.56%
Inte
rfa
cial
she
ar
stre
ss,
τ (M
Pa)
99 I. Ahmad and R. J. Young Interfacial Studies of Single-Fibre Aramid/Epoxy Composite using Raman Spectroscopy

A second Raman experiment was performed with the Twaron TNHM in hot-cured Rutapox epoxy matrix. It was found that the same phenomenon occurred for each of them with the fibre can be extracted from the matrix at higher level of fibre strain (εo ~ 2.0%). The interfacial parameters determined from the Raman plots for each specimen
are summarised in Table 3. It can be seen that the average value of frictional shear stress, τi, is 8.9 + 2.6 MPa and the average maximum value of interfacial shear stress, τmax
avg is 45.5 + 2.0 MPa. These values are close to the shear yield stress of the resins (44 MPa) [21].
-100 0 100 200 300 400 500 600 700
0.00
0.25
0.50
0.75
1.00
1.25
1.50
1.75 εo
0.0% 0.50% 0.71% 0.86% 0.99% 1.43%
Str
ain
in fi
bre,
εf (
%)
Distance along fibre, x (µm)
-100 0 100 200 300 400 500 600 700-5
0
5
10
15
20
25
30
35
40
45
50
Distance along fibre, x (µm)
εo 0.50% 0.71% 0.86% 0.99% 1.43%
Inte
rfac
ial s
hear
str
ess,
τ (
MP
a)
(a)
(b)
Figure 7 : Variation of (a) fibre strain; (b) interfacial shear stress with distance along fibre at different nominal strains for a Twaron TNHMA in Rutapox L20 epoxy matrix
100 I. Ahmad and R. J. Young Interfacial Studies of Single-Fibre Aramid/Epoxy Composite using Raman Spectroscopy

3.2. Twaron 2200 with surface activated (TNHMA) Figure 7(a) shows the distributions of fibre strain for TNHMA fibre/Rutapox epoxy pull-out specimen. When the nominal fibre strain is increased above 0.99% a small region of linear strain initiates close to the fibre entrance with the transition from the linear to non-linear region of fibre strain being difficult to differentiate. Although the experimental results can be fitted to the partial debonding model, it is believed that the behaviour is due to matrix yielding which is not considered in the shear-lag model.
As seen in Figure 7(a), although the nominal fibre applied strain is increased to the higher strain (εo = 1.43%), the debond length, a, is still small with the transition point between linear/nonlinear region ~ 150 µm from the fibre entrance. This provides strong evidence that the application of adhesion activation gives very good adhesion between the Twaron fibre and epoxy matrix. The application of further stress to the free fibre to increase the axial strain above those fibre strain levels resulted in the failure of the free fibre outside the matrix.
As seen in Figure 7(b), the interfacial frictional shear stresses vary for each fibre strain between 22.5 and 27 MPa. The τi values are significantly higher compared to TNHM. The maximum values of τmax for TNHMA obtained in this study are between 40 and 45 MPa.
A second specimen was also tested and the data obtained was summarised in Table 4. It can be seen that the average frictional shear stress is significantly
higher than the values for TNHM with values of τi = 28.1 + 2.8 MPa for TNHMA fibre. There is also no significant difference in the average maximum value of τmax from each specimen with the value of τmax
avg = 46.4 + 2.1 MPa. Thus, it appears that the interfacial shear strength (IFSS) for the Twaron fibre/epoxy composites is controlled by the shear yield strength of the epoxy resin matrix.
From the results, it shows that the Twaron fibre with adhesion activation (TNHMA) is better than the Twaron TNHM fibre. It is believed that a thin layer of epoxy-reaction products is responsible for a significantly enhanced adhesion level to an epoxy matrix system, relative to the untreated Twaron fibre (TNHM) system.
4. Failure mechanisms of the fibre/matrix
interface
Figure 8 shows a set of optical micrographs obtained during pull-out experiments for a Twaron TNHM fibre. As the fibre is extracted, the ‘anchor’ at the fibre end will be compressed along the cylindrical cavity in the matrix. There was also no interaction between the fibre and the matrix, with the hole left without any remnants of the extracted fibre in the epoxy matrix after extraction of a single Twaron TNHM fibre (Figure 8(c)). The extraction of the fibre from the matrix shows complete fibre pull-out which leaves only an empty cavity from the embedded end (Figure 8(b)).
Table 4 Interfacial data from 2 Twaron TNHMA fibre/Rutapox epoxy resin pull-out specimens
εo (%) a (µm) τi (MPa) τmax (MPa) 0.50 - - 40.3 0.71 - - 44.9 0.86 - - 44. 0.99 60 22.5 38.9 1.43 90 27 43.7 0.75 - - 36.7 1.21 40 31 39.9 1.40 50 30 43.6 1.52 65 29 42.6 1.75 85 29 43.6 1.98 110 29 47.9
Average value of τi 28.1 + 2.8 Average maximum value of τmax 46.4 + 2.1
101 I. Ahmad and R. J. Young Interfacial Studies of Single-Fibre Aramid/Epoxy Composite using Raman Spectroscopy

Figure 8 : 0ptical micrograph of the Twaron TNHM fibre during pull-out test: (a) Partly pulled-out from the matrix; (b) An empty cavity where the fibre has been extracted; (c) Matrix surface at the fibre entrance after complete fibre pull-out from the epoxy resin
12 µm
12µm
(c)
12µm
(a)
(b)
102 I. Ahmad and R. J. Young Interfacial Studies of Single-Fibre Aramid/Epoxy Composite using Raman Spectroscopy

Figure 9 : Optical micrograph of the Twaron TNHMA fibre after pull-out test showing that the fibre fractured
outside the matrix near to the fibre entrance
In comparison in Twaron TNHMA fibres, fibre fracture occurred where it entered the resin and no fibre was pulled-out from the matrix (Figure 9). This can be attributed to better interaction between the fibre and the matrix, which may be due to the application of epoxy surface activation. Conclusion
It has been demonstrated that Raman spectroscopy is a very powerful method of analyzing the interfacial characteristics in fibre-matrix composites. It provides unique information concerning the point-to-point distribution of fibre strain in the specimens and also allows the direct measurement of interfacial shear strength for the systems by using the partial-debonding model.
The combination of Raman spectroscopy with optical microscopy is also an excellent technique to study the effect of surface treatment of Twaron fibres. The low value of frictional shear stress value for the TNHM fibre (8.9 + 2.6 MPa) is attributed to smoothness of the fibre surface. However for the TNHMA fibre, the value is higher at ~ 28.1 + 2.8 MPa. This indicates that the adhesion activation increases the chemical adhesion between the fibre and the matrix and as a result improves the interfacial bond strength.
References 1. Hull, D. (1981) An Introduction to Composite
Materials, Cambridge University Press, UK, 41. 2. Jahankhani, H. and Galiotis, C. (1991) Journal
of Composite Materials, 25, 610-619.
3. Andrews, M.C., Young, R.J. and Mahy, J. (1994) Composite Interfaces, 2, 433-445.
4. Pitkethly, M.J., Favre, J.P., Gaur, U., Jakubowski, J., Mudrich, S.F., Caldwell, D.L., Drzal, L.T., Nardin, M., Wagner, H.D., Di Landro, L., Hampe, A., Aemistead, J.P., Desaeger, M. and Verpoest, I. (1993) Composites Science & Technology, 48, 208-217.
5. Galiotis, C., Robinson, I.M., Young, R.J., Smith, B.J.E. and Batchelder, D.N. (1985) Polymer Communications, 26, 354-362.
6. AKZO: fibre specifications. Akzo Nobel Central Research, Arnhem, The Netherlands.
7. Piggott, M.R. (1980) Load Bearing Fibre Composites, Pergamon Press, Oxford, UK, 39-46.
8. Chua, P.S. and Piggott, M.R. (1985) Composites Science & Technology, 22, 33-41.
9. Cox, H.L. (1952) British Journal of Applied Physics, 3, 72-76.
10. Kelly, A., and Tyson, W.R. (1965) Journal of Mechanics Physics Solids, 13, 329-335.
11. Mahy, J., Jenneskens, L.W. and Grabandt, O. (1994) Composites, 25, 653-659.
12. Tashiro, K., Kobayasyi, M. and Tadokoro, H. (1977) Macromolecules, 10, 413-419.
13. Yeh, W.Y. and Young, R.J. (1999) Polymer, 40, 857-870.
14. Young, R.J., (1979) Journal of the Textile Institute, 86, 360-365.
15. Penn, L. and Milanovich, F., (1979) Polymer, 20, 31-36.
12 µm
fibre fracture fibre entrance
103 I. Ahmad and R. J. Young Interfacial Studies of Single-Fibre Aramid/Epoxy Composite using Raman Spectroscopy

16. Chang, C. and Hsu, S. L. (1993) Macromolecules, 23, 1484-1489.
17. Ang, P. P. (1991) Deformation Micromechanics of High Performance Polymer Fibres and Composites, Ph.D Thesis, Victoria University of Manchester, UK.
18. Andrews, M.C., Day, R.J. and Young, R.J. (1993) Composites Science & Technology, 48, 255-259.
19. Kelly, A. and MacMillan, N.H. (1980) In Strong Solids, 3rd Edition, Clarendon Press, Oxford, UK., 13-18.
20. Gu, X. (1995) Micromechanics of Model Carbon-fibre/Epoxy-resin Composites, Ph.D Thesis, UMIST, UK.
21. Andrews, M.C., Young, R.J. and Mahy J. (1994) Composite Interfaces, 2, 433-442.
104 I. Ahmad and R. J. Young Interfacial Studies of Single-Fibre Aramid/Epoxy Composite using Raman Spectroscopy