Interface Controlled Thermal Resistances of Ultra-Thin ...
13
University of Rhode Island University of Rhode Island DigitalCommons@URI DigitalCommons@URI Mechanical, Industrial & Systems Engineering Faculty Publications Mechanical, Industrial & Systems Engineering 2-2021 Interface Controlled Thermal Resistances of Ultra-Thin Interface Controlled Thermal Resistances of Ultra-Thin Chalcogenide-Based Phase Change Memory Devices Chalcogenide-Based Phase Change Memory Devices Kiumars Aryana John T. Gaskins Joyeeta Nag Derek A. Stewart Zhaoqiang Bai See next page for additional authors Follow this and additional works at: https://digitalcommons.uri.edu/mcise_facpubs
Transcript of Interface Controlled Thermal Resistances of Ultra-Thin ...

University of Rhode Island University of Rhode Island
DigitalCommons@URI DigitalCommons@URI
Mechanical, Industrial & Systems Engineering Faculty Publications Mechanical, Industrial & Systems Engineering
2-2021
Interface Controlled Thermal Resistances of Ultra-Thin Interface Controlled Thermal Resistances of Ultra-Thin
Chalcogenide-Based Phase Change Memory Devices Chalcogenide-Based Phase Change Memory Devices
Kiumars Aryana
John T. Gaskins
Joyeeta Nag
Derek A. Stewart
Zhaoqiang Bai
See next page for additional authors
Follow this and additional works at: https://digitalcommons.uri.edu/mcise_facpubs

Authors Authors Kiumars Aryana, John T. Gaskins, Joyeeta Nag, Derek A. Stewart, Zhaoqiang Bai, Saikat Mukhopadhyay, John C. Read, David H. Olson, Eric R. Hoglund, James M. Howe, Ashutosh Giri, Michael K. Grobis, and Patrick E. Hopkins

ARTICLE
Interface controlled thermal resistances ofultra-thin chalcogenide-based phase changememory devicesKiumars Aryana1, John T. Gaskins 1, Joyeeta Nag2, Derek A. Stewart 2, Zhaoqiang Bai2,
Saikat Mukhopadhyay3, John C. Read2, David H. Olson1, Eric R. Hoglund 4, James M. Howe4, Ashutosh Giri5,
Michael K. Grobis2 & Patrick E. Hopkins 1,4,6✉
Phase change memory (PCM) is a rapidly growing technology that not only offers
advancements in storage-class memories but also enables in-memory data processing to
overcome the von Neumann bottleneck. In PCMs, data storage is driven by thermal excita-
tion. However, there is limited research regarding PCM thermal properties at length scales
close to the memory cell dimensions. Our work presents a new paradigm to manage thermal
transport in memory cells by manipulating the interfacial thermal resistance between the
phase change unit and the electrodes without incorporating additional insulating layers.
Experimental measurements show a substantial change in interfacial thermal resistance as
GST transitions from cubic to hexagonal crystal structure, resulting in a factor of 4 reduction
in the effective thermal conductivity. Simulations reveal that interfacial resistance between
PCM and its adjacent layer can reduce the reset current for 20 and 120 nm diameter devices
by up to ~ 40% and ~ 50%, respectively. These thermal insights present a new opportunity to
reduce power and operating currents in PCMs.
https://doi.org/10.1038/s41467-020-20661-8 OPEN
1 Department of Mechanical and Aerospace Engineering, University of Virginia, Charlottesville, VA 22904, USA. 2Western Digital Corporation, San Jose, CA95119, USA. 3 NRC Research Associate at Naval Research Laboratory, Washington, DC 20375, USA. 4 Department of Materials Science and Engineering,University of Virginia, Charlottesville, VA 22904, USA. 5Department of Mechanical, Industrial and Systems Engineering, University of Rhode Island, Kingston,RI 02881, USA. 6 Department of Physics, University of Virginia, Charlottesville, VA 22904, USA. ✉email: [email protected]
NATURE COMMUNICATIONS | (2021) 12:774 | https://doi.org/10.1038/s41467-020-20661-8 | www.nature.com/naturecommunications 1
1234
5678
90():,;

The growing demands for higher capacity memory devicesand burgeoning data-intensive applications, such as arti-ficial intelligence, have intensified efforts to beat the von
Neumann computing bottleneck that separates processing fromthe storage unit. A promising alternative for transistor-basednon-volatile memory devices is an emerging technology known asphase change memory (PCM), which offers prospective gains inspeed, device lifetime, and storage capacity, as well as in-memorystorage and computing capabilities1,2. The most widely usedphase change material, germanium antimony telluride (GST),possesses a high electrical resistivity contrast between its amor-phous and crystalline structure, as well as sub-nanosecondswitching times3,4. This class of phase change materials canquickly switch phase between amorphous and crystalline statesupon controlled thermal excitation. In PCMs, the transition fromamorphous to crystalline and crystalline to amorphous arecommonly referred to as set and reset, respectively. In devicesutilizing phase change units, thermal transport plays a pivotal roleas it dictates the efficiency of the set/reset process and overallpower consumption.
One of the major limitations in PCM devices is their highoperating current, leading to excessive power consumption5. Inorder to mitigate thermal leakage during programming, Kimet al.6 used a thermal barrier (2–20 nm of C60) to insulate the GSTfrom directly contacting the electrode, showing up to a factor offour reduction in their reset current (Ireset). Although a lowerpower consumption in their device architecture offered perfor-mance gains, the relatively large thickness of the thermal barrierintroduced additional resistance, decreased bit density, and pro-vided an additional source of degradation for the PCM over time.Later, Ahn et al.7 proposed a much thinner insulating layer byusing a single sheet of graphene (thickness <1 nm) as a thermalbarrier to isolate the heat inside the PCM cell and showed that theIreset was reduced by 40% compared to the cells without a gra-phene barrier. More recently, superlattice phase change memorieshave received a great deal of attention due to their unique cap-abilities offering lower power consumption, faster programmingrate, higher retention time, and lower noise and drift in electricalresistance3,8–10. Although earlier superlattice PCMs consisted ofGeTe/Sb2Te3 alternating stacks, it was soon realized that thisconfiguration tends to intermix and transform into bulk GST athigh annealing temperatures11. Nonetheless, the idea of super-lattice PCMs inspired researchers to look for alternative materialconfigurations. Very recently, Shen et al.8 and Ding et al.9 showedthat superlattice PCMs with TiTe2/Sb2Te3 layers have superiorproperties compared to bulk GST. Despite the fact that insuperlattice PCMs the interface is an integral component in theperformance of these devices, its effect on the overall thermaltransport is heretofore unknown and unstudied. With all theseprevious works in mind, we are prompted to experimentallyinvestigate the effect of interfacial thermal resistance on theperformance of PCM devices. The selected materials for thisstudy are among those that are widely used in PCM devices:Ge2Sb2Te4 (GST) as a phase change unit, tungsten (W) as anelectrode, and silicon dioxide (SiO2) and silicon nitride (SiNx) asthe insulating separators for confining heat and current withinthe cell. Our work focuses on identifying the critical parametersthat influence thermal transport as the length scale of the phasechange unit approaches that of energy carriers’ mean free paths.We assess the effect of GST film thickness on thermal transportacross various phase transitions and determine the minimumthickness before which thermal transport transitions into a bal-listic regime. A pictorial representation of the configuration oflayers used in this study is given in Fig. 1a along with the cor-responding transmission electron microscopy (TEM) images foramorphous (a-GST) and hexagonal (h-GST) phases.
To date, the majority of studies investigating thermal transportin GST were performed on layers with thicknesses on the order of200 nm12–15. However, as Xiong et al.16 demonstrated, in order todecrease power consumption and further the economic benefits ofPCM memory devices, the thickness of GST layers should be onthe order of 10 nm. In this respect, Kim et al.17 devised anoperational PCM device with cell dimensions as small as 7.5 nm ×17 nm. In general, as the length scale of materials and inter-connects in PCM components shrink to dimensions less thanenergy carrier mean free paths, a number of additional mechan-isms, such as electron tunneling18–20 and thermal boundaryresistances (TBRs)21–23, may impact the performance of thesedevices24. In this paper, we present evidence of ballistic transportof energy carriers across the electrodes in a confined cell geometryas the characteristic length of the device is decreased to less thanthe mean free paths of the electrodes carriers. To demonstrate this,we show that in tungsten electrodes there is a lower limit for thethickness of GST in memory cells before thermal transport tran-sitions from a diffusive to a ballistic regime. Thus, our work usesthis knowledge of carrier dynamics to experimentally identify anoptimal thickness of phase change material based on a balance ofthermal conductivity and crystallographic-phase-dependent ther-mal boundary conductances (TBCs) in order to improve memorydevice performance.
Here, in contrast with previous studies that were primarilyfocused on introducing additional layers between the electrodeand GST to confine heat in the memory cell, we focus on theinterfacial thermal resistance and thermal properties of the layersin contact with GST. We show that, by intentionally engineeringthe phase and thickness of the phase change unit, the overallthermal resistance can be substantially increased, causingdecreases in requirements for set/reset currents, without incor-porating additional layers as a thermal barrier. Although theresults presented here are for commonly used materials in PCMssuch as GST and W, we demonstrate that, through manipulationof the interfacial resistance between the phase change unit and theadjacent layer, the predicted reset current can be reduced by up to40% and 50% for devices with lateral size of 20 and 120 nm indiameters, respectively. Our work highlights the importance ofengineering interfaces to allow for devices with increasedperformance.
ResultsWe measure the thermal transport properties of the GST thinfilms, deposited via magnetron sputtering, using time-domainthermoreflectance (TDTR) in a two-tint configuration25. Thesurface of the samples are coated with an 80-nm rutheniumtransducer. The thermal model, which relates the thermore-flectivity of the transducer to the thermal properties of theunderlying layers, requires knowledge of the volumetric heatcapacity, film thickness, and thermal conductivity of each layer.The volumetric heat capacity for Ru, a-GST, h-GST, and the Sisubstrate are assumed to be 2.96, 1.3, 1.4, and 1.64MJ m−3 K−1,respectively26,27. The thermal conductivity of the Ru layer isdetermined to be 54Wm−1 K−1 via four-point probe measure-ments and the thickness of each layer is confirmed via TEM.
Room temperature thermal properties of a-GST. We firstinvestigate room temperature thermal properties in order to showthat the effect of materials adjacent to GST, spacers, on thermalconductance is only appreciable for a-GST thicknesses less than10 nm. For films as thin as these, it is often instructive to idealizematerial stacks as a series of thermal resistors comprising theresistances at interfaces and the intrinsic resistance of the mate-rials, similar to the schematic shown in Fig. 1c. The thermal
ARTICLE NATURE COMMUNICATIONS | https://doi.org/10.1038/s41467-020-20661-8
2 NATURE COMMUNICATIONS | (2021) 12:774 | https://doi.org/10.1038/s41467-020-20661-8 | www.nature.com/naturecommunications
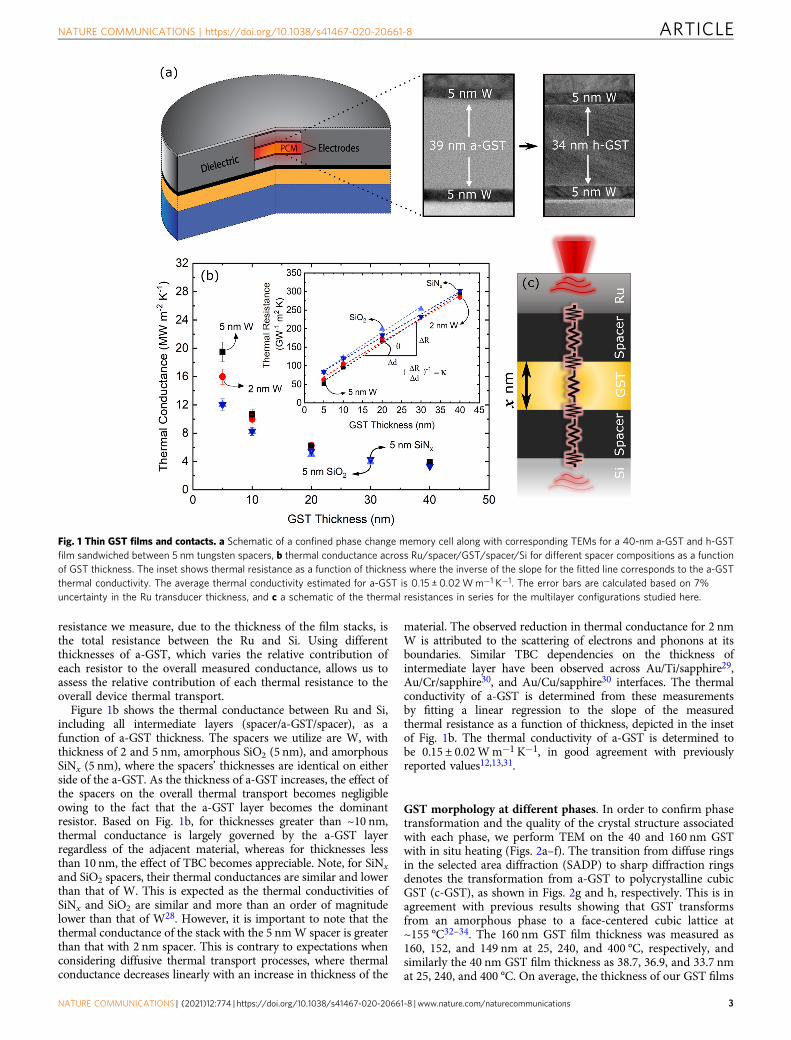
resistance we measure, due to the thickness of the film stacks, isthe total resistance between the Ru and Si. Using differentthicknesses of a-GST, which varies the relative contribution ofeach resistor to the overall measured conductance, allows us toassess the relative contribution of each thermal resistance to theoverall device thermal transport.
Figure 1b shows the thermal conductance between Ru and Si,including all intermediate layers (spacer/a-GST/spacer), as afunction of a-GST thickness. The spacers we utilize are W, withthickness of 2 and 5 nm, amorphous SiO2 (5 nm), and amorphousSiNx (5 nm), where the spacers’ thicknesses are identical on eitherside of the a-GST. As the thickness of a-GST increases, the effect ofthe spacers on the overall thermal transport becomes negligibleowing to the fact that the a-GST layer becomes the dominantresistor. Based on Fig. 1b, for thicknesses greater than ~10 nm,thermal conductance is largely governed by the a-GST layerregardless of the adjacent material, whereas for thicknesses lessthan 10 nm, the effect of TBC becomes appreciable. Note, for SiNx
and SiO2 spacers, their thermal conductances are similar and lowerthan that of W. This is expected as the thermal conductivities ofSiNx and SiO2 are similar and more than an order of magnitudelower than that of W28. However, it is important to note that thethermal conductance of the stack with the 5 nmW spacer is greaterthan that with 2 nm spacer. This is contrary to expectations whenconsidering diffusive thermal transport processes, where thermalconductance decreases linearly with an increase in thickness of the
material. The observed reduction in thermal conductance for 2 nmW is attributed to the scattering of electrons and phonons at itsboundaries. Similar TBC dependencies on the thickness ofintermediate layer have been observed across Au/Ti/sapphire29,Au/Cr/sapphire30, and Au/Cu/sapphire30 interfaces. The thermalconductivity of a-GST is determined from these measurementsby fitting a linear regression to the slope of the measuredthermal resistance as a function of thickness, depicted in the insetof Fig. 1b. The thermal conductivity of a-GST is determined tobe 0.15 ± 0.02Wm−1 K−1, in good agreement with previouslyreported values12,13,31.
GST morphology at different phases. In order to confirm phasetransformation and the quality of the crystal structure associatedwith each phase, we perform TEM on the 40 and 160 nm GSTwith in situ heating (Figs. 2a–f). The transition from diffuse ringsin the selected area diffraction (SADP) to sharp diffraction ringsdenotes the transformation from a-GST to polycrystalline cubicGST (c-GST), as shown in Figs. 2g and h, respectively. This is inagreement with previous results showing that GST transformsfrom an amorphous phase to a face-centered cubic lattice at~155 °C32–34. The 160 nm GST film thickness was measured as160, 152, and 149 nm at 25, 240, and 400 °C, respectively, andsimilarly the 40 nm GST film thickness as 38.7, 36.9, and 33.7 nmat 25, 240, and 400 °C. On average, the thickness of our GST films
Fig. 1 Thin GST films and contacts. a Schematic of a confined phase change memory cell along with corresponding TEMs for a 40-nm a-GST and h-GSTfilm sandwiched between 5 nm tungsten spacers, b thermal conductance across Ru/spacer/GST/spacer/Si for different spacer compositions as a functionof GST thickness. The inset shows thermal resistance as a function of thickness where the inverse of the slope for the fitted line corresponds to the a-GSTthermal conductivity. The average thermal conductivity estimated for a-GST is 0.15 ± 0.02Wm−1 K−1. The error bars are calculated based on 7%uncertainty in the Ru transducer thickness, and c a schematic of the thermal resistances in series for the multilayer configurations studied here.
NATURE COMMUNICATIONS | https://doi.org/10.1038/s41467-020-20661-8 ARTICLE
NATURE COMMUNICATIONS | (2021) 12:774 | https://doi.org/10.1038/s41467-020-20661-8 | www.nature.com/naturecommunications 3

change by ~5% and ~6%, at the transition from amorphous tocubic and cubic to hexagonal, respectively, which are comparableto the values of 6.5% and 8.2% reported elsewhere35. The grainsize for c-GST ranges from 10 to 20 nm in both films. When thefilms transform to the hexagonal phase, there are highly faultedgrains that span the thickness of the films, as shown in Fig. 2c.A few differences in the lateral (i.e., in-plane) grain size wereobserved between the 40 and 160 nm films. In the 160 nm film,the lateral size of the smaller grains is approximately 50 nm,whereas in the 40 nm film, the size varied from 50 to 100 nm.Large faulted grains in the 160 nm film are ~100–200 nm wide,but only about 100 nm wide in the 40 nm film. The cross-plane
dimension of the grains in the 40 nm film are often that of thefilm thickness (i.e., 40 nm), while there is a range in the 160 nmfilm. The SADP from GST at 400 °C (Fig. 2i) displays a singleGST [001] zone axis and the [110] zone axis of the Si substrate,due to the much larger grain size compared to 240 °C (Fig. 2h).Diffuse streaks emanate from the {210} Bragg spots as a result ofthe faulted grain. Highly faulted structures have been observed ina variety of chalcogenides including Ge–Sb–Te compounds36–41.The large, faulted grains grew laterally by growth ledges that oftennucleate at the W/GST interface. The growth ledges then pro-pagate along the h-GST/c-GST interface, consuming smallergrains as they move. Crystalline GST is composed of van der
Fig. 2 Transmission electron microscopy of different GST phases. Bright-field images of the: a–c 40 nm and d–f 160 nm GST thin films at: a, d 25 °C,b, e 240 °C and c, f 400 °C, showing a sequence of phase transformations from amorphous to cubic to hexagonal GST, respectively. Selected areadiffraction patterns (SADP) of the 160 nm film at: g 25, h 240, and i 400 °C, reflecting the phase transformations and microstructures observed in the BFimages. In the inner ring of g and the top half of i, the green circles indicate Bragg spots in the [110] zone axis of the Si substrate, and blue arrows in i show{100} primitive reciprocal-lattice vectors of h-GST in a [001] zone axis. Diffuse streaks in i extending through the {210} Bragg spots are due to thetransnational shear faults seen in c and f.
ARTICLE NATURE COMMUNICATIONS | https://doi.org/10.1038/s41467-020-20661-8
4 NATURE COMMUNICATIONS | (2021) 12:774 | https://doi.org/10.1038/s41467-020-20661-8 | www.nature.com/naturecommunications
Waals coupled building blocks, each of which contains five Telayers separated by either a Ge or an Sb anion layer36,37,42,43. Byshifting each nine-layer building block by a partial lattice vector,the c-GST becomes h-GST and vice versa. Recent literaturesuggests that the weak bonding between the sesqui-chalcogenidesbuilding blocks, such as Sb2Te3, significantly exceeds those of vander Waals forces and, therefore, possesses more of a metavalentbond nature40,44. As a result of the weak bonding between theblocks, there is a low-energy barrier to passing partial dislocationsthat transform the lattice and cause faults. Faulted grains in the160 nm sample were primarily at an angle to the film normal asseen in Fig. 2f. The same was observed for the 40 nm film, such ason the right side of Fig. 2c in addition to grains whose buildingblocks/faults were parallel to the film normal, as on the left side ofFig. 2c.
Elevated temperature thermal properties of GST. Above, weshowed that the effects of room temperature TBC values onoverall device thermal resistance are only appreciable for a-GSTwhen the thickness is less than 10 nm. However, as the a-GSTfilm changes phase, its intrinsic thermal conductivity increases byalmost an order of magnitude. This implies that thermal trans-port in the crystalline phase should be more dramatically affectedby the TBC than in the amorphous phase. Therefore, it is crucialto understand the effects of thermal transport across W/GSTinterfaces as GST undergoes phase transition. TDTR measure-ments are taken as a function of temperature using a resistiveheating stage that allows us to measure the thermal conductivityof GST and the TBC at the GST/W interface from room tem-perature up to 400 °C, thereby, capturing the thermal propertiesof GST in all of phases (i.e., amorphous, cubic and hexagonal).Although cross-plane electrical resistivity measurements for GSTfilms are beyond the scope of this paper, in Supplementary Note 1we use available electrical resistivity data in the literature to dif-ferentiate the contributions of electrons and phonons to the totalthermal conductivity of GST.
Figure 3a shows the thermal conductivity of 40-nm and160-nm-thick a-GST layers that are heated under nominallyidentical conditions across various temperatures. In this figure, thesolid symbols correspond to the thermal conductivity of a-GSTwhen heated from room temperature up to 400 °C, whereas thehollow symbols correspond to the thermal conductivity of h-GSTwhen cooled down from 400 °C to room temperature. The solidcircles denoting the 160 nm film in Fig. 3a show a clear transitionfrom a-GST to c-GST, and c-GST to h-GST at approxi-mately 140 and 340 °C, respectively (see Supplementary Movies 1and 2), in good agreement with reported literature values12,45,46.The enhancement of thermal conductivity in the crystalline phaseis attributed to the dissolution of disordered vacancy clusters andincreasing order in the crystalline phase47,48. After the samplereaches 400 °C and the GST is fully transformed into thehexagonal phase, its thermal conductivity is measured as thesample is cooled down to room temperature, shown as hollowcircles in Fig. 3a. The thermal conductivity of the 160 nm h-GSTdecreases slightly over temperature as a result of reducedelectronic contribution to the thermal conductivity47.
On the other hand, for the 40-nm-thick GST, the measurementof intrinsic thermal conductivity in the crystalline phase isincreasingly difficult as the effects of interfacial thermal resistanceinterfere with thermal conductivity measurements as opposed to the160 nm case (see Supplementary Note 2). For this reason, we reportthe effective thermal conductivity (keff=GRu/W/GST/W/Si × dGST),depicted as solid diamonds, which incorporates both the effects ofthe intrinsic thermal conductivity of GST and the associated TBCs.
The effective thermal conductivity for the 40-nm-thick GST samplefollows a similar trend to that of 160 nm film up to 300 °C, exceptfor the slight upward shift in crystallization temperature to 150 °C.The agreement of thermal conductivity up to 300 °C between thetwo thicknesses is due to negligible effect of TBC on thermaltransport in the amorphous and cubic phases. However, upontransformation from c-GST to h-GST, the TBC at the h-GST/Winterface considerably decreases. As a result, we observe that theeffective thermal conductivity for the 40 nm GST film deviates fromthe 160 nm GST in the hexagonal phase. Above 300 °C, weno longer measure the intrinsic thermal conductivity of theh-GST layer but, instead, a convolution of the h-GST thermalconductivity and the h-GST/W thermal boundary conductance.The effective thermal conductivity for the 40 nm sample plateausnear ~0.8Wm−1 K−1, almost a factor of two lower than thethermal conductivity measured for 160 nm h-GST. This differenceis even more pronounced when the samples are cooled downto room temperature where the thermal conductivity for 40 and160 nm films are ~0.5 and ~1.3Wm−1 K−1, respectively. In orderto ensure the observed reduction in the effective thermalconductivity is not due to any microstructural changes in the film,we present extensive TEM with in situ heating to compare thequality of the crystals for both thicknesses. Although defects, such asstacking faults, occur in the hexagonal phase as shown in Figs. 3e, f,we did not identify any significant microstructural anomaliesbetween the two cases that explain such a significant reduction inthe 40-nm-thick GST film. The TEM results imply that the intrinsicthermal conductivity in both cases remains unaltered and, therefore,the observed discrepancy must be related to extrinsic effects such asTBC. This finding indicates that, contrary to what is generallyassumed, total thermal transport does not necessarily increase withthe increase in thermal conductivity of GST.
To further support our hypothesis regarding the effect of TBCon thermal transport in h-GST, we measure the total thermalconductance across the Ru/W/GST/W/Si film stack for a 20-nm-thick GST layer. For this thickness regime, the Kapitza length,defined as the thermal conductivity divided by the TBC andrepresents the thickness of a material in which TBCs caninfluence the overall thermal transport of a system, is comparableto the thickness of the film and, as a result, the effect of interfacesin our measurements are more pronounced compared to the40 nm film. For this thickness, the thermal conductances as afunction of temperature are depicted in Fig. 3b in solid diamonds,which follow the same trend observed in effective thermalconductivity of 40 nm film with a more pronounced drop at thetransition from c-GST to h-GST. This is clear evidence forthe opposite trend of TBC to that of the thermal conductivityfor c-GST to h-GST transition. In order to compare the TBCfor c-GST vs. h-GST, we take another 20-nm-thick a-GSTsample and heat it up to 320 °C where the GST film becomes fullycubic. By cooling the sample down to room temperature,we measure the thermal conductance in the cubic phase as afunction of temperature. Once the thermal conductance over thetemperature range of interest was measured, the same sample isagain heated up to 400 °C to transform the c-GST into hexagonalphase and its thermal conductance was remeasured upon cooling(hollow diamonds). As shown in Fig. 3b, we obtain a higherthermal conductance in c-GST than that of the h-GST phaseacross the entire temperature range. This is contrary toexpectations as the thermal conductivity in h-GST is nearly twotimes higher than the c-GST, however, due to relatively poorthermal transport at the interfaces, a lower thermal conductanceis measured. Based on the results presented here, we concludethat the TBC between h-GST and W is lower than that of thec-GST and W.
NATURE COMMUNICATIONS | https://doi.org/10.1038/s41467-020-20661-8 ARTICLE
NATURE COMMUNICATIONS | (2021) 12:774 | https://doi.org/10.1038/s41467-020-20661-8 | www.nature.com/naturecommunications 5

In this respect, due to the significant impact of TBC on thermaltransport of thin film GST, it is important to study how it changesacross various phases. Figures 3c, d show the TBC between GSTand two different thicknesses of W. The TBC in h-GST issignificantly suppressed compared to c-GST. A similar reduction inTBC has been experimentally and theoretically observed at GST/metal interfaces, which were attributed to the formation of a 2-nminterfacial layer49 and increased electron–phonon contribution to
the interfacial resistance50. According to our TEM images, we donot observe an additional interfacial layer after cubic to hexagonalphase transition. Considering the reduction of structural disorderupon annealing GST to higher temperatures47,48, we use asimplistic model via molecular dynamics simulations and demon-strate that a change in atomic-scale disorder at the interface fromc-GST to h-GST can, in fact, be another possible reason behind thesuppression of thermal transport. Disorder and defects at interfaces
Fig. 3 Thermal properties of GST thin films and interfaces across different phases. a Thermal conductivity of GST layer sandwiched between 5 nm Wspacers for 40 nm (diamonds) and 160 nm (circles) GST films. The solid symbols correspond to the thermal conductivity of GST as it transitions throughdifferent phases upon heating and hollow symbols correspond to the thermal conductivity of h-GST upon cooling. b Effective thermal conductivityfor 20-nm-thick GST film as a function of temperature across different phases of GST upon heating and cooling when annealed to 320 and 400 °C.c, d Thermal boundary conductance for as-deposited GST upon heating and h-GST upon cooling with 5 and 2 nmW spacer, respectively. The error bars arecalculated based on 7% uncertainty in the GST film thickness. e, f Bright-field images of 40 and 160 nm GST films at 400 °C.
ARTICLE NATURE COMMUNICATIONS | https://doi.org/10.1038/s41467-020-20661-8
6 NATURE COMMUNICATIONS | (2021) 12:774 | https://doi.org/10.1038/s41467-020-20661-8 | www.nature.com/naturecommunications

are well known to influence the TBC, and have in fact beencomputationally and experimentally shown to enhance TBC51–54.To this end, our molecular dynamics simulations suggest thatinterfacial disorder plays a stronger role in the reduction of TBCthan changes in the GST crystal structure and phonon density ofstates. We note that in our molecular dynamics simulations, we areusing Lennard–Jones potential that are not developed to predictthe thermal properties of W or GST. However, the simplicity ofthese potentials allows us to assess our hypotheses to generalclasses of materials, thus providing means to broadly study ourposits of the origin of reduction in TBC across the cubic tohexagonal phase transition (see Supplementary Note 3). In Figs. 3c,d, the dotted lines represent the minimum limit to the TBC byassuming the worst-case scenario for the effective parameters basedon 10% uncertainty, which in many cases is far higher thanmeasured uncertainty. Lack of sensitivity in the amorphous andcubic phases causes the reported range of TBC (best fit tominimum limit) to be quite broad, but as the GST transitions tohexagonal and gains more sensitivity to TBC, this range contracts.The hollow diamonds in Figs. 3c, d show the TBC for h-GST,which decreases by almost a factor of two as the sample is cooleddown from 400 °C to room temperature. Figures 3c, d againdemonstrate that the TBC for 5 nm W is higher than that of 2 nmW, especially in the crystalline phase where the effect of TBC ismore pronounced.
Figures 4a, b show the thermal conductance across Ru/W/GST/W/Si as a function of temperature for 5- and 40-nm-thickGST film with different spacers (2 nm W, 5 nm W, and 5 nmSiNx). The thermal conductance for a 10 nm W control is alsoplotted to clarify that the TBC at Ru/W and W/Si interfaces arerelatively constant and sufficiently large compared to GSTintrinsic thermal conductivity and GST/W interface. In Fig. 4a,we observe a linear trend for thermal conductance of 5 nm GSTfilm as a function of temperature after the crystallization onset(>150 °C) for W spacer. This is in contrast with the trendobserved in Fig. 4b for 40-nm-thick GST where the thermalconductance plateaus above 300 °C. In a fully diffusive thermaltransport regime, the effect of reduced TBC in h-GST must beeven more noticeable for 5 nm GST where the effect of intrinsicthermal conductivity is minimum. To explain this, it hasbeen shown that as the thickness of the GST layer decreases toultra-thin, the onset of crystallization increases to highertemperatures55. As a result, it is tempting to attribute thisincrease to a crystallization lag where at 300-400 °C range thefilm is gradually transitioning to h-GST. To assess thishypothesis, we can predict the total thermal conductance of
the Ru/5 nm W/5 nm GST/5 nm W/Si stack at different phasesusing thermal conductivity and TBC measured in the previoussection. Using a series resistors model, we calculate the stacktotal thermal conductance at 400 °C to be 43 ± 5MWm−2 K−1,which is almost a factor 2 lower than the measured value of 83 ±7MWm−2 K−1. It is noteworthy to mention that the TBC forGST/W and W/GST interfaces alone is 59 ± 7MWm−2 K−1,which is significantly lower than the measured thermalconductance for the entire stack. The fact that we measurealmost a factor of two higher thermal conductance for h-GST at400 °C cannot be explained within the diffusive thermaltransport limit. On the other hand, it has been shown that inbulk tungsten the average electron mean free paths beforescattering with phonons at room temperature can be as long as19.1 nm56. Additionally, due to tungsten high lattice thermalconductivity (~46Wm−1 K−1)56, it has phonons with long meanfree paths relative to other metals57. From this, we conservativelyestimate the phonon mean free path in tungsten to be on theorder of λ= 3kp/Cv= (3 × 46)/(2.58 × 106 × 5174)= 10.3 nm.Since the thickness of 5 nm GST is within the range of thephonons’ and electrons’ mean free paths, we attribute thisenhancement in thermal conductance to ballistic transport ofenergy carriers emitted from the top W spacer to the bottom Wspacer.
We further study this hypothesis by measuring the thermalconductance of a similar multilayer system in which we replace theW spacer with amorphous SiNx. The SiNx spacer is widely used as adielectric in electronic devices due to its high electrical and thermalresistivity28. As a result, we expect the contribution of phonons andelectrons to thermal conductance in SiNx to be negligible comparedto that of W spacer. As shown in Fig. 4a the thermal conductanceacross the Ru/SiNx/5 nm GST/SiNx/Si stack is relatively constantacross all temperatures, which gives further credence to ourhypothesis regarding ballistic electron/phonon transport leading toincreased thermal conductance in the 5 nm GST films between Wcontacts. In this case, no significant enhancement is observed inthermal conductance after the crystallization temperature. Thissuggests that, due to the absence of long-wavelength electrons andphonons in amorphous SiNx, there is no ballistic transportationfrom the top SiNx to the bottom SiNx layer.
Sound speed measurements. In order to gain further insight intothe thermal properties of GST layers below 40 nm, picosecondultrasonic measurements are used to measure the sound speed ofthe GST thin films. In these measurements, the absorption of the
Fig. 4 Thermal conductance behavior of thin GST films in the ballistic and diffusive regime. Thermal conductance for a 5- and b 40-nm-thick GST incontact with different spacers. The error bars are calculated based on 7% uncertainty in the GST film thickness. Experimental data are not available for SiNx
above 340 °C due to film delamination.
NATURE COMMUNICATIONS | https://doi.org/10.1038/s41467-020-20661-8 ARTICLE
NATURE COMMUNICATIONS | (2021) 12:774 | https://doi.org/10.1038/s41467-020-20661-8 | www.nature.com/naturecommunications 7

ultrashort laser pulse launches a strain wave from the samplesurface due to the rapid heating. This results in qualitative"humps" and "troughs" superimposed on the TDTR thermal decaycurve. The temporal spacing of these picosecond ultrasonic sig-nals are related to the time it takes for the strain waves to travelthrough a material and reflect off of sub-surface interfaces asdemonstrated in schematic in Fig. 5b. Thus, with knowledge ofthe thicknesses of each film (determined via TEM), we can esti-mate the sound speed. For a better interpretation of picosecondultrasonic data (the inset in Fig. 5a), the thermal decay curve issubtracted from the best exponential fit to the experimental dataand the residual is presented in Fig. 5a, where the "humps" and"troughs" in the plot are the consequence of strain waves reflec-tion from the top and bottom interfaces of the GST layer.
By measuring the time between the upward "humps" anddownward "troughs" in Fig. 5a, we obtain the time it takes for thestrain waves to travel across the GST. Based on the measuredthickness of the GST film, the longitudinal sound speed in 40 nma-GST and h-GST layers is measured to be 2300 ± 200 and 2800 ±200m s−1, respectively. Although, our sound speed measurementfor a-GST agrees with literature, the sound speed for h-GST isbelow what has been reported12,58. To further understand thediscrepancy between our sound speed measurements andpreviously reported value in the hexagonal phase, we performfirst-principle calculations for GST in both cubic and hexagonalphases. Figures 5c, d show the phonon dispersions for h-GST andc-GST. For the cubic phase, the average group velocities for the LAand TA modes were calculated as 3531 and 1658m s−1,respectively. Due to the structural anisotropy, we observe stronganisotropic phonon dispersion in h-GST, giving anisotropic group
velocities along the in-plane (LA= 3828 m s−1; TA= 2398m s−1)and out-of-plane directions (LA= 3502m s−1; TA= 2567m s−1).The similar sound speed between c-GST and h-GST along the out-of-plane direction is consistent with our observation from thepicosecond ultrasonic measurements. However, quantitatively,higher LA group velocity in our calculation compared to themeasured value is in contrast with the typical under-bindingtendency of the generalized gradient approximation that increasesbond length and softens the phonons leading to lower groupvelocities compared to that in measurements. This implies that theLA mode velocities in h-GST and c-GST thin films are lower thanthat in their bulk counterpart. This reduction is more prominentwhen the sound speed for different thicknesses are measured andplotted in Fig. 5e. As can be seen, as the thickness of GSTdecreases the sound speed in hexagonal phase converges to that ofthe amorphous phase. The reduced measured sound speed for h-GST is most likely due to the existence of amorphous regions nearthe interface, and we hypothesize not intrinsic to the GST. Formore details on sound speed measurements refer to theSupplementary Note 4.
DiscussionAs the memory cell dimension in PCM devices shrink and progresstowards superlattice structures, it is essential to account for theparameters that are not conventionally considered in thick regimesuch as interfacial thermal resistance and ballistic thermal trans-port. In superlattice PCMs, due to existence of several interfaces ina single cell, engineering the interfacial resistance can substantiallyimprove the performance of the device. For superlattice structures,the TBR at GeTe/Sb2Te3 interface is reported59 to be around 3.4
Fig. 5 Sound speed measurements for thin GST films. a Picosecond ultrasonic measurements for 40 nm of a-GST (blue) and 400 °C annealed h-GST(red). The "humps" and "troughs" corresponds to the reflection of strain waves off of W/GST and GST/W interfaces, respectively. The solid linescorrespond to finite-element simulation of strain wave propagation across different layers. b A representation of strain wave and how it propagates andreflects off of various interfaces. c, d Calculated phonon dispersions for h-GST and c-GST. e Sound speed measurements for different thicknesses of a-GSTand h-GST. The error bars are calculated based on 10% uncertainty for the GST film thicknesses.
ARTICLE NATURE COMMUNICATIONS | https://doi.org/10.1038/s41467-020-20661-8
8 NATURE COMMUNICATIONS | (2021) 12:774 | https://doi.org/10.1038/s41467-020-20661-8 | www.nature.com/naturecommunications

m2 KGW−1. Our work, in addition to reporting a significantlyhigher TBR between h-GST and W, ~10m2 KGW−1, demon-strates how judiciously engineering the interface between GST andits adjacent material can reduce the reset current. To demonstratethe effect of TBR on thermal transport, we showed that for a 20-nm-thick GST film the effective thermal conductivity can bereduced by a factor of 4 due to the increased interfacial resistancein h-GST. Our work shows that interfacial resistance is onlyeffective in reducing thermal transport when the GST thickness isless than 40 nm. On the other hand, there is a limitation onreducing the thickness of the GST layer before the thermal trans-port transitions into a ballistic regime. According to our results, asthe thickness of GST reaches ~5 nm, ballistic transport of phonons/electrons from the top W electrode to the bottom electrodeincreases the thermal transport by almost a factor of two. Toprevent this ballistic transport effect, it is important to chooseinterlayers that have carriers with short mean free paths. In ourprevious work60 we demonstrated that materials such as carbonnitride with short mean free path energy carriers can serve as abetter electrode than tungsten when the device dimension reachesbelow 10 nm. For the specific layer configuration studied here, W/GST/W, the GST thickness at which electrode engineering has thebiggest impact in efficiency optimization, is approximately 20 nm.For thinner GST thicknesses, ballistic thermal transport limitsthermal confinement and at larger thicknesses, bulk properties ofthe GST will play a larger role and as a result the effect of TBRbetween GST and the electrode diminishes.
Earlier, we demonstrated that by reducing the W thicknessfrom 5 to 2 nm, thermal conductance can be moderately sup-pressed. In order to demonstrate the effect of W layer thicknesson PCM device performance, we use computational models for aPCM device in confined cell geometry. For this, a 35-nm-thickGST unit is sandwiched between identical W layers (2 or 5 nm),and connected to TaN electrodes. The cell geometry is a cylinderconfined by dielectric materials; we repeat our simulation for twodifferent cell dimensions with lateral size of 20 and 120 nm dia-meter in order to compare thermal transport in small and largedevices. The simulations are carried out by using finite-elementsimulation package COMSOL Multiphysics. Table 1 summarizesthe step-by-step simulation process as we progressively addmeasured parameters into the simulation. Our simulationsdemonstrate that thinning the W layer from 5 to 2 nm, taking35% reduction in thermal conductance into account, leads to resetcurrent (Ireset) drop from 133 to 127 μA for the 20 nm device andfrom 3.07 to 2.88 mA for the 120 nm device, corresponding to4.5% and 6.2% reduction in reset current, respectively. Althoughmanipulating W thickness leads to a modest reduction in thereset current, it should be noted that this is achieved throughpractical changes in an interface that is not typically optimized forits thermal properties. Further optimization along these lines
could lead to larger improvements. In order to demonstrate this,we extend our simulations to account for a range of TBR betweenthe phase change unit and the adjacent electrode. It is expectedthat the TBR between GST and most materials to fall in the rangeof 1–100 m2 K GW−1 (ref. 61). The result of our simulations forreset current as a function TBR between PCM/electrode and thecell configuration for a 120 nm confined cell are presented inFigs. 6a, b, respectively. Our predictions suggest that the resetcurrent can be reduced up to ~40% and ~50% depending on thedevice lateral size if the TBR changes from 1 to 100m2 K GW−1.In superlattice structures where there are multiple interfaces, thereset current can be even further reduced. Boniardi et al.62
observed nearly 60% reduction in set and reset current for (GeTe/Sb2Te3)/Sb2Te3 superlattice compared to bulk GST, which theyattributed to increased thermal resistance in the superlatticesfrom the period interfaces as compared to the GST. Our resultshighlight the importance of interfacial engineering on thermalconfinement of PCM memory cells.
In summary, we reported on the thermal properties of GST forthicknesses below 40 nm and compared the results against thethick film regime (160 nm). We demonstrated that as the lengthscale of PCM cells decrease to the dimensions of the order ofcarriers’ mean free paths, the mechanism of heat transportdrastically differs from its bulk. In addition, our results demon-strate that as the GST transition from one crystallographicphase to another, the interfacial resistance changes. The TBR fora-GST/W, c-GST/W, and h-GST/W interfaces are measured to beapproximately 25 ± 5, 3 ± 1.5, 10 ± 2 m2 K GW−1, respectively.Our molecular dynamics simulations results suggest that a changein phase from cubic to hexagonal does not significantly alter theTBC. However, structural disorder at the interface plays animportant role in the reduction of TBC from the cubic to thehexagonal phase. Overall, the interfacial resistance for a 20-nm-thick GST film results in a factor of 4 reduction in the effectivethermal conductivity from ~1.3 to ~0.3Wm−1 K−1 at roomtemperature. Our work illustrated that the TBR can be employedto substantially suppress heat transport in phase change units. Weuse simulations to elucidate the effect of TBR on the reset currentfor two different cell sizes. According to these simulations, theTBR can lead up to 40% and 50% reduction in reset current. Theresults presented in this work improve our knowledge of thermaltransport mechanism in ultra-thin phase change units and enableus to design PCM devices with superior performance.
MethodsTDTR is a non-contact optical measurement technique that utilizes a modulatedpump beam to create an oscillatory temperature rise at the surface of the sample,and a probe beam to measure the changes in the thermoreflectance of the surfacedue to the thermal excitation. In our two-tint TDTR configuration, the output of an80MHz Ti:sapphire femtosecond pulsed laser with a center wavelength of 808 nmis split into two paths, a pump and a probe. The pump beam is passed through anelectro-optical modulator and modulated at a frequency of 8.4 MHz, while theprobe beam is directed down a mechanical delay stage in order to induce a time-dependent signal relative to the arrival of pump pulses. The beams are combined bypassing the probe through a high-pass filter and then both beams are directedthrough a ×10 objective resulting in spot radius of 22 and 11 μm for the pump andprobe at the sample surface, respectively. The uncertainty for room temperaturemeasurements are determined by considering 7% change in the thickness of the Rutransducer. For calculating the uncertainty in thermal conductivity as a function oftemperature for thin film samples, since the thickness of GST film alters acrossdifferent temperature ranges, we assume 7% change in the thickness of GST insteadof the transducer.
For ab initio density functional calculations, we considered two special quasir-andom structures with 45 atoms (10 Ge, 10 Sb, and 25 Te atoms) to represent thec-GST and a-GST. The a-GST structure was obtained from a rapid quench aftermolecular dynamics simulations using GGA-PBE exchange-correlation functionalform as implemented in VASP63,64. The details of the structures can be foundelsewhere65. For h-GST, we used the structure given by Kooi et al.66 as it gives amore stable structure58 compared to that given by Matsunaga et al.67. The har-monic interatomic force constants (IFCs) were calculated using VASP-phonopy68
Table 1 The impact of parameters such as thermalconductivity (kGST), thermal boundary resistance betweenGST and dielectric (TBRGST/d) or GST and tungsten(TBRGST/W), tungsten electrode thickness (dW) extractedfrom the empirical measurements on the reset current(Ireset) for devices with lateral size of 20 and 120 nm.
kGST (Wm−1 K−1) 0.8 k (T) k (T) k (T) k (T)TBRGST/d (GW−1 m2 K) 10 10 41 41 41TBRGST/W (GW−1 m2 K) 10 10 10 TBR(T) TBR(T)dW (nm) 5 5 5 5 2Ireset (μA) 20 nm device 183 186 137 133 127Ireset (μA) 120 nm device 3.35 3.40 3.09 3.07 2.88
NATURE COMMUNICATIONS | https://doi.org/10.1038/s41467-020-20661-8 ARTICLE
NATURE COMMUNICATIONS | (2021) 12:774 | https://doi.org/10.1038/s41467-020-20661-8 | www.nature.com/naturecommunications 9

interface with a 2 × 2 × 2 supercell where an energy cutoff of 500 eV was used. Thecalculated phonon dispersions for h-GST and c-GST are given in Figs. 5c, d.However, the calculated IFCs at 0 K resulted in imaginary modes for a-GSTindicating that harmonic IFCs are not sufficient to describe the lattice dynamics ofa-GST.
The finite-element simulations of the strain wave propagation shown in Fig. 5were implemented using Structural Mechanics and Acoustics module in COMSOLMultiphysics. To form a symmetric coherent wave, periodic boundary conditionswere used for the top and bottom boundary along the Y-axis and low reflectingboundary condition on both ends along the X-axis. The material properties inputfor these simulations are density, Young’s modulus, and Poisson’s ratio. The densityfor the amorphous and crystalline state is assumed to be 5870 and 6200 kgm−3. TheYoung’s modulus is obtained from our empirical sound speed measurement wherewe calculate 32 GPa for a-GST and 50 GPa for h-GST. The thickness of the layersare chosen to replicate the experimental values, i.e. for Ru, W, GST, and Si thethicknesses are 80, 5, 40 nm, and semi-infinite, respectively. To create the strainwaves, a short displacement pulse (half-sine) is applied to the surface of the Ru andthe resulting echoes, generated due to the reflection of strain waves off of differentinterfaces, are probed at the Ru surface in temporal resolution.
Reporting summary. Further information on research design is available in the NatureResearch Reporting Summary linked to this article.
Data availabilityThe data that support the findings of this study are available from the correspondingauthor upon reasonable request.
Received: 20 April 2020; Accepted: 15 December 2020;
References1. Wong, H.-S. P. et al. Phase change memory. Proc. IEEE 98, 2201–2227 (2010).2. Zhang, W., Mazzarello, R., Wuttig, M. & Ma, E. Designing crystallization in
phase-change materials for universal memory and neuro-inspired computing.Nat. Rev. Mater. 4, 150–168 (2019).
3. Simpson, R. E. et al. Interfacial phase-change memory. Nat. Nanotechnol. 6,501 (2011).
4. Rao, F. et al. Reducing the stochasticity of crystal nucleation to enablesubnanosecond memory writing. Science 358, 1423–1427 (2017).
5. Loke, D. et al. Breaking the speed limits of phase-change memory. Science 336,1566–1569 (2012).
6. Kim, C. et al. Fullerene thermal insulation for phase change memory. Appl.Phys. Lett. 92, 013109 (2008).
7. Ahn, C. et al. Energy-efficient phase-change memory with graphene as athermal barrier. Nano Lett. 15, 6809–6814 (2015).
8. Shen, J. et al. Thermal barrier phase change memory. ACS Appl. Mater.Interfaces 11, 5336–5343 (2019).
9. Ding, K. et al. Phase-change heterostructure enables ultralow noise and driftfor memory operation. Science 366, 210–215 (2019).
10. Saito, Y. et al. Chalcogenide materials engineering for phase change memoryand future electronics applications: from Sb-Te to Bi-Te. Phys. Status Solidi(RRL) https://doi.org/10.1002/pssr.202000414 (2020).
11. Momand, J. et al. Interface formation of two-and three-dimensionally bondedmaterials in the case of GeTe-Sb2Te3 superlattices. Nanoscale 7, 19136–19143(2015).
12. Lyeo, H.-K. et al. Thermal conductivity of phase-change material Ge2Sb2Te5.Appl. Phys. Lett. 89, 151904 (2006).
13. Risk, W. P., Rettner, C. T. & Raoux, S. Thermal conductivities and phasetransition temperatures of various phase-change materials measured by the 3ω method. Appl. Phys. Lett. 94, 101906 (2009).
14. Li, Z. et al. Grain boundaries, phase impurities, and anisotropic thermalconduction in phase-change memory. IEEE Electron Dev. Lett. 32, 961–963(2011).
15. Scott, E. A. et al. Thermal conductivity of (Ge2Sb2Te5) 1−xCx phase changefilms. J. Appl. Phys. 128, 155106 (2020).
16. Xiong, F., Liao, A. D., Estrada, D. & Pop, E. Low-power switching of phase-change materials with carbon nanotube electrodes. Science 332, 568–570(2011).
17. Kim, I. S. et al. High performance pram cell scalable to sub-20nm technologywith below 4f2 cell size, extendable to dram applications. In 2010 Symposiumon VLSI Technology, 203–204 (IEEE, 2010).
18. Raoux, S., Xiong, F., Wuttig, M. & Pop, E. Phase change materials and phasechange memory. MRS Bull. 39, 703–710 (2014).
19. Xiong, F. et al. Self-aligned nanotube-nanowire phase change memory. NanoLett. 13, 464–469 (2013).
20. Burr, G. W. et al. Access devices for 3d crosspoint memory. J. Vac. Sci.Technol. B 32, 040802 (2014).
21. Swartz, E. T. & Pohl, R. O. Thermal boundary resistance. Rev. Mod. Phys. 61,605 (1989).
22. Hopkins, P. E. Thermal transport across solid interfaces with nanoscaleimperfections: effects of roughness, disorder, dislocations, and bonding onthermal boundary conductance. ISRN Mech. Eng. https://doi.org/10.1155/2013/6825862013 (2013).
23. Scott, E. A., Gaskins, J. T., King, S. W. & Hopkins, P. E. Thermal conductivityand thermal boundary resistance of atomic layer deposited high-k dielectricaluminum oxide, hafnium oxide, and titanium oxide thin films on silicon. APLMater. 6, 058302 (2018).
24. Bozorg-Grayeli, E., Reifenberg, J. P., Chang, K. W., Panzer, M. & Goodson, K.E. Thermal conductivity and boundary resistance measurements of GeSbTeand electrode materials using nanosecond thermoreflectance. In 2010 12thIEEE Intersociety Conference on Thermal and Thermomechanical Phenomenain Electronic Systems (ITherm), 1–7 (IEEE, 2010).
25. Kang, K., Koh, Y. K., Chiritescu, C., Zheng, X. & Cahill, D. G. Two-tint pump-probe measurements using a femtosecond laser oscillator and sharp-edgedoptical filters. Rev. Sci. Instrum. 79, 114901 (2008).
26. Furukawa, G. T., Reilly, M. L. & Gallagher, J. S. Critical analysis of heat-capacity data and evaluation of thermodynamic properties of ruthenium,rhodium, palladium, iridium, and platinum from 0 to 300k. a survey of theliterature data on osmium. J. Phys. Chem. Ref. Data 3, 163–209 (1974).
27. Zalden, P. et al. Specific heat of (GeTe) x (Sb2Te3) 1-x phase-changematerials: the impact of disorder and anharmonicity. Chem. Mater. 26,2307–2312 (2014).
28. Gaskins, J. T. et al. Investigation and review of the thermal, mechanical,electrical, optical, and structural properties of atomic layer deposited high-kdielectrics: beryllium oxide, aluminum oxide, hafnium oxide, and aluminumnitride. ECS J. Solid State Sci. Technol. 6, N189 (2017).
Fig. 6 The effect of thermal boundary resistance on reset current for a confined memory cell geometry. a Simulation results for the reset current as afunction of thermal boundary resistance (TBR) between GST and W for two different device lateral sizes. b Schematic for the PCM configuration and itscorresponding temperature gradient.
ARTICLE NATURE COMMUNICATIONS | https://doi.org/10.1038/s41467-020-20661-8
10 NATURE COMMUNICATIONS | (2021) 12:774 | https://doi.org/10.1038/s41467-020-20661-8 | www.nature.com/naturecommunications

29. Olson, D. H., Freedy, K. M., McDonnell, S. J. & Hopkins, P. E. The influenceof titanium adhesion layer oxygen stoichiometry on thermal boundaryconductance at gold contacts. Appl. Phys. Lett. 112, 171602 (2018).
30. Jeong, M. et al. Enhancement of thermal conductance at metal-dielectricinterfaces using subnanometer metal adhesion layers. Phys. Rev. Appl. 5,014009 (2016).
31. Lee, J. et al. Thermal conductivity anisotropy and grain structure in ge2sb2te5films. J. Appl. Phys. 109, 084902 (2011).
32. Koenig, J. D., Boettner, H., Tomforde, J. & Bensch, W. Thermoelectricproperties of phase-change materials. In 2007 26th International Conferenceon Thermoelectrics, 390–393 (IEEE, 2007).
33. Luo, C., Ryll, H., Back, C. H. & Radu, F. X-ray magnetic linear dichroism as aprobe for non-collinear magnetic state in ferrimagnetic single layer exchangebias systems. Sci. Rep. 9, 1–9 (2019).
34. Adnane, L. et al. High temperature electrical resistivity and seebeck coefficientof Ge2Sb2Te5 thin films. J. Appl. Phys. 122, 125104 (2017).
35. Njoroge, W. K., Wöltgens, H.-W. & Wuttig, M. Density changes uponcrystallization of Ge2Sb2.04Te4.74 films. J. Vac. Sci. Technol. A 20, 230–233(2002).
36. DaSilva, J. L. F., Walsh, A. & Lee, H. Insights into the structure of the stableand metastable (GeTe)m(Sb2Te3)n compounds. Phys. Rev. B 78, 224111(2008).
37. Wang, J.-J. et al. Genesis and effects of swapping bilayers in hexagonalGeSb2Te4. Chem. Mater. 30, 4770–4777 (2018).
38. Wełnic, W., Kalb, J. A., Wamwangi, D., Steimer, C. & Wuttig, M. Phase changematerials: from structures to kinetics. J. Mater. Res. 22, 2368–2375 (2007).
39. Lotnyk, A. et al. Atomic structure and dynamic reconfiguration of layereddefects in van der waals layered Ge-Sb-Te based materials. Acta Mater. 141,92–96 (2017).
40. Mio, A. M. et al. Impact of bonding on the stacking defects in layeredchalcogenides. Adv. Funct. Mater. 29, 1902332 (2019).
41. Behrens, M. et al. Ultrafast interfacial transformation from 2d-to 3d-bondedstructures in layered ge-sb-te thin films and heterostructures. Nanoscale 10,22946–22953 (2018).
42. Wang, R. et al. 2d or not 2d: strain tuning in weakly coupled heterostructures.Adv. Funct. Mater. 28, 1705901 (2018).
43. Wang, J. et al. Unconventional two-dimensional germanium dichalcogenides.Nanoscale 10, 7363–7368 (2018).
44. Cheng, Y. et al. Understanding the structure and properties of sesqui-chalcogenides (ie, V2VI3 or Pn2Ch3 (Pn= Pnictogen, Ch= chalcogen)compounds) from a bonding perspective. Adv. Mater. 31, 1904316 (2019).
45. Reifenberg, J. P. et al. Thickness and stoichiometry dependence of the thermalconductivity of GeSbTe films. Appl. Phys. Lett. 91, 111904 (2007).
46. Lee, J. et al. Phonon and electron transport through Ge2Sb2Te5 films andinterfaces bounded by metals. Appl. Phys. Lett. 102, 191911 (2013).
47. Siegrist, T. et al. Disorder-induced localization in crystalline phase-changematerials. Nat. Mater. 10, 202–208 (2011).
48. Zhang, W. et al. Role of vacancies in metal-insulator transitions of crystallinephase-change materials. Nat. Mater. 11, 952–956 (2012).
49. Battaglia, J.-L. et al. Thermal resistance at Al-Ge2Sb2Te5 interface. Appl. Phys.Lett. 102, 181907 (2013).
50. Campi, D., Baldi, E., Graceffa, G., Sosso, G. C. & Bernasconi, M. Electron-phonon interaction and thermal boundary resistance at the interfaces ofGe2Sb2Te5 with metals and dielectrics. J. Phys. Condens. Matter 27, 175009(2015).
51. Tian, Z., Esfarjani, K. & Chen, G. Enhancing phonon transmission across a si/ge interface by atomic roughness: first-principles study with the green’sfunction method. Phys. Rev. B 86, 235304 (2012).
52. English, T. S. et al. Enhancing and tuning phonon transport at vibrationallymismatched solid-solid interfaces. Phys. Rev. B 85, 035438 (2012).
53. Gorham, C. S. et al. Ion irradiation of the native oxide/silicon surface increasesthe thermal boundary conductance across aluminum/silicon interfaces. Phys.Rev. B 90, 024301 (2014).
54. Giri, A. & Hopkins, P. E. A review of experimental and computationaladvances in thermal boundary conductance and nanoscale thermal transportacross solid interfaces. Adv. Funct. Mater. 30, 1903857 (2020).
55. Chong, T. et al. Thickness dependent nano-crystallization in Ge2Sb2Te5 filmsand its effect on devices. Jpn. J. Appl. Phys. 46, 2211 (2007).
56. Choi, D. et al. Electron mean free path of tungsten and the electrical resistivityof epitaxial (110) tungsten films. Phys. Rev. B 86, 045432 (2012).
57. Chen, Y., Ma, J. & Li, W. Understanding the thermal conductivity and lorenznumber in tungsten from first principles. Phys. Rev. B 99, 020305 (2019).
58. Mukhopadhyay, S., Lindsay, L. & Singh, D. J. Optic phonons and anisotropicthermal conductivity in hexagonal Ge2Sb2Te5. Sci. Rep. 6, 37076 (2016).
59. Okabe, K. L. et al. Understanding the switching mechanism of interfacialphase change memory. J. Appl. Phys. 125, 184501 (2019).
60. Aryana, K. et al. Thermal properties of carbon nitride toward use as anelectrode in phase change memory devices. Appl. Phys. Lett. 116, 043502(2020).
61. Reifenberg, J. P., Kencke, D. L. & Goodson, K. E. The impact of thermalboundary resistance in phase-change memory devices. IEEE Electron DeviceLett. 29, 1112–1114 (2008).
62. Boniardi, M. et al. Evidence for thermal-based transition in super-lattice phasechange memory. Phys. Status Solidi (RRL) 13, 1800634 (2019).
63. Kresse, G. & Furthmüller, J. Efficiency of ab-initio total energy calculations formetals and semiconductors using a plane-wave basis set. Comput. Mater. Sci.6, 15–50 (1996).
64. Kresse, G. & Joubert, D. From ultrasoft pseudopotentials to the projectoraugmented-wave method. Phys. Rev. B 59, 1758 (1999).
65. Mukhopadhyay, S., Sun, J., Subedi, A., Siegrist, T. & Singh, D. J. Competingcovalent and ionic bonding in ge-sb-te phase change materials. Sci. Rep. 6,25981 (2016).
66. Kooi, B. J. & De Hosson, J. T. M. Electron diffraction and high-resolutiontransmission electron microscopy of the high temperature crystal structures ofGe x Sb2Te3. x (x=1, 2, 3) phase change material. J. Appl. Phys. 92, 3584–3590(2002).
67. Matsunaga, T. et al. Structural investigation of Ge3Sb2Te6, an intermetalliccompound in the GeTe-Sb2Te3 homologous series. Appl. Phys. Lett. 90,161919 (2007).
68. Togo, A. & Tanaka, I. First principles phonon calculations in materialsscience. Scr. Mater. 108, 1–5 (2015).
AcknowledgementsWe appreciate support from Western Digital Technologies, Inc. This manuscript is basedupon work supported by the Air Force Office of Scientific Research under Award No.FA9550-18-1-0352. S.M. acknowledges support from NRC Research Associateship.
Author contributionsK.A., J.N., J.T.G., M.K.G., and P.E.H designed the experiment. J.N. and J.C.R. made thesamples. E.R.H. and J.M.H. characterized the samples. K.A., J.T.G., and D.H.O. per-formed the experiments. K.A., D.A.S., Z.B., S.M., and A.G. performed the simulations.K.A., J.T.G., M.K.G., and P.E.H wrote the manuscript.
Competing interestsThe authors declare no competing interests.
Additional informationSupplementary information is available for this paper at https://doi.org/10.1038/s41467-020-20661-8.
Correspondence and requests for materials should be addressed to P.E.H.
Peer review information Nature Communications thanks the anonymous reviewer(s) fortheir contribution to the peer review of this work. Peer reviewer reports are available.
Reprints and permission information is available at http://www.nature.com/reprints
Publisher’s note Springer Nature remains neutral with regard to jurisdictional claims inpublished maps and institutional affiliations.
Open Access This article is licensed under a Creative CommonsAttribution 4.0 International License, which permits use, sharing,
adaptation, distribution and reproduction in any medium or format, as long as you giveappropriate credit to the original author(s) and the source, provide a link to the CreativeCommons license, and indicate if changes were made. The images or other third partymaterial in this article are included in the article’s Creative Commons license, unlessindicated otherwise in a credit line to the material. If material is not included in thearticle’s Creative Commons license and your intended use is not permitted by statutoryregulation or exceeds the permitted use, you will need to obtain permission directly fromthe copyright holder. To view a copy of this license, visit http://creativecommons.org/licenses/by/4.0/.
© The Author(s) 2021
NATURE COMMUNICATIONS | https://doi.org/10.1038/s41467-020-20661-8 ARTICLE
NATURE COMMUNICATIONS | (2021) 12:774 | https://doi.org/10.1038/s41467-020-20661-8 | www.nature.com/naturecommunications 11