Reinterpretation of aeromagnetic data and contribution to ...

This PDF is a selection from an out-of-print volume from the National Bureauof Economic Research
Volume Title: Essays on Interest Rates, Volume 1
Volume Author/Editor: Jack M. Guttentag and Phillip Cagan, eds.
Volume Publisher: NBER
Volume ISBN: 0-87014-201-1
Volume URL: http://www.nber.org/books/gutt69-1
Publication Date: 1969
Chapter Title: Interest Rates and Bank Reserves—A Reinterpretation ofthe Statistical Association
Chapter Author: Phillip Cagan
Chapter URL: http://www.nber.org/chapters/c1212
Chapter pages in book: (p. 223 - 271)

6
Interest Rates and Bank Reserves —
A Reinterpretation of the StatisticalAssociation Phillip Cagan
I. Introduction
Many studies of banking have found that reserve ratios are correlatedwith interest rates; the relationship has become the centerpiece oftheoretical and econometric models of the financial sector linking thesupply of money to market developments. A currently popular inter-pretation of the association is that banks equate the marginal ad-vantages of additional free reserves and earning assets; the two substi-tute for each other in bank portfolios depending upon the cost ofbonowing reserves and the rate of return on assets. Given the quantityof unborrowed reserves provided by the monetary authorities, a rela-tion between free reserves and interest rates helps determine thesupply of bank deposits.
That an association exists between reserves and interest rates haslong been noted in U.S. data. While the interest-rate data need nospecial comment, the data on reserves do. Before 1914, the associationpertained to excess reserves (vault cash and balances with reserve
NOTE: Circulation of an earlier version of this study in 1966 elicited many commentswhich were most useful in preparing this revision. I wish to thank in particular KarlBrunner, Richard Davis, Peter Frost,Jack Guttentag, George Morrison, AnnaJacobsonSchwartz, Robert Shay and William L. Silber. The conclusions are entirely mine, ofcourse.
I am also indebted for supervision of the computations to Josephine Trubek and JaeWon Lee, research assistants, and to Martha T. Jones in the data processing department,at the National Bureau.

224 Essays on Interest Ratesagents minus required reserves); at that time there was no central bankto create and lend reserves. Since 1914, when Federal Reserve Banksbegan providing a discount window for member banks, it has pertainedto excess reserves and member-bank borrowing from Reserve Banks,or to free reserves (excess reserves minus borrowing). The associa-tion for both periods—before and after 1914—is similar, as will beshown later. The explanation given for the phenomenon, however, hasturned completely around. Until the late 1930's, most studies (such asthe well-known work of Riefler[39] and Tinbergen [45] 1) assumed thatthe association reflected an effect of the reserve ratio on interest rates.Then, following Turner's 1938 criticism [46] of Riefler's study, thedirection of influence was reversed—interest rates were thought toaffect reserve ratios. The new explanation was expressed in terms ofthe marginal to banks of free reserves and other assets.This later view has come to monopolize opinion. The Appendix to thischapter briefly surveys empirical studies on this subject, documentingthe shift in interpretation.
Evidence on the association is examined in Section II. Section IIItests the earlier explanation and Section IV the later explanation. Bothare found to be inadequate. Finally, Section V discusses and testsanother interpretation of the association. The conclusion is that thepursuit of short-run profits motivated bank borrowing much morestrongly in the 1920's than it did in the 1950's, but such behavior ac-counts for little, if any, of the association in either period. The ex-planation offered here is that bank borrowing from the Federal Reserveincreases as monetary conditions tighten, because the banks arestriving to accommodate their regular loan customers. Interest ratesappear to play a small role in the variations of deposit growth due tochanges in free reserves.
II. Interest Rates and Reserve Ratios: The Statistical Association
The association referred to above pertains mainly to short-run cyclicalmovements. There have been long-run movements in the excess re-serve (or free reserve) ratio of banks, but they reflect institutional de-velopments or special circumstances.2 We may focus on short-run
'Bracketed numbers refer to works cited in the references following the Appendix tothis chapter.
2 Long-run movements are discussed in my Determinants and Effects of Changes inthe Money Stock [7].

Interest Rates and Bank Reserves 225
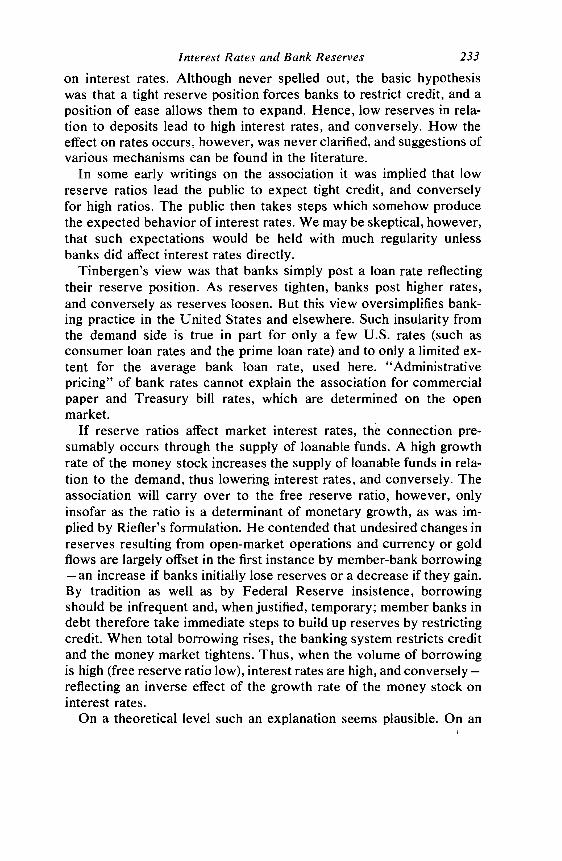
movements by grouping the data according to the stages of businesscycles. Chart 6-1 presents National Bureau reference cycle patterns ofthe free reserve ratio of member banks and the commercial paperrate, which behaves similarly to the Treasury bill rate typically usedin this comparison. The patterns for the two series tend to move in-versely. Although far from perfect, the association is fairly strong formost periods. The amplitude of cyclical movements in the reserve ratiohas varied, however. They were large in the 1920's and even larger inthe 1930's, but were quite small in the 1950's. Short-term interestrates fluctuated with roughly the same amplitude in the 1950's as theydid in the 1920's, but with a much smaller amplitude in the interveningperiod. A sharp decline in the early 1930's brought short-term rates tovery low levels, where they remained with only minor changes duringthat decade and most of the next.
The strongest evidence of an inverse association is provided by thedata for the 1920's, the period studied by Riefler. The period sinceWorld War II, to which most recent studies are confined, has produceda smaller variety of cyclical patterns and, so far, less revealing evi-dence. The difference in the relation over time can be seen in Chart 6-2,which presents a scatter diagram of changes from stage to stage of thereference cycle patterns 1919—61. The chart distinguishes the threeperiods discussed. The points for the middle period 1933—38 show nocorrelation. Those for 19 19—33 show the strongest correlation, thoughfour observations in particular for that period (dated on the chart)stand out as extremes. The points for the latest period also show anegative correlation, but with a much flatter slope than that for the1920's. The flatter slope reflects the smaller amplitude of fluctuation inthe free reserve ratio after World War II compared with the 1920's,given the roughly unchanged amplitude of fluctuation in short-terminterest rates.
Although Charts 6-1 and 6-2 show little association for the 1930'sand early 1940's, that period is often cited as dramatic proof of suchan association. After 1933, banks stopped borrowing from FederalReserve Banks and accumulated excess reserves at a rapid pace, whileshort-term interest rates fell sharply, creating a nice inverse associa-tion between the two series for the period as a whole. The changes
Although many studies of the association do not divide reserves by deposits, it isdesirable to do so, particularly when examining data for long time periods.
Data on member-bank free reserves have been published by the Board of Governorsof the Federal Reserve System since 1929; earlier figures used here are estimates of theNational Bureau.

226 Essays on Interest RatesCHART 6-1. Reference Cycle Patterns of Member-Bank Free Reserve Ratioand Commercial Paper Rate, 1919—61
Free reserve ratio (per cent)Commercial paper rate (per cent per annum)
rate Reserve ratio Paper rate
+6
+4
+2
0
1938-45 -
1945-49 -
+2— —
0
— S.,,__
0
+2
+2
—2 -
ii iii w VVt VII VIII IX
-2 -
0
2
0
3
2
5
4
3
2
5
4
3
2
+2
,///
0
—2
1949-54 -
S.—
1954-58—5'
'N
1958-61 -
I I I
0
,///
SOURCE: Same as Table 6-1.
I I
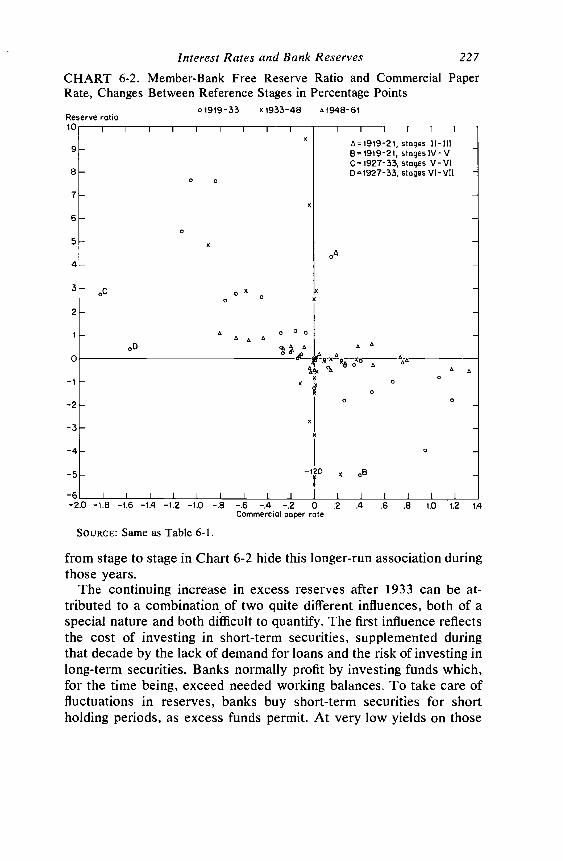
Interest Rates and Bank Reserves 227CHART 6-2. Member-Bank Free Reserve Ratio and Commercial PaperRate, Changes Between Reference Stages in Percentage Points
o1919-33 x1933-43 A1948-61Reserve ratioIC,
I I I I I I I I I I I
*A= 1919—21, stages II— IllB=19I9-21, stages 1V-VC =1927-33, stages V-VI
8 DI927-33, stages VI-Vil0 0
7x
60
4-
00
2-01- A A A
00 A A
0 £_10
x 0
0
-2- ° °
*-3 -
K
-4- 0
—120 x
—6 I I I I I I
-2.0—1.8—1.6-1.4-1.2-1.0-.8 -.6 -.4 —.2 0 .2 .4 .6 .8 1.0 1.2 1,4Commercial paper rote
SOURCE: Same as Table 6-1.
from stage to stage in Chart 6-2 hide this longer-run association duringthose years.
The continuing increase in excess reserves after 1933 can be at-tributed to a combination of two quite different influences, both of aspecial nature and both difficult to quantify. The first influence reflectsthe cost of investing in short-term securities, duringthat decade by the lack of demand for loans and the risk of investing inlong-term securities. Banks normally profit by investing funds which,for the time being, exceed needed working balances. To take care offluctuations in reserves, banks buy short-term securities for shortholding periods, as excess funds permit. At very low yields on those

228 Essays on Interest Ratessecurities, however, the transaction costs (broadly interpreted) ofbuying and selling may equal or exceed the return; excess funds willthen be held idle. If the break-even point for most banks were as highas 1 per cent on Treasury bills and commercial paper, it would helpexplain the sharp rise in the excess reserve ratio after 1933 when thoseshort-term rates fell below that level,4 even though the changes fromstage to stage in Chart 6-2 reveal no relation.
Transaction costs undoubtedly did not exceed the return on loansand bonds, however. Beyond some moderate amount, depending uponthe circumstances of each individual bank, excess reserves are notneeded to meet expected drains. If the preceding argument were to ex-plain an accumulation beyond that amount in the 1.930's, it would haveto be that the demand for bank loans was limited, and that bonds ap-peared unattractive to banks at the low yields then available becauseof the danger of capital losses if yields later increased. (The situationchanged in 1942 when the Federal Reserve began to support U.S.bond prices, preventing any increase in yields while the policy con-tinued.) This danger does not seem to have been sufficient to explainwhy banks did not purchase bonds during the 1930's. After all, yieldscontinued to fall throughout the decade and there was little prospect ofa major rise. It cannot, however, be ruled out as a minor reason for theaccumulation of excess reserves.
A second influence on excess reserves during that period was theshattering experience of the financial crisis which culminated in thecomplete suspension of bank operations for one week in March 1933.For many years thereafter, banks remained extremely reluctant to ac-quire any but the highest-grade assets, which were limited in supply.There is considerable evidence to support this interpretation.5 Banksshifted their portfolios after 1933 toward cash and short-term earningassets which were highly liquid and low in risk, and continued to do sountil the wartime support policy of the Reserve Banks made long-termbonds substantially more liquid. This shift produced an unusually largeaccumulation of excess reserves.
4This argument is presented and tested by Peter A. Frost [17]. This period has alsobeen interpreted as providing unique evidence for the existence of a "liquidity trap"for banks (that is, a flattening of their demand curve for reserves at very low rates), onthe argument that the large increases in the ratio after the mid-1930's were accompaniedby very low, virtually constant short-term interest rates (see Horwich [24], and thereferences cited therein).
It is discussed by Friedman and Schwartz [16], Chapter 9, and was stressed by me[7]. Also see the supporting evidence presented by George R. Morrison [31], Chap-ters 3—5.
interest Rates and Bank Reserves 229
The 1930's and 1940's wove together some very special circum-stances, making interpretation difficult. They do not provide clearevidence on the behavior of banks in ordinary times. Moreover, in the1920's and 1950's the amount of excess reserves and the amplitude oftheir fluctuation were usually too small to warrant our attention; mostof the fluctuation in free reserves ratios reflected borrowing from Re-serve Banks. The subsequent analysis concentrates on the borrowingduring those two decades, though for comparison 1929—3 8 is includedin some regressions for the full period (with the two world wars ex-cluded).
Many of the patterns in Chart 6-1 portray a standard response tocycles in business activity—interest rates conforming positively andthe reserve ratio inversely — which raises a question of spurious asso-ciation. These two variables may appear to be related solely becausethey both conform to business cycles. Corresponding cyclical move-ments in two variables tempt us to infer that they are directly related,but such evidence by itself is weak: Since many variables conform tobusiness cycles, cyclical movements in each of them can be attributedto a wide variety of possible relationships. This is true of reserve ratiosand interest rates, which may display associated cyclical fluctuationsfor many reasons. Changes between successive stages, as shown inChart 6-2, suppress the serial correlation existing in the monthly seriesand make trends less prominent, but common cyclical influences of apossibly spurious nature may still remain. One way to remove such in-fluences is to hold the average cyclical pattern constant by means ofdummy variables. Since reference cycles have nine stages, we needseven dummy variables, one for each of seven of the eight stage-to-stage changes (one less than the total number to avoid overdeterminingthe regression). The dummy variables represent separate constantterms for each stage change and absorb any covariation in the othervariables which would result from a common cyclical pattern. This isequivalent to fitting eight separate regressions with the requirementthat all of them have the same regression coefficient for the nondummyvariables.
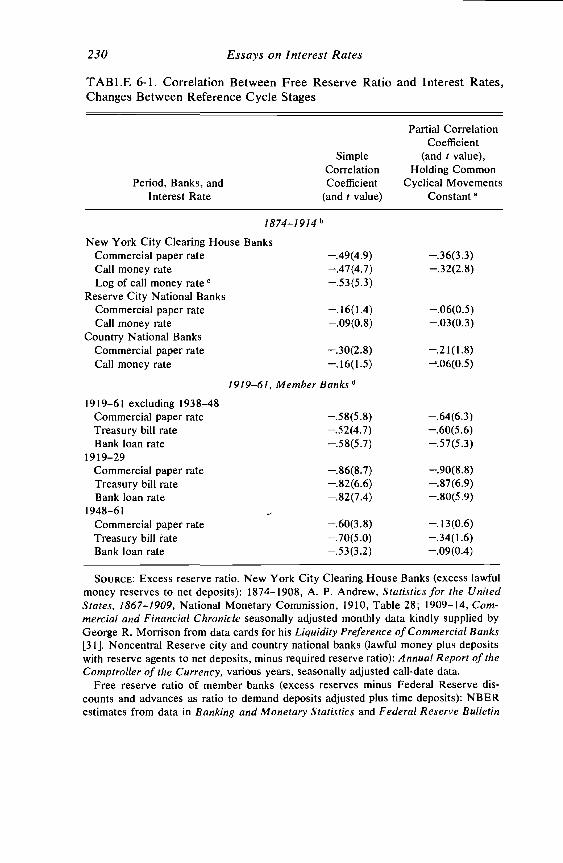
Table 6-1 reports the correlations of stage-to-stage changes, with andwithout dummy variables, for various periods. The interest series arethe main short-term rates available which appear relevant to the man-agement of bank reserves. The atypical 1938—48 period of bondpegging is excluded, and the very different decades following the twoworld wars are shown separately. The table reveals a high negativeassociation, confirming earlier studies. For the much cited 1948—61
230 Essays on Interest Rates
TABLE 6-1. Correlation Between Free Reserve Ratio and Interest Rates,Changes Between Reference Cycle Stages
Partial CorrelationCoefficient
Simple (and t value),Correlation Holding Common
Period, Banks, andinterest Rate
Coefficient(and t value)
Cyclical MovementsConstant a
1874—1914 b
New York City Clearing House BanksCommercial paper rate —.49(4.9) —.36(3.3)Call money rate —.47(4.7) —.32(2.8)Log of call money rate c .53(5.3)
Reserve City National BanksCommercial paper rate —.16(1.4) —.06(0.5)Call money rate —.09(0.8) —.03(0.3)
Country National BanksCommercial paper rate —.30(2.8) —.21(1.8)Call money rate —.16(1.5)
1919—61, Member Banksd
1919—61 excluding 1938—48
Commercial paper rate —.58(5.8) —.64(6.3)Treasury bill rate —.52(4.7) —.60(5.6)Bank loan rate —.58(5.7) —.57(5.3)
19 19—29Commercial paper rate —.86(8.7) —.90(8.8)Treasury bill rate —.82(6.6) —.87(6.9)Bank loan rate —.82(7.4) —.80(5.9)
1948—61Commercial paper rate —.60(3.8) —.13(0.6)Treasury bill rate —.70(5.0) —.34(1.6)Bank loan rate —.53(3.2) —.09(0.4)
SOURCE: Excess reserve ratio. New York City Clearing House Banks (excess lawfulmoney reserves to net deposits): 1874—1908, A. P. Andrew, Statistics for the UnitedStates, 1867—1 909, National Monetary Commission, 1910, Table 28; 1909—14, Com-mercial and Financial Chronicle seasonally adjusted monthly data kindly supplied byGeorge R. Morrison from data cards for his Liquidity Preference of Commercial Banks[31]. Noncentral Reserve city and country national banks (lawful money plus depositswith reserve agents to net deposits, minus required reserve ratio): Annual Report of theComptroller of the Currency, various years, seasonally adjusted call-date data.
Free reserve ratio of member banks (excess reserves minus Federal Reserve dis-counts and advances as ratio to demand deposits adjusted plus time deposits): NBERestimates from data in Banking and Monetary Statistics and Federal Reserve Bulletin

interest Rates and Bank Reserves 231
period, however, the dummy variables reduce the correlation to in-significance, indicating that the association then cannot be distin-guished from a common response of the variables to business cycles.Yet, for the 1920's the correlation remains highly significant despitethe inclusion of dummy variables, suggesting that the 1948—61 corre-lation probably is, after all, genuine though weak. As can be seen fromChart 6-2, the observations for the 1920's dominate the correlation forthe post-World War I period as a whole.
Before World War I, the association is strong only for banks in NewYork City. One reason for its weak appearance elsewhere is that thetwo interest-rate series, both compiled from New York City quota-NOTES TO TABLE (CONTINUED)
(member bank deposits 1948—61 supplied by Board of Governors of Federal ReserveSystem), seasonally adjusted monthly data.
Call money rate: January 1948—December 1961, Survey of Current Business; Febru-ary 1936—December 1947, FRB; January 1878—January 1936, Frederick R. Macaulay,Some Theoretical Problems Suggested by the Movements of Interest Rates, BondYields and Stock Prices in the United States Since 1856, NBER, New York, 1938.
Commercial paper rate: February 1936—December 1961, computed from weeklydata in Commercial and Financial Chronicle; January 1878—January 1936, Macaulay.
Treasury bill rate: FRB. (Treasury notes and certificates to 1929, three-month billsthereafter.)
Bank loan rate: IQ 1939—IVQ 1961, FRB; January 1928—December 1938, unpub-lished data supplied by Board of Governors of the Federal Reserve System; January1919—December 1927, B&MS.
Regression observations are changes between nine successive NBER reference stageaverages of monthly seasonally adjusted data.
a Multiple regression equation (col. 2) is
Ar0 = aA + 6,U, + constant
where r0 is the interest rate, R,/D the reserve ratio, and U, the seven dummy variables,one for each successive pair of reference stages except the last. The operator A denoteschanges between reference-stage averages. U, is unity if the observation pertains to thatpair of stages, otherwise zero; a and are regression coefficients. Signs of the I values,which pertain to the associated regression coefficients, have been dropped.
b Period begins with stage change VI—Vil of 1870—79 reference cycle for New Yorkbanks and with Vill—IX of that cycle for the other banks, and ends with Vill—IX of1912—14 cycle.
C Excludes seven extreme observations: 1879—85 Vil—VIlI; 1885—88 lI—Ill; 189 1—94 VI—VIl and VI—VIlI; 1894—97 Il—Ill; and 1904—08 Vt—Vu and Vu—Vu!.
d Period begins with initial trough of 1919—21 cycle or peak of 1945—49 cycle and endswith peak of 1927—33 cycle or terminal trough of 1958—61 cycle, except that the•Treasury series begins with 1920 peak. Exclusion refers to period from 1938 trough to1948 peak.
232 Essays on Interest Ratestions, were less relevant to other Reserve city and country banks.Excess reserves of interior banks depended primarily on the localdemand for loans. When the demand was high, excess reserves werelow; and conversely. Only if the interior demand for loans and thecommercial paper or call loan rates had the same movements are thecorrelations in Table 6-1 likely to be as high for the interior banks asfor those in New York City.
Although the various interest rates give similar results, the regres-sion using call money rates in logarithmic form produces a better fitfor the earlier period (despite the exclusion of seven extreme observa-tions which, if included, would make the correlation even higher).The logarithmic form is justified for the earlier period by nonlinearityat both ends of the relation: The excess reserve ratio had a lower limitimposed by national bank reserve requirements (the banking systemcould not acquire more reserves through domestic borrowing, sincethere was no central bank to provide them). And, when short-termrates were below 1 per cent, very large increases in the ratio may havebeen associated with small declines in rates because, as suggestedearlier, costs of temporarily investing excess reserves may have ex-ceeded the low return available. There is less reason for nonlinearityin the later period. The free reserve ratio of member banks has nopractical limits (the ratio can be and usually is negative, and an uppertheoretical limit of unity or so is never approached). Also, the onlyperiod with very low interest rates— 1933—48—has been excluded.Since excess reserves have been quite small except for the 1930's,any important nonlinearity would have to pertain to borrowing. Atendency of the Federal Reserve to constrain borrowing, just whenbanks want to increase it, might produce a nonlinear relationship.Chart 6-2 gives but a slight suggestion of nonlinearity for the 1920's,however, and none for the 1950's. To keep the analysis of the twoperiods comparable, linear regressions have been used throughout.
In general, the evidence demonstrates an association betweenreserve ratios and interest rates which has a long history and cannotbe dismissed as a product of common cyclical patterns. It appears toreflect a direct relationship between the two variables.
III. Critique of the Earlier Interpretation
Many writers have pointed to the association summarized by Table6-1, and most of those before Turner attributed it to monetary effects
Interest Rates and Bank Reserves 233
on interest rates. Although never spelled out, the basic hypothesiswas that a tight reserve position forces banks to restrict credit, and aposition of ease allows them to expand. Hence, low reserves in rela-tion to deposits lead to high interest rates, and conversely. How theeffect on rates occurs, however, was never clarified, and suggestions ofvarious mechanisms can be found in the literature.
In some early writings on the association it was implied that lowreserve ratios lead the public to expect tight credit, and converselyfor high ratios. The public then takes steps which somehow producethe expected behavior of interest rates. We may be skeptical, however,that such expectations would be held with much regularity unlessbanks did affect interest rates directly.
Tinbergen's view was that banks simply post a loan rate reflectingtheir reserve position. As reserves tighten, banks post higher rates,and conversely as reserves loosen. But this view oversimplifies bank-ing practice in the United States and elsewhere. Such insularity fromthe demand side is true in part for only a few U.S. rates (such asconsumer loan rates and the prime loan rate) and to only a limited ex-tent for the average bank loan rate, used here. "Administrativepricing" of bank rates cannot explain the association for commercialpaper and Treasury bill rates, which are determined on the openmarket.
If reserve ratios affect market interest rates, the connection pre-sumably occurs through the supply of loanable funds. A high growthrate of the money stock increases the supply of loanable funds in rela-tion to the demand, thus lowering interest rates, and conversely. Theassociation will carry over to the free reserve ratio, however, onlyinsofar as the ratio is a determinant of monetary growth, as was im-plied by Riefler's formulation. He contended that undesired changes inreserves resulting from open-market operations and currency or goldflows are largely offset in the first instance by member-bank borrowing— an increase if banks initially lose reserves or a decrease if they gain.By tradition as well as by Federal Reserve insistence, borrowingshould be infrequent and, when justified, temporary; member banks indebt therefore take immediate steps to build up reserves by restrictingcredit. When total borrowing rises, the banking system restricts creditand the money market tightens. Thus, when the volume of borrowingis high (free reserve ratio low), interest rates are high, and conversely —reflecting an inverse effect of the growth rate of the money stock oninterest rates.
On a theoretical level such an explanation seems plausible. On an

234 Essays on Interest Ratesempirical level, it also has merit—up to a point. An earlier study ofmine found a significant inverse effect by the rate of growth of themoney stock on interest rates [8]. And the free reserve ratio is posi-tively correlated with the rate of deposit growth. But are these relation-ships strong enough to account for the high association between thereserve ratio and interest rates in Table 6-1? In the Riefler interpreta-tion, that association is an indirect reflection of separate relations be-tween each of the two variables and the growth rate of deposits. There-fore, it should disappear when deposit growth is held constant. A testof this hypothesis is reported in Table 6-2. The partial correlationswith deposit growth held constant (col. 4) are only slightly smallerthan the simple correlations of Table 6-1 (reproduced here in col. 1),indicating that the direct association between the free reserve ratioand interest rates far outweighs any indirect association via depositgrowth. The hypothesis fails. The statistical reason for the smalldifference between columns I and 4 is that the postulated correlationswith deposit growth (cols. 2 and 3) are much weaker than the correla-tions in column 1 which they are supposed to explain.
There is an alternative formulation of the Riefler theory. The as-sociation between the free reserve ratio and interest rates might reflecta relation between interest rates and the public's demand to holdmoney. Earlier writers sometimes seem to have had such an explana-tion in mind. The demand to hold money depends upon interest rates,and a change in the money stock affects market rates as the public buysor sells financial assets to remain on its demand curve. If the reserveratio were a good proxy for the total money stock, the association be-tween the ratio and interest rates would reflect those portfolio adjust-ments. But this formulation has serious drawbacks. First of all, thecorrelations of Table 6-1 do not hold wealth or income constant, asis required to measure the demand for money balances properly. Sec-ondly, the reserve ratio is not consistently a good proxy for the levelof deposits, which depends mainly upon the level of reserves madeavailable to the banking system. Moreover, when we use the level ofdeposits in Table 6-2 in place of their growth rate, the correlations(not shown) are very similar to those presented there and also fail tosupport the Riefler theory.
Of course, some effect of the kind Riefler and other earlier writersproposed may be at work, since changes in reserve ratios affect de-posit growth to some extent and thus affect interest rates through thesupply of loanable funds. We may conclude, however, that such effectsare not the main explanation of the high correlations in Table 6-1. We

TAB
LE 6
-2. C
orre
latio
ns B
etw
een
Free
Res
erve
Rat
io, I
nter
est R
ate,
and
Gro
wth
Rat
e of
Dep
osits
, Cha
nges
Bet
wee
nR
efer
ence
Cyc
le S
tage
s
Parti
al C
orre
latio
n
Perio
d an
dIn
tere
st R
ate
Sim
ple
Cor
rela
tion
Coe
ffic
ient
Coe
ffic
ient
Free
Res
erve
Rat
ioan
d In
tere
st R
ate,
Hol
ding
Dep
osit
Gro
wth
Con
stan
t(4
)
Dep
osit
Gro
wth
and
Free
Res
erve
Rat
ioan
d In
tere
st R
ate
Inte
rest
Rat
eFr
ee R
eser
ve R
atio
(1)
(2)
(3)
1919
—2
9C
omm
erci
al p
aper
rate
—.8
6—
.31
.49
—.8
5Tr
easu
ry b
ill ra
te—
.82
—.6
5.6
4—
.69
1946
—61
Com
mer
cial
pap
er ra
te—
.60
—.6
0.3
9—
.50
Trea
sury
bill
rate
—.7
0—
.65
.39
—.6
4
SOU
RC
E: S
ame
as T
able
6-1
. Dep
osit
grow
th is
mon
thly
per
cent
-ag
e ch
ange
in m
embe
r-ba
nk d
eman
d an
d tim
e de
posi
ts.
NO
TE: C
over
age
and
data
are
the
sam
e as
cor
resp
ondi
ng c
or-
rela
tions
of T
able
6-1
. Obs
erva
tions
are
cha
nges
bet
wee
n su
cces
-
sive
refe
renc
e st
age
aver
ages
of m
onth
ly d
ata.
The
two
corr
elat
ions
in c
olum
n 3
for t
he e
arlie
r per
iod
are
dil-
fere
nt o
nly
beca
use
the
expa
nsio
n ph
ase
of th
e 19
19—
21 c
ycle
isom
itted
for T
reas
ury
bills
.
236 Essays on Interest Ratesare led to examine the main current interpretation, discussed in thenext section.
IV. Examination of the Recent Interpretation
Since the 1930's most writers have completely reversed the Rieflerinterpretation. Instead of the free reserve ratio somehow influencinginterest rates, the effect is now viewed as running from rates to theratio. This new view, as argued above, seems justified by the evidence.The rationale for the effect has, however, taken a particular form.Banks are thought to adjust their reserve positions by borrowing fromReserve Banks, primarily to maximize short-run profits. When marketrates rise, so does the income foregone by holding excess reservesidle, intensifying the inducement to keep reserves low and to borrow(assuming the borrowing rate does not rise commensurately). Sinceborrowing accounted for most of the fluctuation in free reserves in the1920's and 1950's, the new view as applied to those periods is mainlya theory of borrowing. It denies Riefler's thesis that banks eschewindebtedness and borrow only to meet temporary reserve deficiencies.As Turner contended, banks may honor the tradition against unneces-sary borrowing, but always with half an eye on the foregone profits.Consequently, when market rates rise, banks make do with smallerreserves, taking greater chances of being caught short, and so find itnecessary to borrow more often.
A DIRECT TEST OF THE PROFIT THEORY. This theory implies that after1914 the free reserve ratio was more closely correlated with thedifference between the market and the discount rate than with themarket rate by itself, since the profit depends upon the return fromlending minus the cost of borrowing. Table 6-3 presents the partialcorrelation coefficients of the free reserve or borrowing ratio withboth the interest rate and its differential over the discount rate, each asa separate variable. For all periods, the market rates themselvesaccount for virtually all the association observed in the previoustables. This is true when sectors of member banks are treated sepa-rately (also shown), and when the period of the excess profits tax(June 30, 1950, to December 30, 1953) is given a separate constantterm by means of a dummy variable (not shown). The results are alsothe same when the 1919—21 cycle, which had unusually high levelsof borrowing and two extreme observations (see Chart 6-2), is ex-

Interest Rates and Bank Reserves 237
eluded (not shown). The short-run profit motive as represented by thedifferential rate either is not significant or, when significant, has thewrong sign (in theory the differential should affect free reserves in-versely and borrowing positively).
The regressions using the ratio of borrowing to deposits take accountof the objection that the banks which hold most of the excess reservesseldom borrow and may behave differently. Treating borrowing byitself, however, gives the same results (with opposite sign), becauseits cyclical variations dominate those in excess reserves (except duringthe 1930's and 1940's, omitted here). The combination of time anddemand deposits in the denominator of the ratio may also raise objec-tions, because time deposits are less subject to unexpected withdrawalsand seldom give banks cause for borrowing. Using demand deposits in-stead of total deposits in the denominator of the ratio, however, givessimilar results (not shown). Finally, substitution of the federal fundsrate for the discount rate in the regressions also gives similar results(not shown).6
Many studies have reported weak, though significant, negative coeffi-cients for the differential rate, which simply reflects the correlationof the differential with the market rate (the discount rate has less ampli-tude of fluctuation). The correlation coefficient between the commer-cial paper or Treasury bill rate and the corresponding differential ratewas about +.5 for stage changes in the 1920's and 1950's. The bank-loan-rate differential, on the other hand, has a positive correlation withthe free reserve ratio, because the loan rate moves sluggishly and itsdifferential is dominated by the discount rate. Since it gives the wrongsign, the loan differential has understandably not been reported inpublished studies.
The differential rate is clearly the relevant one for bank profits,rather than the level of the market rate; yet the correlation is all withthe rate level. It may be argued that the differential rate is not en-tirely appropriate for the profit theory on the grounds that informalpressures by Federal Reserve officials to discourage banks fromborrowing have not been taken into account here. Undoubtedlysuch pressures on banks vary over the cycle, and, conceivably, theyreduce the correlation shown by the differential rate. Yet, such pres-sures probably intensify just when the profit incentive to borrow is
6 federal funds rate is relevant here only if the reserve position of banks lendingfederal funds, unlike that of borrowers, is not influenced by the funds rate. This is notlikely, but it is a possibility. Otherwise, the behavior of lenders and borrowers of federalfunds cancels out in the aggregate reserves of member banks.

238 Essays on Interest Rates
TABLE 6-3. Regression of Free Reserve or Borrowing Ratio on InterestRates and Their Differential Over the Discount Rate, Changes BetweenReference Cycle Stages (partial correlation coefficient and t value)
Free Reserve Ratio and Borrowing Ratio and
Rate Differential Rate Differential
All Member Banks1919—61 excl. 1938—48
Commercial paper rate —.56(5.5) +.07(0.6)Treasury bill rate —.55(5.1) +.24(2.0)Bank loan rate —.47(4.3) +.13(1.0)
1919—29Commercial paper rate —.85(8.0) +.19(1.0) +.85(8.0) —.17(0.9)Treasury bill rate —.86(7.6) +.48(2.5) +.85(7.5) —.49(2.6)Bank loan rate —.74(5.6) +.38(2.0) +.74(5.5) —.37(2.0)
1948—61Commercial paper rate —.48(2.7) —.02(0.1) +.48(2.7) +.08(0.4)Treasury bill rate —.53(3.2) —.10(0.5) +.55(3.3) +.18(0.9)Bank loan rate —.42(2.3) +.16(0.8) +.50(2.9) —.07(0.3)
Member Banks by Sector, 1948—61New York City
Commercial paper rate —.36(2.0) +.08(0.4)Treasury bill rate —.37(2.0) —.02(0.1)Bank loan rate —.22(1.1) +.20(1.0)
ChicagoCommercial paper rate —.47(2.7) +.13(0.7)Treasury bill rate —.49(2.8) +.07(0.3)Bank loan rate —.40(2.2) +.15(0.8)
Reserve citiesCommercial paper rate —.43(2.4) —.05(0.2)Treasury bill rate —.49(2.8) —.17(0.9)Bank loan rate —.39(2.1) +.14(0.7)
CountryCommercial paper rate —.51(2.9) —.12(0.6)Treasury bill rate —.57(3.5) —.11(0.5)Bank loan rate —.50(2.9) +.1 1(0.6)
SOURCE: Discount rate is that of Federal Reserve Bank of New York: January 1922—December 1961, Board of Governors of the Federal Reserve System, Annual Report,various years, and Federal Reserve Bulletin; November 1914—December 1921, simpleaverages of weighted rates on commercial, agricultural and livestock paper from FRB,Discount Rates of the Federal Reserve Banks, 1914—21. Reserve ratios by sectors,Federal Reserve Bulletin, monthly data seasonally adjusted by NBER. Other data arethe same as for Table 6-1.

Interest Rates and Bank Reserves 239
highest. When the discount rate is high enough to discourage borrow-ing, persuasion is superfluous. If the pressures partially offset borrow-ing for profit without eliminating it, the differential rate would still bethe appropriate variable. The absence of correlation in Table 6-3 sug-gests that official persuasion effectively stifles the desire to borrow forshort-run profit. That indeed was Riefler's contention, though his ex-planation relied on the traditional belief that borrowing was incom-patible with sound banking, rather than on the Federal Reserve'srestraint of banks' desire to borrow when it was profitable.
There is no simple way to quantify variations in official pressuresagainst borrowing. We may conjecture that the pressure steps up, bothwhen the differential rate rises (which increases the incentive toborrow) and when market rates rise and the credit market tightens(for reasons to be discussed in Section V). If so, the absence in Table6-3 of a variable representing such pressure weakens the partial cor-relation of both independent variables; which of them is more greatlyaffected is hard to judge. Nevertheless, it seems unlikely that thisomission can explain away the insignificance of the differential rate.Certainly none of the many studies attributing an important effect tothe differential rate on borrowing contend that its importance is evidentonly after taking the degree of pressure into account.7
Another objection to Table 6-3 might be that the short-run profitincentive is represented in the regressions by the difference betweenthe market and discount rates, thus assuming that their regression
NOTES TO TABLE (CONTINUED)
NOTE: Regression equations have the form:
B Rfor = ar0 + J3(r0 — rb) + constant
where r0 and are the open market and borrowing (discount) rates, B and R1 are mem-ber-bank borrowed and free reserves, and Drn member-bank deposits. a and /3 areregression coefficients. The regressions were run as first differences between referencestages, that is, each observation is the change between successive stage averages ofmonthly data.
Periods are the same as for previous tables (for Treasury bills, excluding 19 19—20expansion stages).
Signs of the t values, which pertain to the associated regression coefficients, havebeen dropped.
A partial exception is a series of articles by Murray Polakoff, who has argued thatborrowing is constrained beyond a certain point during periods of monetary tightness.He suggests that the relation between the free reserve ratio and the differential rate atsuch times is curvilinear. See [35], [36], and especially [37].

240 Essays on Interest Ratescoefficients have opposite signs equal in magnitude. Because of officialpressures against borrowing or a variety of other reasons, the two ratesmay conceivably affect the free reserve ratio by different amounts.If the profit theory is to be supported, however, the market rate shouldhave a negative effect and the discount rate a positive effect on theratio, since in theory they affect short-run profits in opposite direc-tions. Table 6-4 shows that the data also fail to support this moregeneral formulation of the profit theory. The market rate has a negativecoefficient as required, but the discount rate tends to have a negative
TABLE 6-4. Regression of Free Reserve Ratio on Market and DiscountRates, Changes Between Reference Cycle Stages
Partial Correlation Coefficient
Market Rateand Period
(and t value)
Market Rate Discount Rate
1919—29Commercial paper rate —.51(3.0) —.19(1.0)Treasury bill rate —.48(2 5) —.48(2.5)Bank loan rate —.40(2.2) —.38(2.0)
1948—61Commercial paper rate —.34(1.8) .02(0.1)Treasury bill rate —.54(3.2) .10(0.5)Bank loan rate —.18(0.9) —.16(0.8)
SOURCE: Same as for Table 6-3, all member banks.
coefficient as well (reflecting its covariation with market rates). Twoof the coefficients are positive, but the very low level of significanceindicates that they do not differ statistically from zero. An increase inthe discount rate simply does not have a perceptible depressing influ-ence on bank borrowing from Reserve Banks as is implied by the profittheory.
The high (negative) correlation between the free reserve ratio andmarket interest rates in Tables 6-3 and 6-4, and the apparent absenceof any influence by the discount rate, can be more simply explained bylong- rather than short-run profit incentives. Banks rightly concernthemselves with their position in the market over the long run and atall times wish to accommodate the loan demand of their regular cus-tomers; to do so when credit tightens requires selling securities,running down excess reserves, and borrowing. (A variable to take

interest Rates and Bank Reserves 241
account of loan demand will be used in Section V.) That effect amplyaccounts for the observed association in Table 6-1, and borrowingmotivated by changes in the differential rate (Table 6-3) does not con-tribute to the explanation. The often cited correlation of the freereserve ratio with the differential rate alone reflects the correlationbetween the ratio and the market rate, and cannot be offered as evi-dence for a short-run profit theory of bank borrowing.
If the differential rate has a measurable effect on bank behavior, itmust be found in some other way. The subsequent analysis examinesthe data for such an effect.
TESTS BASED ON A DISCREPANCY BETWEEN ACTUAL AND DESIREDRESERVES. The Effect on Deposit Growth. The preceding analysisassumes that desired and actual free reserves are always equal,whereas in fact they may not be. A sophisticated version of the borrow-ing-for-profit theory, first presented by Meigs [30], distinguishes be-tween actual and desired levels of the free reserve ratio (denoted by
.-fl--- and where Dm is member-bank deposits). The desired ratio
rn '—'rn
depends inversely on the difference between the open-market rate(r0) and the borrowing (discount) rate (rb):
(1)'ii
where 4' is positive. The rate of change of member-bank deposits ismade proportional to the existing discrepancy between the actual andthe desired ratio:
R5'\dT (2)L41 \-'--'m -'—'ml
Substituting (1) into (2), we havedlo D
dTm = + [ro — (3)
where 'y and 4 are positive. Hence deposit expansion is related posi-tively to the rate differential and the free reserve ratio. Put into thisterminology, Riefler's theory would be equivalent to assuming that thedesired free reserve ratio is a constant.
Regressions based on this equation and two others, discussed sub-sequently, are presented in Table 6-5. For purposes of measurement,

242 Essays on interest Rates
TABLE 6-5. Regression of Deposit Growth on the Rate Differential andOther Variables, Changes Between Reference Cycle Stages
Period andInterest Rate
Equa-tion
Num-ber
Partial Regression Coefficient (and t value)
Rf—
or
rm — dT
"—d(\ dT
(1) (2) (3) (4)
1919—2 9
Commercial paper rate 3
45
4.8(3.0)4.6(2.8)4.7(3.3)
6.5(0.8)4.8(0.6)
—5.8(0.7)—.02(1.0)—.01(0.7) .12(2.9)
Treasury bill rate 3
45
3.1(3.5)2.2(2.7)2.5(2.7)
—4.0(1.4)—7.0(2.6)—6.8(2.5)
—.03(2.9)—.03(2.9)—.03(2.3) .02(0.6)
/ 922—29Commercial paper rate 3
45
4.2(2.1)4.8(3.0)5.2(2.9)
—6.4(1.2)—0.3(0.1)
0.4(0.1).09(3.3).10(3.0) .08(0.5)
Treasury bill rate 3
45
2.8(1.6)3.8(2.3)3.9(2.0)
—7.2(2.8)—3.5(1.3)—3.4(1.2)
.07(2.5)
.07(2.0) .01(0.1)
1948—6/Commercial paper rate 3
45
4.7(1.7)4.4(1.5)2.7(1.1)
—3.4(1.2)—4.0(1.3)—2.7(1.1)
—.06(0.9).27(2.6) .35(3.6)
Treasury bill rate 3
45
1.7(0.6)1.5(0.5)2.5(0.9)
—5.6(2.4)—5.7(2.4)—1.9(0.7)
—.05(0.9).25(2.0) .32(2.7)
SOURCE: Reserve ratio and interest rates, same as for Tables 6-1 to 6-4; depositgrowth, same as Table 6-3; required reserves, based on same sources as free reserves;unborrowed reserves, for 1919—29, high-powered money from Friedman and Schwartz[16, Table B3], revised and extended, minus member-bank borrowing and currencyoutside banks (equals unborrowed reserves at Federal Reserve Bank plus vault cash ofall banks), and for 1948—61, member-bank reserves at Federal Reserve Banks minusborrowing.
NOTE: Regressions are based on text equations 3, 4, and 5, plus a constant term, notshown. Dependent variable is monthly percentage change in member-bank demandand time deposits, annual percentage rate. Independent variables are defined by column:
(1) free reserve ratio (ratio of member-bank free reserves to demand and time de-posits), per cent;
(2) differential rate (commercial paper or Treasury bill rate minus discount rate),per cent per annum;

Interest Rates and Bank Reserves 243
banks are assumed to begin to respond immediately to any discrepancybetween the actual and desired ratio, so that the average rate of depositgrowth during a given month reflects the average discrepancy in thatmonth. The assumption seems appropriate for monthly data, sincebanks are more likely to act on the basis of their current reserve posi-tion than on that of the previous month or quarter. Yet, while theresponse begins immediately, it may not be completed within onemonth, but only with time approximates a full adjustment. The regres-sions therefore measure a continuing process of adjustment. Becausethe variables are averaged for reference stages, however, and then putinto first-difference form as in previous tables to avoid spurious cor-relation, the data reflect the average effect on deposit growth of thediscrepancy during reference stages (usually several months or more induration).
In regressions based on equation (3), the regression coefficients esti-mate the effect of a 1-percentage point change in the ratio or the ratedifferential on the annual percentage rate of deposit growth. The freereserve ratio has the correct sign (and for commercial paper is highlysignificant with t well above 2.0 in the earlier period), but the rate dif-ferential is not significant and mostly has the wrong sign (it should bepositive). The regressions appear to pick up the negative effect ofmonetary growth on interest rates, which hides whatever positive effectthe differential rate would have on the desired free reserve ratio and,thence, on deposit growth.
One suggested way of isolating the latter effect is to take account ofsome of the other factors determining deposit growth, since the reserveratio is not the only factor or even the most important one. Accordingly,we may, following Meigs, add the growth rate of unborrowed reserves,
NOTES TO TABLE (coNTINuED)
(3) growth rate of unborrowed reserves (monthly percentage change in bank reservesminus borrowed reserves), annual percentage rate;
(4) contribution of required reserves to growth rate of deposits —see footnote 8(monthly change in ratio of member-bank required reserves to total deposits, with signreversed, times the ratio of deposits to unborrowed reserves), annual percentage rate.
The regressions were run as first differences between reference stages, that is, eachobservation is the change between successive stage averages of monthly values of thevariables shown in table heading.
The first and last periods are the same as for previous tables (for Treasury bills1919—29, excluding 1919—20 expansion stages). The 1922—29 period begins March 1922with the change between stages III and IV of the 1921—24 cycle.
Signs of t value have been dropped.

244 Essays on Interest Ratesto the equation:
DmdT = + — rbl) + 0 dT ' (4)
and, following Davis [1 1],8 also the contribution to deposit growth ofchanges in the required reserve ratio:
/ Rq\dDm1
dT D+0r)+O dT dT j' (5)
where 0 and are positive. These two variables are added to the re-gressions in Table 6-5. For the later period, unborrowed reserves are
8The contribution of changes in requirements may be derived as follows. By definition,total reserves of member banks comprise required and excess reserves Re:
or
where R1 Re — B.Dividing by member-bank deposits and rearranging the terms gives
DmR R,
To derive rates of change, we may take natural logarithms and differentiate with respectto time:
/dR1Dm — Dm ( Dm Dm ( Dm
dT = dT+ \ dT / + \ dT
In this form the growth rate of deposits is the sum of three parts, the contribution ofthe growth rate of unborrowed reserves and that of changes in the required and free re-serve ratios. The factor DmIRu converts changes in the reserve ratios into units thatrepresent their contribution to the growth rate of deposits. (The factor can be omittedif we deal with changes in the dollar amount of reserves rather than in ratios.)
This formulation disregards currency flows on the assumption that the Reserve Bankssupply whatever quantity of currency the public desires, offsetting entirely the effectof currency flows on bank reserves. Otherwise, changes in the ratio of currency held bythe public to deposits affect reserves and deposit growth. The Reserve Banks have often,though by no means always, offset changes in the currency ratio; they certainly did notat certain crucial times like 1929—3 3. And a currency offset could not be expected at allin the period before 1914. (In that earlier period, too, B was zero.)
While the analysis here follows current practice in ignoring currency flows, the ap-propnateness of doing so requires further study, particularly for the earlier period.
Interest Rates and Bank Reserves 245
defined as member-bank deposits at Federal Reserve Banks less bor-rowing. For the early 1920's, however, that definition makes no sense.Such reserves were then negative: borrowing exceeded bank depositsat Federal Reserve Banks, which was possible because vault cash wasan important component of bank reserves. The series used for the1920's therefore includes the vault cash of all banks (nonmember-bank vault cash cannot be readily excluded). This series has alwaysbeen positive but, in 1920 and 1921, it was quite small. By 1922 re-serves held at Federal Reserve Banks had increased appreciably, andvault cash was relatively less important. Table 6-5 therefore also re-ports regressions for 1922—29, to exclude the first two years of thedecade when borrowing was nearly as large as total reserves; the un-borrowed residual was small then, and its monthly percentage changeswere volatile.
The two added variables show significant effects on deposit growth,though for the earlier period changes in the required reserve ratio areonly important in 1919 (this year covered oniy by the commercialpaper regressions). The volatile changes in unborrowed reserves duringthe early 1920's produce an apparent negative effect in the regressionswhich turns positive when those years are omitted. In terms of long-run effects, the coefficients of these last two variables should, by theabove formulation, be positive and approximately unity. They estimatepure numbers, since the dependent variable is measured in the sameunits. A continual increase in unborrowed reserves or decrease in re-quired reserves will add to the growth rate of deposits unless con-tinually offset by increases in the free reserve ratio.
The estimated effects of these variables in the table are all well be-low unity, presumably because of lags. In the short run, changes inunborrowed reserves are partly or largely unforeseen. They wouldaffect deposit growth gradually and only after a period of adjustment,whereas banks can be expected to expand deposits right along withanticipated, regular increases in unborrowed reserves. A regressioncoefficient below unity for this variable therefore indicates that thechanges were not fully anticipated. (Meigs [30] suggests that the rateof change of unborrowed reserves may also affect the desired level offree reserves. Banks may be comfortable with a lower ratio duringperiods of rapid growth in unborrowed reserves. Consequently, be-sides the direct effect on deposit growth, a higher growth rate of re-
In the earlier period changes in the required ratio reflected shifts in deposits be-tween reserve classes and between time and demand deposits. In the later period,changes in legal requirements also occurred.

246 Essays on Interest Ratesserves would gradually lead to a once-and-for-all reduction in thefree reserve ratio and to a higher rate of deposit growth while thereduction was taking place. This effect would tend to make the regres-sion coefficient of changes in unborrowed reserves higher, however,not lower.) The coefficient may also be less than unity insofar as theFederal Reserve partly offsets member-bank borrowing through delib-erate changes in unborrowed reserves; this will be discussed later.
However we interpret these regressions, the interest-rate differen-tial gives no evidence of a positive effect on deposit growth. Regres-sions of the form (4) and (5) or close variants are often used in studiesof banking behavior.'0 The differential rate sometimes turns out to besignificant with the correct sign, though usually the association isweak. The only major differences between this and other studies arethe omission of data after the 1961 trough and the allowance for com-mon cyclical patterns in the variables. Significant correlations usingdata in monthly or quarterly form need not reflect a genuine relation-ship but simply a tendency of the variables to move similarly overbusiness cycles in response to a variety of cyclical influences. InTable 6-5 the common cyclical pattern in the variables has practicallybeen eliminated by taking changes between reference-stage averages(dummy variables to remove any remaining common cyclical patternwere not used), and the differential rate is either insignificant or hasthe wrong sign.
These results indicate that responses of the desired free reserveratio to the differential rate are not strong enough to register clearlyon deposit growth. The next two subsections show why such responsesmay not affect deposit growth and explore an alternative way of meas-uring them.
The Problem of Interdependence Between Open-Market Operationsand Borrowing. Many econometric models of the monetary system donot allow for a dependence of Federal Reserve open-market opera-tions on member-bank borrowing. To be sure, unborrowed reservesare usually included in equations like (4) and (5), but only to takeaccount of a dependence running in the other direction: Open-marketoperations make reserves temporarily flush or tight, which leads somebanks to reduce or step up borrowing, as the case may be, until theycan accommodate their portfolios to the new conditions. Later, whenbanks have had time to adjust to the change in reserves, the free
10 See for example Meigs [30]; Brunner and Meltzer [4], especially Table 5; Davis[10] and 1]; and Teigen [44]. See also Rangarajan and Severn [38], who use the market(not the differential) rate, and conclude that it has no discernible effect on deposit growth.
interest Rates and Bank Reserves 247
reserve ratio returns to the desired level determined by other consid-erations. Those adjustments are consistent with the explanation ofborrowing given by Riefler. It is appropriate to allow for them in meas-uring the effect of the differential rate. But there is no reason to ig-nore a mutual dependence. The privilege of borrowing helps indi-vidual banks avoid temporary stringencies, but it is not supposed tocompromise the over-all objectives of monetary policy. The FederalReserve may also engage in open-market sales—as well as per-suasion—to offset borrowing which interferes with the desired mone-tary policy. To the extent that borrowing is thereby offset, it, as wellas the corresponding reduction in unborrowed reserves, will have noobservable effect on deposit growth. If we measure the effect of thedifferential rate on desired free reserves by means of their inducedcontribution to deposit growth, we in effect assume that the FederalReserve does not offset the contribution. This assumption underliesmuch recent econometric research on the determinants of the moneysupply and deserves attention.11
The fact of the matter is that changes in unborrowed reserves andthe free reserve ratio are highly correlated inversely (as shown byTable 6-6) especially when changes in the required reserve ratio areheld constant. Since the variables are all measured in the same units,the negative coefficients of about unity indicate that the contribu-tions to deposit growth of unborrowed and free reserves offset eachother and also that unborrowed reserves offset changes in require-ments. (Since the data pertain to concurrent monthly changes, thereis no implication that the offsets are permanent.) It is true that thetwo independent variables, as measured, contain unborrowed reservesin the denominator. That might tend to increase the negative correla-tion with the dependent variable, but probably not a great deal. Thedependent variable is monthly changes in unborrowed reserves which,except perhaps for the early 1920's, behave quite differently than theratio contained in the two independent variables. Nor do thehigh correlations reflect similar cyclical patterns in the variables.When dummy variables are used to absorb the common cyclical fluc-tuations, the results (not shown) are virtually the same.
"Whether valid or not, the assumption does not affect the argument made by Meigs[30] that free reserves are a misleading indicator of bank behavior; their level does notpredict how rapidly banks are going to expand loans or deposits. When the growth of Un-borrowed reserves is high, banks might keep the actual free reserve ratio low, and by thatindicator monetary policy might appear to be tight; while in fact the desired ratio may beeven lower, leading to rapid mnetary growth. Nothing said here denies this point.

248 Essays on Interest Rates
TABLE 6-6. Regression of the Growth Rate of Unbor-rowed Reserves on the Contribution to Deposit Growthof the Free and Required Reserve Ratios, Changes Be-tween Reference Cycle Stages
Simple or Partial RegressionCoefficient (and t value)
Period
R
\dTq
IAdj.R2
1919—29 —.80(6.7)—.88(8.9) —.86(3.8)
.62
.75
1922—29 —1.17(8.4)—1.10(12.8) —1.70(5.3)
.80
.93
1948—61 .35(0.7)—1.00(6.1) —.89(14.5)
.00
.89
SOURCE: Same as for Table 6-5.NOTE: Dependent variable of regressions is growth rate of un-
borrowed reserves (monthly percentage change in bank reservesat Reserve Banks minus borrowed reserves), annual percentagerate. Constant term is not shown. Independent variables, bycolumn, are:
(1) Contribution of free reserves to growth rate of deposits —see footnote 8 (monthly change in ratio of member-bank freereserves to total deposits, with sign reversed, times the ratioof deposits to unborrowed reserves), annual percentage rate.
(2) Contribution of required reserves to growth rate of de-posits—see footnote 8 (same as cot. 1 except with required in-stead of free reserves), annual percentage rate.
The regressions were run as first differences between refer-ence stages, that is, each observation is the change betweensuccessive stage averages of monthly values of the variablesshown in the table heading.
Periods are the same as for Table 6-1.Signs of t values have been dropped.
These results are indeed to be expected. Open-market operationsare used to offset sudden and undesired changes in bank reserves. Forexample, they help counteract the immediate effects of changes inlegal requirements, allowing banks time to make adjustments. Banksborrow when open-market sales disturb reserves, but that response

Interest Rates and Bank Reserves 249
alone seems insufficient to explain the high correlation. In addition,the Federal Reserve counteracts the effect on deposits of any borrow-ing which does not agree with monetary objectives. It is true that theReserve Banks have never announced an explicit policy of offsettingbank borrowing, but they nevertheless pursue such a policy indirectlyin the normal course of countering undesired expansions or lapses indeposit growth. The correlation between free and unborrowed re-serves therefore reflects an influence running in both directions.
For the short-run profit theory of borrowing, however, it is irrelevantthat induced changes.in desired free reserves, as found in Table 6-5,do not affect deposit growth. Because of open-market operations andother factors affecting deposit growth, it is better to test the theorydirectly, as is done below.
The Effect on Free Reserves. Another difficulty with equations(3)—(5), mentioned earlier, is that they ignore the inverse effect ofmonetary growth on interest rates. That effect would tend to counter-act the positive relation assumed in those equations and helps to ex-plain why the coefficients of the differential rate in Table 6-5 are some-times negative. Because of that difficulty and the interdependence justdiscussed, we may examine the effects of the differential rate on thecontribution of the free reserve ratio to deposit growth, rather thanon the total growth itself. We may retain the general hypothesis thatbanks respond to the discrepancy between the desired and the actualfree reserve ratio. The equation then is
dRj
( dT) = y + — ri)]). (6)
Table 6-7 reports regressions of this form,t2 as well as with the addi-tion of changes in unborrowed and required reserves. The contributionof the free reserve ratio to deposit growth is practically the same as thechange in the ratio with the sign reversed. The difference is the factorDm/Ru, which as pointed out in footnote 8 converts changes in the ratiointo their effect on deposit growth. The assumption behind this formu-lation is that a given discrepancy between the actual and desired ra-tios leads banks to produce—other things remaining the same—a com-mensurate change in the growth rate of deposits rather than in the re-serve ratio per Se. The two effects will usually be roughly equivalent,however, thus rendering the distinction of little importance. Large
See footnote 8 for derivation of dependent variable. Variants of (6) were also usedby Meigs [30]; as well as by de Leeuw [12]; Goldfeld [18]; and Goldfeld and Kane[19].
250 Essays on Interest Rates
TABLE 6-7. Regression of the Contribution to Deposit Growth of Free Reserveson the Differential Rate and Other Variables, Changes Between Reference CycleStages
PeriodInterest
andRate
Partial Regression Coefficient (and t value)
R1D,,,
rcp —
or
— ro
dloge
dTDrn
(Din
\ dT /Adj.R2
(1) (2) (3) (4) (5)
1922—29Commercial
Treasury bill
paper
rate
rate 8.3(0.7)11.2(0.9)4.2(0.8)
—3.0(0.7)15.6(1.5)18.1(1.7)7.3(1.3)
—0.6(0.1)
55.3(1.9)55.9(1.9)9.8(0.6)
—3.4(0.3)46.8(3.2)46.7(3.2)14.6(1.6)5.0(0.7)
—
—
—.68(7.1)—.85(10.7)
—
—
—.61(6.3)—.80(9.1)
0.7(0.8)—
—1.5(4.0)—
0.6(0.8)—
—1.3(3.6)
.08
.06
.79
.90
.34
.32
.81
.90
1 948—6 1
Commercial paper rate —0.3(0.1)0.7(0.2)
—0.7(0.2)2.4(1.2)
—1.7(0.4)—1.2(0.3)—2.2(0.6)—4.6(2.2)
—
—
—.07(0.8)—.69(7.6)
—
—.10(1.4)—
—.65(7.9)
.00.00.00.69
Treasury bill rate 4.6(1.1)4.6(1.2)4.4(1.1)2.2(0.9)
5.5(1.8)4.7(1.5)5.4(1.7)
—3.1(1.4)
—
—
—.05(0.6)—.72(6.6)
—
—.08(1.1)—
—.71(6.7)
.04
.05
.02
.66
SOURCE: Same as for Table 6-5.NOTE: Regressions are based on text equation (6) and variants, plus a constant term, not
shown. For derivation of monetary variables, see footnote 8. Dependent variable is contribu-tion of free reserves to growth rate of deposits (same as Table 6-6), annual percentage rate.Independent variables (see Table 6-5) are, by column:
(1) free reserve ratio, per cent;(2) differential rates, per cent per annum;(3) growth rate of unborrowed annual percentage rate;(4) contribution of required reserves to growth rate of deposits, annual percentage rate.The regressions were run as first-differences between reference stages, that is, each obser-
vation is the change between successive stage averages of monthly values of the variablesshown in table heading.
Periods are the same as for previous tables.Signs of t values have been dropped.
Interest Rates and Bank Reserves 251
differences did occur in 1920 and 1921 when unborrowed reserveswere very small and, as before, those years have been excluded forthat reason.
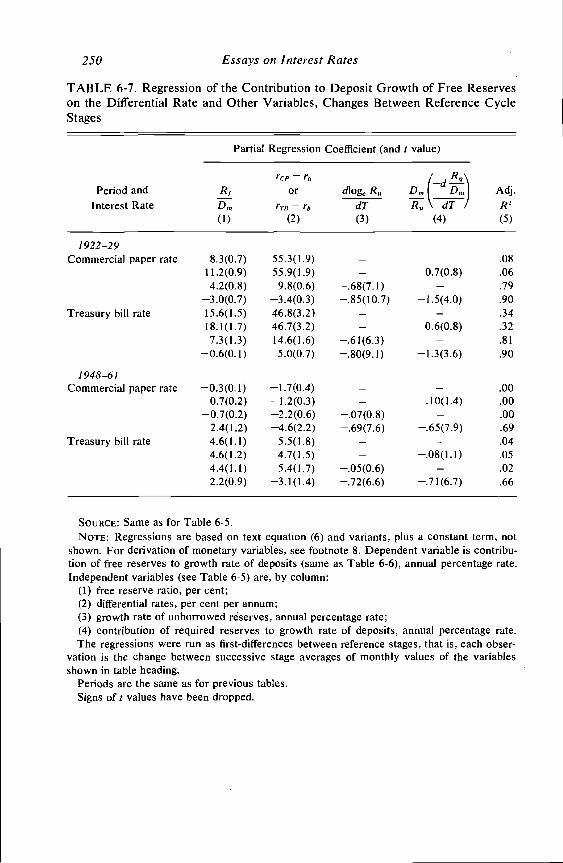
The regressions with the highest multiple correlations are those in-cluding changes in unborrowed reserves and legal requirements. Asexplained in the preceding subsection, however, the former can be ex-pected to overstate the response of banks to open-market operationsand hide the true effects of the other variables. It should perhaps beomitted.'3 There is no parallel reason for omitting changes in the re-quired reserve ratio, since those changes induce temporary borrow-ing and presumably reflect distributional shifts in deposits or policyactions with long-run objectives in mind, rather than provide a short-run offset to borrowing. With changes in unborrowed reserves ex-cluded, the differential rate is positive and significant (t 2.0) forTreasury bills 1922—29, and on the borderline of significance for bills1948—6 1 and commercial paper 1922—29. If we test the profit theoryby adding the market rate to these regressions (not shown), the coeffi-cient of the differential rate remains about the same in size and sig-nificance, unlike the version of the theory in Table 6-3 which failedthat test. The addition of dummy variables also makes little differencehere, unlike the correlations in Table 6-1 for the 1948—61 period.These results therefore provide some evidence of a short-run profittheory of borrowing.
Based on the Table 6-7 estimates, however, the lure of such profitshas been sharply constrained since the 1920's. If we compare theearlier and later periods for the first two Treasury bill regressions(which exclude changes in unborrowed reserves), we see that the co-efficient of the differential rate was nine times larger in the 1920's(47 compared with 5). The coefficient measures the effect on depositgrowth: the change produced in the annual percentage rate of depositgrowth for a 1-percentage point change in the differential. Column 2divided by column 1 gives an estimate of 4) in equation (6): the effecton the desired free reserve ratio (in percentage points). By the samecomparison, that effect was two and a half times larger in the 1920's.The decline in magnitude is not surprising, considering how muchlarger were the fluctuations in borrowing during the 1920's for simi-lar variations in the differential rate. Ironically, economists began to
13 One could, of course, set up a more complicated equation that allowed for mutualinteraction between bank borrowing and open-market operations, but that seems Un-necessary for present purposes.

252 Essays on Interest Ratesattach importance to borrowing by banks for short-run profit well afterthe heyday of such activity had passed.
The estimate of for Treasury bills 1948—6 1 is slightly above unity(5.514.6), indicating that a 1-percentage point rise in the bill-discountdifferential—the typical change from cyclical trough to peak in the1950's (see Chart 6-3, below)—increased the desired free reserve ratioabout 1 percentage point, not a large amount. To be sure, because ofthe delayed adjustment, this induced an increase in the contribution todeposit growth of 5.5 per cent per year (the estimate of y4 in col. 2),but open-market operations apparently offset most or all of it, as indi-cated by the negative estimate when changes in both unborrowed andrequired reserves are included.
The partial correlations of the differential rate in Table 6-7 (notshown) range from +.66, for the first two Treasury bill regressions inthe earlier period, to below zero (for the negative coefficients). On thewhole they are much smaller than the corresponding correlations re-lating the free reserve ratio to the level of interest rates in Table 6-1,which are also much more significant and therefore more reliable.While that association originally attracted the attention of economistsand eventually led to the short-run profit theory, it cannot be ade-quately explained as a reflection of equation (6) or its variants. Indeed,the statistical relations measured by Tables 6-1 and 6-7 appear to bepractically independent of each other.
V. Reinterpretation
The preceding results seem paradoxical at first. The strong associationobserved between the free reserve ratio and interest rates appears toreflect neither the contribution of the ratio to deposit growth nor theeffect of differential rates on the desired ratio. Those two interpreta-tions, however, do not exhaust the possibilities. In particular, they dis-regard an important characteristic of bank behavior: the effort to retainthe loyalty of regular customers by accommodating requests for loansso far as possible even when funds are scarce. Such behavior has beennoted.'4Experience generally shows that tightness in the availability of credit to bankcustomers is related to a large volume of member bank discounts outstanding,
'4The first quotation is from [2], p. 46, the second by George W. McKinney, Jr.[29], p. 27. For similar statements see Robinson [40], Hodgman [23], Kane and Malkiel[25], and Goldfeld [18], PP. 15—16.
Interest Rates and Bank Reserves 253
and easy credit conditions to a small volume of borrowing from ReserveBanks.
the typical banker is acutely aware of his responsibilities to his customersand to his community, and is far more interested in establishing and maintain-ing long-term customer relations and providing his community with funds tomeet its legitimate credit needs than he is in short-run profit considerations.
In striving to satisfy the demand of regular customers for loans,banks will, when necessary, lend whatever funds they can obtain by re-ducing excess reserves, selling securities, and borrowing. When loandemand expands, therefore, it is met by reducing the free reserve ratio,regardless of the discount rate and the effect on short-run profits.When, at some later time, loan demand weakens and funds becomeplentiful, banks settle into a more relaxed and easy reserve position.The costs of accommodating customers at "acceptable" loan rates fre-quently requires giving up maximum current profits, which banks wil-tingly subordinate to the more important purpose of retaining theloyalty of their regular clientele over the long run.
To be sure, when banks need funds, they undoubtedly seek to ac-quire them in the cheapest way. That they try to maximize profits orminimize tosses at all times is not at issue here. The question is howto explain the high correlation between borrowing and interest rates.Probably no one would deny the importance to banks of accommodat-ing customers, yet most time-series studies have overlooked thissimple explanation of the correlation. Short-term interest rates serveas a proxy for the intensity of pressure put on bank officials by regularborrowers, since market rates reflect changes in the demand for short-term funds, part of which represents a demand for bank loans)5
The pressure to make loans varies over time, not only because thedemand for loans fluctuates, but also because banks do not charge arate that clears the market. Loan officers could let high rates driveaway the excess demand when reserves become tight, but by all ac-counts they prefer instead to ration credit. Bank loan rates do movewith the market to a considerable extent, but usually not enough toclear it. Credit rationing leaves an unsatisfied demand in excess ofsupply and creates a group of disgruntled customers pressing to bor-row more. The intensity of over-all pressure will depend upon avariety of factors, an important one being the level of market rates. Inview of the widely acknowledged concern of banks to retain customer
first writer to attribute the association to loan demand, so far as I know, isIrving Fisher [15]. See the quotation of his in the Appendix.
254 Essays on interest Ratesloyalty, the high correlation of short-term interest rates with the re-serve ratio (Table 6-1) in itself supports this interpretation.
Market rates may be an imperfect indicator of the intensity of cus-tomer pressure on banks. Consequently, the test of Table 6-3 may bebiased against the short-run profit theory of borrowing, since the mar-ket rate is also correlated with the market-discount rate differential (aresult of infrequent changes in the discount rate). The market ratemight, as an imperfect proxy for the degree of credit rationing,spuriously reduce the partial correlation between the differential rateand the reserve ratio. Perhaps, if we took account in another way ofthe pressure on banks to accommodate customers, an effect of themarket-discount rate differential might come to light.
Unfortunately, there are no ready measures of shifts in the demandcurve for bank loans. We must improvise. Besides the level of marketrates, two makeshift indicators of the pressure on banks to expandcredit suggest themselves. The prevalence of credit rationing suggestsone: the difference between the market rate and the average bank loanrate. The first rate reflects what banks could charge (for a givensupply), and the second what they do charge, at least directly. To besure, loan rates usually exceed the rate on commercial paper or Treas-ury bills, because these instruments entail less risk than the averagebank loan does. Nevertheless, since market rates fluctuate with shiftsin the demand curve for loans, the differential between the market andthe loan rate measures variations both in excess demand and in thepressure on banks to expand loans. Thus the market-discount rate dif-ferential may be reinterpreted: In the partition of r0 —
(ro—rj)+(rj—rb),
the first term (the market-loan rate differential) measures the excessdemand for bank loans, and the second term (the loan-discount ratedifferential) measures the gross profit to banks in borrowing from Re-serve Banks.
Another indicator is the volume of loans as a proportion of earningassets. Banks devote an increasing portion of their total resources toloans as the pressure mounts, even though they satisfy only part of thetotal demand. The assumption underlying this indicator is that rejectedapplications for loans increase approximately as fast as do approvals.
Admittedly, these two indicators are rough. We cannot expect themto remain nicely proportional to the pressure on banks to expand loans.They nevertheless provide an alternative to market rates as measures
Interest Rates and Bank Reserves 255
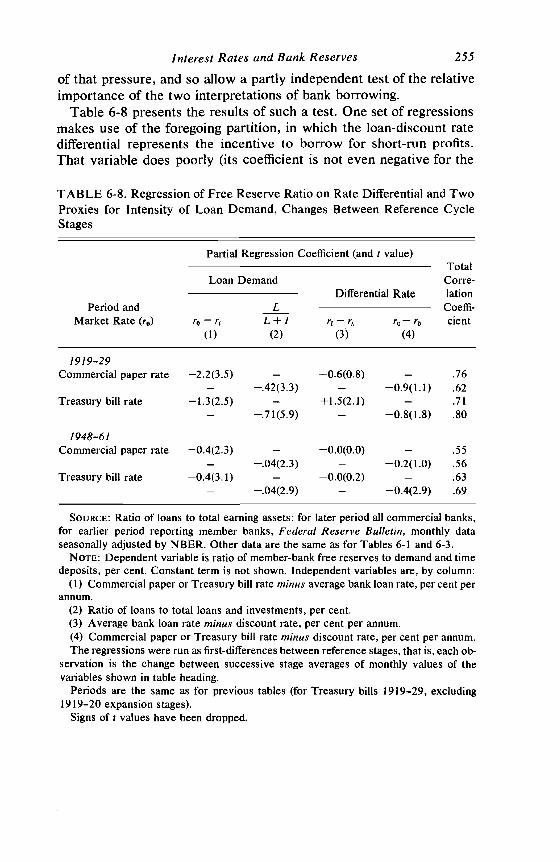
of that pressure, and so allow a partly independent test of the relativeimportance of the two interpretations of bank borrowing.
Table 6-8 presents the results of such a test. One set of regressionsmakes use of the foregoing partition, in which the loan-discount ratedifferential represents the incentive to borrow for short-run profits.That variable does poorly (its coefficient is not even negative for the
TABLE 6-8. Regression of Free Reserve Ratio on Rate Differential and TwoProxies for Intensity of Loan Demand, Changes Between Reference CycleStages
Period andMarket Rate (r0)
Partial Regression Coefficient (and t value)TotalCorre-lationCoeffi-dent
Loan DemandDifferential Rate
r0 — rjL
L + I r1 — r0 —
(1) (2) (3) (4)
1919—29Commercial paper rate —2.2(3.5)
—
—
—.42(3.3)±0.6(0.8) —
— —0.9(1.1).76.62
Treasury bill rate —1.3(2.5)—
—
—.71(5.9)+1.5(2.1) —
— —0.8(1.8).71.80
1 948—61Commercial paper rate —0.4(2.3)
—
—
—.04(2.3)—0.0(0.0) —
— —0.2(1.0).55.56
Treasury bill rate —0.4(3.1)—
—
—.04(2.9)—0.0(0.2) —
— —0.4(2.9).63.69
SOURCE: Ratio of loans to total earning assets: for later period all commercial banks,for earlier period reporting member banks, Federal Reserve Bulletin, monthly dataseasonally adjusted by NBER. Other data are the same as for Tables 6-1 and 6-3.
NOTE: Dependent variable is ratio of member-bank free reserves to demand and timedeposits, per cent. Constant term is not shown. Independent variables are, by column:
(I) Commercial paper or Treasury bill rate minus average bank loan rate, per cent perannum.
(2) Ratio of loans to total loans and investments, per cent.(3) Average bank loan rate minus discount rate, per cent per annum.(4) Commercial paper or Treasury bill rate minus discount rate, per cent per annum.The regressions were run as first-differences between reference stages, that is, each ob-
servation is the change between successive stage averages of monthly values of thevariables shown in table heading.
Periods are the same as for previous tables (for Treasury bills 19 19—29, excluding1919—20 expansion stages).
Signs of: values have been dropped.
256 Essays on Interest Ratesearlier period, although it should be), and it appears to have no rela-tion to borrowing. Consequently, the market-discount rate differentialwas used to represent the profit incentive in the other set of regres-sions, in which the loan ratio represents the intensity of loan demand.The two independent variables in that set are related (their simple cor-relation coefficient is +.30 for the earlier period and +.5 1 for the laterperiod), but not so closely as to preclude measuring their separateeffects.
The loan-demand variables are highly significant. Their regressioncoefficients imply that customer pressure affected the reserve ratiomuch less in the 1950's than in the 1920's, consistent with the muchfreer borrowing allowed in the earlier period. The total correlation co-efficients are nearly as high as the simple correlations between theratio and the corresponding market rates in Table 6-1. The Table 6-8regressions appear to capture most of that association, which the short-run profit theory attributes to the effect of differential rates alone.Judged by the levels of significance, however, the loan-demandvariables are more important, with one exception: the later regressionfor bills in which the two variables have equal significance. The dif-ferential rates mostly have the correct negative coefficient, but only forthe exception is it significant (t 2.0), though it is on the borderline inin the second Treasury bill regression for the earlier period. The re-suits are similar to Table 6-7 in that the coefficient for the differentialrate is larger for the earlier period.
The evidence of Table 6-8 on the short-run profit incentive is onlytentative. A better proxy for loan demand might well reduce the co-efficient of the differential rate. The results of using the market rateas the proxy (Tables 6-3 and 6-4) suggest such a possibility. Yet thoseresults may underestimate the profit effect, as was suggested, becausethe market rate might, if Reserve Banks put restrictions on borrowing,sometimes indicate the true return in borrowing for short-run profitbetter than the differential rate does. Since the market rate may thusrepresent both reasons for borrowing and the other proxies for loandemand may be inadequate, the importance of the profit effect is hardto assess. Presumably it lies part way between the effects shown byTables 6-3 and 6-8.
The relative importance of loan demand and the differential rate canbe assessed from their regression coefficients and amplitudes of fluctua-tion. In the later period, for example, the ratio of loans to total assetsusually rose about 10 percentage points from trough to peak of refer-ence expansions, and the bill-discount rate differential about 1 per-
Interest Rates and Bank Reserves 257
centage point. The regression coefficient of the differential rate is tentimes that of the loan ratio (bottom line, Table 6-8). Therefore, theireffects on the free reserve ratio over reference expansions were aboutequal, each producing a total change in the reserve ratio of roughly 0.4percentage points. For the earlier period, the effects were larger andthe loan ratio was absolutely and relatively much more important. Forcommercial paper rates in both periods, the loan ratio was relativelymore important than the differential rate.
Since we find that borrowing depends in part upon the bill-discountrate differential, at least for the later period, does that mean that thefunds are used to acquire Treasury bills? Clearly not. Chart 6-3 showsthat bank holdings of Treasury bills did not follow movements inthe bill-discount rate differential during the 1950's. Bill holdingstended to rise in the last half of reference contractions, when the profitincentive to borrow — and borrowing itself (see Chart 6-1) — actuallyreached a cyclical low point. The bill-discount rate differential wasseldom positive in the post-World War II period; when it was, bankholdings of bills were not at their cyclical peaks (the 1950—53 ex-pansionary years, when the excess profits tax was in effect, are a par-tial exception). A comparison of cyclical movements therefore deniesthat the differential rate influenced the purchase of Treasury bills. Byall indications, bills serve as a dispensable reservoir of lending powerto meet cyclical variations in loan demand.'6 What is true of bills isgenerally true of other security holdings. Banks both run off securitiesand borrow from Reserve Banks to finance an expansion of loans.
The bill-discount rate differential nevertheless does better than theother series in reflecting the short-run profit from loans. The loan-dis-count rate differential itself shows no relation to borrowing from Re-serve Banks, largely because banks prefer to ration credit rather than tocharge what the market will bear at the moment. But the average loanrate may not, when funds are tight, fully register changes in theshort-run return produced by higher compensating balances and theselection of loans with lower risk. As a result, the bill rate may moreaccurately represent changes in the total return from loans. The ques-
16 Since pressure for loans leads banks to reduce bill holdings as well as the free re-serve ratio, it is also tempting to argue that loan demand is the source, via changes in thenonbank supply of bills, of the corresponding movements in the bill rate. Hence the billrate and the free reserve ratio would be inversely correlated, though not directly as causeand effect. One difficulty with this interpretation, however, is that the bill holdings ofbanks do not have a regular (inverse) cyclical pattern (Chart 6-3), while the bill rate has aregular positive pattern (see [8]). The argument therefore appears weak.

258 Essays on Interest Rateslion here is not what banks do with borrowed funds — mainly they ex-pand loans, but whether they borrow only when the desired accom-modation of long-standing customers strains resources or also, as theevidence in part suggests, when the rate differential makes it particu-larly attractive.
CHART 6-3. Reference Cycle Patterns of Treasury Bill Holdings of AllCommercial Banks and Bill-Discount Rate Differential, 1948—61
Holdings Bill Rate Minus Discount Rate(billion dollars) (basis points)
4.0
- 1948-49
-100
II 111 IV V VI VU VIII IX
SOURCE: Differential, same as Table 6-3; holdings, Monthly Treasury Bulletin.
3.5
3.0
2.5
—25
-50
+ 50
÷ 25
0
-25
-50
—75
5.0
4.5
4.0
3.5
3.0
2.5
+25
0
—25
-50
-75
+ 25
0
— 25
-50
— 75

Interest Rates and Bank Reserves 259
Whether we interpret the effect of the differential rate in these re-gressions to be large or small, it seems clear that the major part of bankborrowing reflects simply a desire to accommodate customers, withoutregard to short-run profits. That is shown by the high correlation(Table 6-8) between the free reserve ratio and the loan-demandvariable, holding the differential rate constant. Such borrowing ap-pears to be the main explanation for the long-noted association be-tween interest rates and bank reserves. While loan demand may wellexplain most of the association before World War I, the evidence de-veloped here does not directly apply to that period. The discount win-dow did not exist and we cannot readily distinguish between the tworoles of interest rates at that time: as proxy for loan demand and asthe foregone return on excess reserves.17 For the 1920's and sinceWorld War II, when borrowing from Reserve Banks has provided mostof the fluctuation in free reserves, the distinction can be made becausethe second role is played by the market-discount rate differential, notby the market rate itself. For these later periods at least, loan demandshould be accorded primary emphasis in a theory of bank borrowingand the free reserve ratio. The effect of interest rates on free reserveshas, on the whole, been less important. Their effect appears to be veryimportant only because the rates happen to be good proxies for cus-tomer pressures on banks to expand loans.
VI. Summary
Statistical studies of the behavior of bank reserves have had an un-usually long history relative to other empirical work in economics.During the past half-century economists have become increasinglyaware of a high correlation between reserve ratios and short-term in-terest rates. An earlier interpretation, expounded most fully by Riefler,attributed the association to the influence of bank reserves on financialmarkets. Though never adequately spelled out, this view may be formu-lated as saying that easy or tight reserves produce a high or low con-tribution, respectively, by banks to the growth rate of deposits, whichshifts the supply curve of loanable funds and affects market interestrates accordingly. The rates are thus inversely related to the reserve
'7The pre-1914 period is further complicated by the fact that many reserve agentspaid interest on deposit reserves held with them by other banks. The rate paid, however,was a standard 2 per cent and, as far as I can determine, changed little. A rise in mar-ket rates, therefore, still increased the incentive to reduce excess reserves.
260 Essays on interest Ratesratio of the banking system. Beginning with Turner's 1938 criticismof Riefler's study, opinion reversed the direction of influence and,since then, has attributed the association to the effect of market rateson the free reserve ratio. This interpretation regards bankers as equat-ing the marginal contribution to profits of holding excess reserves andearning assets or of borrowing from Reserve Banks. When marketrates rise, banks are thought to convert excess reserves into earningassets, and also, if the discount rate does not rise as high, to borrowmore. Hence, the free reserve ratio falls as the market-discount ratedifferential increases.
There is some merit in both explanations of the association, butneither one comes near accounting for it fully: (1) Monetary growthdoes affect interest rates inversely, but that has nothing to do with theobserved association between rates and the reserve ratio. The associa-tion is not affected by holding the growth of deposits constant, con-trary to the earlier interpretation in which the reserve ratio affectsinterest rates through the induced changes in bank credit and deposits(Section III). (2) The later interpretation implies that, with the ad-vent of discounting under the Federal Reserve System, the free re-serve ratio should be inversely related to the difference between therate which banks can earn on assets and the discount rate. Yet thefree reserve ratio is not correlated with the market-discount rate dif-ferential when the market rate itself is held constant (Section IV, firstpart). The ratio continues to be highly correlated with the level ofshort-term interest rates.
The alternative interpretation offered here (Section V) puts emphasison the long-run goals of successful bank management. Personal andbusiness loans provide the most profitable use of bank funds. Studiesof banking also stress the overriding concern of management withmeeting the credit needs of regular customers. Banks make every ef-fort to accommodate them by selling securities, reducing excess re-serves to the minimum, and borrowing from Reserve Banks with onlya side glance at the discount rate. Hence, when the demand for loansexpands, we observe a rise in interest rates and a decline in the freereserve ratio; and the converse when loan demand slackens. To besure, banks are constrained to borrow for onl.y short periods at a time.Yet, when the money market tightens and the accommodation of cus-tomers strains available funds, banks are forced to borrow more often,and the total borrowing of the system will be greater. That accountsfor the major part of the association between the free reserve ratioand interest rates.

Interest Rates and Bank Reserves 261
Of course, modern bank management seeks to maximize currentprofits by equating the marginal returns of borrowing and allocatingresources among various alternatives, insofar as other considerationspermit. But portfolio adjustments are not made in a vacuum. Importantlong-run and institutional considerations come in—such as preservingthe goodwill of long-time customers and official constraints on the pur-poses and duration of borrowing from the Federal Reserve. Sincebanks nowadays hold negligible excess reserves, borrowing is onerecourse when the demand for loans reaches a cyclical high point.
The data do show an effect on the free reserve ratio of the differen-tial. between the Treasury bill rate and the discount rate, holdingconstant certain other variables (Sections IV, second part, and V).The effect appears to have been much stronger in the 1920's than inthe 1950's, as could be inferred from the much larger fluctuations inborrowing in the earlier period (Chart 6-1). Statistical studies ofthe effect, however, have overstated its strength and importance bymaking no allowance for common cyclical patterns in the variables andignoring the varying pressures by bank customers for loans. The dif-ferential rate is a rough proxy for those pressures and, when used inregressions as the only interest-rate variable, exhibits a spuriouslyhigh correlation with the free reserve ratio.
Banks do not ordinarily borrow to acquire Treasury bills or othersecurities, as the frequent emphasis in statistical studies on thebill-discount rate differential may suggest. Holdings of such securi-ties, if anything, fall as borrowing increases because both are used toprovide funds for meeting an expansion of loans. Moreover, the billrate usually stood below the discount rate in the 1950's, so the nega-tive differential discouraged using borrowed funds to acquire bills.The bill rate here is apparently a proxy for the total return on loans,and the funds borrowed help banks to fulfill loan commitments. Theaverage loan-discount rate differential shows no such effect, presum-ably because of credit rationing and the unrecorded returns to banksfrom compensating balances and other devices for altering charges in-directly.
The statistical association between the reserve ratio and interestrates provides little justification for assuming that changes in the moneysupply are sensitive to interest rates, as is standard in many currentmodels of the financial system. Although the market-discount ratedifferential affects the free reserve ratio, changes in the ratio sinceWorld War II have accounted for a small part of the variations in de-posit growth. To a large extent changes in the ratio are offset by Fed-
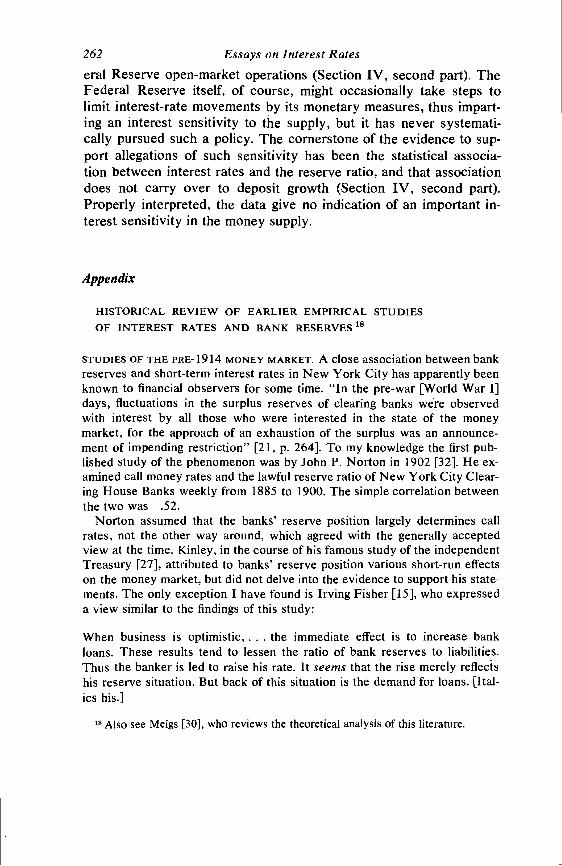
262 Essays on Interest Rateseral Reserve open-market operations (Section IV, second part). TheFederal Reserve itself, of course, might occasionally take steps tolimit interest-rate movements by its monetary measures, thus impart-ing an interest sensitivity to the supply, but it has never systemati-cally pursued such a policy. The cornerstone of the evidence to sup-port allegations of such sensitivity has been the statistical associa-tion between interest rates and the reserve ratio, and that associationdoes not carry over to deposit growth (Section IV, second part).Properly interpreted, the data give no indication of an important in-terest sensitivity in the money supply.
Appendix
HISTORICAL REVIEW OF EARLIER EMPIRICAL STUDIESOF INTEREST RATES AND BANK RESERVES'8
STUDIES OF THE PRE-1914 MONEY MARKET. A close association between bankreserves and short-term interest rates in New York City has apparently beenknown to financial observers for some time. "In the pre-war [World War I]days, fluctuations in the surplus reserves of clearing banks ware observedwith interest by all those who were interested in the state of the moneymarket, for the approach of an exhaustion of the surplus was an announce-ment of impending restriction" [21, p. 264]. To my knowledge the first pub-lished study of the phenomenon was by John P. Norton in 1902 [32]. He ex-amined call money rates and the lawful reserve ratio of New York City Clear-ing House Banks weekly from 1885 to 1900. The simple correlation betweenthe two was —.52.
Norton assumed that the banks' reserve position largely determines callrates, not the other way around, which agreed with the generally acceptedview at the time. Kinley, in the course of his famous study of the independentTreasury [27], attributed to banks' reserve position various short-run effectson the money market, but did not delve into the evidence to support his state-ments. The only exception I have found is Irving Fisher [15], who expresseda view similar to the findings of this study:
When business is optimistic, . . . the immediate effect is to increase bankloans. These results tend to lessen the ratio of bank reserves to liabilities.Thus the banker is led to raise his rate. It seems that the rise merely reflectshis reserve situation. But back of this situation is the demand for loans. [Ital-ics his.]
18 Also see Meigs [30], who reviews the theoretical analysis of this literature.
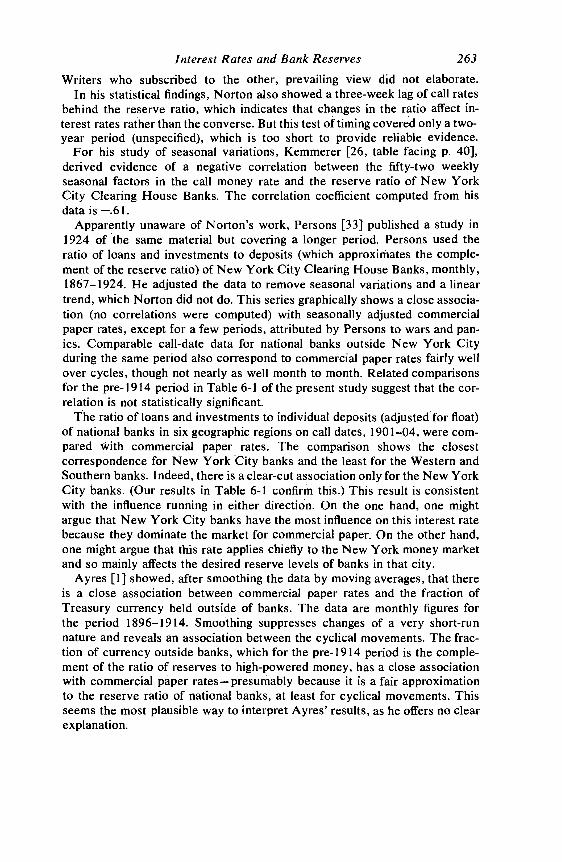
Interest Rates and Bank Reserves 263Writers who subscribed to the other, prevailing view did not elaborate.
In his statistical findings, Norton also showed a three-week lag of call ratesbehind the reserve ratio, which indicates that changes in the ratio affect in-terest rates rather than the converse. But this test of timing covered only a two-year period (unspecified), which is too short to provide reliable evidence.
For his study of seasonal variations, Kemmerer [26, table facing p. 40],derived evidence of a negative correlation between the fifty-two weeklyseasonal factors in the call money rate and the reserve ratio of New YorkCity Clearing House Banks. The correlation coefficient computed from hisdata is—.61.
Apparently unaware of Norton's work, Persons [33] published a study in1924 of the same but covering a longer period. Persons used theratio of loans and investments to deposits (which approximates the comple-ment of the reserve ratio) of New York City Clearing House Banks, monthly,1867—1924. He adjusted the data to remove seasonal variations and a lineartrend, which Norton did not do. This series graphically shows a close associa-tion (no correlations were computed) with seasonally adjusted commercialpaper rates, except for a few periods, attributed by Persons to wars and pan-ics. Comparable call-date data for national banks outside New York Cityduring the same period also correspond to commercial paper rates fairly wellover cycles, though not nearly as well month to month. Related comparisonsfor the pre-1914 period in Table 6-1 of the present study suggest that the cor-relation is not statistically significant.
The ratio of loans and investments to individual deposits (adjusted for float)of national banks in six geographic regions on call dates, 190 1—04, were com-pared with commercial paper rates. The comparison shows the closestcorrespondence for New York City banks and the least for the Western andSouthern banks. Indeed, there is a clear-cut association only for the New YorkCity banks. (Our results in Table 6-1 confirm this.) This result is consistentwith the influence running in either direction. On the one hand, one mightargue that New York City banks have the most influence on this interest ratebecause they dominate the market for commercial paper. On the other hand,one might argue that this rate applies chiefly to the New York money marketand so mainly affects the desired reserve levels of banks in that city.
Ayres [1] showed, after smoothing the data by moving averages, that thereis a close association between commercial paper rates and the fraction ofTreasury currency held outside of banks. The data are monthly figures forthe period 1896—1914. Smoothing suppresses changes of a very short-runnature and reveals an association between the cyclical movements. The frac-tion of currency outside banks, which for the pre-1914 period is the comple-ment of the ratio of reserves to high-powered money, has a close associationwith commercial paper rates — presumably because it is a fair approximationto the reserve ratio of national banks, at least for cyclical movements. Thisseems the most plausible way to interpret Ayres' results, as he offers no clearexplanation.
264 Essays on Interest RatesIn terms of theoretical interpretation, the best of the earlier works is a little-
known 1922 article by Seltzer and Florner [42]. They extended the weeklyseries that Norton used for the period 1885—1900 to the succeeding nineyears, 1900—09. For these nine years, they obtained the same correlation co-efficient (—.52) that Norton did for the preceding fifteen years.
This is the only earlier work of all I have seen that explicitly interprets thecorrelation as reflecting a two-way dependence of the reserve ratio on ratesand of rates on the reserve ratio.19 For Seltzer and Homer, the reserve ratiomeasures changes in the "supply factors" affecting the loan market, as it doesfor Norton, but they also insist that the interest rate acts back upon thereserve ratio to produce a mutual dependence. Since "demand factors" arenot represented in their correlation, Seltzer and Homer attribute to thesefactors the variations in the interest rate not explained by the reserve ratio.When they correlated the weekly data for individual years, the correlation co-efficients varied from —.30 to —.68, which the authors explain by the varyingstrength of "demand factors" in different years.
The interpretation cannot be so simple, however, even in terms of theirtheoretical framework, as they themselves recognized.2° In effect, they postu-late a supply curve of loanable funds, for which the amount supplied dependsupon interest rates (the foregoing studies implicitly assume that this curve isinelastic to changes in interest rates); the whole curve shifts with changes inthe reserve ratio (when the ratio is low, loans are curtailed and conversely).Demand is also dependent on interest rates,. and shifts in the supply curve
19 Roos and Szeliski [41] did take account of both influences by adding various andsundry variables to their regression equation, but their analysis is so loosely formulated,and their regression variables so shot through with multicollinearity, that an interpre-tation of their results appears impossible. I seriously doubt that the high correlation co-efficients they obtained, covering quite a short period, carry any economic significance.
Their work was inspired by Skinner's results [43], which allegedly show a strong rela-tion between monetary factors and interest rates. He presented his data in graphs withoutsources or full explanation, so that the results can be neither verified nor interpreted.
20 Seltzer and Homer argue (pp. 111—112) that "there is an effective limit. . . belowwhich bankers cannot safely reduce their reserves. But as the reserve ratio rises abovethis limit, bankers have an increasing incentive to lend. . . . The higher the reserve ratios,the lower the rates at which bankers will be willing to lend; the lower the reserve ratios,the higher the rates which must be offered to tempt bankers further to diminish their re-serve ratios.
"But, in fact, the situation is really more complex. Demand factors not only operateupon the call rate directly; but the call rate which results from partial or predominant de-mand influence affects in turn the reserve ratios. The great speculative boom will tendto force call rates upward without a prior decline in the reserve ratio; but the high ratesin turn will tempt bankers to diminish their reserves to the minimum ratio compatiblewith safety or legal requirements. The high rates, in other words, will be partly cause,not altogether the effect, of a diminishing reserve ratio." [Italics theirs.]
We should probably interpret them as referring to the stock of funds supplied by banksrather than to aflow per period of time.
Interest Rates and Bank Reserves 265
generate observations along the demand curve. But the demand curve mayalso shift, producing a movement along the supply curve in which loans ex-pand by reducing the reserve ratio and vice versa. The trouble here is that thereserve ratio is serving as proxy for two separate sets of factors: Shifts in thesupply curve affect the ratio in the same direction; movements along the curve(due to shifts in the demand curve) affect the ratio inversely. This raises thewell-known problem of statistical identification, which they left unresolved.
Seltzer and Homer thought that their study had only historical interest be-cause they believed the association between bank reserves and interest ratesdisappeared with the advent of Federal Reserve control over bank reservesand ability to stabilize the money market. Yet in the late 1920's, studies of thepost-World War I period again found an association, though in a slightly dif-ferent form.
A later study by Morrison [31] extends the evidence for the pre-1914 period.
STUDIES OF THE POST-1914 MONEY MARKET. Persons' study [33], alreadycited, covered the early 1920's, for which he also found a good association be-tween the (complement of the) reserve ratio of New York banks and commer-cial paper rates. This would not be true of the late 1920's nor, especially, sinceWorld War II when banks have kept reserves much closer to the minimum re-quired. Burgess [5] was the first to point to the post-1914 association, al-though in a new form. He showed that there was a close, positive, monthlyassociation during 192 3—26 between commercial paper rates and the borrow-ings (discounts and advances) of member banks from Federal Reserve Banks.In his book [6] published later, he extended the series to the 1922—3 3 period,for which the conformity is good though far from perfect. Burgess attributedthe association to the influence of banks' indebtedness on interest rates. Be-cause of the tradition against borrowing, banks allegedly borrow only tem-porarily when a reserve drain forces them to, and their ensuing efforts toterminate the debt by contracting loans tighten the money market. Burgessnoted that, although borrowing is normally heavy in the closing months of eachyear, interest rates are not unusually high at that time, which he explained asbanks' willingness to loan freely when they know the heavy demand for loansis temporary. A simple theory stating that banks borrow solely for profit doesnot account for this lapse in the association.
The evidence was discussed at some length in the celebrated book by Riefler[39] in 1930. Riefler's strong insistence that most banks do not borrow forprofit appeared to represent the view of most top Federal Reserve officials.21His analysis started from a simple graph showing a close association betweenthe borrowings of member banks and three short-term interest rates (for timeand call loans, and commercial paper), monthly during 1917—28, with no ap-parent lag either way. The absence of lags led him to the view that, when
21 See Harris [21, p. 262] and the references cited by him. For more recent views heldby the Federal Reserve, however, see [13], [14], and [3].

266 Essays on Interest Ratesbanks are forced to borrow because of a loss of reserves, they immediatelytighten up loans, and short-term rates rise. He noted that banks accounted fortwo-thirds of short-term loans in 1922 and one-half in 1928. If borrowing de-pended on profitability, it might lag behind changes in rates.
Borrowing for profit also implies that, without any restrictions on banks, theprofit spread would disappear and open-market rates would then approach thediscount rate. Although the two rates do exhibit similar movements, thissimilarity reflects a tendency of the Federal Reserve to adjust the discountrate to the market. Their movements are usually not so close as to preventbanks from making profits. The only rate that stays close to the discount rateis that on acceptances, for which Federal Reserve policy does control themarket. The acceptance rate reveals the effect of such control, which otherrates do not show.
This argument against the profit theory holds only in the extreme case. Ifwe combine a profit theory with some limited aversion of banks to indebted-ness, there is no implication that market rates have to equal the discount rate.
Riefler's argument, which received considerable attention, elicited a mixedreaction. The main issue was whether banks borrow for profit and hencewhether the association between borrowings and interest rates reflects theeffect of rates (or, better, the differential rate over the discount rate) on bor-rowing or the effect of borrowing on rates. It is not clear from his evidencewhich way the direction of influence runs.
Among those writing on the subject before World War II, Currie, Hardy,and Tinbergen supported Riefler's conclusions, while Harris and Turner dis-puted them.
To determine the response of banks to the level of their indebtedness,Currie [9] examined the association between the borrowings and deposits ofdifferent classes of member banks monthly during 1922—31. He found thatNew York City banks contracted deposits most strongly (by reducing loansand investments) when borrowing was heavy, and the connection betweenborrowing and deposit contraction was weakest for country banks. In otherwords, when banks were forced to borrow because of a drain of reserves, theycontracted earning assets. The strength of the response varied betweencountry and city banks, as might be expected. His results are marred by theambiguity of his evidence. It is based on a visual examination of the series,and he made no allowance for common business cycle patterns.
Hardy [20] compared borrowings with the discount rate 1922—31 and founda positive association, whereas the profit theory of borrowing implies a nega-tive one. He explains the positive association by Federal Reserve actions, inwhich open-market operations and changes in the discount rate occur together.The Reserve Banks sell bonds and raise the discount rate to tighten credit,thus forcing member banks to offset reserve losses by temporarily borrowingat the same time that the discount rate is increased. On the profit theory ofborrowing, banks reduce their indebtedness when the discount rate is raised,which would produce an inverse association. This evidence is far from con-
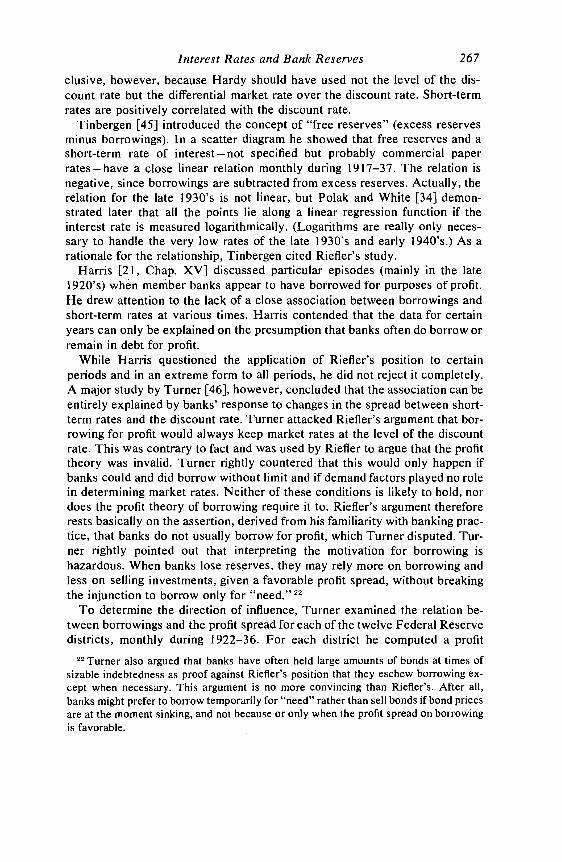
interest Rates and Bank Reserves 267
clusive, however, because Hardy should have used not the level of the dis-count rate but the differential market rate over the discount rate. Short-termrates are positively correlated with the discount rate.
Tinbergen [45] introduced the concept of "free reserves" (excess reservesminus borrowings). In a scatter diagram he showed that free reserves and ashort-term rate of interest—not specified but probably commercial paperrates—have a close linear relation monthly during 1917—37. The relation isnegative, since borrowings are subtracted from excess reserves. Actually, therelation for the late 1930's is not linear, but Polak and White [34] demon-strated later that all the points lie along a linear regression function if theinterest rate is measured logarithmically. (Logarithms are really only neces-sary to handle the very low rates of the late 1930's and early 1940's.) As arationale for the relationship, Tinbergen cited Riefler's study.
Harris [21, Chap. XV] discussed particular episodes (mainly in the late1920's) when member banks appear to have borrowed for purposes of profit.He drew attention to the lack of a close association between borrowings andshort-term rates at various times. Harris contended that the data for certainyears can only be explained on the presumption that banks often do borrow orremain in debt for profit.
While Harris questioned the application of Riefler's position to certainperiods and in an extreme form to all periods, he did not reject it completely.A major study by Turner [46], however, concluded that the association can beentirely explained by banks' response to changes in the spread between short-term rates and the discount rate. Turner attacked Riefler's argument that bor-rowing for profit would always keep market rates at the level of the discountrate. This was contrary to fact and was used by Riefler to argue that the profittheory was invalid. Turner rightly countered that this would only happen ifbanks could and did borrow without limit and if demand factors played no rolein determining market rates. Neither of these conditions is likely to hold, nordoes the profit theory of borrowing require it to. Riefler's argument thereforerests basically on the assertion, derived from his familiarity with banking prac-tice, that banks do not usually borrow for profit, which Turner disputed. Tur-ner rightly pointed out that interpreting the motivation for borrowing ishazardous. When banks lose reserves, they may rely more on borrowing andless on selling investments, given a favorable profit spread, without breakingthe injunction to borrow only for "need."22
To determine the direction of influence, Turner examined the relation be-tween borrowings and the profit spread for each of the twelve Federal Reservedistricts, monthly during 1922—36. For each district he computed a profit
22 also argued that banks have often held large amounts of bonds at times ofsizable indebtedness as proof against Riefler's position that they eschew borrowing ex-cept when necessary. This argument is no more convincing than Riefler's. After all,banks might prefer to borrow temporarily for "need" rather than sell bonds if bond pricesare at the moment sinking, and not because or only when the profit spread on borrowingis favorable.

268 Essays on Interest Ratesspread on borrowing by subtracting the discount rate in the district from thesame weighted average of short-term rates used by Riefler. There is noseparate short-term rate published for each district. Consequently, since dis-count rates seldom differ among districts, the profit spread varies very littleamong districts and disaggregating the twelve districts provides less addi-tional information than one might hope for. Undaunted, Turner compared thisspread with the borrowings of banks in each district. The association wasclosest in the New York, Chicago, Boston and Philadelphia districts; for thesehe found no lag either way. In the other districts, where the association waslower, he found (based on correlation coefficients) that borrowings lag behindthe profit spread by one to five months, suggesting that borrowing depends onprofit.
This statistical evidence is really quite weak. The lag occurs only for theweakest correlations, not the highest, and therefore may be spurious. In addi-tion, the correlation for all districts together, which has no lag, is higher thanany of the correlations for the districts individually, suggesting that the break-down by districts provides less information on the relationship than do theaggregate figures. This is inconsistent with the profit theory of borrowing butnot with Riefler's position.
Turner's study therefore did not establish that the data favor the profittheory of borrowing over Riefler's interpretation (though Turner thought so),but it did cast a shadow over Riefler's interpretation.
In recent years the empirical study of liquidity preference inspired byKeynes has led to a search for such preferences in all sectors of the economy,including banking. Current studies now assume that the influence runs pri-marily from interest rates to free reserves and not the other way.23 The sup-position of the earlier work is thus implicitly rejected, though mainly by neglectrather than explicit evidence.
Polak and White's work [34] in 1955 improved on the technical quality ofearlier studies and extended the coverage to later years. They presented ascatter diagram, with annual data for 1922—53, of the Treasury bill rate andthe ratio of free reserves to total deposits of member banks. The bill rate ismeasured logarithmically, which appears to make the relationship linear evenwhen the low rates of the late 1930's are included. The observations fit astraight line fairly well—no correlation is computed—indicating that the as-
23 For a recent throwback to the Riefler interpretation, which has been practically ex-tinct since World War 11, see [22].
In 1955 Klein and Goldberger [28] presented a scatter diagram using annual data,1929—52, of percentage changes in the commercial paper rate and the excess reserveratio of member banks. The relationship is negative but not significant. They view banksas heavily influencing short-term rates through their lending, which creates an inversedependence of interest rates on banks' ability to lend, as in the older view. However,they regard excess reserves (above average levels) as indicative of a disequilibrium, anddepart from the older view by assuming that rates will change in inverse proportion tothe degree of disequilibrium. Thus large excess reserves cause banks to lend freely andproduce falling rather than low rates.
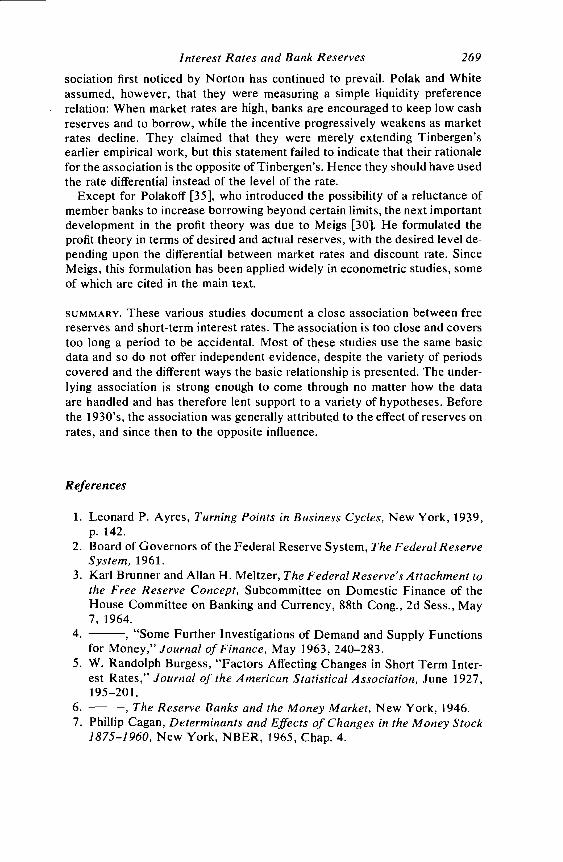
Interest Rates and Bank Reserves 269
sociation first noticed by Norton has continued to prevail. Polak and Whiteassumed, however, that they were measuring a simple liquidity preferencerelation: When market rates are high, banks are encouraged to keep low cashreserves and to borrow, while the incentive progressively weakens as marketrates decline. They claimed that they were merely extending Tinbergen'searlier empirical work, but this statement failed to indicate that their rationalefor the association is the opposite of Tinbergen's. Hence they should have usedthe rate differential instead of the level of the rate.
Except for Polakoff [35], who introduced the possibility of a reluctance ofmember banks to increase borrowing beyond certain limits, the next importantdevelopment in the profit theory was due to Meigs [30]. He formulated theprofit theory in terms of desired and actual reserves, with the desired level de-pending upon the differential between market rates and discount rate. SinceMeigs, this formulation has been applied widely in econometric studies, someof which are cited in the main text.
SUMMARY. These various studies document a close association between freereserves and short-term interest rates. The association is too close and coverstoo long a period to be accidental. Most of these studies use the same basicdata and so do not offer independent evidence, despite the variety of periodscovered and the different ways the basic relationship is presented. The under-lying association is strong enough to come through no matter how the dataare handled and has therefore lent support to a variety of hypotheses. Beforethe 1930's, the association was generally attributed to the effect of reserves onrates, and since then to the opposite influence.
References
1. Leonard P. Ayres, Turning Points in Business Cycles, New York, 1939,p. 142.
2. Board of Governors of the Federal Reserve System, The Federal ReserveSystem, 1961.
3. Karl Brunner and Allan H. Meltzer, The FederaiReserve's Attachment tothe Free Reserve Concept, Subcommittee on Domestic Finance of theHouse Committee on Banking and Currency, 88th Cong., 2d Sess., May7, 1964.
4. , "Some Further Investigations of Demand and Supply Functionsfor Money," Journal of Finance, May 1963, 240—283.
5. W. Randolph Burgess, "Factors Affecting Changes in Short Term Inter-est Rates," Journal of the American Statistical Association, June 1927,195—201.
6. , The Reserve Banks and the Money Market, New York, 1946.7. Phillip Cagan, Determinants and Effects of Changes in the Money Stock
1875—1960, New York, NBER, 1965, Chap. 4.
270 Essays on Interest Rates8. , "Changes in the Cyclical Behavior of Interest Rates," Review of
Economics and Statistics, August 1966, reprinted as Occasional Paper100, New York, NBER.
9. Lauchlin Currie, The Supply and Control of Money in the United States,Cambridge, Mass., 1935, Chap. VIII.
10. Richard G. Davis, "Open Market Operations, Interest Rates and DepositGrowth," Quarterly Journal of Economics, August 1965, 43 1—454.
11. , "Testing Some Variants of the Free Reserves Hypothesis,"January 1966, mimeographed.
12. Frank de Leeuw, "A Model of Financial Behavior," in Duesenberry,et a!. (eds.), The Brookings Quarterly Econometric Model of the UnitedStates, Chicago, 1965, Chap. 13.
13. Federal Reserve Bank of New York, Monthly Review, article on "TheSignificance and Limitations of Free Reserves," November 1958, 162—167.
14. Federal Reserve Bank of St. Louis, Review, article on "Excess Re-serves," April 1963, 12.
15. Irving Fisher, The Theory of Interest, New York, 1930, 444—450.16. Milton Friedman and Anna J. Schwartz, A Monetary History of the
United States, 1867—1960, Princeton for NBER, 1963, Chap. 9.17. Peter A. Frost, "Banks' Demand for Excess Reserves," unpublished
doctoral dissertation, University of California at Los Angeles, 1966.18. Stephen M. Goldfeld, Commercial Bank Behavior and Economic Ac-
tivity: A Structural Study of Monetary Policy in the United States, NewYork, 1966.
19. and Edward J. Kane, "The Determinants of Member-Bank Bor-rowing: An Econometric Study," Journal of Finance, September 1966,499—514.
20. Charles 0. Hardy, Credit Policies of the Federal Reserve System, TheBrookings Institution, 1932, Chap. XI.
21. Seymour E. Harris, Twenty Years of Federal Reserve Policy, Cambridge,Mass., 1933, Vol. I.
22. John J. Harrington, Jr., "Explaining Changes in the Treasury Bill Rate:The Key Variables," The Journal of Business, Seton Hall University,May 1965, 19—28.
23. Donald R. Hodgman, "The Deposit Relationship and Commercial BankInvestment Behavior," Review of Economics and Statistics, August 1961,257—268.
24. George Horwich, "Liquidity Trap in the Thirties: Comment," Journal ofPolitical Economy, June 1966, 286—290.
25. Edward J. Kane and Burton G. Malkiel, "Bank Portfolio Allocation, De-posit Variability, and the Availability Doctrine," Quarterly Journal ofEconomics, February 1965, 111—134.
26. Edwin W. Kemmerer, "Seasonal Variations in the New York Money Mar-ket," American Economic Review, March 1911, 33—49.

Interest Rates and Bank Reserves 271
27. David Kinley, The Independent Treasury of the United States and theRelations to the Banks of the Country, National Monetary Commission,1910.
28. Lawrence R. Klein and Arthur S. Goldberger, An Econometric Model ofthe United States, 1929—1952, Amsterdam, the Netherlands, 1955, pp.29—30 and 53.
29. George W. McKinney, Jr., The Federal Reserve Discount Window, NewBrunswick, N.J., 1960.
30. A. James Meigs, Free Reserves and the Money Supply, Chicago, 1962.31. George R. Morrison, Liquidity Preferences of Commercial Banks,
Chicago, 1966.32. John P. Norton, Statistical Studies in the New York Money-Market, New
York, 1902.33. Warren M. Persons, "Cyclical Fluctuations of the Ratio of Bank Loans
to Deposits, 1867—1924," Review of Economic Statistics, October 1924,260—283.
34; J. J. Polak and William H. White, "The Effect of Income Expansion onthe Quantity of Money," International Monetary Fund, Staff Papers,August 1955, 422—428.
35. Murray E. Polakoff, "Reluctance, Elasticity, Least Cost, and Member-Bank Borrowing: A Suggested Interpretation," Journal of Finance, March1960, 1—18.
36. , "Federal Reserve Discount Policy and Its Critics," in D. Car-son (ed.), Banking and Monetary Studies, Homewood, 111., 1963, pp. 210—212.
37. and William L. Silber, "Reluctance and Member-Bank Borrowing:Additional Evidence," Journal of Finance, March 1967, 88—92.
38. C. Rangarajan and Alan K. Severn, "The Response of Banks to Changesin Aggregate Reserves," Journal of Finance, December 1965, 651—661.
39. Winfield W. Riefler, Money Rates and Money Markets in the UnitedStates, New York, 1930, Chap. II.
40. Roland S. Robinson, The Management of Bank Funds, New York, 1951.41. Charles F. Roos and Victor S. Von Szeliski, "The Determination of
Interest Rates," Journal of Political Economy, August 1942, 50 1—535.42. Lawrence H. Seltzer and Seward L. Homer, "The Relation of the Per-
centage of Bank Reserves of National Banks in New York City to theCall Money Loan Rate on the New York Stock Exchange," Journal ofPolitical Economy, February 1922, 108—118.
43. Richard D. Skinner, Seven Kinds of Inflation, New York, 1937, Chap. VI.44. R. L. Teigen, "An Aggregated Quarterly Model of the U.S. Monetary
Sector," in Karl Brunner (ed.), Targets and Indicators of MonetaryPolicy, forthcoming.
45. Jan Tinbergen, Business Cycles in the United States ofAmerica 1919—32,League of Nations, 1939, 82—87.
46. Robert C. Turner, Member-Bank Borrowing, Columbus, Ohio, 1938.