Interest Groups, Lobbying And Polarization In The United ...
179
University of Pennsylvania University of Pennsylvania ScholarlyCommons ScholarlyCommons Publicly Accessible Penn Dissertations 2016 Interest Groups, Lobbying And Polarization In The United States Interest Groups, Lobbying And Polarization In The United States Alexander Russell Garlick University of Pennsylvania, [email protected] Follow this and additional works at: https://repository.upenn.edu/edissertations Part of the Political Science Commons, and the Public Policy Commons Recommended Citation Recommended Citation Garlick, Alexander Russell, "Interest Groups, Lobbying And Polarization In The United States" (2016). Publicly Accessible Penn Dissertations. 2298. https://repository.upenn.edu/edissertations/2298 This paper is posted at ScholarlyCommons. https://repository.upenn.edu/edissertations/2298 For more information, please contact [email protected].
Transcript of Interest Groups, Lobbying And Polarization In The United ...

University of Pennsylvania University of Pennsylvania
ScholarlyCommons ScholarlyCommons
Publicly Accessible Penn Dissertations
2016
Interest Groups, Lobbying And Polarization In The United States Interest Groups, Lobbying And Polarization In The United States
Alexander Russell Garlick University of Pennsylvania, [email protected]
Follow this and additional works at: https://repository.upenn.edu/edissertations
Part of the Political Science Commons, and the Public Policy Commons
Recommended Citation Recommended Citation Garlick, Alexander Russell, "Interest Groups, Lobbying And Polarization In The United States" (2016). Publicly Accessible Penn Dissertations. 2298. https://repository.upenn.edu/edissertations/2298
This paper is posted at ScholarlyCommons. https://repository.upenn.edu/edissertations/2298 For more information, please contact [email protected].

Interest Groups, Lobbying And Polarization In The United States Interest Groups, Lobbying And Polarization In The United States
Abstract Abstract Most lobbying in the United States comes from business interests, but not all. Previous work has not paid sufficient attention to how non-business lobbying affects legislative behavior. Firms are more interested in particular goods than advocacy groups which pursue broad-based policy change. These citizen-based organizations often employ grassroots tactics and align with one of the major parties. Advocacy groups are also less likely to support maintaining the status quo.
This dissertation argues that interest group lobbyists perform two functions. First, these groups set the agenda by engaging in positive promotion of legislation. Second, advocacy organizations push legislators to vote along party lines in roll-call voting. Using original data on lobbying registrations, bill introductions and roll-call records, I test this argument in Congress and the 50 state legislatures.
Advocacy organization lobbying is increasingly prevalent, and the results help explain high levels of party polarization in Congress, and an uneven pattern of polarization in the American state legislatures.
Degree Type Degree Type Dissertation
Degree Name Degree Name Doctor of Philosophy (PhD)
Graduate Group Graduate Group Political Science
First Advisor First Advisor Marc N. Meredith
Keywords Keywords agenda setting, interest groups, legislatures, lobbying, polarization, state politics
Subject Categories Subject Categories Political Science | Public Policy
This dissertation is available at ScholarlyCommons: https://repository.upenn.edu/edissertations/2298
INTEREST GROUPS, LOBBYING AND POLARIZATION IN THE UNITED STATES
Alex Garlick
A DISSERTATION
in
Political Science
Presented to the Faculties of the University of Pennsylvania
in
Partial Fulfillment of the Requirements for the
Degree of Doctor of Philosophy
2016
Supervisor of Dissertation
Marc Meredith, Associate Professor of Political Science
Graduate Group Chairperson
Matt Levendusky, Associate Professor of Political Science
Dissertation Committee
John Lapinski, Associate Professor of Political Science
Matt Levendusky, Associate Professor of Political Science
Marc Meredith, Associate Professor of Political Science

INTEREST GROUPS, LOBBYING AND POLARIZATION IN THE UNITED STATES
c⃝ COPYRIGHT
2016
Alexander Russell Garlick
This work is licensed under the
Creative Commons Attribution
NonCommercial-ShareAlike 3.0
License
To view a copy of this license, visit
http://creativecommons.org/licenses/by-nc-sa/3.0/

Dedicated to Elise
iii

ACKNOWLEDGEMENT
I love reading dissertation acknowledgments. I believe they capture an important momentfor scholars — the end of a solitary, uphill climb — and they show who was helpful alongthe trail. For me, that starts with my advisor Marc Meredith. Most of the good ideasin these pages were the result of knocking on his door with a half-baked regression tablein hand. Matt Levendusky improved everything I wrote and John Lapinski ensured everycommittee meeting was a lively affair.
It was a privilege to be an undergraduate in the Green Mountains at Middlebury College,and then to study American politics just up the road from Independence Hall as a graduatestudent. At Penn, Diana Mutz always cut to the heart of the matter with her first question.I was fortunate that Dan Hopkins and Michele Margolis joined the faculty when they did,as they provided a fresh perspective. I also enjoyed discussing my latest research withDan Gillion, Guy Grossman, Mike Horowitz and Joe Simmons before early morning pickupbasketball.
I am grateful to so many of my graduate student colleagues. They provided me with goodspirits, comments on my work and a deep run in the 2014 softball playoffs. I especiallywish to acknowledge Osman Balkan, Guzman Castro, Josh Darr, Emmerich Davies, AshleyGorham, Danielle Hanley, Evan Perkoski, Dave Rogoff, Sid Rothstein, Stephan Stohler,Emily Thorson, and Robinson Woodward-Burns. I also wish to recognize my coauthors andcomrades in methods training: Doug Allen, Devon Brackbill, Binn Cho, Andrew Daniller,Laura Silver, and Ashley Tallevi.
I would not be a political scientist without the profound influence of my parents. My mother,Denise, taught me that everything is politics, and my father, Russell, introduced me to thescientific method at a young age. I forged my rhetorical skills around the dining roomtable with my brother Andy, and sisters Beth and Monica. We also made an outstandingcampaign team when tasked with electing our mother to state legislative office — as I said,everything is politics. Finally, throughout this long process, my wife Elise often believed inme more than I believed in myself. I dedicated this dissertation to her because it would notexist without her wisdom, energy and steadfast partnership.
A.G.Burlington, VermontSeptember 20, 2016
iv
ABSTRACT
INTEREST GROUPS, LOBBYING AND POLARIZATION IN THE UNITED STATES
Alex Garlick
Marc Meredith
Most lobbying in the United States comes from business interests, but not all. Previous work
has not paid sufficient attention to how non-business lobbying affects legislative behavior.
Firms are more interested in particular goods than advocacy groups which pursue broad-
based policy change. These citizen-based organizations often employ grassroots tactics
and align with one of the major parties. Advocacy groups are also less likely to support
maintaining the status quo.
This dissertation argues that interest group lobbyists perform two functions. First, these
groups set the agenda by engaging in positive promotion of legislation. Second, advocacy
organizations push legislators to vote along party lines in roll-call voting. Using original
data on lobbying registrations, bill introductions and roll-call records, I test this argument
in Congress and the 50 state legislatures.
Advocacy organization lobbying is increasingly prevalent, and the results help explain high
levels of party polarization in Congress, and an uneven pattern of polarization in the Amer-
ican state legislatures.
v

TABLE OF CONTENTS
ACKNOWLEDGEMENT . . . . . . . . . . . . . . . . . . . . . . . . . . . . . . . . . iv
ABSTRACT . . . . . . . . . . . . . . . . . . . . . . . . . . . . . . . . . . . . . . . . v
LIST OF TABLES . . . . . . . . . . . . . . . . . . . . . . . . . . . . . . . . . . . . . x
LIST OF ILLUSTRATIONS . . . . . . . . . . . . . . . . . . . . . . . . . . . . . . . xii
CHAPTER 1 : Introduction . . . . . . . . . . . . . . . . . . . . . . . . . . . . . . . 1
1.1 Plan for the dissertation . . . . . . . . . . . . . . . . . . . . . . . . . . . . . 2
CHAPTER 2 : Theory: Where is the party? . . . . . . . . . . . . . . . . . . . . . . 6
2.1 Literature review: What is polarization? . . . . . . . . . . . . . . . . . . . . 6
2.2 Literature review: What is lobbying? . . . . . . . . . . . . . . . . . . . . . . 10
2.3 Theoretical argument . . . . . . . . . . . . . . . . . . . . . . . . . . . . . . 12
CHAPTER 3 : Do groups set the agenda? . . . . . . . . . . . . . . . . . . . . . . . 19
3.1 How groups set the agenda . . . . . . . . . . . . . . . . . . . . . . . . . . . 21
3.2 Groups align with the agenda . . . . . . . . . . . . . . . . . . . . . . . . . . 28
3.3 Which comes first: the agenda or the groups? . . . . . . . . . . . . . . . . . 32
3.4 Discussion and implications . . . . . . . . . . . . . . . . . . . . . . . . . . . 36
CHAPTER 4 : When does lobbying polarize roll-call votes? . . . . . . . . . . . . . 39
4.1 Two types of lobbying . . . . . . . . . . . . . . . . . . . . . . . . . . . . . . 41
4.2 Measuring the influence of lobbyists on roll-call votes . . . . . . . . . . . . . 45
4.3 Advocacy organization lobbying leads to polarization . . . . . . . . . . . . . 51
4.4 Discussion and implications . . . . . . . . . . . . . . . . . . . . . . . . . . . 59
CHAPTER 5 : Do national policies drive state politics? . . . . . . . . . . . . . . . 61
vi

5.1 Washington’s long shadow . . . . . . . . . . . . . . . . . . . . . . . . . . . . 63
5.2 Measuring national issues & polarization . . . . . . . . . . . . . . . . . . . . 67
5.3 Are states with national agendas more polarized? . . . . . . . . . . . . . . . 77
5.4 Discussion and implications . . . . . . . . . . . . . . . . . . . . . . . . . . . 81
CHAPTER 6 : Conclusion . . . . . . . . . . . . . . . . . . . . . . . . . . . . . . . . 84
6.1 Place in the literature . . . . . . . . . . . . . . . . . . . . . . . . . . . . . . 85
6.2 Implications of group influence . . . . . . . . . . . . . . . . . . . . . . . . . 86
6.3 Is the system rigged? . . . . . . . . . . . . . . . . . . . . . . . . . . . . . . . 87
APPENDIX . . . . . . . . . . . . . . . . . . . . . . . . . . . . . . . . . . . . . . . . . 89
CHAPTER A : Supporting materials for Chapter 3 . . . . . . . . . . . . . . . . . . 90
A.1 Collecting an annual census of interest groups . . . . . . . . . . . . . . . . . 91
A.2 Estimating the subject matter of bills introduced in the states . . . . . . . . 99
A.3 Estimating and validating policy sectors of lobbying groups . . . . . . . . . 101
CHAPTER B : Supporting materials for Chapter 4 . . . . . . . . . . . . . . . . . . 130
B.1 Collecting bill-level lobbying and roll call data . . . . . . . . . . . . . . . . . 130
B.2 Data exploration . . . . . . . . . . . . . . . . . . . . . . . . . . . . . . . . . 136
CHAPTER C : Supporting materials for Chapter 5 . . . . . . . . . . . . . . . . . . 141
C.1 Measuring National Policies . . . . . . . . . . . . . . . . . . . . . . . . . . . 141
C.2 Validating the use of Party Difference . . . . . . . . . . . . . . . . . . . . . 152
BIBLIOGRAPHY . . . . . . . . . . . . . . . . . . . . . . . . . . . . . . . . . . . . . 155
vii

LIST OF TABLES
TABLE 1 : Predictions: Will lobbying polarize by party? . . . . . . . . . . . . 17
TABLE 2 : Lobbying organizations are associated with bills introduced in the
states: 2007-14 . . . . . . . . . . . . . . . . . . . . . . . . . . . . . 31
TABLE 3 : Levin, Lin, and Chu (2002): Unit Root Test . . . . . . . . . . . . . 33
TABLE 4 : Do bills cause groups or do groups cause bills? . . . . . . . . . . . . 35
TABLE 5 : Where do groups set the agenda? 2007-2014 . . . . . . . . . . . . . 35
TABLE 6 : Predicted Polarization by Group Type . . . . . . . . . . . . . . . . 44
TABLE 7 : Advocacy organization lobbying polarizes roll-call votes by party:
105th-112th U.S. Congresses (1998-2012) . . . . . . . . . . . . . . . 53
TABLE 8 : Advocacy organization lobbying polarizes roll-call votes by party in
Colorado (2011-2014) and Ohio (129th-130th Sessions) . . . . . . . 56
TABLE 9 : Placebo test: Only lobbying in actual state is associated with party
difference . . . . . . . . . . . . . . . . . . . . . . . . . . . . . . . . 58
TABLE 10 : National Policy Scores: 2011-2014 . . . . . . . . . . . . . . . . . . 71
TABLE 11 : Party difference on floor votes across 25 states (2011-2014) . . . . 73
TABLE 12 : More Party Difference on National Policies: 2011-2014 . . . . . . . 75
TABLE 13 : More difference between parties in states with national agendas:
2011-2014 . . . . . . . . . . . . . . . . . . . . . . . . . . . . . . . . 80
TABLE 14 : Data sources for lobbying group registrations . . . . . . . . . . . . 92
TABLE 15 : Group registrations by year: 2005-2016 . . . . . . . . . . . . . . . . 92
TABLE 16 : Sessions by year: 2005-2015 . . . . . . . . . . . . . . . . . . . . . . 93
TABLE 17 : Coding scheme for LexisNexis and lobbying subjects in the U.S.
Congress . . . . . . . . . . . . . . . . . . . . . . . . . . . . . . . . . 96
TABLE 18 : Coding scheme and lobbying subjects for Penn., Colorado, and Mass. 97
viii
TABLE 19 : Unused categories from organization reports . . . . . . . . . . . . . 98
TABLE 20 : Example of LexisNexis session code alignments: IL and FL . . . . . 101
TABLE 21 : Estimated number of bills introduced by policy area: 2005-2014 . . 102
TABLE 22 : Posterior probabilities for the 15 policy areas . . . . . . . . . . . . 106
TABLE 23 : Example of automated text classification procedure . . . . . . . . . 107
TABLE 24 : Validation Exercise: Testing Different Naıve Bayes Models on Mas-
sachusetts . . . . . . . . . . . . . . . . . . . . . . . . . . . . . . . . 111
TABLE 25 : Estimated number of group registrations by policy sector: 2005-2014 112
TABLE 26 : North Dakota group registrations, by estimated topic 2007-2014 . . 113
TABLE 27 : Estimated health care group registrations increased from 2008-2013 113
TABLE 28 : Estimates of manufacturing group registrations declined in the Rust
Belt: 2008-2015. . . . . . . . . . . . . . . . . . . . . . . . . . . . . . 114
TABLE 29 : Correlation between Gray and Institute estimates of groups . . . . 116
TABLE 30 : Estimates of group registrations: 2007 (Gray and Lowery estimates
in parentheses) . . . . . . . . . . . . . . . . . . . . . . . . . . . . . 119
TABLE 30 : Estimates of group registrations: 2007 (Gray and Lowery estimates
in parentheses) . . . . . . . . . . . . . . . . . . . . . . . . . . . . . 120
TABLE 30 : Estimates of group registrations: 2007 (Gray and Lowery estimates
in parentheses) . . . . . . . . . . . . . . . . . . . . . . . . . . . . . 121
TABLE 30 : Estimates of group registrations: 2007 (Gray and Lowery estimates
in parentheses) . . . . . . . . . . . . . . . . . . . . . . . . . . . . . 122
TABLE 30 : Estimates of group registrations: 2007 (Gray and Lowery estimates
in parentheses) . . . . . . . . . . . . . . . . . . . . . . . . . . . . . 123
TABLE 31 : List of groups by estimated policy sector: Hawaii 2007 . . . . . . . 124
TABLE 31 : List of groups by estimated policy sector: Hawaii 2007 . . . . . . . 125
TABLE 31 : List of groups by estimated policy sector: Hawaii 2007 . . . . . . . 126
TABLE 31 : List of groups by estimated policy sector: Hawaii 2007 . . . . . . . 127
TABLE 31 : List of groups by estimated policy sector: Hawaii 2007 . . . . . . . 128
ix

TABLE 31 : List of groups by estimated policy sector: Hawaii 2007 . . . . . . . 129
TABLE 32 : Coding rules for lobbying group type . . . . . . . . . . . . . . . . . 132
TABLE 33 : Lobbying and roll call voting data: 1999-2014 . . . . . . . . . . . . 133
TABLE 34 : Lobbyist Registration Data: 2011-2014 . . . . . . . . . . . . . . . 142
TABLE 35 : Subject coding scheme from lobbyist registrations to Open States 145
TABLE 36 : Unused subject codes for Indiana, Tennessee and Pennsylvania . . 146
TABLE 37 : Interest group characteristics by policy area: 2011-2014 . . . . . . 147
TABLE 38 : Factor Loadings: National Policies (2011-2014) . . . . . . . . . . . 148
TABLE 39 : Factor Analysis Results: National Policies (2011-2014) . . . . . . . 149
TABLE 40 : Detailed esimation of National Policy Scores . . . . . . . . . . . . 150
TABLE 41 : Association between Indiana (DV) and Penn. (IV): Weighed by no.
orgs . . . . . . . . . . . . . . . . . . . . . . . . . . . . . . . . . . . 151
TABLE 42 : Legislative and Opinion Polarization 2000-2012 . . . . . . . . . . . 153
TABLE 43 : Replicating Main Analysis with Ideal Point Estimation: 2011-2014 154
x

LIST OF ILLUSTRATIONS
FIGURE 1 : Counts of Groups and Bills by Sector: 2005-2014 . . . . . . . . . 27
FIGURE 2 : There are diminishing returns from interest group registration on
bill introductions: 2005-2016 . . . . . . . . . . . . . . . . . . . . . 28
FIGURE 3 : Proposed mediation pathway . . . . . . . . . . . . . . . . . . . . 32
FIGURE 4 : There is more agenda control in US Congress than in the states. In
Colorado, the GAVEL policy leads to a much higher share of bills
receiving a passage vote. . . . . . . . . . . . . . . . . . . . . . . . 49
FIGURE 5 : Placebo test: Lobbying from the other state does not affect polar-
ization . . . . . . . . . . . . . . . . . . . . . . . . . . . . . . . . . 57
FIGURE 6 : More Party Difference on National Policies: 2011-2014 . . . . . . 74
FIGURE 7 : Heat map of Average Party Difference on roll-call votes in state
legislatures: 2011-2014 . . . . . . . . . . . . . . . . . . . . . . . . 75
FIGURE 8 : Heat map of National Policy Agendas in state legislatures: 2011-
2014 . . . . . . . . . . . . . . . . . . . . . . . . . . . . . . . . . . 76
FIGURE 9 : States with national agendas have more average party difference:
2011-2014 . . . . . . . . . . . . . . . . . . . . . . . . . . . . . . . 79
FIGURE 10 : Most bills in Congress, CO, & OH are lobbied by small no. of
groups: 2011-2014 . . . . . . . . . . . . . . . . . . . . . . . . . . 134
FIGURE 11 : There are more bills with moderate amounts of lobbyist attention
in the states: 2011-2014 . . . . . . . . . . . . . . . . . . . . . . . . 135
FIGURE 12 : There are more bills with large amounts of lobbyist attention in
Congress: 2011-2014 . . . . . . . . . . . . . . . . . . . . . . . . . . 135
FIGURE 13 : There is more party difference on ideological bills in Colorado:
2011-2014 . . . . . . . . . . . . . . . . . . . . . . . . . . . . . . . 137
xi
FIGURE 14 : There is more party difference on conservative bills in Ohio: 2011-
2014 . . . . . . . . . . . . . . . . . . . . . . . . . . . . . . . . . . 137
FIGURE 15 : There is more party difference in Colorado on bills mentioned in
the Denver Post : 2011-2014 . . . . . . . . . . . . . . . . . . . . . 138
FIGURE 16 : There is more party difference in Ohio on bills mentioned in the
Columbus Dispatch: 2011-2014 . . . . . . . . . . . . . . . . . . . 138
FIGURE 17 : Party difference and salience by policy area in Congress: 2009-2012 140
FIGURE 18 : Share of national groups in Indiana and Pennsylvania, by PAP . . 152
xii

CHAPTER 1 : Introduction
“The American people are not boiling with concern about the workings of their state
government.” - V.O. Key (1966)
In 2011, Kansas Governor Sam Brownback authored the foreword to an American Legisla-
tive Exchange Council (ALEC) proposal for substantial state-level tax reform. He wrote,
“I encourage you to watch Kansas during the next few years as we work to reset the state’s
course on taxes and let our citizens once again be the engine of economic growth” (Laffer,
Moore, and Williams, 2011, p. viii). Kansas proved worthy of attention. In 2012, Brown-
back proposed a consolidation of personal tax brackets and eliminating taxes on LLCs and
sole proprietors. Democrats stood united in opposition, but they were vastly outnumbered
and the Kansas legislature passed the radical reduction in taxes. There were immediate
budget shortfalls. Spending on education was hit the hardest, and the teachers unions suc-
cessfully challenged the fiscal program in court. The Brownback administration responded
by challenging the courts’ own authority and defunding all of their operations, launching a
constitutional crisis.1
This episode suggests that outside groups like ALEC could have substantial influence on
public policy in state legislatures. Similar processes can be found in the federal government.
After a 2015 shooting at a community college in Roseburg, Oregon, President Barack Obama
claimed there was widespread public support for gun control, and blamed the National Rifle
Association for years of Congressional inaction. He addressed NRA members directly and
asked them to: “Think about whether your views are properly being represented by the
organization that suggests it’s speaking for you.”2 Gun control was just one of a number
of issues including immigration reform, climate change and entitlement reform that have
stalled in Congress in recent years. This policy stalemate has been attributed to party
1Sullentrop, Chris (2015). “The Kansas Experiment” New York Times Magazine http://www.nytimes.
com/2015/08/09/magazine/the-kansas-experiment.html 9 Aug.2“President’s Remarks after shooting in Roseburg, OR. 15 Oct 2015 https://www.whitehouse.gov/
blog/2015/10/01/watch-president-obamas-statement-shooting-oregon.
1

polarization (Binder, 2003).
This dissertation ties these two processes together. It observes the actions of interest groups
to explain high levels of party polarization in Congress, and an uneven pattern of party
polarization in the states. Specifically, I focus on the ability of groups to set the agenda
through positive promotion or negative blocking of legislation. I also argue that lobbyists
influence legislative debate and roll-call voting, resulting in more party line roll-call votes.
Finally, I take a broad view of the federal system to observe the implications of policy stale-
mate in Congress. Obama concluded his Roseburg remarks by admitting that addressing
gun violence exceeded the powers of his office. “This is not something I can do by myself.
I’ve got to have a Congress and I’ve got to have state legislatures and governors who are
willing to work with me on this.” Obama identifies a key consequence of party polarization
in Congress: policy making has shifted to state legislatures. In the year following Obama’s
plea for gun control at the 2013 State of the Union, the states passed 172 gun related
laws.3 My third empirical chapter shows that Congressional polarization has spilled over to
the states, and that states with more previously national issues on their agenda are more
polarized by party.
1.1. Plan for the dissertation
In the second chapter, I review the literature on party polarization to build a theory that
interest groups demands play a key role as legislators form their preferences. I then in-
vestigate how groups connect with legislators, and pursue their goals, through lobbying. I
disaggregate the groups that engage in lobbying, arguing that advocacy organizations have
different goals and tactics than businesses. Specifically, these citizen-based groups pursue
broader based policy programs that are more likely to upset the status quo. Furthermore
they use “outside lobbying” or grassroots tactics to leverage their citizen membership. As
a result, lobbying from these groups should have a different impact on legislator behavior
3According to the Law Center to Prevent Gun Violence http://smartgunlaws.org/
tracking-state-gun-laws-2014-developments/ (2 May 2014).
2

than previous literature finds.
Lobbying is the transmission of information to public officials in private settings, so it is a
notoriously difficult practice for researchers to observe (De Figueiredo and Richter, 2014). In
the next three empirical chapters, I test my arguments in both the U.S. Congress and in all
50 state legislatures, with data spanning from 1998 to 2014. I support my argument against
extant literature with new and varied data. The empirical study of lobbying has developed
rapidly in recent years following the passage of the federal 1995 Lobbying Disclosure Act,
versions of which have also been enacted in the states. This dissertation contributes to
this growing field with a number of original datasets collected from several Secretary of
State offices, scraped from legislative websites, and from the Center for Responsive Politics,
LexisNexis, Sunlight Foundation, Project Votesmart, National Institute on Money in State
Politics, and the Policy Agendas Project.
Chapter 3 argues that interest groups can set the agenda in state legislatures. While busi-
nesses have traditionally engaged in negative blocking of legislation, advocacy organizations
are more interested in positive promotion of legislation that will change the status quo. The
information transmitted by lobbyists to legislators serves a “subsidy” that reduces the costs
of making policy. In this chapter I apply this theory to argue that policy areas supported
by legislative subsidies will crowd out areas with fewer subsidies and occupy more of the
legislative agenda. I introduce a dataset for this chapter, a 10 year panel of observations
of interest groups by industrial sector, which allows me to address an old question in the
interest group literature: “Does interest group lobbying come before bills, or do bills come
before lobbying?” by showing that changes in the interest group lobbying community are
more likely to drive changes in the agenda than the inverse.
Chapter 4 argues that advocacy organization lobbying can polarize roll-call voting on party
lines. Because these groups are pursuing broad-based policy change, they concentrate their
activity on passage votes, requiring them to mobilize allies and persuade undecided legisla-
tors. In essence, these groups replicate a party whipping operation, and I find there is more
3

party line voting on roll-calls on bills lobbied by advocacy organizations. In line with the
prior literature, business and public sector lobbying has a moderating effect. I first find this
relationship in Congress, but there are a number of empirical concerns that could confound
this association. Therefore, I also examine the Ohio and Colorado legislatures which have
unusual institutional alignments to help address these concerns.
Chapter 5 takes a step back from lobbying to focus on the policy agenda to answer the
research question: “why are some states polarized and others not?”
I propose a theory where ambitious legislators will vote on party lines on national issues
that have been on the agenda in Washington, D.C. This theory requires a definition of
national issues, which I produce by observing which groups that lobby in state legislatures
also lobby in Congress. I find that roll-call votes on national issues like gun control, abortion
and gender rights, are more polarized by party than state-specific agendas. I also find that
states with more national agendas tend to be more polarized. Therefore the policy agenda
is a powerful explanation for patterns of state level polarization, even when accounting for
prior explanations.
Chapter 6 concludes with a discussion of the implications of my findings for a number of
debates in the political science literature.
For one, this dissertation calls for closer attention to lobbyists representing advocacy orga-
nizations. These groups are a minority of the groups that lobby, but they have distinct goals
and tactics that produce more partisan behavior than the business interests that outnumber
and outspend them. The lobbying activity of these groups has exploded since the 1970s
(Berry, 1999), which suggests an explanation for why the roll-call voting of legislators has
become so polarized in modern time.
The advantage of this explanation is that it provides a missing piece for a puzzle in the liter-
ature, which is that elite behavior is clearly polarized (Poole and Rosenthal, 2000), but the
opinions of the citizens on individual issues appear to be more muddled (Fiorina, Abrams,
4
and Pope, 2006; Mason, 2015). While there is not consensus that citizens are moderate per
se (Abramowitz and Saunders, 2008), it is clear they hold very low levels of information
about politics. Interest group lobbyists can amplify the public’s voice on individual issues
and communicate it to officials during legislative debate. Therefore, legislators’ extreme
behavior may be aligned with their perception of their constituents’ opinions.
This study also joins a growing literature that argues interest groups have a strong partisan
impact. Bawn et al. (2012) argue that parties are “best understood as coalitions of interest
groups and activists seeking to capture and use government for their particular goals,” and
have provided evidence for this argument using primary elections (Masket, 2009), presiden-
tial nominations (Cohen et al., 2009), ideologies (Noel, 2014), and how issues map onto
party conflict (Karol, 2009; Layman et al., 2010). The contribution of this dissertation is to
focus on interest group behavior in legislative debate — specifically how they replace the
party whipping function traditionally done by party leaders.
To return to the inscription from V.O. Key, the founding father of the state politics litera-
ture, this dissertation calls for a refocus of public attention to state legislatures. The bulk of
attention paid to Americans politics by academics, journalists and policy elites focuses on
Washington, DC. But this attention overlooks nearly anonymous state-level politicians who
shape the policies that govern our schools, environment, paychecks and rights as American
citizens.
5
CHAPTER 2 : Theory: Where is the party?
2.1. Literature review: What is polarization?
The first step in studying partisan polarization is defining the key terms. On its own,
polarization starts with the separation of a quantity into two parts. These parts are said
to be polarizing if the distance between them is increasing. Applying this concept to a
political arena like a legislature, political polarization could be a group of legislators who
vote together and are opposed by another group of legislators. Lee (2015) describes how
polarization is usually conceived of as party polarization, where members of one party vote
with each other and against the other party.
However, the parties are not always the key cleavage resulting in political polarization in the
United States. For example, in the 1960s there were a group of Democratic U.S. Senators
from southern states that would behave as Democrats in most policy areas, but would vote
against civil rights legislation that a number of Democrats and Republicans supported.
Therefore, there was political polarization along a racial policy cleavage.
A number of researchers have chosen to instead emphasize spatial polarization, by attempt-
ing to measure the individual preferences of legislators (Poole and Rosenthal, 1985). This
approach has two advantages. First, it can be agnostic to party labels. A spatial model
does not need party labels of legislators to estimate the preferences of individuals; therefore,
a well-specified model would be able to detect the racial cleavage in the 1960s. Second, a
spatial model would be able to detect the distance between the two groups, and if it is
increasing.
However, assigning legislators a spatial reading of their preferences is difficult for method-
ological and conceptual reasons. Conceptually, what makes one’s preference extreme? Usu-
ally, a legislator is said to be extreme if he or she1 is an ideologue. Dating back to Converse
1For grammatical clarity, I have arbitrarily chosen to use “he” instead of “he or she” when using pronounsto describe individuals in this dissertation.
6

(1962), an individual is ideological if there are logical connections between the positions he
holds on a number of issues. In practice, an ideology is then a bundle of issue positions
a number of political actors agree should be held together (Noel, 2014, ch. 5). Therefore,
“extremity” is not measured on an issue by issue basis, but rather observed on a number of
issues.
Empirically, spatial measures of ideology have usually been generated using item response
models (Poole and Rosenthal, 1985). These models generally observe who votes with whom
to rank legislators based on their ideological standing. The multiple dimensions are open to
interpretation, and require a number of assumptions of their own.2 A more pressing issue,
as Krehbiel (1993) notes, is disentangling a legislator’s personal preferences from party
pressures, as those votes are often observationally equivalent.
What drives a legislator’s preferences? Each individual probably has policies that he believes
would improve society, but Fenno (1973) notes that legislators have a number of other goals.
In addition to enacting effective policy, they often care about re-election and advancing their
career, both within their chamber and into higher office. Adhering to their party drives a
number of these goals, for example, party leaders make committee assignments that mark
advancement within a chamber. Therefore, while legislators make their own decisions,
understanding what a party’s preferences are is essential to understanding the preferences
of an individual legislator.
Determining a party’s preferences depends on one’s view of what precisely a party is. Key
(1964) highlights that a party has three general forms: the party-in-government, the party-
in-the-electorate, and the party-as-organization. Different theoretical conceptions of the
party have different predictions for how the party influences the preferences of its members.
2For a methodological discussion of this issue, and how the first dimension in DW-NOMINATE that isoften assumed to be a liberal-conservative dimension is actually the partisan dimension see Noel (2014, ch.5) and Lee (2015, p. 265).
7

2.1.1. Where do party preferences come from?
Since the two major parties in the United States have millions of members, it is possible that
legislator preferences flow from the electorate. However, Converse (1962) concluded that
the vast majority of the public cannot form coherent responses to open-ended questions,
implying that it lacks a clear ideology. Empirical evidence backs this position. Voters
hold very little information about politics (Delli Carpini, Keeter, and Kennamer, 1994),
and especially state politics (Rogers, 2013), so it is unlikely they are generating the issue
positions of their party. Direct tests on elite and mass level preferences reveal that the
public usually follows the issue positions of elites (Lenz, 2013; Zaller, 1992).
A second view is that the party organization creates preferences. This view shifts power
to the party bosses and the organization. Downs (1957) offered a rational choice theory
that considers parties as a team seeking to control government by winning elections. For
Downs, parties formulate policies in order to win elections. He famously predicted that
parties would moderate their policies in this pursuit, known as the median voter theorem.
Aldrich (1995) presents a theory where the party is controlled by elected officials, writing
“the political party is the creature of the politician, the ambitious office seeker and office
holder.” In terms of winning elections, party leaders aspire to create a positive brand to sell
to voters during a campaign. They build this brand by accumulating a number of policy
positions that are popular with the individual members. Specifically, parties build a long
coalition where one member receives a second member’s support for the first legislator’s pet
project in exchange for his support on issues they may be indifferent about. For Aldrich,
policy is formulated to reach consensus within the caucus, so that as many members are
re-elected as possible and party leaders keep their positions.
Bawn et al. (2012) advance a theory of parties that does not consider the party the creation
of elected officials and candidates. Like Downs, these authors see the party as an orga-
nization, or rather a collection of organizations. These organizations, which Cohen et al.
8

(2009) call intense policy demanders have three characteristics: they are animated by a set
of demands, they are politically active, and they have enough resources to be influential.
The resources these groups bring to bear include financial resources and volunteers, such
that Noel (2014) labels them the “labor force” of campaigns.
In this view, instead of the party being organized to win elections, the party uses elections
to implement policies. The benefit to this theory, especially when applied to state politics,
is that the lack of attention paid to politics by citizens is a feature, and not a bug. This
theory builds off Aldrich’s theory of the party. Despite the individual focus groups may
have on a single issue, they are capable of joining with traditional party organizations, and
party leadership, to form long coalitions. This allows them to offer support on issues or
candidates they are indifferent about in exchange for support on their policy.
These alternative views of parties respond to historical political context. Downs’ view
that the party responds to party bosses captures the political machine era of American
government, where office holders were often interchangeable. Aldrich’s theory best explains
the era of candidate-centered elections, which occurred after the 1972 McGovern-Fraser
reforms and the rise of television. The Bawn et al. view captures a modern era where the
incumbency effect is strong; incumbent candidates often have large war chests of financial
resources to scare off challengers and there are few competitive general elections for offices,
like the U.S. House. In this view, primary elections have become paramount and lends
influence to outside groups; therefore, I proceed with this view of the party in mind.
The advantage of the groups based theory is that it addresses how party preferences are
formed — by aggregating group demands together. However, this theory has not exam-
ined how those demands are signaled to sitting legislators. Direct contact between outside
groups and legislators is usually called lobbying, and the next section explains how groups
contribute to party polarization through that lens.
9

2.2. Literature review: What is lobbying?
Lobbying is the transmission of information to public officials or their staff in private settings
(De Figueiredo and Richter, 2014). But what is happening behind those closed doors? There
are three general models of lobbying. The first view is that lobbying, in conjunction with
financial contributions, buys a legislator’s vote. This lobbying-as-exchange theory (Stigler,
1971) does not have much empirical support, as expenditures on lobbying do not correlate
with policy change (Langbein and Lotwis, 1990).
A second view is that financial contributions buy “access” to legislators, which allows lob-
byists to transmit information. In this case, lobbyists use their substantial resources to
accumulate a wealth of private information, create an information asymmetry over legis-
lators, and then exploit that information imbalance to persuade them (Austen-Smith and
Wright, 1994).
A third model posits that the information lobbyists provide legislators with helps them
face the high costs of the policy process. In this lobbying-as-subsidy model, lobbyists help
their allies reach mutual goals by presenting legislators with “a matching grant of costly
information, political intelligence and labor” (Hall and Deardorff, 2006, p. 69). It does not
entail persuasion as much as mobilization. In the absence of a subsidy, a group fears that
a Congressional office “will spend its time and effort on some other issue” (Mahoney and
Baumgartner, 2015, p. 204).
A key difference between these latter two models is the strategic purpose of lobbying. In
the subsidy model, Hall and Deardorf consider legislators to have strong, or even fixed
preferences. Therefore, no matter how much information lobbyists have, it would not be
worth it to attempt to persuade legislators. This is not the case in the informational model,
that allows for weaker preferences. Researchers can not directly measure the strength of
legislator preferences, but they can observe who talks to whom.3 Hall and Deardorf conclude
3Or who reports targeting whom in interest group surveys.
10

that the subsidy model dominates because lobbyists “concentrate on their allies, avoid their
enemies and lobby undecideds infrequently.” If lobbyists were trying to persuade they would
be targeting undecided legislators.
In a case study of the 2009 Waxman-Markey bill in the House of Representatives, Kim,
Urpelainen, and Yang (2016) showed that most of the lobbying was in line with the subsidy
model. The bill was intended to address climate change with a cap-and-trade carbon tax
before the Democratically controlled chamber during the first term of the Obama Admin-
istration. In their study, the authors are able to exploit the expectations of which side was
going to win and lose. Groups that expected to be on the winning side were mostly trying
to shape the outcome of the legislation to benefit their particular interests. This lobbying
was in pursuit of concentrated benefits, which Wilson (1989) called “client politics.”
A vast majority of the lobbyists on Capitol Hill represent businesses or trade associations
(De Figueiredo and Richter, 2014). However, not all lobbying comes from business is the
pursuit of particular goods. The classic book Showdown at Gucci Gulch describes the
battle over the 1986 Tax Reform Act that “pit special interests, who would struggle to
keep their loopholes, against the general interest — lower rates for everyone” (Birnbaum
and Murray, 1988, p. 29). The legislators, activists and groups supporting this broad tax
reform: Common Cause, Ralph Nader’s Public Citizen, and Citizens for Tax Reform were
trying to change the status quo to benefit huge swaths of the population.
These groups are examples of advocacy organizations, or citizen-based groups that engage
in lobbying activities. They differ from businesses in three ways. First, they have broader
policy goals. Second, they are more likely to challenge the status quo. Baumgartner et al.
write “it is almost impossible to push policy change that threatens the material interests
of large corporations, trade groups, labor unions and others with lots of money” (2009, p.
40). These groups amassed their wealth under the status quo, so they often, although not
always, are lobbying in defense of it.
11
Advocacy organizations may not have the financial resources of businesses, but they have
one resource advantage: their citizen members. This advantage creates the third division,
advocacy organizations are more likely to use outside or grassroots tactics that utilize their
mass-based membership. For example, these groups are more likely to engage in electoral
politics than business groups, because they have enough members to make a meaningful
impact.
With these differences between advocacy and business groups in mind, in the next section,
I argue how these different groups pursue these goals at different stages of the legislative
process. First, I address how interest group activity affects how agendas are set. Second, I
will examine interest group lobbying during legislative debate and roll call voting.
2.3. Theoretical argument
2.3.1. Setting the agenda
In The Semisovereign People, Schattschneider (1960) wrote “There are billions of potential
conflicts in any given society, but only a few become significant,” highlighting a fundamen-
tal issue that public officials face; they need to choose between a number of issues that
deserve their time and attention. The surplus of potential issues results in legislators hold-
ing incomplete information and a limited amount of attention (Lindblom, 1959). As a result
“decision makers take what they are currently doing as given, and make small, incremental,
marginal adjustments.” This incremental approach results in a status quo bias. But new
issues do make it on the agenda. Baumgartner and Jones (1993) reframe Lindblom’s theory
as “bounded rationality” and note that while it can lead to stability, it can also lead to
rapid change as people “occasionally feel a sense of urgency that something must be done”
and fixate on a single issue.
Because the majority of lobbyists represent business interests, and these groups are usually
more disposed to maintaining the status quo, most lobbying may not be interested in positive
promotion of new issues as much as negative blocking of other issues from the legislative
12

agenda. However, for the minority of groups that looking to promote new issues, Kingdon
(1984) provides a framework for how issues capture the attention of policymakers. For
Kingdon, a “window of opportunity” can open based on the convergence of three streams
of influence: problems, politics and policy. The problem stream is driven by events or
social issues that have the attention of the public and policymakers. The political stream
concerns what there is an appetite to address, and can lead to change when the actors in
power change. The policy stream provides solutions or alternatives to issues that arise in
the other two streams. A problem is not ready to be on the agenda until there is a viable
alternative, so it usually takes at least two of these streams to converge and put a new issue
on the agenda.
Information from lobbyists can convince a legislator that a problem exists and is worthy of
attention. Lobbyists can also offer alternatives to legislator that have decided to undertake
a problem and form a policy solution. In the terminology of Hall and Deardorff (2006),
lobbying subsidizes tasks that make up the costly process of drafting legislation, including
holding hearings and finding co-sponsors. This information proves valuable because, as
Schattschneider wrote, “conflicts compete with each other” (1960, p. 63) and when legisla-
tors choose between different topics that are worthy of their attention. In the third chapter,
I will argue that the lobbying subsidies encourage legislators to take action on a position
they already hold, and to not do something else (Mahoney and Baumgartner, 2015).
In economic terms, the cost of introducing a bill is low in a policy area with favorable
interest group lobbying. Discussing the implications of their theory, Hall and Deardorff
(2006) note that subsidies encourage legislators to work harder on behalf of the interests
that can afford the higher costs. In the context of the agenda, I will argue that issue areas
supported by more legislative subsidies could crowd out issues without as much support.
If a legislator is considering between several potential issues, holding other factors equal,
subsidized issues fare a better chance than unsubsidized policies of making the agenda.
However, this argument is dependent on the goals of the group doing the lobbying. Earlier,
13

I mentioned how business interests have a different orientation to the status quo than
advocacy groups. This means that when it comes to the agenda being set, they are more
likely to engage in negative blocking than positive promotion of legislation. Therefore, I will
argue that it is necessary to disaggregate lobbyists by type to properly understand agenda
setting. I will predict that business lobbying will result in fewer new issues on the legislative
agenda while advocacy lobbying will result in more new issues on the agenda.
2.3.2. Roll-call voting
Returning to the Showdown at Gucci Gulch, even after tax reform made it on to the Con-
gressional agenda, the challenges facing tax reform advocates was daunting. Their moneyed
opponents benefited from the status quo and had an entrenched lobbying operation. These
lobbyists were pursuing concentrated benefits, and in line with the subsidy model, this lob-
bying was not intended to persuade legislators at the roll call stage as much as mobilize
allied legislators at the committee stage. I call this lobbying particularistic lobbying.
Tax reformers were advocating on behalf of the the public, so its potential beneficiaries were
unorganized and diffuse. Furthermore, the policy making process is slow and incremental,
which requires a great deal of coordination. These conditions form a classic collective action
problem. I propose that in contrast to particularistic lobbying, these groups were engaging
in a second type of lobbying, and call it collective lobbying because it is trying to solve
that collective action problem. Collective lobbying has two features: first, it addresses
broad public policy issues that have wide-spread costs or benefits. Second, it is concerned
with the passage or failure of legislation. Appropriations decisions are usually made by
committees (Clemens, Crespin, and Finocchiaro, 2015), so it follows that particularistic
lobbying would be focused on that stage.4 But when the outcome of a policy is in doubt,
lobbying demands a different strategy. Instead of lobbyists merely subsidizing the action of
an allies, they need to mobilize legislators with weak but favorable preferences, and persuade
4Clemens, Crespin, and Finocchiaro (2015) note how House rules on appropriation disclosure havechanged in recent years, which adds another hurdle to particularistic lobbying.
14

undecided legislators.
Collective lobbying requires different tactics to achieve its strategic goals. Hall and Deardorff
(2006) only consider persuasion possible under a limited circumstance where legislators have
weak preferences, the outcome is in doubt and the vote is likely to be tied to them in public.
Therefore, the first thing these groups can do is go public. In 1986, supporters of tax reform
attacked any legislator that stood in their way in the press, labeling them as sellouts to
special interests and organizing letter writing campaigns (Birnbaum and Murray, 1988, p.
127). In 2009, opponents of the Affordable Care Act, such as the association of private health
insurers, set up advocacy hot lines, town hall meetings, and media campaigns to voice their
displeasure with portions of the bill (Quadagno, 2011). Both of these examples are “outside
lobbying” tactics, or grassroots activities meant to shape public opinion and supplement an
inside lobbying strategy. Walker (1991) reports that the most effective outside lobbying is
predicated on the threat of replacement. These groups can mobilize their members in an
election, which is especially valuable in a low-turnout primary (Masket, 2009).
The challenge of changing a legislator’s roll call position through “inside lobbying” is ex-
acerbated on issues with diffuse benefits. As the Reagan administration found in 1986:
“Those who are hurt more by tax reform will always scream louder than those who are
helped” (Birnbaum and Murray, 1988, p. 72). This creates a situation that Aldrich (1995,
ch. 2) calls the Problem of Collective Policymaking. Legislators have issues they support,
issues they are indifferent about, and issues that would really hurt them; which can lead
to nothing getting done. Aldrich’s solution is the formation of a long coalition, where a
legislator garners support for his pet project by pledging support for another legislator’s
pet project he is indifferent about. The long coalition is the basis for Aldrich’s theory
of parties-in-government, and the same logic applies to interest groups. If groups cannot
change a legislator’s preference using outside pressure, they can offer their support for some-
thing he does care about. Coordinating this behavior is traditionally the domain of party
leaders, who are well equipped to instill discipline to the coalition by controlling committee
15
assignments and access to the legislative calendar for pet projects.
While a series of groups can form their own long-coalition — Ralph Nader, Sen. Bill Bradley
and President Reagan were odd bedfellows in 1986 — it is difficult to maintain because they
do not have the enforcement mechanisms that party leaders have. Therefore, it is easier
for groups to attach their issues to one of the existing party’s long coalitions. Outside
lobbying is also more effective if done in the context of a single party. Advocacy group
members are likely ideologically aligned, and it is easier to affect the key leverage points,
like a party primary, if a group is repeatedly on the same side. For these reasons, in the
modern context, it is likely that collective lobbying will align with a single party. It should
come as no surprise that interest groups have increasingly aligned with one of parties to
form two “ideological teams” (Koger, Masket, and Noel, 2009).
If a group is aligned with a single party and collectively lobbies, it is effectively attempting
to “whip” the party’s members, which has long been the domain of party leadership. Since
party leaders have better enforcement tools, this would be puzzling behavior. However,
Mahoney and Baumgartner (2015) note that outside groups often serve this function, likely
because the time and attention of party leaders is limited and they can not spend these
resources on every bill that a member of their coalition cares about. Groups do have these
resources, and only have to work on a single issue at a time.
Groups will engage in collective lobbying if want to add a new issue to the party portfolio,
like when abortion and tort reform were added to the party’s list of positions (Carmines
and Woods, 2002; Karol, 2009), or if they have a different endgame than leadership. Party
leaders care about the policy their chamber produces and how it affects their electoral math
(Aldrich and Rohde, 2000), but groups care about what happens on the ground (Bawn et al.,
2012), so they will follow policy from one chamber to the next. In the Waxman-Markey
case, the final vote in the U.S. House was just the end of the first stage, the U.S. Senate
was next, and that is where the bill died. Even after President Obama signed the ACA, a
collection of groups contested it in the courts, resulting in the U.S. Supreme Court hearing
16
National Federation of Independent Business v. Sebelius, and in state legislatures, where
key provisions regarding personal insurance exchanges and Medicaid expansion have played
out on party lines (Hertel-Fernandez, Skocpol, and Lynch, 2016; Barrilleaux and Rainey,
2014).
Regardless of why groups choose to collectively lobby, if it is done effectively, it should
increase that party’s unity. My first hypothesis will be collective lobbying will result in
party voting. A caveat to this prediction is that collective lobbying will only result in po-
larization if it works. Collective lobbying entails a blend of mobilization and persuasion,
which is more likely when the vote is public and traceable to a legislator (Hall and Dear-
dorff, 2006). Groups that engage in outside lobbying can mobilize their members to vote
using mailing lists or to volunteer in campaigns (Noel, 2014), are over-represented in the
media (Berry, 1999) and can engage in other grassroots organization. Outside lobbying
attempts to influence policy change by the replacement of legislators, or at least the threat
of replacement. Groups with outside tactics are more likely to persuade, and therefore be
successful collective lobbyists.
The likelihood of lobbying contributing to polarization is then driven by these two factors.
Table 1 aligns groups by their goals and tactics to balance these two factors. It asks two
questions. Is a group engaging in collective lobbying trying to push legislators along party
lines? Second, it it likely to be effective?
Table 1: Predictions: Will lobbying polarize by party?
Goals Tactics
Inside Inside/Outside
Particularistic (1) No (2) No
Collective (3) Possible (4) Likely
Cell (1) represents the majority of groups that are trying to influence the form of legislation.
These groups are likely to pursue a subsidy approach, and use their resources in the hope of
producing favorable legislation. Cell (2) features groups pursuing particularistic goals while
using outside lobbying techniques. This may seem to be paradoxical, but Drutman (2015)
17
reports on a growing number of firms that try to shape the “intellectual environment” of
Washington by writing op-eds and white papers and funding think tanks to fight the war
of ideas (l. 515)5. But even if this lobbying “works” it would not affect party voting unless
aligned with one party.
Cell (3) discusses firms attempting to do collective lobbying only using inside tactics. This
is usually the domain of party leaders. Earlier, I discussed reasons groups would choose
this route, such as groups having more resources to dedicate to this specific issue or because
they want to set a precedent for subsequent venues. It is collective lobbying, so if successful,
will lead to polarization. In cell (4), where groups have outside tactics, the likelihood of
collective lobbying working increases as these groups are more likely to affect legislator
positions. This type of lobbying is most likely to result in party voting.
In Chapter 4, I will map groups that lobby by their observable characteristics to Table 1.
Advocacy organizations are most likely to successfully collectively lobby, so I predict that
their lobbying with result in party polarization. Business groups are more likely to use
particularistic lobbying, so I predict their activity will have a moderating effect.
5My citations with “p.” refer to page numbers, citations with “l.” refer to location numbers in AmazonKindle ebook editions.
18

CHAPTER 3 : Do groups set the agenda?
In 2012 Trayvon Martin, an unarmed teenager, was shot and killed by a private citizen in
Florida. There was later national outrage after his shooter was acquitted under Florida’s
“Stand your ground” law. Attention to this law focused on the American Legislative Ex-
change Council (ALEC), a group dedicated to serving conservative principles. For many
years ALEC had promoted “model” bills that aided legislators to establish to pass legis-
lation in the general domain of commerce and regulatory policy. But in recent years, it’s
portfolio expanded to many other topics (Garrett and Jansa, 2015; Hertel-Fernandez, 2014).
This lead to speculation that interest groups were setting the agenda in state legislatures; a
former Wisconsin state legislator told the Washington Post ALEC is like “ a dating service,
only between legislators and special interests.”1
But beyond instances where a group like ALEC is clearly setting the agenda with a pre-
written bill, this chapter asks if groups are systematically setting the agenda. This chapter
first specifies the argument about the difference between citizen and advocacy group influ-
ence over the agenda through lobbying introduced in Chapter 2. This theory balances the
tendency of business groups to engage in negative agenda control, or keep issues relating to
their industry off the agenda, with the desire of reform minded advocacy organizations to
engage in positive agenda control by introducing new items onto the legislative agenda.
It then uses two original datasets to investigate these dynamics over 10 years in all 50 states.
It finds a strong cross-sectional relationship within a session between the number of bills
introduced that address a policy area and the number of groups registered to lobby from
that industry, in line with previous results in the literature (Lowery et al., 2004; Gray et al.,
2014). However, looking over time, more groups are not necessarily related to more bills
because of the competing pressures of positive legislative agenda promotion and negative
blocking.
1“ALEC stands its ground” 4 Dec 2013 https://www.washingtonpost.com/opinions/
dana-milbank-alec-stands-its-ground/2013/12/04/ad593320-5d2c-11e3-bc56-c6ca94801fac_story.
html
19

A number of studies on interest groups have found that the number of their lobbyists
associate with the number of bills introduced and enacted in state legislatures (Gray and
Lowery, 1995), but this literature has been unable to resolve if groups set the agenda or if
legislators set an agenda that later attracts interest group lobbying activity. Lowery et al.
(2004) test if the number of bills in a policy sector lag, lead or are contemporaneous to the
size of the interest group community. They mostly find a contemporaneous effect, where
interest group lobbying registrations are in the same session as bill introductions. However,
due to data limitations, it is unable to detect sequential ordering.
To argue that lobbying registrations precede bill introductions, I theorize about two key
relationships. The first is the elasticity of the supply of interest groups from session to
session. I argue that significant start up costs (Drutman, 2015) makes the supply of interest
groups more inelastic than the supply of bills from session to session. Therefore, groups are
more likely to set the agenda than the agenda is likely to shape the interest group community.
When legislatures turn over, legislators can switch committees and new members are sworn
in, but well-established interests maintain and are able to oversee the introduction of bills.
A factor moderating this relationship is the policy capacity of the legislature. In order for
the lobbying subsidy of groups to be valuable to legislators it needs to exceed the capacity
of a legislator’s own staff. This is more demanding in professionalized legislators making
the start up costs higher, which affects the elasticity of the two groups.
A direct test on the reciprocal relationship between lobbying and legislation requires sequen-
tial observations. The data I have collected for this chapter allows for a Granger causality
test. A Granger test uses previous observations of two endogenous variables to predict
future values of those variables. A variable is said to Granger cause a second variable if
including the first variable in a forecast of the second variable, based on its own history,
improves that forecast. A favorable feature of a Granger test is that it produces a two-sided
result, so it can highlight both negative blocking or positive agenda promotion. I find that
in both the U.S. Congress and in state legislatures that the number of groups Granger
20

causes the number of bills that introduced in that following session, but not the inverse
relationship.
The states also offer useful variation to observe the hypothesized impact of professionaliza-
tion. State legislatures vary widely between “citizen legislatures” like New Hampshire and
the California state legislature, which has full-time legislators with large staffs that resem-
bles the U.S. Congress. I find that in states with lower professionalism, groups are able to
helicopter in; such that I find a stronger contemporaneous relationship between groups and
the agenda in low-professionalism states. In more professionalized states, I find that prior
lobbying, as observed in the number of groups registered to lobby in the previous session,
has a stronger association with the number of bills proposed in that session.
3.1. How groups set the agenda
As discussed in Chapter 2, lobbying presents an opportunity for interest groups to affect
issues governments choose to address. Groups may be looking for government to promote
new issues, or it may be looking for government to maintain the status quo in its policy
area.
Regardless of the type of agenda-setting an interest group is engaged in, it must have a seat
at the table. Within a single legislative session, these two functions will be observationally
equivalent. Therefore, policy areas with more legislative activity should have more lobbying
registrations, either because a legislator has introduced a bill that the group is looking to
address or because a group has successfully lobbied to have its issue added to the agenda.
Hypothesis 3.1: Policy areas with larger interest organization lobbying will occupy more of
the agenda.
This chapter’s first hypothesis does not address the simultaneity concern with the agenda
and size of the lobbying community. In the Gray and Lowery (1995) Energy-Stability-Area
model that comprehensively explains interest group density, government attention provides
21

the energy that drives the size of the interest group community. Lowery et al. (2004)
classify the three sequential orderings for group and legislative activity. They first propose
a contemporaneous effect, where groups and legislators both react to real-world events, as
in Kingdon’s problems stream dominates. Or as Truman (1951) wrote, “disturbances in
society” spur both group and legislative activity.
The second pathway is that changes in the agenda lead the interest group community. For
example, Lowery, Gray, and Fellowes (2005) outline the “Fetcher” bill hypothesis, where
a legislator files a bill that affects the business of members of an industry, and effectively
extorts them into contributing to his campaign. This study reports little evidence of it being
widespread in practice. Mitchell and Munger (1991) do discuss how rent-seeking behavior
such as the fetcher bill hypothesis could serve as a motivation for regulation of utilities or
other industries.
Finally, there is a situation where the agenda lags group activity, and groups are setting the
agenda. Evidence for this theory can be traced to instances where model bills produced by
groups were enacted into law, as Hertel-Fernandez (2014) found with ALEC, or Garrett and
Jansa (2015) found with abortion legislation written by Americans United for Life. However,
Lowery et al. (2004) find little systematic evidence that lobbying registrations predate the
agenda. They do find that the contemporaneous effect is most powerful. But, beyond a
contemporaneous effect, what drives the relationship between the number of groups and
the agenda?
The sequential ordering of bills and groups will be determined by the elasticity of the two
quantities. Elasticity measures how responsive one quantity is to another. For example, if
the supply of bills on a policy topic were perfectly inelastic compared to groups they would
not change from legislative session to legislative, no matter how many groups register to
lobby.
The costs associated with lobbying, however, imply that the supply of groups lobbying is
22

inelastic compared to the agenda. Groups face two costs: start up costs and a marginal cost
of providing the subsidy to a legislator. In his study of business lobbyists before Congress,
Drutman found company-level lobbying from year to year is very consistent, and the best
predictor of current lobbying is lagged observations of lobbying. In other words “once
companies invest in Washington, they rarely leave” (2015, l. 4149). As a result, there are
high fixed costs associated with establishing a lobbying presence.
The obstacle that limits legislators is scarcity of attention and space on the agenda. They
can save some policy cost by just re-introducing a bill that had been on a previous session’s
agenda, or in another state; but generally their costs have to little to do with previous
action. Therefore, they are less likely to be influenced by their prior decisions. While
Baumgartner and Jones (1993) report that agendas are sticky over time, it could be due to
the stability in the group community, or the events/economy of the time.
Hypothesis 3.2: Interest groups set the agenda more than the agenda drives interest group
community.
This chapter’s second hypothesis is conditioned by the start-up costs that groups face. If
groups are able to helicopter into a legislative venue when there is demand for their services,
then they are less likely to pay the costs associated with maintaining a lobbying presence
session over session.
These start-up costs vary across the states. While the registration and reporting laws them-
selves are different (Newmark, 2005), the more relevant variation is how much information
the lobbyist needs to present to a legislator for it to be a valuable “subsidy”. On this ac-
count, the states vary in how professionalized they are, as measured by the number of days
their legislatures meet, how many staff they have, and the amount of compensation legis-
lators receive (Bowen and Greene, 2014). In states with less professionalized legislatures,
individual legislators have less policy capacity at their disposal, which may make them more
reliant on the policy subsidy provided by groups. For example, Hertel-Fernandez (2014)
23

found that legislators with lower policy capacity were more prone to introducing ALEC’s
model bills. This affects the registration calculus of interest groups. In states with higher
policy capacity, lobbyists need to be more sophisticated, by having more experience or re-
search to influence the agenda. So once this expertise has been established, it makes sense
to maintain that presence like the groups before Congress do.
Therefore, states with lower policy capacity should be less prone to the bill lagging groups
hypothesis.
Hypothesis 3.3: Lagged groups should be more influential over the agenda in highly
professionalized states.
3.1.1. Measurement and Methods
Despite the expansive literature on both interest groups and agenda setting, the hypothesis
in the theory section has not been directly addressed in the context of American state
legislatures for two reasons: a lack of data availability and measurement issues.2
In terms of data, Virginia Gray, David Lowery and their coauthors have filled the pages
of several journals with questions regarding interest group density. These studies are built
on a series of cross-sectional snapshots of the interest group communities in 50 states by
industry, which were hand-coded by research assistants. The decade-long gap in between
these cross-sections does not provide enough precision to observe changes from one session
to the next. Since the 1995 Lobbying Disclosure Act the availability of interest group
registrations has improved. As versions of this law have been implemented in the states,
registration lists of lobbying organizations have become available since about 2005. The
National Institute for Money in State Politics (hereafter the Institute) has collected these
registrations from all the states. While these data are are freely available to the public
at http://followthemoney.org, the Institute only codes a minority of these groups by
industry.
2See Appendix Chapter A for detailed descriptions on the data collection and processing for this chapter.
24
Independent Variable: Interest Group Registrations
The National Institute for Money in State Politics conducts an annual census of the interest
groups and firms registered to lobby in all 50 states;3 however, the groups in these data are
not coded by subject. In Appendix Chapter A, I discuss an automated text classification
method that I employed to estimate the industry of each interest group, which I layered
over the data from the Institute. Traditional text classification relies on human coders.
The innovation of my method is to use detailed lobbying registrations filed in the U.S.
Congress, Colorado, Pennsylvania and Massachusetts to train my method to effectively
code each group to one of the 15 sectors used in similar studies by Lowery et al. (2004)
and Baumgartner, Gray, and Lowery (2009). I describe the mechanics of this procedure at
length, and conduct a number of validation exercises in Appendix Chapter A.
There is variation in the detail that states report the activity of lobbying. The Institute
reports group registrations by state and year. It does not report the frequency of lobbying
activity within a year, or if that lobbying was targeted at the upper or lower chamber in a
state. Therefore, I aggregate group registrations by two-year legislative sessions. However,
groups are only coded once. For example if the Massachusetts Nurses Association reports
lobbying the Massachusetts House of Representatives in 2011 and the Massachusetts Senate
in 2012, it is only coded once for the Massachusetts (2011-2012) legislative period. Not all
states hold two-year sessions, but following Gray and Lowery (1995) aggregating the data
in this way balances the panel.
Dependent Variable: Bill Introductions
Systematically comparing the agendas of the fifty states is a challenge as no independent
agency has coded the entirety of the legislation of the 99 state legislative chambers. To
create such a measure, I expand on an approach using LexisNexis described elsewhere
(Lowery et al., 2004; Lowery, Gray, and Fellowes, 2005; Baumgartner, Gray, and Lowery,
3Available at followthemoney.org.
25

2009). This approach uses a list of keywords for 154 policy areas that are used as search5
terms in the synopsis6 section of the State Capital Universe “Bill Tracking” search function.
For each bill that fits the search parameters, LexisNexis returns a citation that includes
a bill type (“Senate Bill”, “House Bill” or “Assembly Bill”), bill number, and session of
introduction. A limitation to this approach is that LexisNexis may return multiple versions
of bills over time, so this dataset can only deduce that an introduced bill applies to a certain
topic area, but not how far it went in the legislative process, or if it was enacted. Bills may
be coded under multiple topics if includes multiple key words in its synopsis.
To combine these two datasets, I match the interest group registrations aggregated by two-
year sessions to the number of bills in that sector from the regular sessions in the time
period. Since I am unable to differentiate lobbying in upper chambers from lobbying in
lower chambers, I sum the agendas of lower and upper chambers together. Figure 1 shows
the levels and change over time in the average number of groups lobbying in each policy
area and the number of bills introduced in those policy areas.
Descriptive Statistics
Figure 1 shows the average number of bills and groups in each legislative session for the
15 policy areas. A number of the policy areas show that the relationship between bills
and groups is not monotonic. In fact, it is common for the number of bills introduced
to decrease as the number of interest groups registered to lobby increases over time. For
example, as the number of health groups increase, the number of bills decreases during this
sample period. This relationship being negative at times has support in the literature. Gray
4I use the 14 policies that Baumgartner, Gray, and Lowery (2009) use, and introduce a term for single-issue policies like abortion, gun control and women’s issues. Table 17 in Appendix A has a full list of thecoding terms.
5A limitation to the LexisNexis search function is that it is not capable to limiting bills to the sessionwhen they were introduced. Therefore, I can only examine bill introductions at this point
6Searches can also be conducted based on LexisNexis’ proprietary “subject” headings. However, the lackof transparency of this terms, and their unreliability across and within states precludes their use. Whilethere may be inconsistent lengths of bill synopses across states, it does not appear that there is problematicvariation within states over time. This procedure is also described in Appendix Chapter A.
26
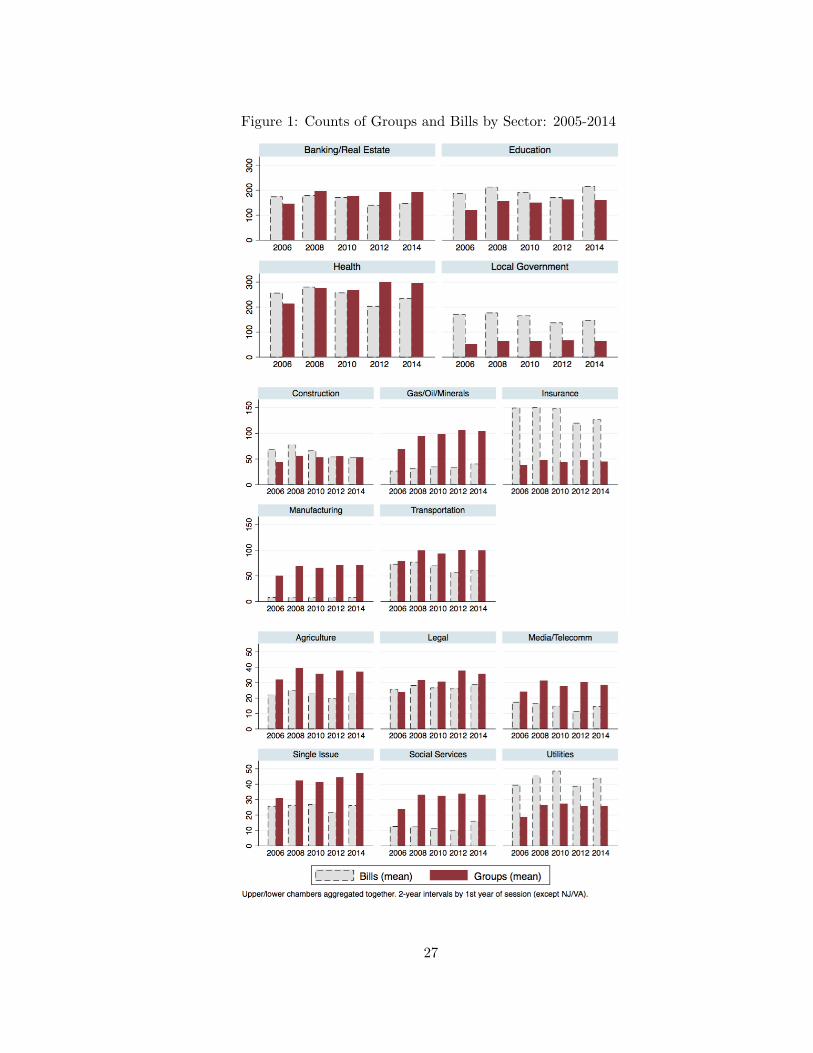
Figure 1: Counts of Groups and Bills by Sector: 2005-2014
27
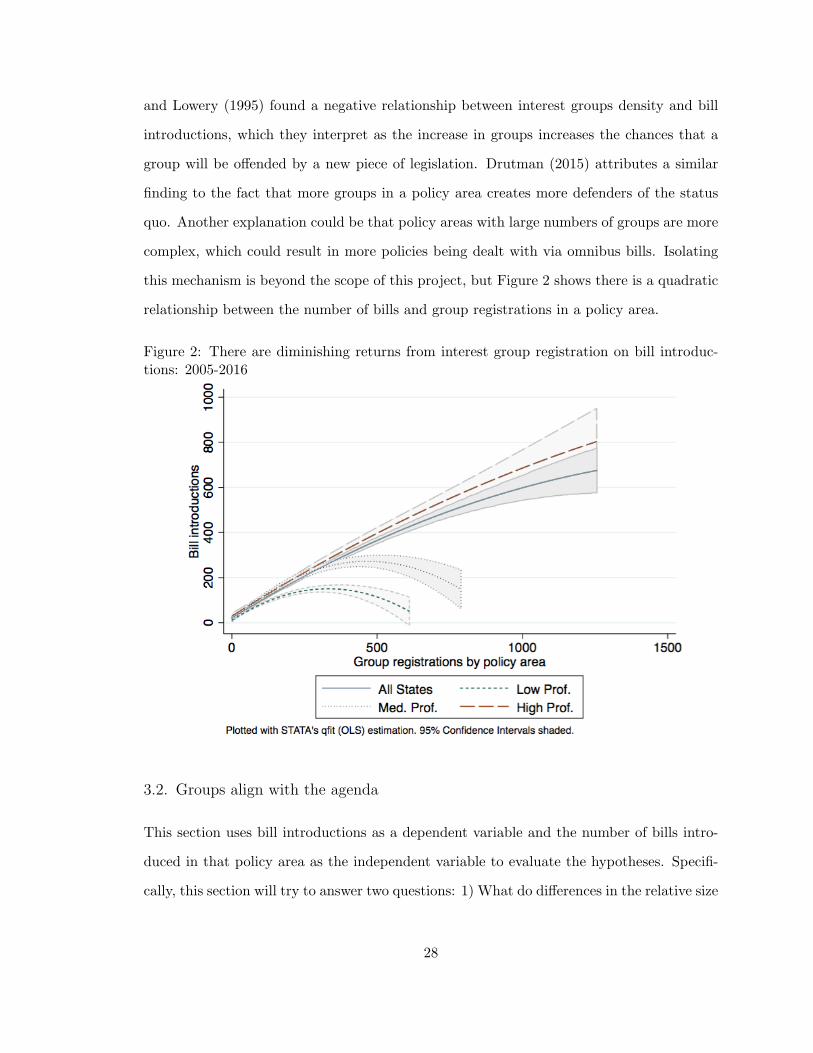
and Lowery (1995) found a negative relationship between interest groups density and bill
introductions, which they interpret as the increase in groups increases the chances that a
group will be offended by a new piece of legislation. Drutman (2015) attributes a similar
finding to the fact that more groups in a policy area creates more defenders of the status
quo. Another explanation could be that policy areas with large numbers of groups are more
complex, which could result in more policies being dealt with via omnibus bills. Isolating
this mechanism is beyond the scope of this project, but Figure 2 shows there is a quadratic
relationship between the number of bills and group registrations in a policy area.
Figure 2: There are diminishing returns from interest group registration on bill introduc-tions: 2005-2016
3.2. Groups align with the agenda
This section uses bill introductions as a dependent variable and the number of bills intro-
duced in that policy area as the independent variable to evaluate the hypotheses. Specifi-
cally, this section will try to answer two questions: 1) What do differences in the relative size
28

of the interest group communities do to the agenda? 2) Does an additional group lobbying
affect the number of bills that are introduced in that policy area?
First, I will use the five cross-sections to evaluate the relationship between the size of
the interest group community and the number of bills on the agenda. This model will
have indicators for the different time periods in this data, but does not impose any more
structure in the data. I use a logarithmic transformation of the number of bills and groups,
in order to address the diminishing marginal returns to lobbying in the previous section.
I also control for differences in the relative size of the lobbying community, for example,
California’s health sector is likely to be larger than Rhode Island’s, by controlling for the
lagged observation of the lobbying community in that state.
In order to determine the effect of an additional group registering to lobby, I use fixed effects
to leverage the panel structure of the data. The models specified with fixed effects allow
the intercept to vary for each policy area in each state. This model detects the marginal
changes in the group population and agenda, and accounts for differences in the levels of
group and legislative activity.
The equation is as follows:
Billsp,s,t = αp,s,t + β1Groupsp,s,t + β2Groupsp,s,t−1 + β3Professionalizations
+β4Prof.XGroupsp,s,t + β5Prof.XGroupsp,s,t−1 + µi,s,t
(3.1)
where p is one of 15 policy areas, s is one of the fifty states, t is one of five temporal
periods. The α is a combination of temporal, policy and state level fixed effects for the 750
state/policy groups that are used in different specifications. For professionalization, I use
a single estimate of each state’s professionalization scores from Bowen and Greene (2014),
which uses legislative session days, legislator compensation, and expenditures per legislator
in a factor analysis to produce estimates of each legislature’s professionalization. Due to
29
missing data concerns (the estimates do not go until the end of the period under study and
have missing observations within their period of study), I collapse their measure to a single
estimate per state. In later models I use an interaction between professionalization and
the number of groups. Because professionalization is fixed within states, its main effect is
collinear in models with state fixed effects.
Results
Table 2 includes both the contemporaneous and a lagged observation of the logged number
of groups in 15 different policy areas in each state. Column (2) shows that with both of
these measures, the number of groups in a policy area positively associates with the number
of bills in that policy area. This allows me to reject a null hypothesis of no effect between
the size of the interest group community and the agenda discussed in the first prediction.
Column (3) of this table includes an interaction between these two measures of the interest
group community with professionalization. Of note, there is a negative interaction effect
between professionalization and the contemporaneous observation of groups, while there
is a positive interaction between groups in the previous period and professionalization.
These coefficients are consistent with the logic of the third hypothesis that a lack of policy
capacity will encourage groups to helicopter in to a legislative venue and affect the agenda.
The positive interaction between professionalization in the lagged period suggests that in
high capacity states, groups establish and maintain operations, which makes them more
likely to influence subsequent agendas. It seems that in these highly professionalized states,
groups precede the agenda.
However, this relationship could be driven by variables not within this parsimonious model;
such as the size of the economy in each sector7, alignment of the parties in government or
real world events. As a result, in columns (4-6) and (7-9) I employ a large number of fixed
effects so that the models are measuring changes within a policy area in a single state.
7Including sector GSP and its squared value per the specification in Gray and Lowery (1995) does notchange the result.
30

Table 2: Lobbying organizations are associated with bills introduced in the states: 2007-14
DV: Bills (log)(1) (2) (3) (4) (5) (6)
Fixed Effects: Session Session/Policy/State
Groups 0.41∗∗ 0.38∗∗ 0.11 0.11(0.07) (0.06) (0.07) (0.07)
Groups (T-1) 0.71∗∗ 0.34∗∗ 0.37∗∗ -0.00 -0.01 0.00(0.05) (0.05) (0.05) (0.04) (0.04) (0.04)
Professionalization 0.07∗ 0.06 0.11(0.04) (0.04) (0.12)
Prof. X Groups -0.10∗∗ -0.04(0.04) (0.03)
Prof X Groups (T-1) 0.09∗∗ 0.02(0.04) (0.03)
Constant 0.82∗∗ 0.62∗∗ 0.60∗∗ 3.55∗∗ 3.15∗∗ 3.12∗∗
(0.23) (0.24) (0.24) (0.16) (0.21) (0.22)
Observations 3000 3000 3000 3000 3000 3000No. of Fixed Effects 4 4 4 754 754 754
Notes: The number of groups are logged.
Robust standard errors, clustered by state, in parentheses.∗ p < 0.10, ∗∗ p < 0.05
31

Column (5) shows that in terms of the coefficients for groups and lagged groups, including
temporal and policy/state fixed effects makes the coefficient statistically indistinguishable
from zero. If groups were only engaging in positive agenda promotion, this coefficient would
be positive. If groups were only engaging in negative blocking this coefficient would be zero.
The lack of clear effect in these results could suggest that both of these dynamics are at
play.
In columns (1) and (4), the model is run without the contemporaneous observation of groups.
There is a positive relationship in column (1), but the relationship is indistinguishable from
zero in column (4). This result suggests that with the fixed effects, lagged lobbying does not
have a direct impact on the number of bills that are being introduced but rather that the
effect of lagged lobbying is mediated by the number of bills introduced in the contemporary
period. Figure 3 shows the proposed relationship that these findings provide evidence for.8
Figure 3: Proposed mediation pathway
3.3. Which comes first: the agenda or the groups?
This paper utilizes a Granger (1969) causality test to address the sequencing of group
registrations and bill introductions previously investigated by Lowery et al. (2004). In a
time-series, bivariate framework, one variable is said to Granger cause a second variable if
including the lagged values of the first variable improves a forecast of the second variable
that is built using its lagged values. In other words, does the history of the first variable help
8Running the Zhao, Lynch, and Chen (2010) version of a Sobel mediation test, shows that it is a com-plimentary mediation. The a*b pathway is significant and 0.59 of the direct effect of lagged lobbying oncontemporary bills is mediated.
32

Table 3: Levin, Lin, and Chu (2002): Unit Root Test
Test Test statistics p
States Bills 54.5 1.0
Groups 141.4 1.0
Congress Bills -0.72 0.23
Groups -0.67 0.25
H0: All panels contain unit roots, Ha: Some panels are stationary.
predict the values of the second? An advantage of a Granger test is that it can also test the
inverse relationship. A second advantage is that it can identify the two-sided relationship
that the previous model was unable to properly observe.
The dataset being used for this test has many cross-sections, but very few time periods, so it
actually resembles panel data more than a traditional time-series cross-sectional framework.
Dumitrescu and Hurlin (2012) adapt the Granger framework for this situation, and can even
increase the efficiency of the test by using both the variation across cases, as well as over-
time variation within the cases to increase the degrees of freedom (Hoffmann et al., 2005).
The first task is conducting a unit root test to determine if the data is stationary. This
dataset has 750 panels and 5 periods. Table 3 shows that it is not possible to rule out that
either time series has a unit root, or may be non-stationary. The Congress data has more
time periods, but has similar unit-root concerns. However, Herrerias, Joyeux, and Girardin
(2013) note in their study with a similar 10 year dataset, that this test is unreliable with
such a short time series. But to quell this concern they run the model with differences
instead of levels (counts). I follow their lead and use the logarithm (plus one, to account
for policy areas without any bills or groups) for both quantities.
The equation for the Granger test in the states is as follows. For each policy p,
yp,s,t = αp,s +
K∑k=1
γ(k)p,s yi,t−k +
K∑k=1
β(k)p,sxi,t−k + εp,s,t (3.2)
33

where s is the state, t is the number of time periods, in this case five. K is the number of
lags, and α are fixed effects. This model is run for restricted and unrestricted versions. In
the restricted version, values of β are held equal to zero. The unrestricted version has no
such constraints. The Wald test to determine the Granger causality is:9
F1 =(RSS2 −RSS1)/Np
RSS1/[NT −N(1 + p)− p](3.3)
Results
The first row of Table 4 shows that in Congress, groups Granger cause the logged number
of bills at a conventional level of significance, but not the inverse. The third row shows
the same result with the 50 states pooled together with a one-year lag. The results are
not as strong in either direction using a two-year lag. This results imply that changes in
the number of groups registered to lobby in a given sector: say insurance companies in
Indiana, will affect the number of bills introduced in the following session. However, more
bills being introduced in the current session may affect how many groups register in that
current session, it will not affect how many groups register in the following session.
9Dumitrescu and Hurlin (2012) note that an F-test of the key coefficient being equal to zero is functionallyequivalent, which I use in practice.
34

Table 4: Do bills cause groups or do groups cause bills?
Groups → Bills Bills → Groups
Venue Years Lags F-stat p-value F-stat p-value
U.S. Congress 1999-2014 1 3.05 (0.08)* 0.39 (0.53)2 1.59 (0.21) 0.36 (0.55)
States 2007-2014 1 4.58 (0.03)** 2.13 (0.15)2 2.68 (0.10) 0.66 (0.42)
Policy/state fixed effects. P-values in parentheses.
** p < 0.05, * p < 0.10
Table 5: Where do groups set the agenda? 2007-2014
Groups → Bills Bills → Groups
Venue Lags F-stat p-value F-stat p-value
Low 1 2.55 (0.11) 4.51 (0.03)*2 0.04 (0.85) 0.04 (0.85)
Medium 1 2.47 (0.11) 2.37 (0.13)2 15.36 (0.00)* 1.50 (0.22)
High 1 0.36 (0.55) 0.01 (0.99)2 2.03 (0.16) 0.15 (0.70)
Policy/state fixed effects. P-values in parentheses.
* p < 0.05
Hood, Kidd, and Morris (2008) note another advantage of this approach in panel data is
being able to examine heterogeneous effects between the panels. In Table 5, the Granger
test is run for states broken into three groups by their professionalization: there are 16
states in the low category10, 17 states in medium11, and 17 states in the highest category.12
Conducting the test in this fashion provides an opportunity to revisit the chapter’s third
hypothesis. It shows that in the states with low-professionalization, bills are able to Granger
cause the number of group registrations. This is in line with the hypothesized mechanism
that group registration behavior is more inelastic in states with higher policy capacity.
10Low: AL, AR, GA, ID, KS, KY, ME, MT, ND, NH, NM, SD, UT, VT, WV, WY.11Med: CT, DE, IA, IN, LA, MN, MS, NC, NE, NV, OK, OR, RI, SC, TN, TX, VA.12High: AK, AZ, CA, CO, FL, HI, IL, MA, MD, MI, MO, NJ, NY, OH, PA, WA, WI.
35
3.4. Discussion and implications
This chapter argues that interest group lobbying can set the agenda in state legislatures.
It argues that different groups have different goals for the agenda. Citizen-based advocacy
organizations are more likely to positively promote bills to be put on the legislative agenda.
Businesses are more likely to engage in negative blocking in order to reduce government
activity in their markets. In order to perform either of these functions, groups need to have
a seat at the table, so it proposes that the size of the a policy area’s lobbying community
should be associated with the size of the agenda.
The results are generally consistent with this argument. The number of bill introductions
in a policy area are positively associated with the number of groups registered to lobby in
that policy area, even when controlling for the number of groups lobbying in the previous
session.
This chapter also addresses how groups set the agenda over time. It argues that this rela-
tionship will be governed by the elasticity between a group’s decision to lobby and legislators
decisions to introduce bills. Specifically, a group’s decision to launch a lobbying operation is
costly, especially in more professionalized states where legislators have more staff resources
available and do not need to rely on outside aide from lobbyists. Therefore, the association
between groups and the agenda should be moderated by the professionalization of the state
legislatures. Consistent with this intuition, there is a negative interaction effect between
professionalization and current lobbying, such that there is a stronger relationship between
lobbying and the agenda in less professionalized states. However, there is a positive inter-
action between lagged lobbying and polarization, which means that current lobbying affects
the future agenda more in professionalized states that have more policy capacity and the
supply of groups is more inelastic.
This chapter also leverages the time series feature of the data to directly assess if groups
registrations lead the agenda, or if group registrations lag the agenda. Since the supply of
36
groups is inelastic compared to the supply of legislation, I predict the agenda will lag group
registration. I also predict this effect will be more pronounced in states with a higher policy
capacity.
In both the U.S. Congress, and in all 50 state legislatures, I find that group registrations
Granger cause bill introductions, but not the inverse relationship. Breaking the results out
by the professionalization demonstrates these dynamics in detail. There is evidence that
the stickiness of group registration drives this relationship. Groups are most likely to be
Granger caused by bills in the states with low professionalization, where policy capacity is
presumably the lowest.
These results reinforce the findings of a contemporaneous relationship between groups and
the agenda found in Lowery et al. (2004). However, these results call for attention to the
process proposed in Gray et al. (2014) where “Organized interests are more commonly
drawn to legislatures by the attention they pay to policies under consideration, not the
reverse. Policy agendas are not so much generated by interest organizations; instead, interest
organizations respond to policy agendas” (p. 3).
My argument is consistent with the notion that some lobbying activity is responding to the
agenda that has been introduced. However, my argument also suggests that some groups
are actively trying to shape the agenda. A priority for future work will be to disaggregate
groups further, so that their behavior can be observed more precisely.
It is possible that the practice of lobbying is changing on this point. Gray et al. support
their position with findings from Leech et al. (2005) and Dusso (2008) that Congressional
policy activity had drawn interest groups to Washington in the late 1990s. This is the
early end of the period of Congress that I study. Drutman quotes a lobbyist this period
preceded an important shift, the lobbyist said: “Sometime after 2000, I think there was a
real realization that the industry needed to be more accessible, more open, and more willing
to talk to government and not look at them as a combatant” (2015, l. 1198).
37

Parsing differences in the results of different types of models tested on different datasets
may seem pedantic. However, these results affect how we think about the interaction of
private interests with government. Gray et al. (2014) report that a student asked one of
the authors: “If party polarization is increasing, is there still room for interest groups to
be influential?” (2). This question demonstrates the consequences of assuming that groups
just follow bills, because that assumption writes them out of the story. The evidence in this
dissertation shows that groups are anything but an afterthought in this polarized age.
38

CHAPTER 4 : When does lobbying polarize roll-call votes?
There is a striking relationship between the growth of lobbying and party polarization in the
U.S. Congress. Since 1999, the gross amount of lobbying expenditures has a 0.89 correlation
with ideal point estimates of polarization.1 However, this relationship is puzzling because
research on lobbying suggests it should be a moderating force, as groups will work to build
bipartisan coalitions to pass their policies (Grossmann and Dominguez, 2009; Baumgartner
et al., 2009). One reason this literature has come to this conclusion is that it has observed
that the vast majority of lobbying comes from businesses, and focuses its attention there.
This paper argues that it is essential to disaggregate lobbyists by the type of group they
represent. In particular, I emphasize the increasingly prevalent lobbying from citizen-based
advocacy organizations, like the Sierra Club or National Rifle Association.
In Chapter 2, I argued that advocacy groups have different goals and use different lobbying
tactics than businesses. These citizen-based groups pursue broad-based policy programs,
while firms pursue more particularistic policies that affect their business. In the context
of legislative debate and roll-call voting, advocacy organizations take two steps to pursue
this goal. They use “outside” lobbying tactics to shape public opinion and mobilize their
members for elections (Kollman, 1998). They also attempt to add their issue to a party’s
long coalition, effectively replicating a party’s whipping operation, which I call collective
lobbying. Since these groups have increasingly aligned with one of the two major parties
(Koger, Masket, and Noel, 2009), I predict it will push legislators to party lines on roll-call
votes.
To test this theory, I construct an original dataset of the groups lobbying each bill in the
U.S. Congress, and the Colorado and Ohio legislatures. At both the federal and state
level, I find there is more party difference, where each party is unified against the other, on
bills lobbied by a greater number of advocacy organizations. My point estimates indicate
that holding all other factors equal, an average vote on a bill lobbied by 10 advocacy
1As measured by DW-NOMINATE’s distance in party medians (Poole and Rosenthal, 2000).
39
organizations has about seven or eight percent more party difference than a bill without
any advocacy lobbying. That is about the same difference as the difference between votes on
an agriculture bill and a civil rights bill in Congress, two policy areas commonly understood
to have different partisan contexts.
The results also indicate that business lobbying usually has a moderating effect, in that
it results in more bipartisan roll-call voting. This is consistent with my argument that
lobbyists for firms pursue concentrated benefits for their business. Public sector lobbying
from universities or state and local governments is even more moderating.
There are a number of challenges to identifying the partisan effects of lobbying in Congress.
This chapter use the institutional variation in the states to address these concerns. First,
Baumgartner et al. (2009) argue that party voting is a fait accompli as party leaders restrict
the agenda to partisan bills, especially in the U.S. House. Only about three percent of bills
that are proposed in Congress receive a passage vote, so it is very consequential which bills
leadership brings to the floor. My approach to this issue is to use Colorado as a counter
factual legislature without this agenda control. In 1988, Colorado passed GAVEL which
grants every bill “consideration and a vote” such that 80 percent of bills receive passage
votes. The impact of advocacy lobbying is strikingly similar to Colorado, which implies
that this effect is not driven by the selection process.
A second concern is that there is more lobbying on bills that are more partisan to begin with.
I account for the ex ante partisanship of a bill by controlling for the ideology of the bill’s
sponsors and using policy area fixed effects in Congress, which means that I am observing
how much party difference there is on a health care bill compared to other health care bills.
Baumgartner et al. also suggest that lobbyists are attracted to salient bills, since partisan
bills tend to be more salient. Again, I use data from the states to show that salience is not
a necessary condition for this relationship. In Colorado, advocacy organization lobbying
leads to polarization even on bills that were not mentioned a single time in the Denver
Post. Considering how little attention citizens pay to state politics, that is a very low bar
40

to consider legislation salient.
However, a simultaneity concern is difficult to entirely rule out. Therefore, I leverage the
two-state structure and a database of bills with identical text passages2 to match bills across
the states and conduct a placebo test. Since the content of bills with identical passages can
be assumed to be similar across the two states, their partisanship or importance can be held
constant. On these bills, I test to see if roll-call voting in Colorado is affected by lobbying in
Ohio, which it should not be. Consistent with my expectations, I find that only the actual
lobbying in Colorado is associated with roll-call polarization in Colorado, and there is no
relationship with the placebo Ohio lobbying (and vice-versa).
This chapter concludes with implications of these results, both for researchers and for
politics more generally.
4.1. Two types of lobbying
Lobbying is the transmission of information to legislators or their staff in private settings
(De Figueiredo and Richter, 2014). The privacy of these meetings, has long made it dif-
ficult for researchers to discern exactly what lobbyists are doing. Chapter 2 argued that
lobbyists usually engage in one of two types of practice, based on the goals that lobbyists
pursue. It defines groups that are pursuing concentrated benefits as engaging in particu-
larized lobbying. These groups are often looking to mobilize legislators that already agree
with them.
The second type of lobbying is collective lobbying, where legislators are concerned with
stopping or passing legislation. This model of lobbying requires lobbyists to either mobilize
legislators that agree with them who have weak preferences, or to persuade undecided
legislators.
Collective lobbying is effectively trying to overcome what Aldrich (1995) calls the Problem
of Collective Policymaking. Aldrich’s solution to this issue is to form a long coalition a
2From the University of Chicago’s Legislative Influence Detector.
41

legislator offers support for issues he is indifferent about in exchange for the caucus’ support
for his pet project. It is easier to build one of these coalitions within a single major party.
As a result, collective lobbying resembles a party whipping operation.
Party leaders in a chamber have usually carried out this function, in part because they are
well equipped to instill discipline. However, there are at least two scenarios when groups
would need to replace this party whipping operation. First, they may want to append a
new issue to the party’s platform. Second, they care about the policy outcome in practice,
and not just the outcome of a single chamber, so they may want to organize a protest vote
or position for later on.
Table 1 in Chapter 2 specified this theory to predict that collective lobbying will result
in polarized roll-call voting and that groups that engage in outside lobbying will be more
effective in reaching this goal. Unfortunately, groups do not report their goals and tactics.
Therefore it is necessary to map the predictions from Table 1 on to observable characteristics
of lobbying groups.
4.1.1. Differentiating groups that lobby
Advocacy Organizations
Advocacy organizations go by different names in the literature. This dissertation defines
them conceptually in line with Skocpol’s term for public interest organizations, which are
“nonprofit organizations that aim to further their value-laden understandings of the public
good” (Skocpol, 2004, p. 3). Berry (1999) offers a more technical definition, calling them
citizen groups which are “lobbying organizations that mobilize members, donors, or activists
around interests other than their vocation or profession.”3 Berry’s definition highlights that
these groups specialize in both inside and outside tactics (Walker, 1991).
Advocacy organizations are likely to engage in collective lobbying for two reasons. First, the
3Elsewhere they are coded as single-issue (Bonica, 2013) or ideological groups (Ansolabehere, Snyder,and Tripathi, 2002).
42

issues these groups pursue are broad in nature. Documenting the rise of citizen groups in the
1990s, Berry (1999) reported that they coalesced around post-material issues: equality and
citizen rights, family values, the environment, consumer protection and good government.
While the balance of these issues are traditionally liberal, citizen groups are active on both
sides of the contemporary ideological divide (Grossmann and Hopkins, 2015). For example,
the Tea Party’s rise in 2009 and 2010 showed the power of conservative citizen activism,
which resulted in the capture of a number of congressional seats (Williamson, Skocpol, and
Coggin, 2011). As a result, the policies these groups pursue almost never fit Wilson’s (1989)
definition of “client politics” that have dispersed costs and concentrated benefits. In the
case of advocacy organizations, the benefits are usually dispersed, while the costs may or
may not be concentrated. These groups are also the prototypical outside lobbyists.
Business Interests
The majority of lobbyists before Congress and state legislatures represent business interests.
However, Kim, Urpelainen, and Yang (2016) note a decision an individual firm makes, it can
lobby on behalf of itself or it can lobby as a member of a trade association. For a firm that
can take either route, when it chooses to lobby on its own behalf, it is more likely engaging
in particularistic lobbying than when it lobbies as a member of a trade association.
However, these are not exclusive categories, many and perhaps even the majority of trade
association lobbying is in the pursuit of client politics. This is particularly true for smaller
firms that can not afford to pay the high costs of lobbying, or associations of professional
sole proprietors, like the American Optometric Association. Individual firms may choose
to disassociate from their trade association, because as Drutman (2015) notes, trade asso-
ciations take positions only if their membership agrees with them. Therefore if a policy
affects competition within an industry, individual businesses may take opposing positions
(Hansen, Mitchell, and Drope, 2005).
43

Other Groups
The measurement section of this chapter will discuss two other groups in the coding scheme.
The first is government groups. Intergovernmental lobbying is a bit of a puzzle. As Loftis
and Kettler (2014) note, since government officials have access to other government offi-
cials through their occupational duties, why would they pay an outside source to carry
out this function on their behalf? Research on intergovernmental lobbying reveals their
interests to be very particularistic. It is usually governments or agencies concerned with
securing appropriations from the legislative branch (De Soto, 1995), or bureaucratic over-
sight. Furthermore, government officials are often prohibited from electioneering so they do
not engage in outside tactics.
The last type of lobbying group is non-profits. This the brackish water between advocacy
groups, which are all non-profit groups and individual businesses. This category has groups
that organize members by their occupation and primarily consists of trade associations.4
As such, it can be considered a hybrid of those two categories. Their interests are captured
by the earlier discussion of trade associations: more particular than advocacy groups, but
more collective than business interests. They can engage in outside lobbying, likely more
than businesses.
Predictions
While we can not observe group’s goals directly, we can consider their usual behavior. Table
6 arrays the four types of groups described above on the dimensions discussed in Table 1.
Table 6: Predicted Polarization by Group Type
Group Type Goals Outside tactics Predicted Polarization
Advocacy Orgs. Mostly Collective Numerous MostTrade Assoc. Mixed Some SomeBusinesses More Particular Limited LessGovernment Mostly Particular None Least
4Labor unions behave similar to advocacy organizations, but are in the non-profit category because theirmembers are organized by their occupation.
44
Advocacy organization lobbying should result in the most party voting because it is both
the most likely to be in pursuit collective goals, and be effective, because of these groups’
outside capabilities. In the same line, trade association lobbying should be more polarizing
than business or public lobbying, but these predictions rely on matters of degrees, so it is
difficult to expect significant differences in all cases.
4.2. Measuring the influence of lobbyists on roll-call votes
This study utilizes the universe of transaction reports from these three venues,5 and at-
tempts to mitigate these concerns with scale. By using individual votes and bills as the
units of analyses, the design also allows me to report on the total distribution of interests on
any issue (Mahoney and Baumgartner, 2015). Table 33 in Appendix Chapter B describes
the data.
A challenge with using transaction reports across states is that organizations are not coded
by an outside body. To address this point, I classify organizations by two observable cri-
teria: status and behavior. By status, I answer two questions to classify groups into three
categories. Is a group public or private? Public could mean a government agency or actor
(e.g. the modal lobbyist in Ohio represents the Governor’s office), and then if it is private,
is it for-profit or non-profit? In Table 32 in Appendix Chapter B, I list the exact terms I use
from each state’s secretary of state business lookup service to code each organization. To
identify advocacy organizations in the states, I use groups that Follow the Money classifies
as “single-issue” groups. These codes are not available in the states, so I use Project Vote
Smart’s database of advocacy organizations, which it considers to be interest groups that
rate incumbents, endorse candidates and are visible to the public.
5The U.S. Congress lobbyist data was obtained from the Center for Responsive Politics (https://www.opensecrets.org/lobby/) and roll-call data was scraped from the clerk of the U.S. House of Representatives(http://clerk.house.gov/) and U.S. Senate (http://www.senate.gov/legislative/votes.htm). DW-Nominate scores were downloaded from VoteView, maintained by Keith Poole and Howard Rosenthal (http://voteview.com/). The Ohio lobbying data was scraped from the Ohio General Assembly’s Joint LegislativeEthics Committee (http://www.jlec-olig.state.oh.us/) and the Colorado data was obtained via CD-ROM from the Secretary of State. Roll-call votes for these two states were downloaded from the SunlightFoundation (http://openstates.org/). See Appendix Chapter B for more details.
45
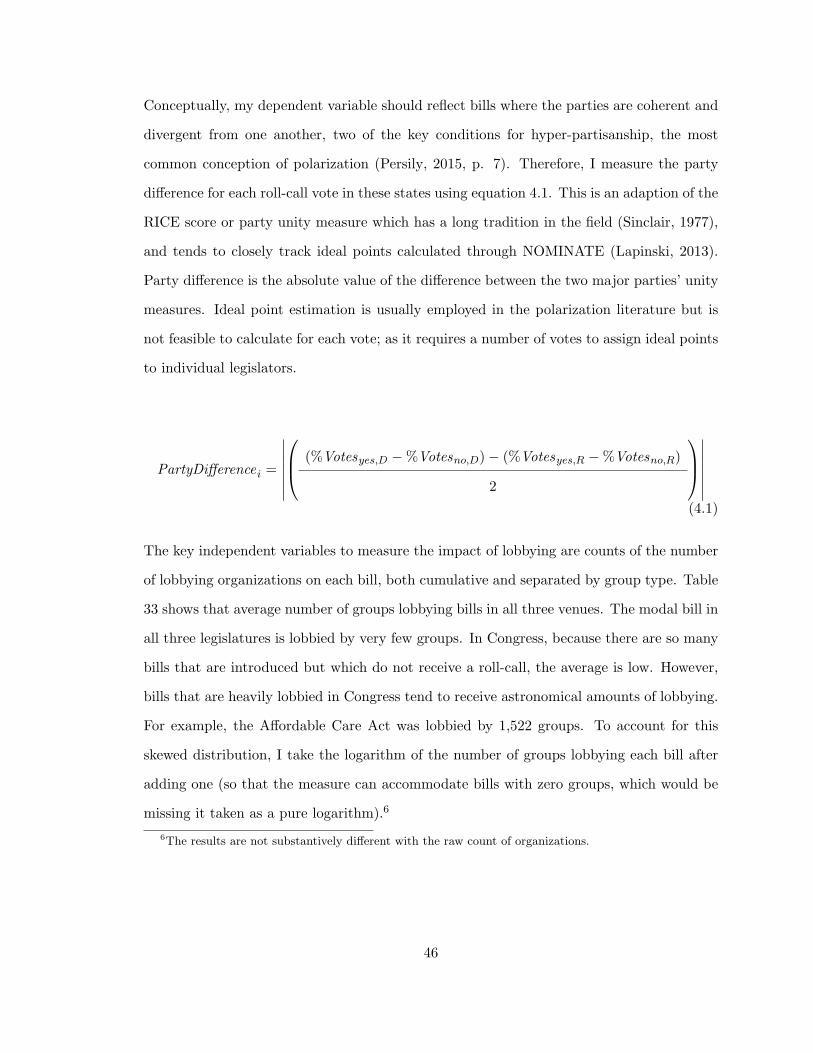
Conceptually, my dependent variable should reflect bills where the parties are coherent and
divergent from one another, two of the key conditions for hyper-partisanship, the most
common conception of polarization (Persily, 2015, p. 7). Therefore, I measure the party
difference for each roll-call vote in these states using equation 4.1. This is an adaption of the
RICE score or party unity measure which has a long tradition in the field (Sinclair, 1977),
and tends to closely track ideal points calculated through NOMINATE (Lapinski, 2013).
Party difference is the absolute value of the difference between the two major parties’ unity
measures. Ideal point estimation is usually employed in the polarization literature but is
not feasible to calculate for each vote; as it requires a number of votes to assign ideal points
to individual legislators.
PartyDifferencei =
∣∣∣∣∣∣∣ (%Votesyes,D −%Votesno,D)− (%Votesyes,R −%Votesno,R)
2
∣∣∣∣∣∣∣
(4.1)
The key independent variables to measure the impact of lobbying are counts of the number
of lobbying organizations on each bill, both cumulative and separated by group type. Table
33 shows that average number of groups lobbying bills in all three venues. The modal bill in
all three legislatures is lobbied by very few groups. In Congress, because there are so many
bills that are introduced but which do not receive a roll-call, the average is low. However,
bills that are heavily lobbied in Congress tend to receive astronomical amounts of lobbying.
For example, the Affordable Care Act was lobbied by 1,522 groups. To account for this
skewed distribution, I take the logarithm of the number of groups lobbying each bill after
adding one (so that the measure can accommodate bills with zero groups, which would be
missing it taken as a pure logarithm).6
6The results are not substantively different with the raw count of organizations.
46

Alternative explanations
To my knowledge, this project is the first to use bill-level lobbying data at this scale to
investigate polarization. However, the association that motivates this work has been realized
by other scholars – notably Baumgartner et al. (2009), who note that: “Issues marked
by partisanship tend to attract significantly more government and advocacy activity than
nonpartisan issues” and “partisanship and policy salience tend to go hand in hand” (p. 108).
Our theories diverge in how issues reach that stage, but it is unmistakable that salience and
ideology play a part in the story. This section details data that was collected to assess each
of these possibly confounding factors, and to show how salience is not a necessary condition
for lobbying to polarize roll-call votes.
Salience
Baumgartner et al. (2009) write that salience and partisanship go hand in hand. I use
the amount of media coverage to proxy for the salience of a bill. Media coverage has two
advantages, first it addresses specific bills and not policy areas in general. Second, it can
capture intensity. A bill that has 600 articles written about it is far more salient than a bill
that was only mentioned twice.
To identify salient bills, I use the method employed by Grasse and Heidbreder (2011). I
conducted a content analysis of the paper of record for each state legislature: the Denver
Post or Columbus Dispatch using LexisNexis Academic Universe7. I searched for every
article in 2011-2014 that contained the term “house bill” or “senate bill” in both papers. I
then hand-coded these articles to assign them to an individual bill, and validate that they
were referring to bills before the state’s legislature. For the US Congress, I measure salience
using the number of times a bill is mentioned in the Congressional Quarterly Almanac, as
collected by the Policy Agendas Project.8 The CQA is not a newspaper per se, but it serves
7Through the University of Pennsylvania’s subscription.8These data are made available by Adler and Wilkerson (2015).
47
as a suitable proxy for my purposes. Figure 17 shows the share of bills in each policy that
are mentioned by the CQA, conditional on them coming for a vote. Figure 17 shows that in
the US Congress, salience and partisanship are not perfectly ordered, for example, foreign
affairs are more salient than they are partisan. However, this is an aggregate measure, so
it would not detect bills with a disproportionate amount of attention like the Affordable
Care Act. Despite this odd arrangement, I find there little reason to assume salience plays
a wildly different role in Congress as it does in the states.
Selection Problem: Party Leadership
The theory of conditional party government predicts that party leaders control the agenda
so that only legislation that is favorable to the majority party comes up for a vote. Baum-
gartner et al. also note that the party rank-and-file may not be willing to invest power in
their party’s leaders on issues that they don’t agree with. This theory could serve as the
basis for the Hastert rule, named after the former Republican Speaker of the House who
said he would only bring a bill to the floor if the majority of his party supported it. If
faithfully applied, the Hastert rule creates a selection problem because we may only observe
votes that are destined to be partisan.
Figure 4 provides evidence that this is a valid concern. During the Obama administration,
only about 3 percent of bills that were proposed in Congress received a passage vote. This
indicates that the selection mechanism of which bills are being voted on is tremendously
important in Congress. The state legislatures offer a method to address this problem,
as they vary in how much power is afforded to party leaders on instruments like agenda
control (Jackman, 2014). Figure 4 shows that Colorado, in particular, presents a unique
opportunity to observe an legislature apart from this selection problem. In 1988, Colorado
voters approved a group of amendments known as GAVEL, which stands for “give a vote
to every legislator,” and guarantees every bill that is introduced a committee hearing and
a floor vote for every bill that leaves committee (Binder, Kogan, and Kousser, 2011). The
48

reform was designed to reduce party leaders’ grip on the legislative agenda, and allow
moderates to form coalitions in the center, which would greatly reduce party difference.
During my period of study, approximately 80 percent of the bills in Colorado received a
vote, a much higher share than in Ohio. In terms of case selection, Ohio provides a suitable
“most typical” state, as it is likely to be more representative of most of the states that would
fall between Colorado’s unique policy and the strict party agenda controls in Congress.
Figure 4: There is more agenda control in US Congress than in the states. In Colorado,the GAVEL policy leads to a much higher share of bills receiving a passage vote.
Simultaneity: Does partisanship cause lobbying?
The Baumgartner et al. finding that groups are attracted to partisan activity raises a
simultaneity concern. What if, instead of interest group lobbying driving partisan activity,
the causal direction runs in the other direction? Identifying a causal effect of lobbying
is difficult with this concern in mind. I address this issue with two different approaches.
49

First, I attempt to measure the ex ante partisanship of legislation before any lobbying takes
place. I estimate ex ante partisanship with the ideology of a bill’s sponsors. In Appendix B,
Figures 14 & 13 shows that roll-call votes on bills proposed by more ideologically extreme
legislators tend to be more partisan in Colorado and Ohio.
The ideology of a bill’s sponsors is estimated using ideal point estimation, provided at the
state level by Shor and McCarty (2011)9 and by Poole and Rosenthal (2000)10 for Congress.
For bills that had more than one sponsor, I average the ideal points of all the sponsors.
At the federal level, the Policy Agendas Project11 codes each roll-call vote by 20 major topic
codes. Figure 17 in Appendix B shows the average policy difference for these policy areas.
In some models I employ fixed effects for these different policy areas. These fixed effects
allow the intercept for each policy area to vary, this provides a powerful test of my theory.
This type of model allows us to observe effectively how polarized a vote is, compared to the
average bill in that policy area.
Identifying polarizing lobbying
These different data sources are combined in equation 4.2. The unit of analysis is individual
votes. However, since the amount of lobbying is only observed for each bill, the standard
errors are clustered by bill. The key independent variable is the number of advocacy or-
ganizations that lobby each bill, as a reminder I use the logarithm of this count, plus one.
This accounts for high outliers and bills with zero registered lobbying groups. I also include
the other lobbying groups by types.
9On the Shor and McCarty (2015) website: americanlegislatures.com/data/.10Available on voteview.com.11Available at http://www.policyagendas.org/page/datasets-codebooks#roll_call_votes.
50

PartyDiff v = β0 + β1AdvocacyGroupsb + β2NonProfitGroupsb
+β3BusinessGroupsb + β4GovernmentGroupsb + β5Ideologyb + β6Salientb
+
j=10∑j=7
βjGroupTypesXSalientb + β11Chamber b +
j=13∑j=12
βjVoteTypev + µb
(4.2)
where v = vote, b = bill. I run the model separately for Congress, Ohio and Colorado. I
also run the model with all groups aggregated together. I separate the upper and lower
chambers of each venue with an indicator. I also separate the different types of roll-call
votes into floor votes, procedural votes, votes within committees and votes to amend bills.
Snyder and Groseclose (2000) note the importance of this delineation as substantive votes
tend to be less partisan than many procedural votes. Coefficients for legislative sessions,
vote types and chamber should be read in relation to the excluded groups: the first session
in each venue, votes on amendments, and the upper chamber, respectively.
There are two substantively important sets of control variables. First, I use temporal fixed
effects that account for changes in polarization over time, especially in Congress. Second,
I interact the indicator for salient bills with each group type, to measure the impact of
salience. The main effect shows the impact of lobbying on bills that are not mentioned in
each legislature’s paper of record.
4.3. Advocacy organization lobbying leads to polarization
Table 7 shows that certain types of lobbying can polarize roll-call voting in Congress. Col-
umn (3) shows that there is more party difference on bills lobbied by a higher number of
advocacy organizations. This result allows me to reject a null hypothesis for my first pre-
diction at conventional levels of significance. Column (3) also shows that advocacy lobbying
polarizes legislators even when controlling for two other important factors: the ideology of
51

the bill’s sponsor and if a bill is salient.12 There is more party difference on bills proposed
by ideologically extreme members (in either party), but this variation does not mitigate the
polarizing effect of the lobbying community.
The effects of policy type are more nuanced. Columns (2) and (5) have fixed effects for
the 20 major topic codes. Including theses fixed effects means that each roll-call is being
compared to the average roll-call vote in the policy area, so it is a closer examination of
the impact of lobbying. The fixed effects reduce the coefficient for total lobbying to where
it is indistinguishable from zero. This coefficient is in line with prior literature on lobbying
that did not find it to be a polarizing influence (Baumgartner et al., 2009; Grossmann and
Dominguez, 2009). However, breaking the groups out by type indicates that lobbying from
advocacy organizations has a polarizing effect regardless of policy types. These results
also conform to the prediction in Table 1 that lobbying from non-profits is more polarizing
than business or governments. This can be interpreted to mean that on any policy type,
additional advocacy organizations or non-profits choosing to lobby a bill is likely to push
legislators to their respective party lines.
In column (6) there is an interaction between the indicator for salient bills and the number
of groups lobbying each bill. The coefficient for the main effect for each group type in
column (6) can be interpreted as the impact of lobbying on polarization on bills that are
not salient. The interaction term then indicates the difference between this main effect
and the coefficient of advocacy lobbying on polarization for salient bills. The interaction
term for advocacy organizations in column (6) is indistinguishable from zero but the main
effect is positive, which indicates that advocacy organization lobbying is not mediated by
the amount of media coverage on a bill. This result can be compared with the main effect
for non-profit lobbying that is not significant. This indicates non-profit lobbying is reliant
on salience to produce a positive effect on party polarization.
12I have also run this model using the number of articles on a bill as a continuous variable, and the resultsare largely unchanged.
52
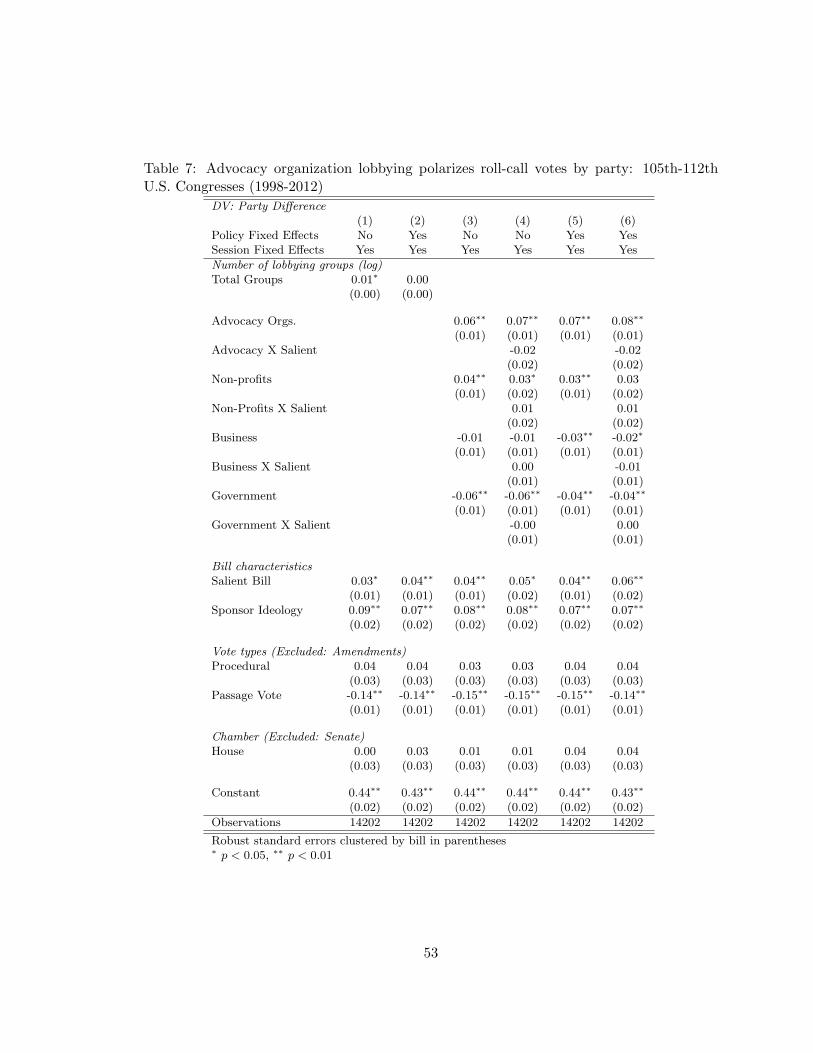
Table 7: Advocacy organization lobbying polarizes roll-call votes by party: 105th-112thU.S. Congresses (1998-2012)
DV: Party Difference(1) (2) (3) (4) (5) (6)
Policy Fixed Effects No Yes No No Yes YesSession Fixed Effects Yes Yes Yes Yes Yes Yes
Number of lobbying groups (log)Total Groups 0.01∗ 0.00
(0.00) (0.00)
Advocacy Orgs. 0.06∗∗ 0.07∗∗ 0.07∗∗ 0.08∗∗
(0.01) (0.01) (0.01) (0.01)Advocacy X Salient -0.02 -0.02
(0.02) (0.02)Non-profits 0.04∗∗ 0.03∗ 0.03∗∗ 0.03
(0.01) (0.02) (0.01) (0.02)Non-Profits X Salient 0.01 0.01
(0.02) (0.02)Business -0.01 -0.01 -0.03∗∗ -0.02∗
(0.01) (0.01) (0.01) (0.01)Business X Salient 0.00 -0.01
(0.01) (0.01)Government -0.06∗∗ -0.06∗∗ -0.04∗∗ -0.04∗∗
(0.01) (0.01) (0.01) (0.01)Government X Salient -0.00 0.00
(0.01) (0.01)
Bill characteristicsSalient Bill 0.03∗ 0.04∗∗ 0.04∗∗ 0.05∗ 0.04∗∗ 0.06∗∗
(0.01) (0.01) (0.01) (0.02) (0.01) (0.02)Sponsor Ideology 0.09∗∗ 0.07∗∗ 0.08∗∗ 0.08∗∗ 0.07∗∗ 0.07∗∗
(0.02) (0.02) (0.02) (0.02) (0.02) (0.02)
Vote types (Excluded: Amendments)Procedural 0.04 0.04 0.03 0.03 0.04 0.04
(0.03) (0.03) (0.03) (0.03) (0.03) (0.03)Passage Vote -0.14∗∗ -0.14∗∗ -0.15∗∗ -0.15∗∗ -0.15∗∗ -0.14∗∗
(0.01) (0.01) (0.01) (0.01) (0.01) (0.01)
Chamber (Excluded: Senate)House 0.00 0.03 0.01 0.01 0.04 0.04
(0.03) (0.03) (0.03) (0.03) (0.03) (0.03)
Constant 0.44∗∗ 0.43∗∗ 0.44∗∗ 0.44∗∗ 0.44∗∗ 0.43∗∗
(0.02) (0.02) (0.02) (0.02) (0.02) (0.02)
Observations 14202 14202 14202 14202 14202 14202
Robust standard errors clustered by bill in parentheses∗ p < 0.05, ∗∗ p < 0.01
53

Advocacy lobbying also polarizes in state legislatures
Unfortunately, no matter how carefully my model observes interest group lobbying and
polarization in Congress, it can not account for the selection problem created by party
leadership’s control over the agenda. If the Hastert rule is faithfully applied (Aldrich and
Rohde, 2000) as it appears to have been in recent years, we would only observe roll-call
votes with high party unity of the majority party, which is half of the equation of observing
party difference. This concern demands data from another venue, which state legislatures
provide.
Column (1) of Table 8 shows that in Colorado, with the GAVEL amendment, there is more
party difference on bills lobbied by a larger number of organizations. In column (2), there
is more polarization of bills lobbied by more advocacy organizations, and to a lesser extent,
non-profit groups. These results replicate the findings from the U.S. Congress, and show
that selection bias does not solely drive the relationship between lobbying and polarization.
In fact, the stronger polarizing impact of lobbying in Colorado suggests collective lobbying
could be replacing the party whipping operation in a legislature where it is harder for leaders
to whip.
According to estimates of ideological polarization in the states from Shor and McCarty
(2011), Colorado was one of the three most polarized states from 1991-2011 while Ohio was
closer to the middle of the pack. Therefore, Ohio serves as another useful venue to examine
polarization and replicate the results from both Congress and Colorado. In both states,
advocacy organization lobbying is a strong predictor of party voting. However, the results
are mixed when it comes to non-profits and businesses. Non-profit lobbying is polarizing
in Colorado but not in Ohio, and the opposite is true for businesses. The polarizing effect
of business may be an artifact of data availability. The bills in the states have not been
coded by policy so there are not fixed effects. Therefore, the most notable bill during these
sessions, Ohio’s SB 5 that restricted the right of public employees to collectively bargain,
attracted a large number of business lobbyists and skews the results.
54

In both states, the average ideology of a bill’s sponsors is a positive correlate of party
difference and lobbying. Controlling for the possibility that there may be more interest
group activity on bills proposed by ideologically extreme members does not mitigate the
relationship between lobbying and polarization.
The positive coefficients for salience indicate that bills mentioned in the paper of record are
more polarized in both Congress and these states. In columns (3) & (6) of Table 8 I include
the interaction term for salience and the number of groups. The positive and significant
coefficient for advocacy lobbying in Colorado indicates that it has a polarizing effect even
on bills that were not mentioned a single time in the Denver Post. This is a particularly
strong test of my theory, since state politics is much less salient than national politics, and
citizens know very little about state politics (Delli Carpini, Keeter, and Kennamer, 1994).
The pattern is different in Ohio. In Ohio, the main effect for advocacy lobbying is positive,
but not distinguishable from zero, so the bulk of the polarizing effect of advocacy lobbying
is on salient bills. This is not to say advocacy lobbying has a moderating effect, but there
is not enough evidence to point in one direction or the other.
Placebo Test
An alternative explanation for these results is that the content of some bills is just more
important, which divides the parties and attracts lobbyists to these bills. I use the two-
state structure of my data to address this concern, and show that it is lobbying and not the
content of the bills driving the relationship. Specifically, I use the University of Chicago’s
Legislative Influence Detector project to identify bills in Colorado that have identical text
passages to bills in Ohio.13
Since these bills have nearly identical passages of legislative text, it can be assumed their
content is similar. A spot check of the bill’s titles finds them to be about similar topics, such
as paired bills on oil and gas energy regulation, or drug testing procedures. However, there
13See http://dssg.uchicago.edu/lid/ for more information. The LID employs the Smith-WatermanLocal Alignment method to find matching text amongst documents. It highlights over 3 million passages inbills across all 50 states from 2009-2014, I use all of the matches from Colorado and Ohio in this test.
55
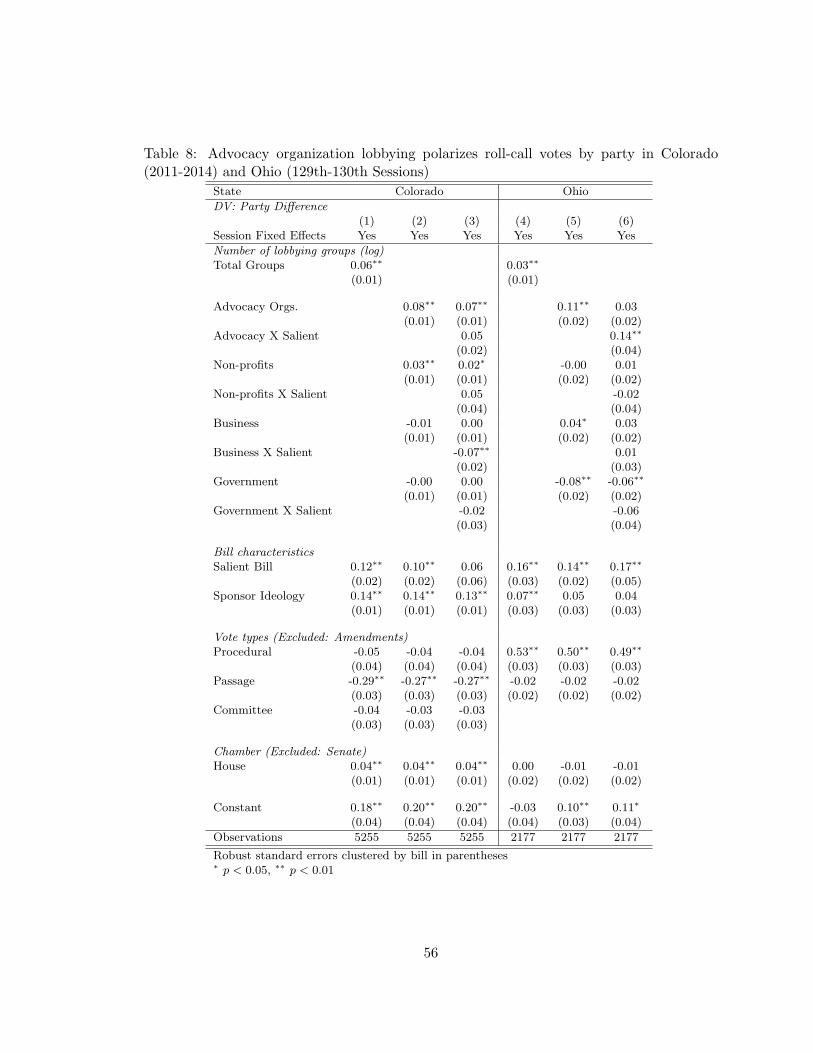
Table 8: Advocacy organization lobbying polarizes roll-call votes by party in Colorado(2011-2014) and Ohio (129th-130th Sessions)
State Colorado Ohio
DV: Party Difference(1) (2) (3) (4) (5) (6)
Session Fixed Effects Yes Yes Yes Yes Yes Yes
Number of lobbying groups (log)Total Groups 0.06∗∗ 0.03∗∗
(0.01) (0.01)
Advocacy Orgs. 0.08∗∗ 0.07∗∗ 0.11∗∗ 0.03(0.01) (0.01) (0.02) (0.02)
Advocacy X Salient 0.05 0.14∗∗
(0.02) (0.04)Non-profits 0.03∗∗ 0.02∗ -0.00 0.01
(0.01) (0.01) (0.02) (0.02)Non-profits X Salient 0.05 -0.02
(0.04) (0.04)Business -0.01 0.00 0.04∗ 0.03
(0.01) (0.01) (0.02) (0.02)Business X Salient -0.07∗∗ 0.01
(0.02) (0.03)Government -0.00 0.00 -0.08∗∗ -0.06∗∗
(0.01) (0.01) (0.02) (0.02)Government X Salient -0.02 -0.06
(0.03) (0.04)
Bill characteristicsSalient Bill 0.12∗∗ 0.10∗∗ 0.06 0.16∗∗ 0.14∗∗ 0.17∗∗
(0.02) (0.02) (0.06) (0.03) (0.02) (0.05)Sponsor Ideology 0.14∗∗ 0.14∗∗ 0.13∗∗ 0.07∗∗ 0.05 0.04
(0.01) (0.01) (0.01) (0.03) (0.03) (0.03)
Vote types (Excluded: Amendments)Procedural -0.05 -0.04 -0.04 0.53∗∗ 0.50∗∗ 0.49∗∗
(0.04) (0.04) (0.04) (0.03) (0.03) (0.03)Passage -0.29∗∗ -0.27∗∗ -0.27∗∗ -0.02 -0.02 -0.02
(0.03) (0.03) (0.03) (0.02) (0.02) (0.02)Committee -0.04 -0.03 -0.03
(0.03) (0.03) (0.03)
Chamber (Excluded: Senate)House 0.04∗∗ 0.04∗∗ 0.04∗∗ 0.00 -0.01 -0.01
(0.01) (0.01) (0.01) (0.02) (0.02) (0.02)
Constant 0.18∗∗ 0.20∗∗ 0.20∗∗ -0.03 0.10∗∗ 0.11∗
(0.04) (0.04) (0.04) (0.04) (0.03) (0.04)
Observations 5255 5255 5255 2177 2177 2177
Robust standard errors clustered by bill in parentheses∗ p < 0.05, ∗∗ p < 0.01
56

should be no relationship between lobbying in Colorado on voting in Ohio or vice-versa.
Figure 5 shows this to be the case. There is a positive and significant relationship between
the number of lobbyists in the actual state and party difference, and there is no relationship
between the number of lobbyists in the placebo state (or paired state) and party difference
in the actual state.
Figure 5: Placebo test: Lobbying from the other state does not affect polarization
Unfortunately, there are only 53 votes on five groups of bills with identical passages in these
sessions. Therefore, this insight is best seen as a robustness test of the theory. Table 9
shows a positive relationship between actual lobbying and party difference, no relationship
between placebo lobbying and party difference, and a similar story testing both measures
at once.
57
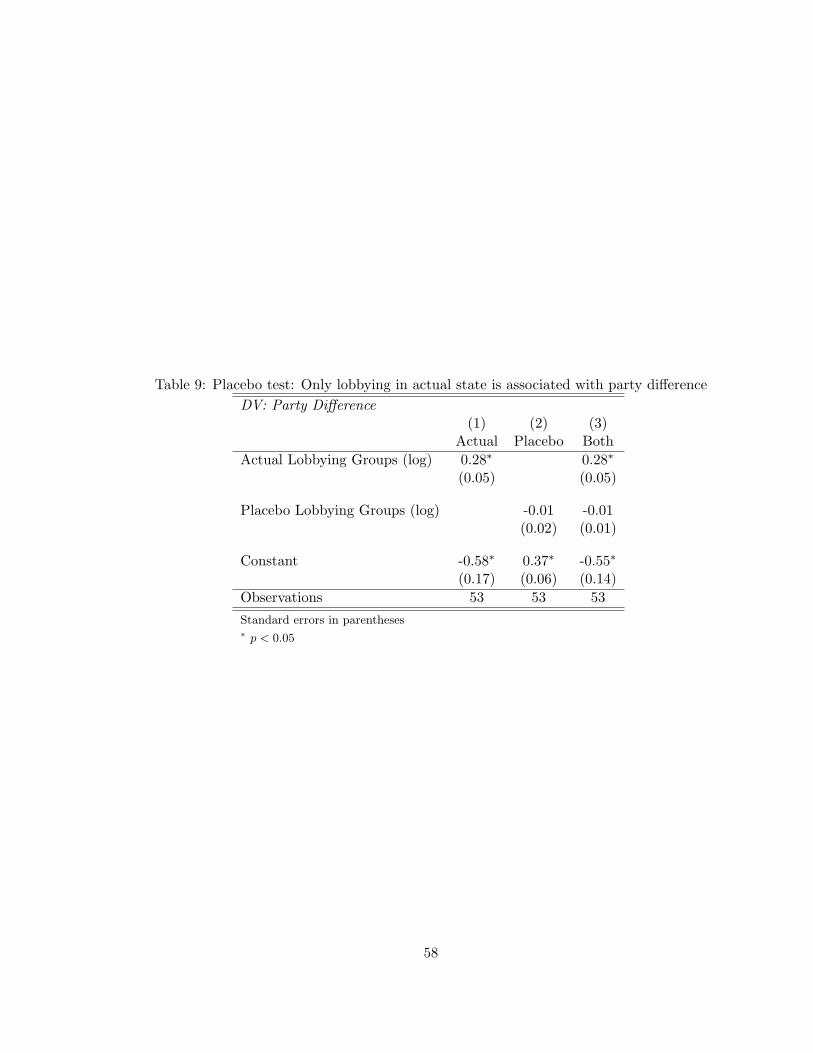
Table 9: Placebo test: Only lobbying in actual state is associated with party difference
DV: Party Difference(1) (2) (3)
Actual Placebo Both
Actual Lobbying Groups (log) 0.28∗ 0.28∗
(0.05) (0.05)
Placebo Lobbying Groups (log) -0.01 -0.01(0.02) (0.01)
Constant -0.58∗ 0.37∗ -0.55∗
(0.17) (0.06) (0.14)
Observations 53 53 53
Standard errors in parentheses∗ p < 0.05
58

4.4. Discussion and implications
This chapter shows that type of interest group that hires a lobbyist matters. It specifies
the argument in Chapter 2 that citizen-based advocacy organizations engage in collective
lobbying where they align with one of the parties to reach these goals. Using bill-level
lobbying data from eight U.S. Congresses and six legislative sessions in Colorado and Ohio,
I find that roll-call voting on bills lobbied by more advocacy organizations are more parti-
san. Bills lobbied by more businesses or state and local governments tend to have a more
bipartisan voting pattern.
The magnitude of this effect is meaningful. Holding all other factors equal, if a bill with
zero advocacy organizations is like an average bill from the 109th Congress, one with ten
is like the average bill from the 111th Congress. This means that lobbying from just a
handful of groups can make a bill go from looking like an average bill from the unified
Republican Congress after George W. Bush’s re-election to the first Congress of Barack
Obama’s administration that fought the Affordable Care Act.
I use state legislative data to show that a number of factors that could confound this process
are not in fact driving the relationship between advocacy lobbying and party polarization.
First, I leverage Colorado’s GAVEL amendment, that drastically reduces party leadership’s
agenda control, to show that lobbying has a similar effect even if a majority of bills reach
the roll-call voting stage. I also show this relationship is not only driven by salience; the
hypothesized pattern holds for Colorado bills that were never mentioned in the Denver Post.
Finally, I conduct a placebo test to show that lobbying in Ohio does not affect bills with
identical text passages in Colorado, or vice versa.
The first contribution from this chapter is that in the context of partisanship, lobbying
should not be treated as a single variable, it is important to disaggregate it by type.14 The
second contribution is that advocacy lobbying results in party polarization. Expenditures
14Baumgartner et al. (2009) do acknowledge that these differences exist, but since only only five of the 98issues in their sample deal with “cultural issues” (p. 95) they focus instead on business lobbying.
59
on advocacy lobbying increased 60 percent from 2000 to 2010 in Congress,15 and it has
generally exploded since the 1970s (Berry, 1999). The growth in advocacy lobbying can
explain some of the high levels of polarization in the modern U.S. Congress and many state
legislatures.
A close read of these results shows they can be reconciled with the earlier findings of
Baumgartner et al. (2009). My data shows that the majority of the lobbying that is observed
comes from trade associations, businesses and public agencies and results in no additional
polarization. In some cases it even moderates partisan behavior. Lobbying polarizes when
it comes from the citizen-based advocacy organizations that also play a key role in modern
party coalitions. However, these results should caution legislative scholars from using the
amount of lobbying as a single variable in the study of partisan activity.
15From approximately $102 million to $165 million (2012 dollars).
60
CHAPTER 5 : Do national policies drive state politics?
The high polarization in the recent U.S. Congress has resulted in gridlock and a corre-
sponding increase in policy stalemate (Binder, 2003; Lee, 2015). The difficulty in passing
meaningful legislation in Washington has caused political actors to look elsewhere to pur-
sue their goals. Former Republican National Committee Chairman Ed Gillespie told the
New York Times in 2014: “People who want to see policies enacted, and see things tried,
are moving their activity to the states, and away from Washington. There is a sense that
you can get things done there.”1 The flexibility of the American federal system provides
policy entrepreneurs the ability to venue shop (Schattschneider, 1960), and if states are less
polarized, then this would make the state-level a more appealing venue to pass new policies.
Is it actually the case that the states are less polarized than Congress? Shor and McCarty
(2011) find that on the whole, states have been polarizing since 1991, but on average the
majority of states are less polarized than the US Congress. However, the average obscures
the fact that polarization varies wildly over states: the distance between the party medians
in Rhode Island is a third of that distance in Congress, while in California, it is twice as
long. Chapter 2 discussed previous work that primarily focuses on the electoral connection
to explain this heterogeneity. McCarty et al. (2014) and Kirkland (2014) contend that the
polarization in the states reflects polarization in the electorate. Others have considered vari-
ation in electoral structure like primaries (McGhee et al., 2013), campaign finance (Harden
and Kirkland, 2016; Masket and Miller, 2014; Barber, 2016), or gerrymandering (McCarty,
Poole, and Rosenthal, 2009). However, this line of research has produced mixed findings,
in part because it is not clear that voters sufficiently monitor and respond to the behavior
of their state legislator (Rogers, 2013).
There has been less attention paid to institutional variation between states affecting legisla-
tive polarization. This chapter unpacks the roll-call record to argue that the policy agenda
1Confessore, N. “A National Strategy Funds State Political Monopolies” http://www.nytimes.com/2014/01/12/us/politics/a-national-strategy-funds-state-political-monopolies.html.
61

is a key determinant of polarization. I show that the most partisan issue in the 2011 was
abortion. This was a controversial issue in Washington, DC; for example the Senate consid-
ered exempting employers from providing contraceptive coverage in health care plans. In
the states, Missouri considered 20 abortion bills during this session, while Louisiana only
considered five. If all states are polarized on the issues that Congress debates, and some
states deal with more of them, this provides an agenda-based explanation as to why some
states are more polarized than others.
I predict that roll-call voting on national issues will be more polarized than on state-specific
issues. Drawing on the empirical evidence from Chapters 3 and 4, I theorize that state
legislators face a different information environment on national issues. National interest
groups and the media provide the bulk of this information and encourage polarized position
taking on these issues. In their role as policy demanders, interest groups offer positive
(electoral resources) and negative (threat of primary opponents) incentives to legislators
(Bawn et al., 2012; Masket, 2009), so knowledge of their preferences is consequential. The
national media cover politics with a more adversarial frame (Tan and Weaver, 2009), and
overwhelm state-level sources in their size (Pew, 2014), so it will likely have a polarizing
effect on legislators’ opinion of their constituents.
While scholars frequently discuss issues the federal government sends to the states (Mc-
Cann, Shipan, and Volden, 2015; Lowery, Gray, and Baumgartner, 2010; Karch, 2006),
devolution is not a necessary condition for a national policy in states. Other scholars have
looked at behavior of national actors to define the agenda, like mentions in the State of
the Union (Cohen, 2012). In 2014, President Obama mentioned his “Race to the Top”
education policy in the State of the Union, but education is mostly overseen by local school
boards, which suggests it is a state-specific issue. To address this concern, I introduce an
empirical definition based on lobbying registrations. I define a national interest group as
an organization that lobbies the US Congress in addition to a state government. I calculate
the share of national interest groups for each issue and define issues that are lobbied on
62

by national interest groups as national policies. Consistent with our intuition, the most
national policies in these states: abortion, guns, and gender issues were featured in national
political debate. Meanwhile, the most state-specific policies were the budget, municipal and
county issues, and education — policies characterized by local provision.
In order to test my theory, I construct a dataset of over 106,000 floor votes over the pe-
riod 2011-2014 from the 25 states that systematically report the subject matter of their
legislation. I then estimate the average party difference for 31 issue areas. The issues that
most divide the parties — abortion, gun control, and campaign finance and elections — are
national issues by my definition. More broadly, there is a positive effect of nationalization
on polarization: the more nationalized an issue is, the more polarized it is.
Building off this result, I hypothesize that the observed polarization of different state cham-
bers can be explained by the mix of policies on each state’s agenda. Using my definition
of national policies, I score how national each state legislative session’s agenda was during
this period and calculate the party difference for each session. I find the parties are more
divided in sessions with more national agendas. This result holds when controlling for other
explanations of polarization: opinion polarization in the electorate, party competition, pro-
fessionalization and the majority’s control over the agenda. This result indicates that the
policies are driving the politics. I conclude with a discussion of the implications of these
results.
5.1. Washington’s long shadow
An unmistakable fact about the American federal system is that the bulk of political at-
tention is paid to the national government in Washington, DC. This disparity is evident in
multiple indicators. Newspapers employ more reporters in DC than in all the state houses
combined (Pew, 2014). There is more coverage about national politics than state politics,
which affects how little citizens know about their state-level representatives (Delli Carpini,
Keeter, and Kennamer, 1994). As the inscription from Key (1966) indicates, this is not a
63

new phenomenon.
This lack of attention is a two-way street. Because of a deficit in staff resources and
information gathering tools, like polling, state legislators know less about their constituents
than do members of Congress (Jones and Baumgartner, 2005). State legislators collect
information from a number of sources, but report in surveys that the sources they rely on
the most are colleagues and lobbyists (Mayo, Perlmutter, and Riffe, 1988; Riffe, 1988). As
a result, according to Uslaner and Weber (1979) “legislators, particularly at the state level,
are simply not in a good position to estimate public opinion,” which is consequential because
if provided information about constituent preferences, as Butler and Nickerson (2011) did
for New Mexico legislators in a field experiment, legislator positions track their districts’.
Informational differences mean state legislatures should not just be considered miniature
versions of the US Congress. They are influenced by the large shadow cast by the federal
government. When policies from the national realm make their way to state politics, they
are likely to be treated differently. In his survey of Alabama legislators, Riffe (1988) found
that legislators rely on the news media for information on some issues, like world events (p.
48). National policies are likely to fall in this category because there is a rich information
environment surrounding them, created by the national news media and national interest
groups, so legislators do not have to rely on their traditional sources of information.
These outside sources of information will likely have a polarizing effect on national issues.
Baumgartner, Gray, and Lowery (2009) find that Congressional hearing activity increases
interest group density on those issues at the state level. It is safe to assume that this
increase in density on national issues comes from groups outside the state, most likely those
headquartered in Washington, DC, with the resources to pursue their goals in the states.
Since the national parties have taken opposing positions on an increasingly large number of
issues in the modern era, a process named “conflict extension” (Layman et al., 2010), the
information these groups provide is likely to be partisan.
64

In Chapter 4, I showed how interest groups provide information that can constrain legislator
behavior. In the Bawn et al. (2012) view of parties, their ability to offer both positive
(financial contributions, electoral resources) and negative (threat of primary opponents)
incentives for maintaining ideological consistency. State legislators interested in their re-
election or who hold progressive ambition for a move to Congress are thereby encouraged
to toe the party line on national policies.
On the media side, in comparison to the state-level outlets, national media sources compete
in a crowded marketplace that encourages them to emphasize novelty and conflict, especially
partisan conflict (Groeling, 2010). This type of coverage stands in contrast to the typical
flavor of state-level news. Local newspapers may not always have a monopoly, but they
operate in a less crowded marketplace. Furthermore, they have fewer reporting resources,
so their stories are more likely to rely on official sources. For both of these reasons they are
less likely to emphasize the adversarial frame of politics (Tan and Weaver, 2009).
The media’s coverage also affects citizens. Since there is more information available, the
public is more likely to have positions on these issues, and know which side its party is on. So
to the extent that the public could sanction legislators through elections for a controversial
vote, it is likely to happen on national policies (McCann, Shipan, and Volden, 2015). For
these reasons, I predict that there will be more partisan behavior on this subset of issues.
Hypothesis 5.1: National policies will be more polarized than state-specific policies.
Other scholars argue that notwithstanding the policy type, polarized roll-call voting is ex-
plained by the ideology of citizens. Shor and McCarty (2011) report a positive correlation
between ideological polarization in state legislatures and ideological polarization in individ-
ual responses to the National Annenberg Election Studies from 2002-2008. In a similar line,
Kirkland (2014) finds a positive association between the variance in citizen ideology, as mea-
sured by the 2006 Cooperative Congressional Election Survey, with 2007 state legislative
polarization.
65

These accounts both assume legislators, also known as political elites, would take their cues
from the electorate. However, if members of the public adopt the position of their party’s
legislators, as specified in the elite-driven model of opinion change (Lenz, 2013), the causal
arrow could point in the other direction. Evidence from the related case of partisan sorting,
where citizens’ partisan identification changes to match ideology, suggests this may be the
case. Wright and Birkhead (2014) report that in states where the elites were more sorted
in the 1970s (as measured by the NPAT), the electorate is more sorted today. This finding
calls for an institutional account of polarization that pays attention to the behavior of elites.
Building off the first hypothesis, I theorize that the policy agenda can influence the roll-call
behavior of state-legislators. Since I predict there to be more difference between the parties
on national issues, states with more national agendas should be more polarized. Despite
the simple reasoning of this proposition, there are countervailing forces that could make
state-specific policies more polarized. Often the parties look to differentiate themselves not
on position issues (which include national policies), but valence issues like the other party
being corrupt or incompetent (Lee, 2009). Specifically, party leaders are more likely to
pressure partisans on valence issues (Butler and Powell, 2014).
In contrast to an electorate based theory, an agenda-based account is an institutional theory.
Scholars have identified a number of other such factors that could lead to polarized voting
behavior. Aldrich and Battista (2002) argue that it matters how closely the parties are
divided are, because that is a precondition for conditional party government. If a party
faces more competition from the other party, it will exert more pressure on legislators to
adhere to the party line and restrict the agenda to issues that appeal to the party’s median
member. Empirically, Rosenthal (1998) noted that more evenly matched party competition
is linked to a higher share of party votes in Congress. Aldrich and Battista (2002) and
Hinchcliffe and Lee (2015) find similar results in the states.
The explicit rules of a legislative chamber can affect how much influence party leaders have
over the chamber. Anzia and Jackman (2013) surveyed the 99 state legislative chambers
66

to establish the powers of the committee system and majority party leaders. Their study
focused on the party’s ability to prevent unfavorable outcomes (the majority party getting
rolled). A vote with the party being rolled would result in a low partisan difference. There-
fore, the majority party having control of the calendar may reduce polarization as it could
prevent legislation that would damage its party’s cohesion from receiving a final vote.
State legislative professionalization can also make a difference, not only because profession-
alized states have more capacity, but also because they affect the type of legislator attracted
to the job. Specifically, a representative whose full time job is being a legislator is more
likely to pursue higher office later in their career (Maestas, 2000). Since party fit, or ideo-
logical conformity to the national party line, matters for progressively ambitious legislators
(Thomsen, 2014), professionalized legislatures could be expected to be more polarized.
These institutional factors may affect the type of individuals drawn to the job, and the
power of their bosses in the party, which would likely be correlated with polarized voting
behavior. My second prediction is that, even taking these factors into account, the policy
agenda should still affect the roll-call voting of legislators.
Hypothesis 5.2: State legislatures with more national agendas will be more polarized.
5.2. Measuring national issues & polarization
Defining national issues
Testing this theory requires a definition of national issues. The literature does not offer a
definition of what constitutes a national issue in state legislatures. Previous work has often
used the national agenda to define national issues. A number of scholars have defined the
national agenda empirically by observing either political or media sources like significant
Congressional legislation (Mayhew, 1991), Congressional hearings (Baumgartner, Gray, and
Lowery, 2009), New York Times unsigned editorials (Binder, 2003), or the State of the Union
(Cohen, 2012).
67

There are two problems associated with applying this approach to the state legislative case.
First, each national institution has its own agenda. President Barack Obama dedicated
time in his 2013 State of the Union to gun control, but Congress took no major action on
the issue, so was it on the national agenda? It probably was on the public’s agenda, but
Republicans in Congress used their control of an effective veto point in the system to halt
any further legislation. Therefore, a measure of the national agenda would not rely on a
single institution’s version of the agenda, as multiple institutions share power.
A second concern is the American federal system, which has been described as a “marble
cake” (Grodzins, 1966) because issues are governed at multiple levels simultaneously. Se-
quence is important in this regard. There is no doubt states voting on health insurance
marketplaces after the 2009 passage of the Affordable Care Act were dealing with a national
issue. But so was Massachusetts when it passed health care reform in 2006 that eventually
served as the blueprint for national legislation. US Supreme Court Justice Louis Brandeis
famously labeled states as “laboratories of democracy” for their ability to test policies that
could later be enacted for the country as a whole (Tarr, 2001). A definition of national
issues needs to take both top-down and bottom-up federalism into account.
Independent variable: national policy score
To remedy this shortcoming in the literature, I introduce and apply a definition of national
issues at the state level. My approach to this issue is to focus on interest groups because
they: 1) can be supported by the public, and therefore are a close proxy of the public
agenda, 2) are capable of venue shopping across the federal system. They also lobby on
nearly every type of issue whereas the media only cover a selection of issues. So by observing
the behavior of interest groups, I can deduce how national an issue on a state’s agenda is.
To construct this measure I collected the universe of lobbyist registrations from three states:
Indiana, Pennsylvania and Tennessee. I aggregate the lobbying organizations by each sub-
ject area and calculate the share of those organizations in each state that also lobbied the
68
US Congress during this four year period (2011-2014). This allows me to create a bridge
between the federal and state level, and calculate how national each issue is.
Collecting and processing the lobbying data is an intensive process, which limited me to
three states. The case selection for these states had two goals. First, the states need to be
“most similar” cases (Seawright and Gerring, 2008) in regards to their lobbyist reporting
procedures. While many states require lobbyists to declare their interests in words, these
states require lobbyists to fill out a checklist, which allows for better identification of similar
interests. This allows me to then infer that differences would be due not to reporting
procedures but in the interests of the lobbyists.
Second, in order to generalize to the other states in my sample, these states were chosen
to be “typical” cases of the country at large (Seawright and Gerring, 2008). These three
states are typical along a number of key dimensions. Economically, Pennsylvania is the
sixth largest state economy, but Indiana and Tennessee are more middle of the road, ranked
16 and 19 respectively in Gross State Product in 2015. The states contain both large urban
centers (like Philadelphia and Pittsburgh) as well as influential rural sectors. Ideologically
the three states are fairly moderate, legislators in Indiana and Pennsylvania are more slightly
more conservative than the US Congress and Tennessee is slightly more liberal (Shor and
McCarty, 2011, p. 539). Finally, they are not extreme geographic outliers in a way that
would attract an odd set of lobbyists.
As discussed in Chapter 4, a number of national organizations that lobby at the state level
are businesses or governmental agencies, rather than interest groups. This is a problem
because my measure is meant to represent the public agenda. The public sustains non-profit
interest groups through membership and donations (Skocpol, 2004), whereas businesses are
more likely to lobby on their own private interests. While agencies may lobby on public
issues, they are more likely lobbying for bureaucratic ends, like funding. Unfortunately, in
these datasets, interest groups do not identify themselves in the data. I take two steps that
deal with this issue. First, I limit my sample to non-profit groups, as this is a necessary
69
condition of being an interest group.2 Second, I estimate how many non-profits in each
issue area are advocacy organizations. I use the Project Vote Smart database of groups that
engage in electioneering activities, like endorsing candidates or rating incumbent legislators
based on their roll-call votes. This allows me to differentiate between interest groups that
are clearly representing an issue on the public agenda (e.g. Planned Parenthood or the
National Rifle Association) and a professional organization (e.g. the National Association
of Optometrists and Opticians).
In Appendix Chapter C, I demonstrate how the issues that are national in one of the sample
states are likely to be national in the other states as well, which allows for generalization
to out-of-sample states. I run a factor analysis that balances the two measures (the share
of groups that national and advocacy organizations) to maximize consistency and create a
single national policy score. I report these scores in Table 10.3 The list generally has good
face validity; the most national issues, like abortion and gun control, were fixtures in the
political debate in Washington during this period. It also reflects some realities of state
politics. For example, because of largely path dependent reasons, gambling policies, like
casino regulation or lotteries, are administered at the state level.
Collecting roll-call votes
26 states systematically report the subject matter of their legislation, allowing for an es-
timation of their policy agenda. As shown in Figure 8, these states provide a suitably
representative sample of all 50 states on a number of dimensions including size, regional
variation and ideology. I collected the universe of over 106,000 roll-call votes for all sessions
in these states over the period 2011-20144 from the Open States project.5
Open States categorizes these bills into 44 subject categories. In Appendix Chapter C, I
2See Appendix Chapter C for details on this process.3Tables 37 & 40 show the precise measurements of each step of this process.4New Jersey’s two-year terms start in even years, so I have included 2010-2011, and 2012-2013.5Data are freely available at http://openstates.org/.
70
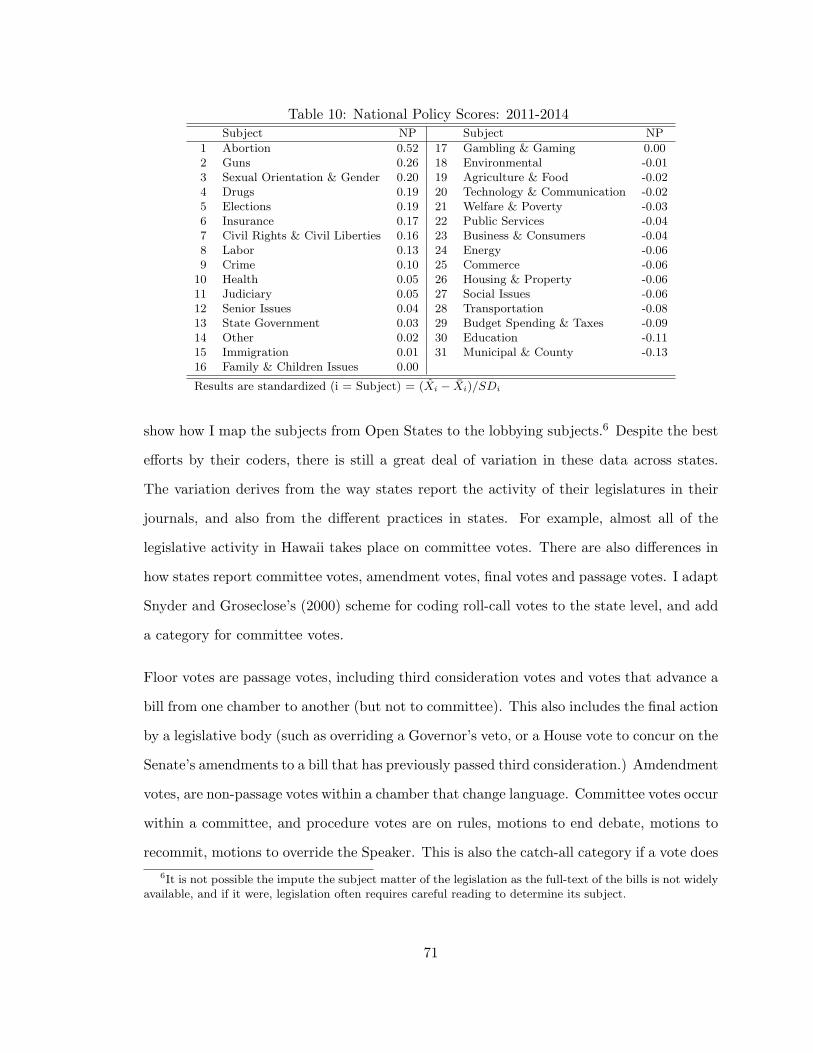
Table 10: National Policy Scores: 2011-2014Subject NP Subject NP
1 Abortion 0.52 17 Gambling & Gaming 0.002 Guns 0.26 18 Environmental -0.013 Sexual Orientation & Gender 0.20 19 Agriculture & Food -0.024 Drugs 0.19 20 Technology & Communication -0.025 Elections 0.19 21 Welfare & Poverty -0.036 Insurance 0.17 22 Public Services -0.047 Civil Rights & Civil Liberties 0.16 23 Business & Consumers -0.048 Labor 0.13 24 Energy -0.069 Crime 0.10 25 Commerce -0.06
10 Health 0.05 26 Housing & Property -0.0611 Judiciary 0.05 27 Social Issues -0.0612 Senior Issues 0.04 28 Transportation -0.0813 State Government 0.03 29 Budget Spending & Taxes -0.0914 Other 0.02 30 Education -0.1115 Immigration 0.01 31 Municipal & County -0.1316 Family & Children Issues 0.00
Results are standardized (i = Subject) = (Xi − Xi)/SDi
show how I map the subjects from Open States to the lobbying subjects.6 Despite the best
efforts by their coders, there is still a great deal of variation in these data across states.
The variation derives from the way states report the activity of their legislatures in their
journals, and also from the different practices in states. For example, almost all of the
legislative activity in Hawaii takes place on committee votes. There are also differences in
how states report committee votes, amendment votes, final votes and passage votes. I adapt
Snyder and Groseclose’s (2000) scheme for coding roll-call votes to the state level, and add
a category for committee votes.
Floor votes are passage votes, including third consideration votes and votes that advance a
bill from one chamber to another (but not to committee). This also includes the final action
by a legislative body (such as overriding a Governor’s veto, or a House vote to concur on the
Senate’s amendments to a bill that has previously passed third consideration.) Amdendment
votes, are non-passage votes within a chamber that change language. Committee votes occur
within a committee, and procedure votes are on rules, motions to end debate, motions to
recommit, motions to override the Speaker. This is also the catch-all category if a vote does
6It is not possible the impute the subject matter of the legislation as the full-text of the bills is not widelyavailable, and if it were, legislation often requires careful reading to determine its subject.
71

not fit into the previous categories.
For a dependent variable, I measure the party difference for each roll-call vote over this
period. See Chapter 4 for the equation for party difference. In order to relate my results to
the literature that relies on ideal point estimation, in Appendix Chapter C, I also run the
analysis using the dependent variable employed by Shor and McCarty (2011).
Estimating party difference
The unit of analysis in this chapter’s first hypothesis is issue areas. The dependent variable
is party difference by subject area on floor votes. Due to the structure of my data (most
bills are assigned more than one subject code), it is necessary to estimate the average
party difference for each subject. I estimate the party difference for each subject using the
following equation.
PartyDiff j =
j=30∑j=1
βjSubjectIndicator j + ωj (5.1)
where j is a subject. After correcting for the excluded group (municipal and county issues),
I report the results in Table 11. Estimating the party difference for each subject using a
regression also allows me to gauge the uncertainty of each estimate: there are many more
bills on taxes than immigration, so this equation estimates the party difference on taxes
with more precision.
I use these party difference estimates as the dependent variables in the next model. Since
these are estimates, I use a weighted least squares model in the second stage, weighing
observations by the inverse of their standard error (1/ωj) from the first stage. Lewis and
Linzer (2005) note consistency concerns with this method, and suggest using ordinary least
squares with robust standard errors without any weights. Specifically they suggest running
and reporting both models, which I do in Table 12.
72
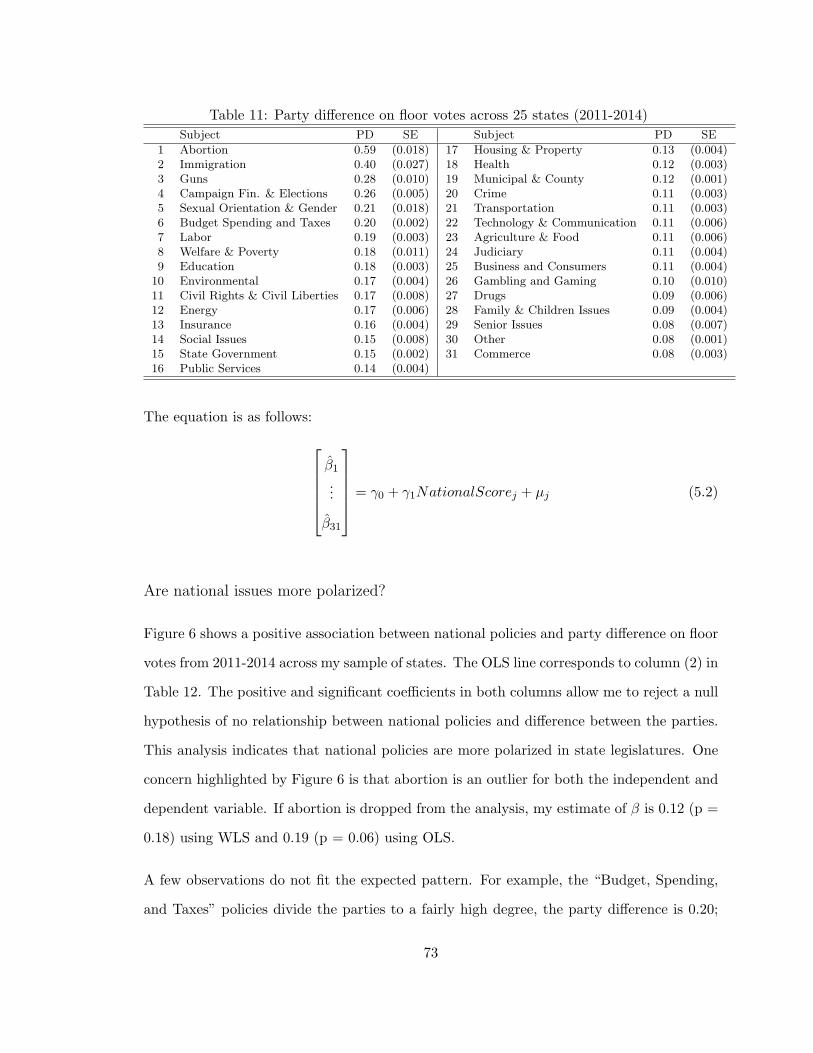
Table 11: Party difference on floor votes across 25 states (2011-2014)
Subject PD SE Subject PD SE
1 Abortion 0.59 (0.018) 17 Housing & Property 0.13 (0.004)2 Immigration 0.40 (0.027) 18 Health 0.12 (0.003)3 Guns 0.28 (0.010) 19 Municipal & County 0.12 (0.001)4 Campaign Fin. & Elections 0.26 (0.005) 20 Crime 0.11 (0.003)5 Sexual Orientation & Gender 0.21 (0.018) 21 Transportation 0.11 (0.003)6 Budget Spending and Taxes 0.20 (0.002) 22 Technology & Communication 0.11 (0.006)7 Labor 0.19 (0.003) 23 Agriculture & Food 0.11 (0.006)8 Welfare & Poverty 0.18 (0.011) 24 Judiciary 0.11 (0.004)9 Education 0.18 (0.003) 25 Business and Consumers 0.11 (0.004)
10 Environmental 0.17 (0.004) 26 Gambling and Gaming 0.10 (0.010)11 Civil Rights & Civil Liberties 0.17 (0.008) 27 Drugs 0.09 (0.006)12 Energy 0.17 (0.006) 28 Family & Children Issues 0.09 (0.004)13 Insurance 0.16 (0.004) 29 Senior Issues 0.08 (0.007)14 Social Issues 0.15 (0.008) 30 Other 0.08 (0.001)15 State Government 0.15 (0.002) 31 Commerce 0.08 (0.003)16 Public Services 0.14 (0.004)
The equation is as follows:
β1...
β31
= γ0 + γ1NationalScorej + µj (5.2)
Are national issues more polarized?
Figure 6 shows a positive association between national policies and party difference on floor
votes from 2011-2014 across my sample of states. The OLS line corresponds to column (2) in
Table 12. The positive and significant coefficients in both columns allow me to reject a null
hypothesis of no relationship between national policies and difference between the parties.
This analysis indicates that national policies are more polarized in state legislatures. One
concern highlighted by Figure 6 is that abortion is an outlier for both the independent and
dependent variable. If abortion is dropped from the analysis, my estimate of β is 0.12 (p =
0.18) using WLS and 0.19 (p = 0.06) using OLS.
A few observations do not fit the expected pattern. For example, the “Budget, Spending,
and Taxes” policies divide the parties to a fairly high degree, the party difference is 0.20;
73
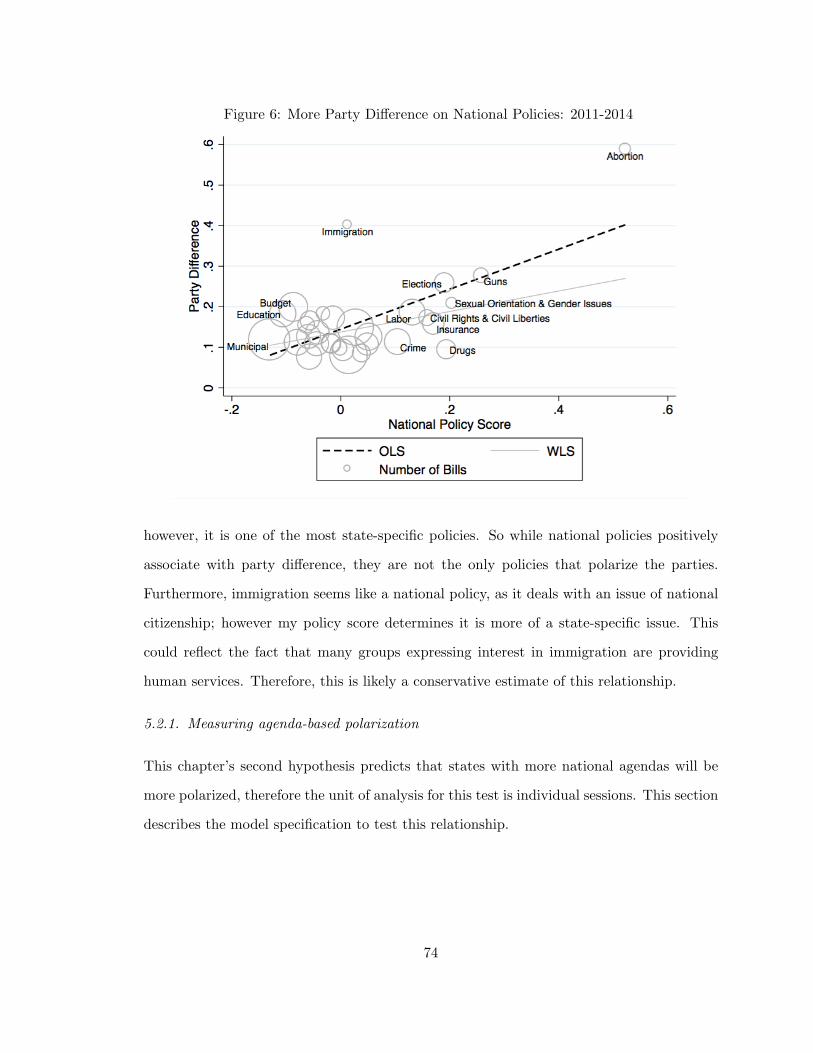
Figure 6: More Party Difference on National Policies: 2011-2014
however, it is one of the most state-specific policies. So while national policies positively
associate with party difference, they are not the only policies that polarize the parties.
Furthermore, immigration seems like a national policy, as it deals with an issue of national
citizenship; however my policy score determines it is more of a state-specific issue. This
could reflect the fact that many groups expressing interest in immigration are providing
human services. Therefore, this is likely a conservative estimate of this relationship.
5.2.1. Measuring agenda-based polarization
This chapter’s second hypothesis predicts that states with more national agendas will be
more polarized, therefore the unit of analysis for this test is individual sessions. This section
describes the model specification to test this relationship.
74

Table 12: More Party Difference on National Policies: 2011-2014
DV: Estimated party difference by subjectModel WLS OLS, robust
(1) (2)
National Policy Score 0.253∗ 0.493∗
(0.097) (0.181)Constant 0.138∗∗ 0.145∗∗
(0.010) (0.014)
Observations 31 31R2 0.189 0.413
Standard errors in parentheses. WLS weights from standard errors listed in Table 13.∗ p < 0.05, ∗∗ p < 0.01
Dependent variable: Session party difference
I measure the party difference on each floor vote for the states in my sample.7 I then
calculate the average party difference for each state chamber and session to serve as my
dependent variable. Because party difference is only observed on bills that come up for a
roll-call vote, I only include bills that received a passage vote (i.e. action agenda). Figure
7 shows the lack of any clear regional pattern of party difference across the 25 states in the
sample over this period.
Figure 7: Heat map of Average Party Difference on roll-call votes in state legislatures:2011-2014
7Texas is dropped from the analysis because it does not record the roll-call vote (a second reading vote)that determines passage of a bill in its journals. It does hold a “third consideration” or passage vote, but isusually ceremonial. (Personal Correspondence with Miles Watkins from the Sunlight Foundation, 2015).
75
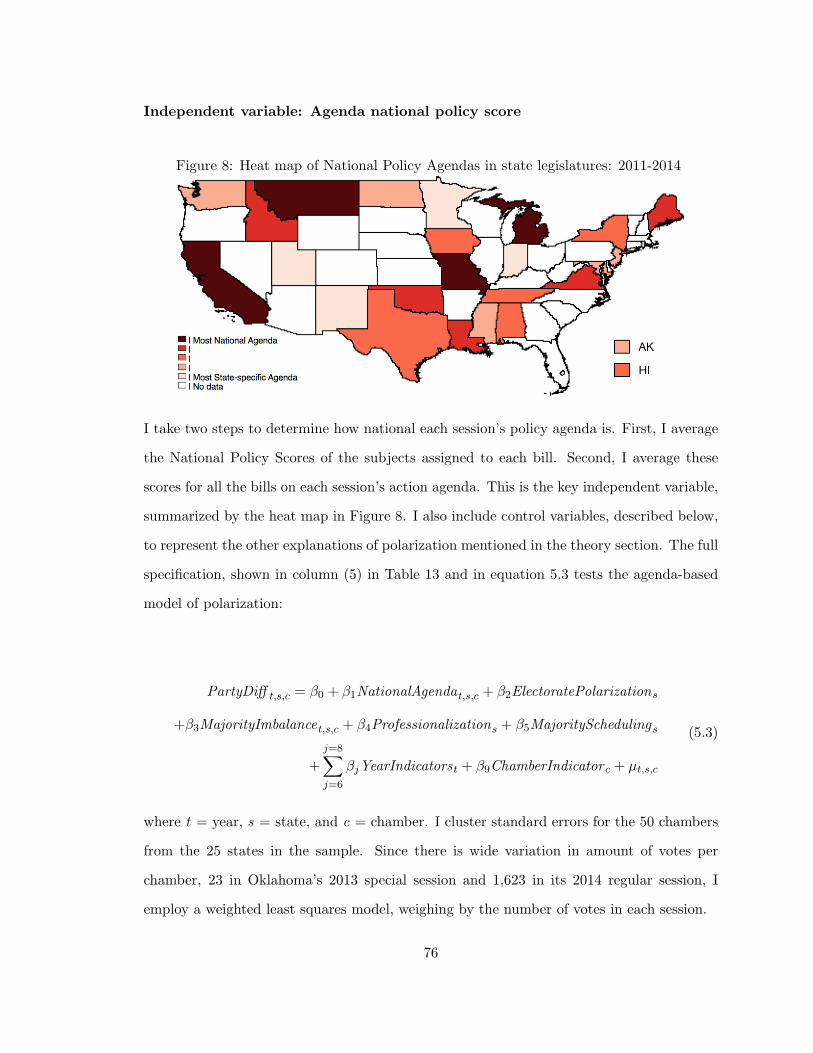
Independent variable: Agenda national policy score
Figure 8: Heat map of National Policy Agendas in state legislatures: 2011-2014
I take two steps to determine how national each session’s policy agenda is. First, I average
the National Policy Scores of the subjects assigned to each bill. Second, I average these
scores for all the bills on each session’s action agenda. This is the key independent variable,
summarized by the heat map in Figure 8. I also include control variables, described below,
to represent the other explanations of polarization mentioned in the theory section. The full
specification, shown in column (5) in Table 13 and in equation 5.3 tests the agenda-based
model of polarization:
PartyDiff t,s,c = β0 + β1NationalAgendat,s,c + β2ElectoratePolarizations
+β3MajorityImbalancet,s,c + β4Professionalizations + β5MajoritySchedulings
+
j=8∑j=6
βjYearIndicatorst + β9ChamberIndicator c + µt,s,c
(5.3)
where t = year, s = state, and c = chamber. I cluster standard errors for the 50 chambers
from the 25 states in the sample. Since there is wide variation in amount of votes per
chamber, 23 in Oklahoma’s 2013 special session and 1,623 in its 2014 regular session, I
employ a weighted least squares model, weighing by the number of votes in each session.
76

Data for control variables
For professionalization, Bowen and Greene (2014) provide a dynamic measure that builds
off the Squire Index (2007), which combined session length, legislator compensation and
staff resources. I use the latest reading of each state’s professionalization (either 2011 or
2010). To measure opinion polarization in the electorate, I use the approach of Shor and
McCarty (2011) and measure the ideological distance between self-reported partisans using
the 2012 Cooperative Congressional Election Survey.8
To assess the chances for conditional party government, I measure the majority imbal-
ance, calculating the two-party balance for each year in the sample,9 which is necessary
as party balance can change apart from elections (through retirements, special elections,
etc.). I use data from the National Conference of State Legislatures.10 The equation is as
follows: MajorityImbalancec = |(SeatsGOP,c/(SeatsGOP,c + SeatsDEM,c))− .5|, where c is a
legislative chamber in each state.
5.3. Are states with national agendas more polarized?
Figure 9 shows a positive relationship between national agendas and party difference on floor
votes in chambers across the four years in the sample period. This bivariate relationship is
also positive and significant in the column (1) of Table 13. Therefore, in the most direct test,
states with more national agendas are more polarized. There are some outliers in Figure
9, especially for small sessions, like Minnesota’s 2011 special session that only had 22 floor
votes. There is a degree of temporal stability as states with more state-specific agendas
(e.g. Alabama), as well as national agendas (e.g. California, Maine) tend to persist.
The remainder of Table 13 accounts for other explanations of polarization that could be
8In Appendix Chapter C, I replicate the Shor and McCarty (2011) result using the 2000, 2004 and 2008National Annenberg Election Studies and extend it using the CCES to 2012 to validate this usage of thedata.
9I use years as the unit of analysis as some states conduct special sessions that fall in off-election years.A typical two-year session is placed in its terminal year.
10Available at http://www.ncsl.org/research/about-state-legislatures/partisan-composition.
aspx
77

driving this association. Column (2) incorporates the estimate of opinion polarization from
the 2012 CCES. This measure is positively associated with legislative polarization, repli-
cating the findings of the electorate based account (Shor and McCarty, 2011; Kirkland,
2014).
Columns (3-5) demonstrate the effects of controlling for a variety of institutional factors.
In column (5), which incorporates all three institutional factors, the positive association
between having a national agenda and party difference on floor votes maintains. This
allows me to reject a null hypothesis of agendas having no effect on polarization. In order
to determine the size of this effect, the R-squared for a reduced model with only opinion
polarization explains about 15 percent of the variation in party difference across states. The
national policy agenda score explains 23 percent of the variation across chambers and years.
Including the control variables explains approximately 20 percent more of the variation in
party difference than just a reduced model featuring opinion polarization.
Column (5) shows that holding all other factors equal, considering the policy agenda mit-
igates the effect of the majority party control of the agenda on party polarization. Anzia
and Jackman (2013) find that this control reduces the rate at which the majority is rolled,
but my results suggest this power is contingent on the type of policies that legislators are
voting on. These are interrelated factors, as party leaders have a big hand in the agenda,
but these results suggests that the agenda matters beyond the leadership’s control of the
agenda.
78

Figure 9: States with national agendas have more average party difference: 2011-2014
79

Table 13: More difference between parties in states with national agendas: 2011-2014
DV: Party Difference(1) (2) (3) (4) (5)
National Agenda 6.318∗∗ 5.720∗∗ 5.716∗∗ 5.424∗ 5.925∗∗
(1.756) (1.875) (1.880) (2.098) (2.018)
Opinion Polarization 0.199∗∗ 0.203∗∗ 0.205∗∗ 0.211∗∗
(0.073) (0.073) (0.070) (0.066)
Institutional FactorsMajority Party Imbalance 0.019 0.028 0.046
(0.089) (0.092) (0.079)Professionalization 0.003 0.002
(0.005) (0.005)Majority Calendar Control 0.049
(0.026)
Year and chamber indicatorsUpper Chamber -0.034 -0.035 -0.034 -0.034 -0.032
(0.027) (0.026) (0.025) (0.025) (0.024)2012 -0.027 -0.014 -0.013 -0.018 -0.024
(0.036) (0.033) (0.033) (0.031) (0.029)2013 -0.006 -0.001 -0.002 -0.002 -0.007
(0.015) (0.015) (0.015) (0.015) (0.015)2014 -0.063 -0.047 -0.047 -0.051 -0.062
(0.036) (0.032) (0.032) (0.031) (0.031)
Constant 0.176∗∗ -0.284 -0.294 -0.298 -0.340∗
(0.037) (0.156) (0.158) (0.151) (0.136)
Obs. (Chamber Sessions) 137 137 137 137 137R2 0.231 0.308 0.308 0.311 0.353
Standard errors clustered by 50 chambers in parentheses.
Weighted Least Squares. Weighted by number of floor votes in session.∗ p < 0.05, ∗∗ p < 0.01
80

5.4. Discussion and implications
To explain why some states are polarized and others are not, this chapter advances a theory
that there will be more partisan conflict on a subset of the bills on state legislative agendas,
specifically those that address national issues. This theory is built on information disparities.
Compared to state-specific issues, there is much more information about national politics
provided to state legislators. That information comes from two polarizing sources: interest
groups, which incentivize legislators to toe the party line, and the media, which emphasize
party conflict on the national stage.
To test this theory, I introduce an empirical definition of national policies based on lobbying
registrations from interest groups. I aggregate non-profits that express interests in state
legislative issues together, and calculate the share of those groups that also lobbied Congress
over the period 2011-2014. Using this measure as an independent variable, I find there to
be more party difference on national issues on a sample of over 106,000 roll-call votes from
25 states over this same period. I also find that sessions with more national agendas are
more polarized.
These results show that the policy agenda of a state’s legislature affects its polarization. An
agenda-based account of polarization calls for shifting attention to the actors that drive the
agenda-setting process. This includes policy entrepreneurs like interest groups, state legis-
lators and party leaders that advance bills through the legislative process (Kingdon, 1984),
and the media, which swarm the issues on its agenda with attention and can influence the
policy agenda (Wolfe, Jones, and Baumgartner, 2013). This account builds on a literature
that primarily has looked to the electorate to explain patterns of polarization. While my
analysis replicates the finding that opinion polarization affects legislative polarization, the
national agenda variable explains more variation in party difference (23%) than the elec-
torate’s opinion polarization (15%). I also successfully test this account against alternative
institutional hypotheses, like professionalization, party competition and majority agenda
control.
81

This account conforms to Lowi’s (1972) dictum that “policies drive politics.” Scholars
have tested this theory over time in Congress. Jochim and Jones (2013) show that while
many issues are on a single liberal-conservative dimension, as predicted by the classic work
on polarization by Poole and Rosenthal (1985), they arrived there via a heterogeneous
process. Issues that “emphasize the traditional ideological debates around redistributive and
regulatory concerns” could be simplified to a single dimension before primarily distributive
policies (p. 357). Looking over a longer era, Lapinski (2013) found that domestic politics
is almost always highly polarized, and the pattern changes for sovereignty policies, like
citizenship. By comparing 50 legislative chambers simultaneously, I provide a novel, cross-
sectional test of this theory. While my argument is less about the substance of policies per
se, it shows that the context surrounding policies matters a great deal for roll-call voting
behavior.
The results also demonstrate important linkages between national and state politics. Pre-
vious work has shown that if an issue has national attention (as observed by Congressional
hearings), it is likely to be on the agenda in professionalized legislatures (McCann, Shipan,
and Volden, 2015), and there will be a higher density of interest groups at the state level
(Baumgartner, Gray, and Lowery, 2009). This study goes beyond these findings to show
that the style of politics at the national level, specifically partisan conflict, can accompany
the issue at the state level as well. Furthermore, it does so with a definition of national
policies that does not rely on Congressional activity. This is particularly important in an
age without much landmark legislation, which was used to build classic measures of the
national agenda (Mayhew, 1991).
However, this evidence has a dire assessment for states as an alternative policy venue to
Congress. Whether or not national issues will be gridlocked in the states depends on
institutional partisan alignment. Polarization on these issues in Congress often leads to
stalemate because the parties have been evenly divided in recent years, there are many
veto points, and pivotal players are often in the gridlock zone (Krehbiel, 2010). This is
82

not always the case in the states. There is wide variation in the balance between the
parties (Hinchcliffe and Lee, 2015), and in the rules employed by different legislative bodies
(Anzia and Jackman, 2013). To assess the viability of the states as a destination for policy
passage, these institutional factors must be taken into account. The “desirable” states are
those where one party has a large majority; which could lead to diverging ideologies of
policies in red and blue states.
83

CHAPTER 6 : Conclusion
This dissertation set out to assess the causes and consequences of polarization. It focuses
on extragovernmental groups that engage public officials through lobbying, and argues
that businesses and citizen-based advocacy organizations have different goals and tactics.
Advocacy groups pursue broader policy programs, are more likely to challenge the status
quo, and use grassroots tactics that engage their membership.
In two empirical chapters, I contribute evidence that lobbyists representing advocacy organi-
zations can be associated with two specific behaviors. First, advocacy organization lobbying
can set the agenda in state legislatures by engaging in positive promotion of legislation, in
contrast to business lobbying that often engages in negative blocking of legislation. Second,
I produce evidence that advocacy organization lobbying leads to partisan roll-call votes,
while business and public sector lobbying leads to less partisan roll-call voting. Since ad-
vocacy lobbying has become increasingly prevalent in Washington, D.C., and has exploded
since the 1970s (Berry, 1999), this behavior can explain a high degree of polarization in the
modern U.S. Congress.
Those two chapters focus on the instrumental function that interest groups and lobbyists
play — while mostly leaving the subject of their lobbying activity to the side. In Chapter 5,
I bring policies to the forefront to directly assess the result of interest group activity. I find
that states with more previously national policies on their agendas, as defined by interest
group activity, tend to be more polarized. This builds on other explanations of polarization
to answer why some states are polarized and others are not, by pointing to the “policy
entrepreneurs” that work hand-in-glove with legislators to build the agenda.
Advocacy organizations are not acting alone in this account. Building a policy agenda
and structuring roll-call votes are both endogenous processes where lobbyists, party leaders
and individual legislators behave strategically. These endogeneity concerns are at the heart
of contrasts I draw with the works that serve as foundations for this field. For example,
84

in Chapter 3, I argue that a minority of groups actively set the agenda more than they
are attracted to it, which is a different interpretation than Gray et al. (2014) present in
their ESA model of interest group density. In Chapter 4, I present evidence that advocacy
lobbying can polarize legislator behavior, while only business and public sector lobbying
has the effect that Baumgartner et al. (2009) find. In both of these cases, my confidence in
the findings is driven by a more granular view of lobbyist and legislator activity.
While I take great pains to explain away competing accounts for these associations, I can not
rule them out entirely. An avenue of future research is to take a deeper look at a smaller
number of isolated issue areas, states or case studies to isolate theoretical mechanisms.
Future work will also continue to address stages of the legislative agenda I have yet to
investigate. This includes the committee stage as legislators balance group demands as
they mold policies. Moreover, I will continue to disaggregate the type of groups that lobby,
which could help clarify the groups that set the agenda through positive promotion instead
of negative blocking of legislation.
6.1. Place in the literature
This evidence speaks to a number of debates in political science literature. My conclusion
that national policies are more polarized than the bulk of the state-level agenda calls for
decomposing the state-level agenda into policy types. This approach has been applied in
the U.S. Congress (Jochim and Jones, 2013; Lapinski, 2013), but much of the leading work
on state-level polarization treats every roll-call vote the same, regardless of policy type
Shor and McCarty (2011). This evidence suggests that legislators are not just ideological
actors impervious to what is placed in front of them, but are more reactive to the conflict
environment surrounding each policy type.
There is no smoking gun in these pages to resolve the debate over polarization emanating
from elites or the masses in the United States (Abramowitz and Saunders, 2008; Fiorina,
Abrams, and Pope, 2006; Bafumi and Herron, 2010; Mason, 2015). There is evidence to
85

suggest a key function that groups can play in this process. As in the Baumgartner and
Jones (1993) theory of bounded rationality, the public operates with little information on
most topics, and tends to fixate on a limited set of issues at any time. Interest groups are
a key player in highlighting these issues for the public and then overcoming a collective
action problem to harness that energy and affect the political process. In fact, my evidence
is consistent with a world where legislators mostly just listen to groups as a proxy for their
constituents. That would be a fairly dystopic outcome, but it seems especially likely in
the context of state legislatures. It could also explain how a fairly moderate electorate
could have extremist officials, they think they’re representing the people but they are really
representing activist individuals.
6.2. Implications of group influence
In terms of implications of these findings, my evidence speaks to a concern a number of
authors (Bartels, 2009; Schlozman, Verba, and Brady, 2012) highlight about the distribution
of resources in our national politics. Specifically, Gilens and Page (2014) find evidence
that “economic elites and organized groups representing business interests have substantial
independent impacts on U.S. government policy, while average citizens and mass-based
interest groups have little or no independent influence” (p. 564). In the context of state
politics, Lewis, Schneider, and Jacoby (2015) study state spending priorities and find “the
effects of institutional arrangements, while important, are much smaller in magnitude than
the impact of interest groups” (p. 20). The instrumental processes that I describe, especially
the ability to set the agenda, contribute to this imbalance.
Lobbying is the province of the well-resourced, so if lobbyists are successful, it will bias
governmental priorities towards wealthy individuals and business interests. Negative block-
ing in the agenda setting process can prevent egalitarian policies from seeing the light of
day. In 2009, when the machinery of democracy had been working well for the Democratic
party — it had just elected Barack Obama to the White House and held both houses of
Congress — the Democrats passed the Affordable Care Act. However, the public option,
86
which would have created public competition for the nation’s powerful health care industry,
was removed from the bill when Joe Lieberman, an independent Senator who caucused
with the Democrats, threatened to filibuster the bill in the Senate. The public option
is a prototypical policy with diffuse benefits that would require collective lobbying; how-
ever, Lieberman represented Connecticut, the home state of many of those powerful health
insurance corporations and protected its concentrated benefits.
As hot-button issues move to state legislatures, the potential for outside group influence is
higher because state legislators have fewer staffers and political intelligence resources to help
them make decisions. In today’s complex policy environment, this lack of policy capacity
makes legislators more reliant on lobbyists to do their jobs. Recent reforms have only
exacerbated this issue. For example, in the 1990s, the Cato Institute pushed for legislative
term-limits to “recreate the long-lost ideal of citizen-legislators” (Bandow, 1995). And even
in states without term limits, many states do effectively have citizen-legislators. It should
come as no surprise that the Koch Network and ALEC focus their resources on the states
(Mayer, 2016); there is good return on the investment there.
6.3. Is the system rigged?
In terms of reforms to harness these private interests, those who think “The system is
rigged” often fixate on the money in politics, particularly campaign finance contributions.
While preferable to apathy, this attention may be misplaced. Most of that money goes to
television advertising, which is certainly consequential, but has less of an impact on the
details of policy making that often happens in the shadows.
A more effective defense against moneyed interests would be increasing the policy capacity
of state legislatures. The literature shows there is very little evidence that money spent
on lobbying can buy policy outcomes. Instead, money usually buys lobbying services that
subsidize the behavior of certain legislators. If legislators had more policy capacity at their
disposal, they would be less reliant on lobbying resources to help them choose what to do
87
and how to do it. In this way, lobbying is an exercise of the “Second Face of Power,” which
is not what is the power we see demonstrated in public debate, but the power to determine
what comes up for debate in the first place (Bachrach and Baratz, 1962).
In this regard, the evidence I produce on the efficacy of citizen-based advocacy organizations
is encouraging. Party polarization is not a normatively good or bad thing on its own, it is
only a feature. Party polarization can be a net gain if groups are acting as agents’ of the
public interests and halting progress on client politics that concentrate benefits and spread
the costs over society at large.
On the other hand, party polarization on issues like gun control, voting rights or abortion
has consequences. The parties are not well-balanced in all the states and Lax and Phillips
(2012) find a “democratic deficit”; policies tend to be more extreme than estimates of
the public’s opinion in each state predict they should be. If one party has comfortable
majorities, party polarization will not stop it from rubber stamping the policy proposals
of interest group demanders. And if the parties are well balanced, party polarization can
lead to policy gridlock, and reinforcement of the status quo (Binder, 2003), which again
benefits moneyed interests. Voorheis, McCarty, and Shor (2015) link polarization in state
legislatures to economic inequality within those states, another troubling outcome. The
state that Americans choose to live in should not have deleterious effects on their path to
prosperity or civil rights.
What is beyond reproach is that there not is enough attention being paid to state politics.
After the shooting at Sandy Hook Elementary School, President Obama pleaded for a vote
on “common sense” gun control in Congress. To the dismay of academics, journalists and
policy elites, seemingly nothing happened. But in the year following Obama’s plea to the
country during the 2013 State of the Union for more gun control, the states were a hotbed of
activity. In the first chapter I mentioned that 172 laws were passed in the states to address
this issue, but only 64 of those laws strengthened gun control. At least 70 of those laws
88
relaxed existing gun regulations.1 My results suggest that this pattern reflects the states
where interest groups like the NRA or Everytown for Gun Safety, a gun control advocacy
organization, have strong legislative allies. This may not be a factor that voters have on
their mind when they vote in state legislative elections, if they vote at all.
In summary, policy is being made, but the public is often just not aware of it. The situation
is not getting better. The primary observers of state politics — local newspapers and the
journalists they assign to cover state capitals — are diminishing in number (Darr, 2015).
In my experience, every dissertation on American state politics reminds readers that Tip
O’Neill, former Speaker of the U.S. House (as well as the Massachusetts House of Represen-
tatives) once said that “All politics are local.” Unfortunately, this lesson is lost on many
academics, journalists and policy elites who refuse to avert their gaze from Washington,
D.C. as interest groups, lobbyists and other policy entrepreneurs are taking their business
to the state capitals.
1According to the Law Center to Prevent Gun Violence, there were an additional38 laws whose immediate impact could not be discerned http://smartgunlaws.org/
tracking-state-gun-laws-2014-developments/ (2 May 2014).
89
APPENDIX Supporting materials for Chapter 3
In Chapter 3, I employ estimates of the number of groups registered to lobby as a dependent
variable, and the number of bills introduced in 15 policy areas as an independent variable
in the 50 states from 2005-2015. This appendix explains the collection of those data, as
well as an estimation techniques used to place bills and groups in policy areas.
For bills, I expand on the approach using LexisNexis — used by similar studies in the
literature (Gray et al., 2005; Baumgartner, Gray, and Lowery, 2009); my contribution here
is to collect ten years of bills.
For the number of groups in each state, I use an annual census of group lobbying registrations
collected by the National Institute for Money in State Politics. These registrations, however,
are not assigned an industry code. Therefore, I employ an automated text classification to
layer estimates of the policy sector of the groups over this census.
A traditional automated approach would use human coders to classify two portions of the
data, called the training and test set. The training set is used to calibrate the algorithm
to separate entries into categories. After the algorithm runs, a test set which had been
set aside is used to evaluate its performance. This can be an iterative process to optimize
the classification scheme. The innovation of my approach is that, instead of using human
coders, I use actual lobbying registrations to build my training and testing sets. Specifically,
when a lobbyist registers in the U.S. Congress, Colorado, Pennsylvania or Massachusetts, he
needs to describe his client’s business or industry. This allows me to use the actual lobbyists
as my de facto human coders. I use the U.S. Congress, Colorado and Pennsylvania to create
a training set and then the Massachusetts set to evaluate it.
In this appendix chapter, I will first provide an overview of the data collected from state
legislative and agency sources, including the subject codes for each venue. Next, I will
describe how I estimate the number of bills introduced in 15 policy areas in all 50 states from
90

2005-2015 using LexisNexis. Finally, I discuss the automated text classification process, and
run a number of validation exercises on these estimates. I also provide tables with a year’s
worth of estimates, and a full listing industry estimates in Hawaii in 2007. I conclude with
discussion of the costs and benefits of an automated classification approach against the
hand-coded approach used in the published literature.
A.1. Collecting an annual census of interest groups
The National Institute for Money in State Politics (hereafter the Institute), maintains a
database of the lobbyists in their clients in all 50 states.1 I was provided with the underlying
data through March 21, 2016,2 although the information is also available to the public.
There are 1.85 million observations between 2005 (when national coverage picks up) through
2014 in this list.
The Institute’s work to create this registry is substantial and beyond the scope of what any
researcher could achieve. It is built on data that is publicly available in 44 states, but which
is not very accessible or useful in many cases.3 Table 14 details the venues that I used to
expand on the Institute data for this chapter. The data was either received directly from a
Secretary of State or downloaded from their websites. Table 15 shows the number of groups
in each year of the data.
I take the completeness of the Institute data at face value. There is little reason to suspect
that there are missing groups. In one of the validation exercises in section 4 of this ap-
pendix, I compare these data to Gray and Lowery’s published counts of group registrations
for 2007, finding only a moderate correlation of 0.51. Part of that discrepancy probably
originates with overestimation of the number of groups. This is because states differ in the
legislative activity they determine being lobbying. For example, the modal lobbyist in my
1e.g. Illinois 2011 directory followthemoney.org/lobbyist-link?s=IL&y=20112I thank Denise Roth Barber, the Institute’s Managing Director for supplying me with their source files
that is surfaced at classic.followthemoney.org/database/search.phtml.3See the Sunlight Foundation’s overview of the poor state of lobbying disclosure in the states: http://
sunlightfoundation.com/blog/2015/08/12/how-transparent-is-your-states-lobbying-disclosure/
12 Aug 2015.
91

Table 14: Data sources for lobbying group registrations
Venue Years Source No. of Codes
Colorado 2005-2014 CD-ROM from Sec. of State, also at: 31sos.state.co.us/lobby/Home.do
Massachusetts 2005-2016 Scraped from Sec. of State 26sec.state.ma.us/LobbyistPublicSearch/
Pennsylvania 2007-2016 Downloaded from Dept. of State 42palobbyingservices.state.pa.us/
U.S. Congress 2005-2015 Downloaded from Center for Resp. Politics: 525opensecrets.org/myos/bulk.php
All 50 States 2005-2014 ZIP file from N.I.M.S.P., also at: n/afollowthemoney.org/lobbyist-link
Table 15: Group registrations by year: 2005-2016
Year Colorado Massachusetts Pennsylvania U.S. Congress All 50 States
2005 1,093 1,036 12,917 18,217
2006 1,130 1,046 13,122 51,339
2007 1,150 1,067 14,856 54,669
2008 1,173 1,138 443 15,300 55,125
2009 1,200 1,221 16,169 50,480
2010 1,167 1,352 493 14,455 51,136
2011 1,280 1,355 12,993 54,111
2012 1,245 1,360 522 11,747 52,765
2013 1,336 1,406 11,345 58,078
2014 1,231 1,440 440 10,953 56,869
2015 1,437 8,517
2016 1,368 1,691
Total 12,005 12,077 3,589 101,479 502,789
Average 1,201 1,006 718 9,225 50,279
*Penn. only reports groups in their latest lobbying period.
92

Table 16: Sessions by year: 2005-2015
Session New Jersey/Virginia Other 48 states
1 2006-2007 2005-2006
2 2008-2009 2007-2008
3 2010-2011 2009-2010
4 2012-2013 2011-2012
5 2014-2015 2013-2014
Ohio lobbying data in Chapter 4 is the Governor’s office. As a result, researchers need to
filter out redundant or irrelevant groups that end up in these data (like government agencies
or lobbying firms). The Institute carries out a great deal of the data cleaning. For example,
the Institute reports 1,090 groups registered in Colorado in 2007, whereas the raw reports
in Table 15 indicated there were 1,170, so the institute removed at least 7% of of the original
reports.
In section 2 of this chapter, I will discuss how the estimation of bill introductions can only
be done for regular sessions. The majority of states have two-year regular sessions, and
some states have one-year sessions. Therefore, to balance the data, Table 16 shows how
I aggregated the group registrations so that each state has five sessions. This is straight-
forward for most states with one or two year sessions, except for New Jersey and Virginia
that start their two-year session in even years. Groups are not double counted. If a group
registers in both 2011 and 2012 in Massachusetts, it is only reported once. I also do not
account for how many different lobbyists a group or firm employs, nor the number of times
that they lobby in a session. These lobbying data do not indicate if lobbying was targeted
at the upper or lower house, so later I will aggregate those bills together as well.
The last column of Table 14 shows that there subject data for the groups in the Institute
is unavailable. On the legacy Institute website, the Institute did categorize some groups by
sector. Unfortunately, 61.1 percent of these groups were not coded. There is no pattern to
the missingness in these data. The share of uncoded groups does not vary much over time.
It is not explained by geography either, 24 percent of Alaska groups are not categorized
93
and 76 percent of Montana groups are not categorized. In addition to being incomplete,
an issue with these codes is that there is little transparency in how they are generated.
The Institute only says that their system is “closely modeled” on the federal government’s
system.4 For these reasons, I choose not to use these data.
The last column of Table 14 also shows how the different states do have industry codes for
the groups in these data. Tables 17 & 18 show how these codes were aligned across the 15
policy areas (Gray et al., 2005). In many cases the alignment is clear: “Health care” in
Pennsylvania corresponds to “Health care” in the US Congress. However, these pathways
are muddled in many instances. I account for this potential source of measurement error
by applying the decision rules listed in the Policy Agenda Project’s codebook, specifically
the version written for the Pennsylvania Policy Agendas Project (McLaughlin et al., 2010)5
that is more sensitive to state-level specific issues. The second column of Table 17 indicates
the major topic code of each of these policy areas, except for manufacturing, finance and
insurance, which are minor topic codes according to the Policy Agendas Project.
There are two important features of the subject codes to note in Tables 17 & 18. First,
there are gaps. For example, Massachusetts does not have a category for Agriculture. This
does not mean there are no dairy farmers in Massachusetts, just that there are not enough
for the state to produce a category; as a result, they probably file as a business association
and organization. Second, in 19, I list all of the unused subject categories for the legislative
venues. There is a general “business” category in all of these states, however, Gray and
Lowery’s subject coding scheme (that is in the third column of Table 17) does not have
4The Institute does address this issue for individual contributions, writing: “While identifying and codingmajor labor and industry contributions is relatively straightforward, doing so for individual contributors canbe more difficult. In many cases, the state requires that contributors provide the campaigns with theiroccupation and/or employer. When that information is available, the Institute uses it to assign a categorycode for individual contributors. When that information is not required or candidates do not provideit, the staff uses standard research tools to determine an economic or political identity. Contributors forwhom researchers cannot determine an economic interest from the information available receive a codeindicating their interest is Unknown.” I assume they take a similar approach to the lobbying data. Source:followthemoney.org/our-data/about-our-data/
5This version of the Comparative Agendas Project is hosted by Temple University: http://www.cla.
temple.edu/papolicy/.
94
such a broad category. For this reason, I drop all of those extra-broad delineations. Also of
note, is that Gray and Lowery differentiate policy sectors by the type of industry, not by
the status of individuals in that industry. In other words they do not separate firms from
individual proprietors or unions. In Chapters 4 and 5, using a different set of legislative data
(roll-call votes) I do make this delineation, in part because there are theoretical explanations
for why those groups lobby differently. However, in order to replicate their schema as close
as possible I do not draw that distinction in this chapter.
In section 2, I discuss how I used the keywords in the third column of Table 17 are used
to estimates the number of bills on every state legislative agenda that fit into the 15 policy
sectors. In section 3, I discuss how I estimated the policy sectors of the groups in the
Institute’s 50 state directory.
95

Table 17: Coding scheme for LexisNexis and lobbying subjects in the U.S. Congress(1) (2) (3) (4)
Policy Sector PAP LexisNexis U.S. Congress
Single Issues 200 Guns Gun Control Gun RightsAbortion Human Rights Misc. IssuesWomen Women’s IssuesCivil Rights Abortion Policy/Anti- (& Pro-) Abortion
Health 300 Health Health Services/HMOs Health ProfessionalsPharmaceuticals/Health Products Hospitals/Nursing Homes
Misc. Health
Agriculture 400 Agriculture Tobacco DairyPoultry & Eggs LivestockAgricultural Services/Products Misc. AgricultureCrop Production & Basic Processing
Education 600 Education Education
Utilities 700 Utilities Electric Utilities Telephone Utilities
Natural resources 800 Gas Oil & Gas Misc. EnergyOil MiningMinerals
Transportation 1000 Highways Air Transport AutomotiveTransit Trucking RailroadsAirports Sea Transport Misc. Transport
Transportation Unions
Law 1200 Legal Lawyers/Law Firms
Welfare 1300 Social Services Non-Profit InstitutionsCharities
Construction 1400 Construction General Contractors Home BuildersConstruction Services Building Materials & EquipmentBuilding Trade Unions
Finance 1500 Banking Misc. Finance Commercial BanksReal Estate Savings & Loans Finance/Credit Companies
Securities & Investment Real EstateMisc. Business
Insurance 1510 Insurance Insurance
Manufacturing 1520 Manufacturing Electronics Mfg. & Equip. Misc. Manufacturing & Distributing
Communications 1700 Media Telecomm Services Misc. Communications/ElectronicsTelecommunications Internet
Local Government 2400 Municipality Public Sector UnionsPublic EmployeesPoliceFire
96

Table 18: Coding scheme and lobbying subjects for Penn., Colorado, and Mass.Policy Sector Pennsylvania Colorado Massachusetts
Single Issues FirearmsPublic InterestWomen’s/Reproductive Issues
Health Health Care Health care/Medical Hospitals: Health Care Systems, Medical OrganizationsMental Health Insurance: Medical, Dental, Mental Health
Pharmaceutical Industry
Agriculture Agriculture Agriculture
Education Education Education Education: Institutions, Services, Programs
Utilities Utilities UtilitiesNatural Resources
Natural resources Energy Energy Energy: Petroleum, Hydro, Nuclear, OilMining
Transportation Motor Vehicle Automotive, Transportation Automotive IndustryTransportation Transportation: Air, Sea, Land, Rail
Law Legal Attorney/Legal Legal Organizations and Services
Welfare Human Services Human Services
Construction Construction Construction/Engineering Contractors and Subcontractors
Finance Banking/Finance Real Estate Banking: Lending, Investment
Real Estate Financial/Investment Real Estate: Development and Property
Insurance Insurance Insurance Insurance: Auto, Home, Life, Other
Manufacturing Industry/Manufacturing Manufacturing
Communications Media Media/Public RelationsTelecommunications
Local Government Government Firefighters/Paramedics Government: Agencies, Associations, OrganizationsGovernment/Civil Police, Fire, Law Enforcement OrganizationsLaw Enforcement
97

Table 19: Unused categories from organization reportsCongress Pennsylvania Colorado Massachusetts
Accountants Leadership PACs Accounting Clergy/Faith-based Business Assoc. & Orgs.Beer, Wine & Liquor Lobbyists Alcoholic Bev. Consultant Environ.: Recyc., Packag., Pollut.Business Associations Lodging/Tourism Biotechnology Rec./Entertain. Food & Bev.: Industry, ServicesBusiness Services Marijuana Business Environ. Srvcs. Gaming: Casinos, GamblingCandidate Comm. Misc. Defense Commerce Food Services High TechnologyCandidate Self-finance Misc. Issues Environment Gaming Labor Unions, PACsCasinos/Gambling Misc Services Food Proc./Sales General Business Lobbying OrganizationsChemical & Related Manuf. Misc Unions Food Service Labor Unions OtherCivil Servants/Public Off. No Employer Listed* Forest Products Merch./Retail Tobacco & AlcoholClergy & Religious Orgs. Non-contribution Information Tech. Military Travel, Tourism, Entert.Defense Aerospace Non-Profit Institutions Labor Union OtherDefense Electronics Other Other Political Orgs.Democratic/Liberal Party Comm. Transfer Rec./Entertain. Science/TechnologyEmployer Listed* Party Committees ReligiousEnvironment Printing & Publishing Retail SalesEnvironmental Svcs/Eqpmt Pro-Israel TobaccoFisheries & Wildlife Recreation/Live Entertain. TourismFood & Beverage Republican/Conservative Wagering/GamingFood Processing & Sales Retail Sales Waste Mgmt.Foreign & Defense Policy Retired Workers’ Comp.Forestry & Forest Products Special Trade ContractorsGeneric Occupation* Steel ProductionHomemakers TextilesHuman Rights TV/Movies/MusicIndustrial Unions UnknownJoint Candidate Cmte Waste Mgmt .
*Also includes “Category Unknown”
98

A.2. Estimating the subject matter of bills introduced in the states
Estimating the subject matter of bills in state legislatures in a difficult task. In Chapter
5 I use estimates of the agenda from the 26 states that systematically report the subject
matter of their legislation, which the Open States project has standardized. However, this
chapter addresses all 50 states, so I needed a more expansive look at the states. I followed
the approach Gray et al. (2005) used to estimate the agenda using LexisNexis, with only
minor modifications.
The operation takes place within LexisNexis State Capital Universe6. I use the “Bill Track-
ing by Keyword” function. For each policy, I search for the keywords specified in column
(3) of Table 17. I input the keywords (e.g. “education”) in the “Synopsis only” box, as
well as the session (“2011”), state (“Illinois”) and a calendar limitation if the search returns
more than 1000 entries. Running this procedure for 15 policies in 50 states over 10 years
would require 7500 individual searches. Therefore I automated this process using iMacros.7
LexisNexis allows users to export the citations from all the bills for a certain search via
e-mail. For example, here is a single citation.
138. 2015 Bill Tracking MN S.B. 2191, 89TH REGULAR SESSION, SENATE BILL 2191,DATE-INTRO: MAY 15, 2015, LAST-ACTION: MARCH 24, 2016; Rereferred to SEN-ATE Committee on FINANCE., Relates to agriculture; establishes a pollinator investmentgrant program; appropriates money; awards a pollinator investment grant to a person whoimplements best management practices to protect wild and managed insect pollinators in thisstate., MINNESOTA BILL TRACKING Copyright 2016 LexisNexis. All Rights Reserved.
I imported this unformatted text into STATA, and using regular expressions, pulled out
the 1) session of introduction, 2) bill prefix (which indicates which chamber the bill was
introduced in), 3) bill number. This allows me to create a registry of all the bills introduced
across sessions for each individual policy in each state legislature. These are not exclusive
categories, a bill can be assigned to more than one category, so I also collected the total
6Made available via the University of Pennsylvania’s library subscription.7A free plugin for Mozilla Firefox is available at http://imacros.net/overview.
99
number of bills in each session to estimate how much of the agenda each policy occupied.
The above procedure closely follows the procedure in Gray et al. (2005) and Baumgartner,
Gray, and Lowery (2009), with only a few minor modifications. First, I added a subject code.
Column (1) of Table 17 shows the 14 codes Gray et al. (2005) use, I added “Single-Issues,”
that addresses the policies single-issue groups on both sides of the aisle are concerned with:
abortion, gun control and women’s issues. I included these groups to observe the amount of
the agenda occupied by advocacy organization groups, which are at the heart of the model
in Chapter 4.
The second modification relates to the search procedure in LexisNexis. Gray et al. (2005) use
LexisNexis’ “Subject” search, and I used “Synopsis” search. I used the latter option because
it is available after 2012, whereas the “subject” function ends in 2012. This difference
highlights a challenge to working with LexisNexis. They are not transparent in how they
code bills, as they use a proprietary formula, and they limit requests for both search queries
and downloads of information. Regardless of the origin of each method, I validated the bill
introductions based on the data I use in Chapter 5 that is drawn from the states that report
the policy content of their own bills to show that the “synopsis” method was sufficient and
it was; it fact it outperformed the “subject” search by producing fewer false positives.
Another issue is that LexisNexis keeps multiple records in its database for the same bill.
(Baumgartner, Gray, and Lowery, 2009, p. 14) note how LexisNexis had five versions of an
appropriations bill in Alabama, one for the introduced version, three for updates and the
enacted version. This was consistent with my experience with the tracker search as well.
There is variation across the states in how they report the latest activity on a bill. The
common thread is that every bill in the database was introduced. Therefore, I can collapse
the bill citation down by its prefix, bill number, session of introduction, and chamber. Any
further activity on bills is beyond the scope of this project.
Like Gray and Lowery (1995), I only use bills introduced during regular sessions. As an
100
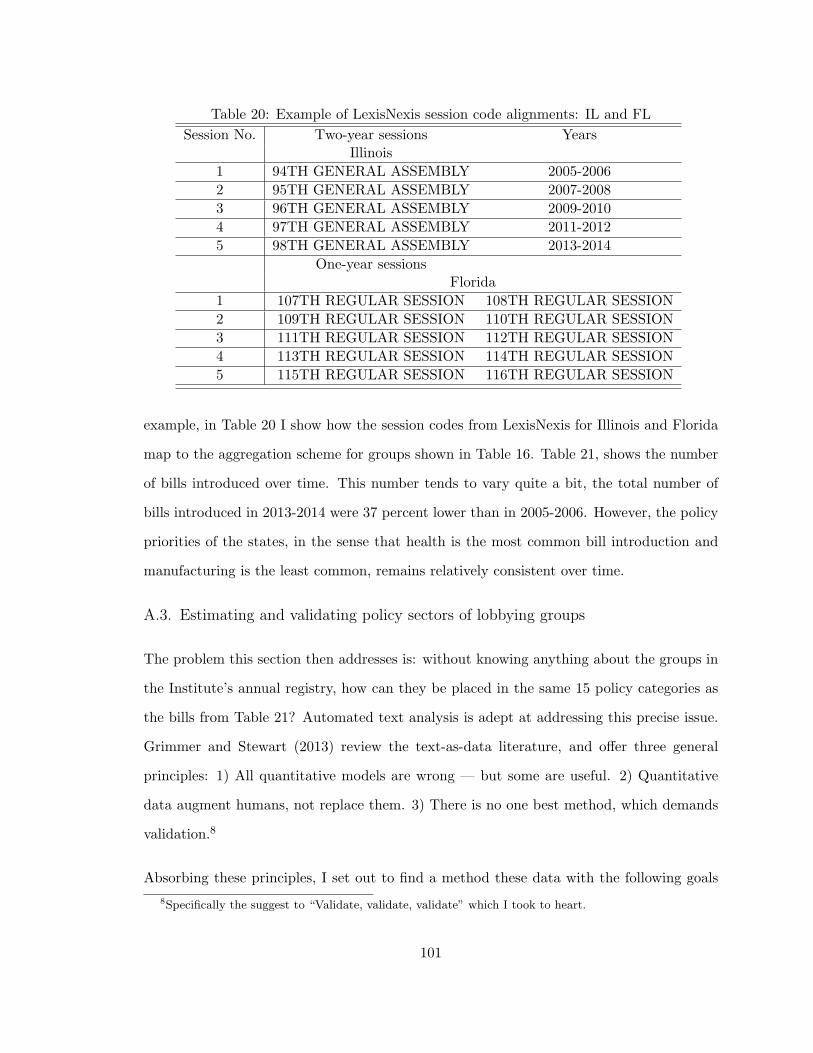
Table 20: Example of LexisNexis session code alignments: IL and FL
Session No. Two-year sessions YearsIllinois
1 94TH GENERAL ASSEMBLY 2005-2006
2 95TH GENERAL ASSEMBLY 2007-2008
3 96TH GENERAL ASSEMBLY 2009-2010
4 97TH GENERAL ASSEMBLY 2011-2012
5 98TH GENERAL ASSEMBLY 2013-2014
One-year sessionsFlorida
1 107TH REGULAR SESSION 108TH REGULAR SESSION
2 109TH REGULAR SESSION 110TH REGULAR SESSION
3 111TH REGULAR SESSION 112TH REGULAR SESSION
4 113TH REGULAR SESSION 114TH REGULAR SESSION
5 115TH REGULAR SESSION 116TH REGULAR SESSION
example, in Table 20 I show how the session codes from LexisNexis for Illinois and Florida
map to the aggregation scheme for groups shown in Table 16. Table 21, shows the number
of bills introduced over time. This number tends to vary quite a bit, the total number of
bills introduced in 2013-2014 were 37 percent lower than in 2005-2006. However, the policy
priorities of the states, in the sense that health is the most common bill introduction and
manufacturing is the least common, remains relatively consistent over time.
A.3. Estimating and validating policy sectors of lobbying groups
The problem this section then addresses is: without knowing anything about the groups in
the Institute’s annual registry, how can they be placed in the same 15 policy categories as
the bills from Table 21? Automated text analysis is adept at addressing this precise issue.
Grimmer and Stewart (2013) review the text-as-data literature, and offer three general
principles: 1) All quantitative models are wrong — but some are useful. 2) Quantitative
data augment humans, not replace them. 3) There is no one best method, which demands
validation.8
Absorbing these principles, I set out to find a method these data with the following goals
8Specifically the suggest to “Validate, validate, validate” which I took to heart.
101
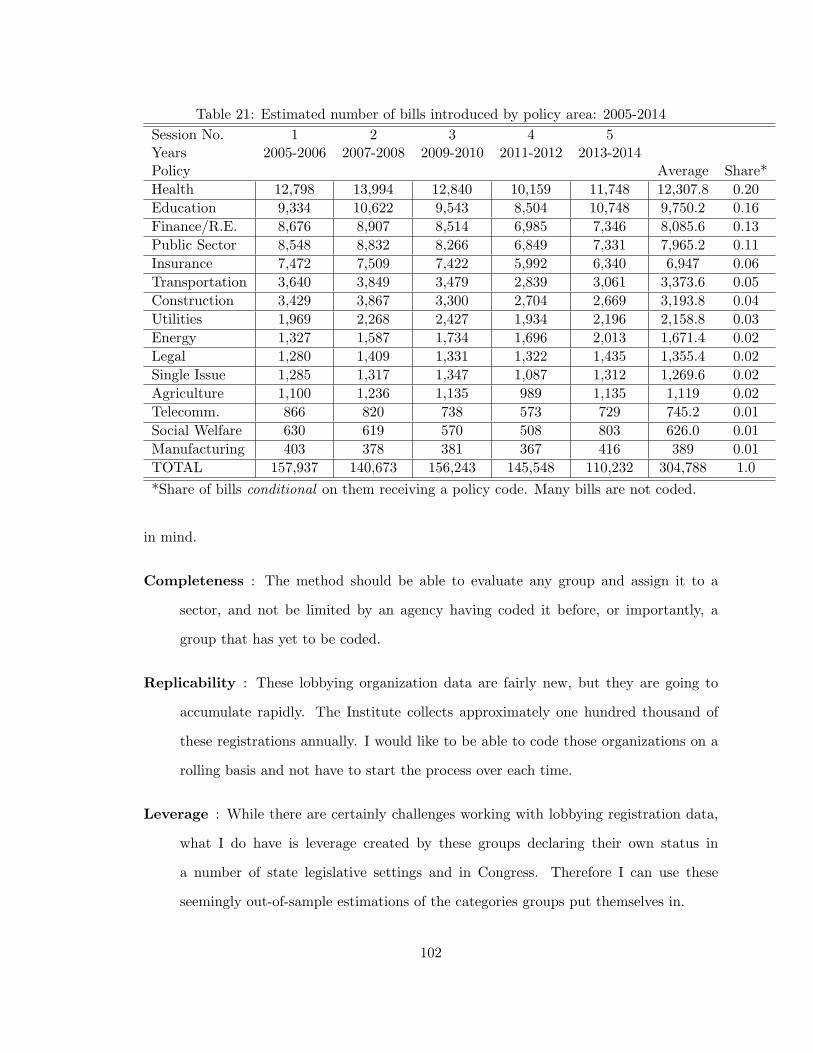
Table 21: Estimated number of bills introduced by policy area: 2005-2014
Session No. 1 2 3 4 5Years 2005-2006 2007-2008 2009-2010 2011-2012 2013-2014Policy Average Share*
Health 12,798 13,994 12,840 10,159 11,748 12,307.8 0.20
Education 9,334 10,622 9,543 8,504 10,748 9,750.2 0.16
Finance/R.E. 8,676 8,907 8,514 6,985 7,346 8,085.6 0.13
Public Sector 8,548 8,832 8,266 6,849 7,331 7,965.2 0.11
Insurance 7,472 7,509 7,422 5,992 6,340 6,947 0.06
Transportation 3,640 3,849 3,479 2,839 3,061 3,373.6 0.05
Construction 3,429 3,867 3,300 2,704 2,669 3,193.8 0.04
Utilities 1,969 2,268 2,427 1,934 2,196 2,158.8 0.03
Energy 1,327 1,587 1,734 1,696 2,013 1,671.4 0.02
Legal 1,280 1,409 1,331 1,322 1,435 1,355.4 0.02
Single Issue 1,285 1,317 1,347 1,087 1,312 1,269.6 0.02
Agriculture 1,100 1,236 1,135 989 1,135 1,119 0.02
Telecomm. 866 820 738 573 729 745.2 0.01
Social Welfare 630 619 570 508 803 626.0 0.01
Manufacturing 403 378 381 367 416 389 0.01
TOTAL 157,937 140,673 156,243 145,548 110,232 304,788 1.0
*Share of bills conditional on them receiving a policy code. Many bills are not coded.
in mind.
Completeness : The method should be able to evaluate any group and assign it to a
sector, and not be limited by an agency having coded it before, or importantly, a
group that has yet to be coded.
Replicability : These lobbying organization data are fairly new, but they are going to
accumulate rapidly. The Institute collects approximately one hundred thousand of
these registrations annually. I would like to be able to code those organizations on a
rolling basis and not have to start the process over each time.
Leverage : While there are certainly challenges working with lobbying registration data,
what I do have is leverage created by these groups declaring their own status in
a number of state legislative settings and in Congress. Therefore I can use these
seemingly out-of-sample estimations of the categories groups put themselves in.
102
Applicability : The goal of these data is to use them for inference in the context of state
legislatures, so the estimation and validation procedures need to keep that venue in
mind as the ultimate purpose.
These estimates will be judged against the dataset used by Gray and Lowery in their
numerous works on interest group density (Lowery et al., 2004, e.g.). Gray and Lowery
used student research assistants to hand-code groups by industry. This is an extremely time
intensive task, and therefore they produce cross-sectional censuses about once a decade. The
text analysis that I describe in this chapter should be able to be produced annually once
the groups that registered to lobby in that year are released.
A.3.1. The problem
For an actual example of this problem, how should a human coder assign: 1st Farm Credit
Services, to a category in Table 17. Since it deals with farms, the first thought a coder may
have is to place it in agriculture. If the coder could look at the groups website, he would
learn: “1st Farm Credit Services, based in Normal, Illinois, is the largest agricultural lender
in Illinois. We serve farmers and those who invest in rural America, who live and work in
the northern 42 counties, with all of their agricultural credit and financial needs.” With
that information in mind, there is a chance that this could be a financial institution as it
explicitly helps farmers with their “financial” needs. So t is either in the agriculture sector
or the financial sector, but how does one decide?
According to the Policy Agendas Project codebook this group could fall under Agriculture
as: 400: “family farmers, farm program administration” or it could be under Finance as
“1521: small business credit availability” or it could even fall under Foreign Trade as “1803:
state efforts to promote foreign trade for Pennsylvania companies and farmers.” But these
codes should be exclusive, so the method will assign this group to a single category.
103
A.3.2. Automated text classification
To meet these goals, I chose to use a dictionary based method. In practice, I use the lobbying
registrations from the U.S. Congress, Colorado and Pennsylvania to form a training set. I
then take a “bag of words” approach that takes all of the group names in a policy area,
cleans them using STATA’s txttool program and a list of stop words, and then counts the
instances of each word in the sector. I then match the words in the target set to the these
bag of words and determine which bag is the best fit. This assigns each group a policy.
I then compare the groups in Massachusetts to the sectors they listed in the Secretary of
State’s registry. This allows me to objectively grade the estimation method.
In the following section, I go over the technical details of this method.
Dictionary method in action
The dictionary based method has long been considered the most intuitive automated method
(Stone, Dunphy, and Smith, 1966). Grimmer and Stewart (2013) define it as a method to
“use the rate at which key words appear in a text to classify documents into categories
or to measure the extent to which documents belong to particular categories.” In my case
the documents are the client names of lobbyists registering their activity before the U.S.
Congress and three state legislatures. This task specifically requires finding the words
that most effectively separate the categories. A common application is sentiment, where
dictionaries of positive and negative words are used to infer the general sentiment of a
document.
My application, assigning interest groups to one of 15 categories, is more complicated than
a binary dictionary. Therefore, I use a supervised learning method called the Naıve Bayes
approach, which has a simple but powerful approach (Grimmer and Stewart, 2013).9 The
9A useful explanation, with equations, is available from the software engineer AhmetTaspinar on the Data Science Central blog http://www.datasciencecentral.com/profiles/blogs/
text-classification-sentiment-analysis-tutorial-blog 11 January 2016.
104
procedure is to code a portion of the documents to create a training set to learn about the
distribution of words in each category. Then using a “bag of words” approach, I remove
a set of common words and geographical identifiers. This should leave words that are
unique to the different categories. That distribution is then used to classify each of the
documents in the test set. The test set is then matched against the corpus of words, and
the a naıve probability is attached to it. This conditional probability is then multiplied by
its posterior probability, that is calculated by looking at the overall distribution of possible
categorizations (Grimmer and Stewart, 2013, p. 11).
Technical Details
Schutze, Manning, and Raghavan (2008) provide a step by step procedure for finding the
best class for a document. This subsection will report this procedure using mathematical
equations. For an intuitive explanation of this process, and to walk through an actual
estimation of a group’s sector, see the following subsection “Estimation Example.”
The first step is to estimate the conditional probability for each document, shown in Equa-
tion A.1, where Nc is the number of documents matching the word in class c and N is the
total number of documents in the class.
Pc =Nc
N(A.1)
The next step is finding the best class for those words, which they define as “the most likely
or maximum a priori (MAP) class.” A priori in this case implies taking into consideration
the chance of each class of occurring itself. By being able to examine the universe of
lobbying registrations by subject, I can estimate this a priori belief. Table 22 reports these
expectations from the training dataset.
With these expectations in mind, (Schutze, Manning, and Raghavan, 2008, p. 258) provide
105

Table 22: Posterior probabilities for the 15 policy areas
Policy Sector Count Posterior Probability
1 Health 10161 0.220
2 Finance 6034 0.130
3 Education 5545 0.120
4 Energy 4167 0.090
5 Transportation 3955 0.085
6 Manufacturing 3689 0.080
7 Construction 1915 0.041
8 Single Issue 1872 0.040
9 Social Welfare 1771 0.038
10 Agriculture 1413 0.031
11 Legal 1387 0.030
12 Utilities 1182 0.026
13 Insurance 1096 0.024
14 Public Sector 1062 0.023
15 Telecommunications 1011 0.022
Total 46260 1.000
the following equation for determining the “best” class for each document.
cmap = argmaxc∈C
P (cd) = argmaxc∈C
P (c)∏
1≤k≤nd
P (tk|C) (A.2)
In equation A.2, many conditional probabilities are multiplied together. Schutze, Manning,
and Raghavan (2008) report that this can result in floating point underflow, and suggest
that it is better to add logarithms of probabilities instead of multiplying probabilities. To
eliminate zeroes, they suggest using add-one or LaPlace smoothing, where 1 is added to
each count before the logarithm is taken. This is the conditional probability for each term,
not the prior probability of the class which is reported in Table 22. Equation A.3 provides
an updated equation for estimating this probability, where B = |V | is the number of terms
in the vocabulary.
P (t|d) = Tct + 1∑t′∈V (Tct′ + 1)
=Tct + 1∑
t′∈V Tct′ +B′ (A.3)
106

Table 23: Example of automated text classification procedure
Word Agriculture Financial Insurance Education
(1) 1st 0 2 0 0farm 38 5 7 1credit 4 91 3 2
(2) Total (of 46260) 1413 6034 1096 5545
(3) Class Probability 0.030 0.130 0.024 0.120
(4) Bayes Estimate 0.000114 0.000162 0.000075 0.000068
(5) Category Rank 2 1 3 4
Estimation Example
I return to “1st Farm Credit Services” to demonstrate the classification scheme in action.
The first step is to build out the full contingency table, with all of the words in each
policy’s bag, as well as their frequencies. The total number of words was used to calculate
the posterior probabilities in Table 22. Next, I match each word from the group’s name
with the bag of words for each policy sector.
In Table 23, the first column shows the word “farm” appears in the Agriculture set 38 times,
far more than in the other categories, for example “farm” was only found 5 times in the
Financial bag. It also shows the relative sizes of those bags: there are 1413 words in the
Agriculture set and 6034 words in the Financial set.
Using Equation A.1, “farm” is actually a stronger predictor of Agriculture (38/1413 =
0.026) than “credit” is for Financial (91/6034 = 0.015) despite the fact that there are more
matches for “credit” in the Financial set. However, the procedure accounts for the fact
that Financial is a larger bag, which means “credit” is less unique. This rewards “farm” in
Agriculture because it is a more unique identifier. If this group’s full name was only: “Farm
Services” it would be coded as Agriculture and not Financial.
However, there are three other words that are not on the stop list in this title, so they need
to be taken into account. In Equations A.4 - A.7, I report the procedure for producing
the Bayes estimate in row (4), using the probabilities of the entire term belonging to each
107

class. First, “Services” is dropped because it is not a unique identifier across the policy
areas. Next, the conditional probability of each word is estimated for each class. After the
log + 1 is taken, the conditional probabilities are multiplied by our prior, which is the class
probability from row (3). The classes are then ranked highest to lowest, according to the
Bayes Estimate.
P (CAgr) = (log(0+1)/1413+log(38+1)/1413+log(4+1)/1413) ·0.030 = 1.14 ·10−4 (A.4)
P (CFin) = (log(2+1)/6034+log(5+1)/6034+log(91+1)/6034) ·0.130 = 1.62 ·10−4 (A.5)
P (CIns) = (log(0+1)/1096+ log(7+1)/1096+ log(3+1)/1096) ·0.024 = 0.75 ·10−4 (A.6)
P (CEdu) = (log(0+1)/5545+log(1+1)/5545+log(2+1)/5545) ·0.120 = 0.68 ·10−4 (A.7)
Incorporating the prior at the end weighs the relative sizes of the policy bags in a different
light. Earlier, when calculating the conditional probability of individual terms, the smaller
size of Agriculture weighed its matches stronger than the matches in Finance, because the
Agriculture term “farm” was more unique than the Financial term “credit.” However,
in the last stage, when the summed conditional probabilities are multiplied by the prior
probability the relative size of finance advantages it against agriculture. This will make the
final distribution of estimations more closely resemble the training distribution.
In this case, “1st Farm Financial Services” is coded as being in the Financial Sector.
A.3.3. Internal validation
There are a number of researcher degrees of freedom in estimating these quantities. For
example, within the Naıve Bayes framework, the counts from the three states could all be
estimated individually or pooled together (I pool them together) or I could change the stop
words I use. Dropping “services” from our example ignored 25 percent of the words in the
108
document. The purpose of this section is not to argue for these choices, but rather to report
the method that produces estimates that most closely represent reality.
Instead of evaluating these decisions on their merits, I validate them using the test set.
In this case, the test set is lobbying registrations from Massachusetts. This provides an
objective set of “answers” to the question I posed earlier in this section. Table 24 demon-
strates the performance of the model using two versions of each of the following three coding
decisions:
1. The first decision was to use a list of stop words or not. Naıve Bayes can be run
on the full distribution of words. Using stop words give the researcher to highlight
words that appear in multiple categories and are antithetical to the goal of finding
the unique words that identify different categories. Therefore I removed geographic
terms (e.g. “Colorado”, “America”, “Keystone”), common suffixes (e.g. “Inc.”), and
basic words (e.g. “Services”).
2. The second decision was whether to pool the venues together (such that all of the
groups in Congress, Colorado and Pennsylvania are put into one large bag of words)
vs. weighing them — i.e. running Equation A.4 with 12 conditional probabilities, one
for each word in each venue. The advantages to weighing the terms would be if there
was a different pattern of naming conventions by policy in the states than there is in
Congress. Congress is the largest population, so pooling them together gives it more
influence than the two state venues.
3. Use the log + 1 correction suggested by Schutze, Manning, and Raghavan (2008).
For evaluation criteria, (Schutze, Manning, and Raghavan, 2008, p. 154-155) write that a
model can be judged by its precision and retrieval. Precision is the share of estimations
that are correct. Recall is the share of possibly relevant documents that are retrieved.
They suggest balancing these two criteria by calculating an F-score, which is the weighted
harmonic mean of precision and recall show in equation A.8.
109

F1 =2PR
P +R(A.8)
where P is precision, and R is recall.
Table 24 shows the performance of each of these iterations on the Massachusetts data. Row
2 shows the best run of the model, which uses the list of stop words, pools the terms across
the venues, and applies the log + 1 correction. It is not the method that classifies the most
possible terms (if term does not match any of the bags it does receive an estimate), but it
has the highest combination of precision and recall.
Because of measurement error with the Massachusetts data, these are artificially low esti-
mates. There were 5,224 groups in the Massachusetts data, but only 3,463 or 66 percent
had codes that mapped on to the Gray and Lowery codes. The footnote in Table 24 reveals
that if I hand-coded these uncoded groups, over half would have been hits. Therefore, not
only does Table 24 show which is the best of these eight possible iterations, it also shows
that the method has an acceptable degree of precision and recall. The method assigns a
lobbying group to one of 15 groups, and the researcher can more confident than not that
this would be the same category that a group would have registered with in Massachusetts.
Furthermore, looking at the total distribution, at least three out of four groups are in the
correct category, again out of 15 possible choices.
Moving to the larger set of data, I add the Massachusetts data to the training set to expand
its reach. I then repeat the whole process, using only a larger list of stop words.10
Table 25 shows the estimates aggregated to policy type over the years. Of note, it shows
that only 10 percent of groups went uncategorized, an improvement over the 66 percent
of groups in the Institute’s classification that were unknown. The most common group
10To discard terms that hurt more than they help, I use a stop list of 1,557 words and misspellings includingnumbers (1,2,3,...,11811061), locations (akron, alabama, alaskan, etc.), common groupings (association,associates, board, corporation, league, services, etc.), solo letters (f, j, k, etc.), suffixes (junior, llc, inc, corp,etc.) and geographical fixtures (mountain, ocean, riverside, etc.). I will post this list on dataverse when theestimates are published.
110

Table 24: Validation Exercise: Testing Different Naıve Bayes Models on Massachusetts
Stop Words Pool Log Hits Total Classified Precision Recall† F1-Score
1 Yes Yes No 1653 4575 0.36 0.48 0.41
2 Yes Yes Yes 1711 4575 0.37 0.49 0.43*
3 Yes No No 1052 2495 0.42 0.30 0.35
4 Yes No Yes 1089 2633 0.41 0.31 0.36
5 No Yes No 1468 5043 0.29 0.42 0.35
6 No Yes Yes 1570 5043 0.31 0.45 0.37
7 No No No 189 365 0.52 0.05 0.10
8 No No Yes 195 386 0.51 0.06 0.10
†There were 5224 registered orgs in Mass., 3463 with eligible codes.
*Accounting for missingness, by hand coding: 54% of uncoded organizations would have been correct,
38% would not be correct, 7% were not discernible.
With corrections, estimates would be: Precision: 0.54, Recall: 0.72, F1: 0.62
estimates: Health, Finance and Education, also had the highest posterior probabilities,
however, that pattern did not hold all the way down. There is still a missing data issue
to a certain degree, which is that only 18 states had registrations for the year 2005, so
the 2005-2006 aggregate period is artificially lower than other periods. For this reason,
I drop these estimates in the empirical analysis in Chapter 3. I next turn to two other
validity criteria to ask: do these estimates meet expectations about group activity we could
form by considering current events? Do these estimates agree with estimates in the current
literature?
A.3.4. External validation
Quinn et al. (2010) and Grimmer and Stewart (2013) argue that external events, such as
sudden increases in attention to a topic, should be able to validate a topic classification
scheme. I examine the results of my data were three such events in mind. I have chosen
events that highlight three features of the data: variation across time in a single state, cross-
sectional variance across the country altogether over time, and regional variation within the
country over time. These three events reveal not only the validity of the estimates, but also
the strengths of this dataset to address important political processes.
111
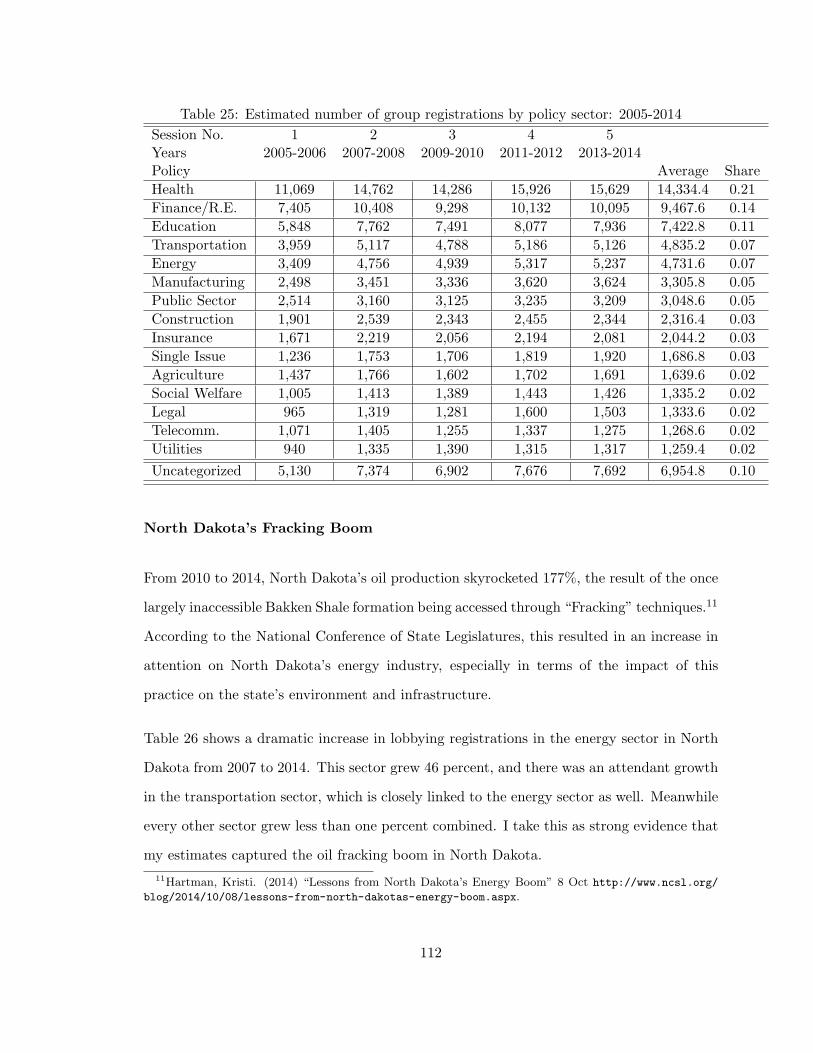
Table 25: Estimated number of group registrations by policy sector: 2005-2014
Session No. 1 2 3 4 5Years 2005-2006 2007-2008 2009-2010 2011-2012 2013-2014Policy Average Share
Health 11,069 14,762 14,286 15,926 15,629 14,334.4 0.21
Finance/R.E. 7,405 10,408 9,298 10,132 10,095 9,467.6 0.14
Education 5,848 7,762 7,491 8,077 7,936 7,422.8 0.11
Transportation 3,959 5,117 4,788 5,186 5,126 4,835.2 0.07
Energy 3,409 4,756 4,939 5,317 5,237 4,731.6 0.07
Manufacturing 2,498 3,451 3,336 3,620 3,624 3,305.8 0.05
Public Sector 2,514 3,160 3,125 3,235 3,209 3,048.6 0.05
Construction 1,901 2,539 2,343 2,455 2,344 2,316.4 0.03
Insurance 1,671 2,219 2,056 2,194 2,081 2,044.2 0.03
Single Issue 1,236 1,753 1,706 1,819 1,920 1,686.8 0.03
Agriculture 1,437 1,766 1,602 1,702 1,691 1,639.6 0.02
Social Welfare 1,005 1,413 1,389 1,443 1,426 1,335.2 0.02
Legal 965 1,319 1,281 1,600 1,503 1,333.6 0.02
Telecomm. 1,071 1,405 1,255 1,337 1,275 1,268.6 0.02
Utilities 940 1,335 1,390 1,315 1,317 1,259.4 0.02
Uncategorized 5,130 7,374 6,902 7,676 7,692 6,954.8 0.10
North Dakota’s Fracking Boom
From 2010 to 2014, North Dakota’s oil production skyrocketed 177%, the result of the once
largely inaccessible Bakken Shale formation being accessed through “Fracking” techniques.11
According to the National Conference of State Legislatures, this resulted in an increase in
attention on North Dakota’s energy industry, especially in terms of the impact of this
practice on the state’s environment and infrastructure.
Table 26 shows a dramatic increase in lobbying registrations in the energy sector in North
Dakota from 2007 to 2014. This sector grew 46 percent, and there was an attendant growth
in the transportation sector, which is closely linked to the energy sector as well. Meanwhile
every other sector grew less than one percent combined. I take this as strong evidence that
my estimates captured the oil fracking boom in North Dakota.
11Hartman, Kristi. (2014) “Lessons from North Dakota’s Energy Boom” 8 Oct http://www.ncsl.org/
blog/2014/10/08/lessons-from-north-dakotas-energy-boom.aspx.
112
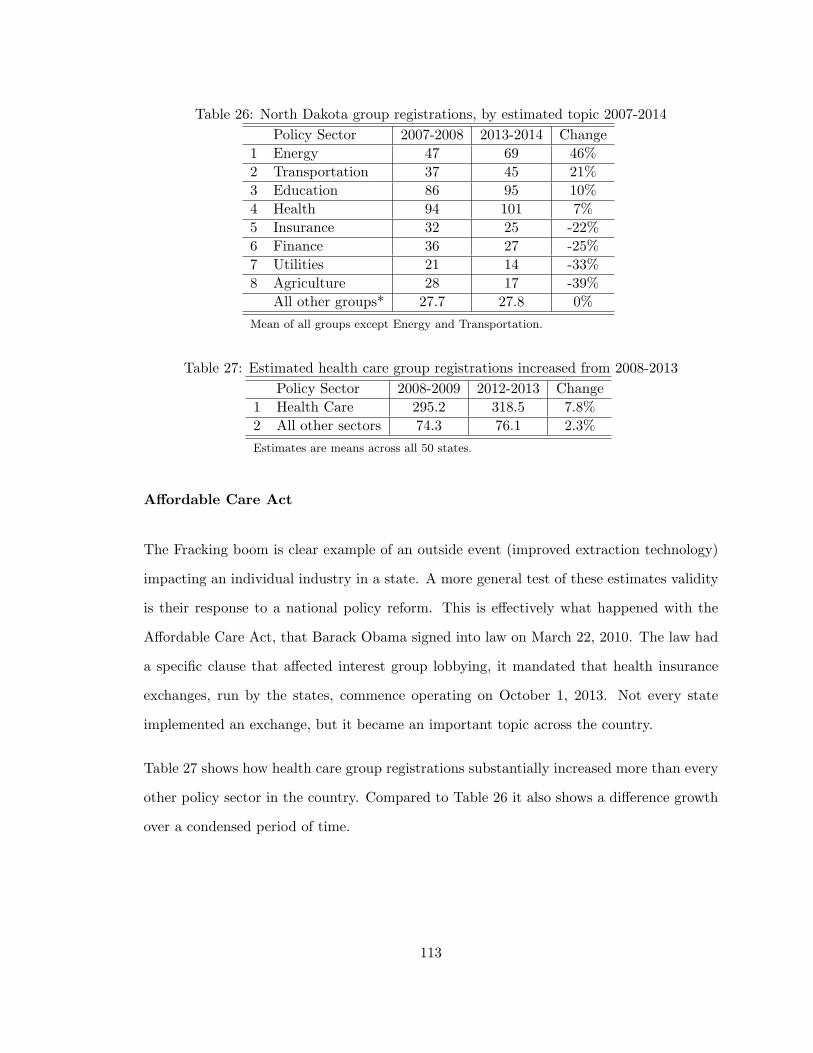
Table 26: North Dakota group registrations, by estimated topic 2007-2014
Policy Sector 2007-2008 2013-2014 Change
1 Energy 47 69 46%
2 Transportation 37 45 21%
3 Education 86 95 10%
4 Health 94 101 7%
5 Insurance 32 25 -22%
6 Finance 36 27 -25%
7 Utilities 21 14 -33%
8 Agriculture 28 17 -39%
All other groups* 27.7 27.8 0%
Mean of all groups except Energy and Transportation.
Table 27: Estimated health care group registrations increased from 2008-2013
Policy Sector 2008-2009 2012-2013 Change
1 Health Care 295.2 318.5 7.8%
2 All other sectors 74.3 76.1 2.3%
Estimates are means across all 50 states.
Affordable Care Act
The Fracking boom is clear example of an outside event (improved extraction technology)
impacting an individual industry in a state. A more general test of these estimates validity
is their response to a national policy reform. This is effectively what happened with the
Affordable Care Act, that Barack Obama signed into law on March 22, 2010. The law had
a specific clause that affected interest group lobbying, it mandated that health insurance
exchanges, run by the states, commence operating on October 1, 2013. Not every state
implemented an exchange, but it became an important topic across the country.
Table 27 shows how health care group registrations substantially increased more than every
other policy sector in the country. Compared to Table 26 it also shows a difference growth
over a condensed period of time.
113

Table 28: Estimates of manufacturing group registrations declined in the Rust Belt: 2008-2015.
States 2008-09 2010-11 2012-13 2014-2015 Change 08-15
Rust Belt* 96.8 87.8 90.3 88.3 -8.0%
Rest of Country 66.6 64.9 70.8 71.1 6.7%
Estimates are means. *Rust Belt: PA, WV, IN, OH.
Manufacturing
In order to show that these changes are not all positive and monotonic, I also check the
model’s validity with a quantity that should theoretically declined over this period. This is
a bit of a challenge, as many exogenous shocks to a market, such as the housing crisis that
hit Florida and the Southwest particularly hard, actually lead to more lobbying group regis-
trations as businesses pursue bailouts. Therefore, it is more useful if firms are moving their
business elsewhere, instead of fighting to stay open. In this case I look at Manufacturing,
specifically to see if it has declined in the rust belt. In the late 20th century manufacturing
was declining precipitously in the core rust belt states of Pennsylvania, Ohio, West Virginia
and Indiana (Kahn, 1999). Table 28 shows that interest group registrations in manufac-
turing actually increased across the country from 2007 to 2014; however, they declined by
eight percent in the Rust Belt states, another successful validation of these estimates.
A.3.5. Concurrent validation
The third validation strategy is to compare these estimates with estimates already employed
in the literature. Specifically, this section will compare these estimates against the 2007
data used in Gray et al. (2014), which are made available on Michigan State University’s
Correlates of State Public Policy dataset (Jordan and Grossmann, 2016). Gray and Lowery’s
dataset, which they use in a number of articles with other colleagues, is a gold standard in
the state politics interest group sub field. The authors and their research assistants divide
all groups into policy sectors and group type.12
12The next step for this project will be attempting to separate the groups by the types discussed inChapter 4.
114

This is a time-consuming affair, as there are tens of thousands of registrations in the United
States annually. As a result, these authors only conduct this exercise every ten years. In
Tables 29 & 30 I compare my results to the aggregated version of their results released in
the IPPSR Correlates publicly available dataset.
Gray and Lowery report a similar aggregate total number of organizations to the Institute
(54K to 52K), and there is a high correlation between the two sets of estimates. The first
row of results in Table 29 shows that in 2007 there is a 0.98 correlation between the total
number of groups registered to lobby in each dataset. If these state-by-state estimates are
broken out by policy type, the correlation is 0.71. What explains these discrepancies? Table
29 shows that my method estimates a higher share of the possible groups. In other words,
Gray and Lowery leave more groups as uncategorized. This affects the total distribution of
groups. I estimate that 20 percent of groups registered to lobby in 2007 were in the health
care field, while they estimate that only 13 percent of those groups are in health care.
A second discrepancy is that Gray and Lowery report there being approximately 2,500 fewer
registrations in 2007. This difference can be reconciled using an outside data source. For
my text estimation procedure, I have the Colorado Secretary of State’s registry of groups
in 2007. For this year the Institute reports Colorado having 1,050 groups and Gray and
Lowery report 991. After running some text cleaning procedures on the Secretary of State’s
raw data and removing duplicates, Colorado is estimated to have 1,114 groups.13 This is
closer to the Institute’s estimate than Gray and Lowery’s.
Beauty is in the eye of the beholder though, so I list the policy sector estimates of the
smallest state in the 2007 data (Hawaii) for the reader’s benefit in Table 31. On the whole,
the estimates are generally where one would expect them to be. A few notable exceptions,
however, demonstrate sacrifices that were made to create this dataset. For example, the
13There were 10,024 lobbying reports in Colorado attributed to 1,150 unique groups in 2007. After cleaningthe names of these groups using txttool on STATA with the following stop words: “colorado”, “colo”, ”co”,36 of these groups were removed. A more thorough cleaning process could reduce further redundancies suchas “verizon” vs. “verizon wireless.”
115
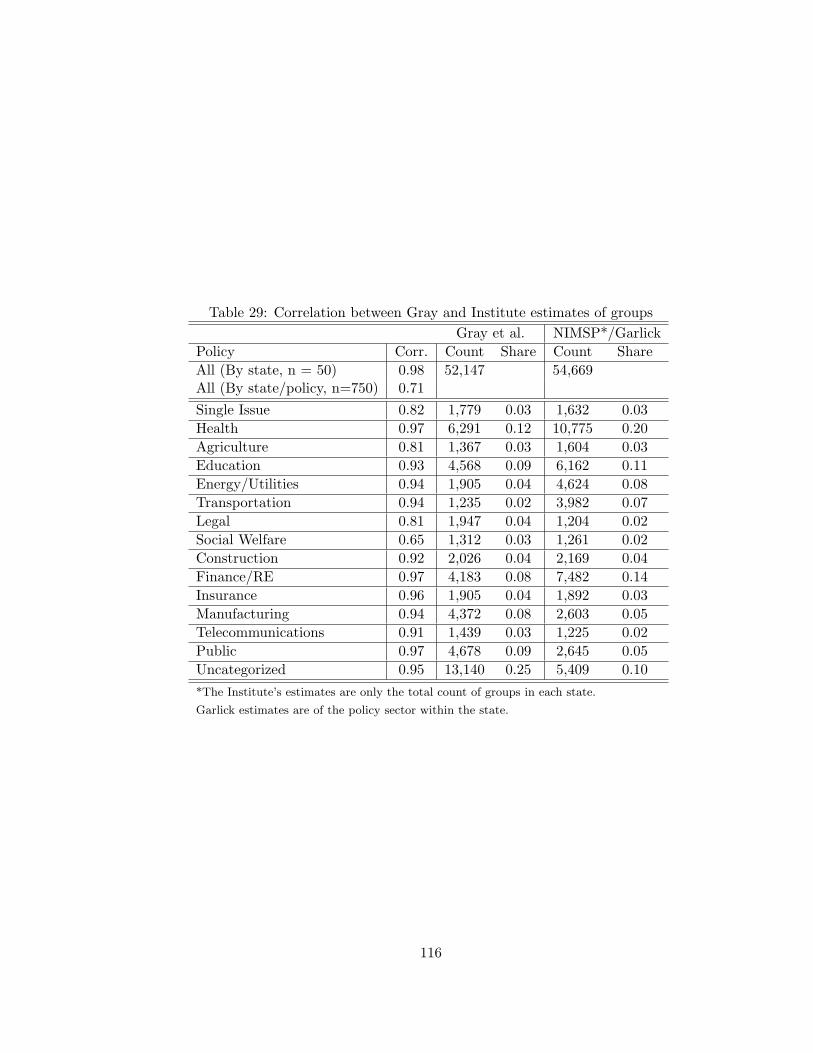
Table 29: Correlation between Gray and Institute estimates of groups
Gray et al. NIMSP*/Garlick
Policy Corr. Count Share Count Share
All (By state, n = 50) 0.98 52,147 54,669All (By state/policy, n=750) 0.71
Single Issue 0.82 1,779 0.03 1,632 0.03
Health 0.97 6,291 0.12 10,775 0.20
Agriculture 0.81 1,367 0.03 1,604 0.03
Education 0.93 4,568 0.09 6,162 0.11
Energy/Utilities 0.94 1,905 0.04 4,624 0.08
Transportation 0.94 1,235 0.02 3,982 0.07
Legal 0.81 1,947 0.04 1,204 0.02
Social Welfare 0.65 1,312 0.03 1,261 0.02
Construction 0.92 2,026 0.04 2,169 0.04
Finance/RE 0.97 4,183 0.08 7,482 0.14
Insurance 0.96 1,905 0.04 1,892 0.03
Manufacturing 0.94 4,372 0.08 2,603 0.05
Telecommunications 0.91 1,439 0.03 1,225 0.02
Public 0.97 4,678 0.09 2,645 0.05
Uncategorized 0.95 13,140 0.25 5,409 0.10
*The Institute’s estimates are only the total count of groups in each state.
Garlick estimates are of the policy sector within the state.
116

15 policy areas employed by Gray et al. (2005) do not include a code for environmental
advocacy groups, so the “Oceanic Institute” is left uncoded. There is also no general catch
all for business firms in this scheme. As a result, a major Hawaiian corporation “Dole Food
Company” is coded as a social welfare organization. In this case, the algorithm is likely
picking up on the number of soup kitchens and homeless shelters in other states that use
“food” in their title. Also the American Civil Liberties Union is not placed in single-issue
groups, as it should; but rather in real estate or finance, likely because of the word “union”
that associates with a number of banks. These are not designations I would make if I were
placing each of these groups on its own. However, Table 31 shows that these are the rare
exceptions from the rule. Every firm in the insurance category is an insurance company.
This exercise demonstrates pleasant similarities between the two approaches. There is a
good possibility the differences in these results are driven by measurement error: specifically
lobbyists who file multiple reports about the same client using different words, punctuation
or word-order to name those clients. In that regard, the careful hand-coding that Gray and
Lowery used is more reliable. Colorado is instructive, the raw list had 1,150 group names,
after cleaning it became 1,114, the Institute registered 1,050 groups and Gray and Lowery
reported 950. That reduction is in line with the scrutiny paid to the data-processing effort,
the more scrutiny that is paid, the more redundant offerings come out. However, with
this type of data there is a trade-off between precision and coverage, my approach favors
coverage.
A.3.6. Summary
This chapter described the collection and processing of two datasets. The first covers the
number of bills introduced in 15 policy areas in the 50 state legislatures from 2005-2015.
It was collected via an automated script running on LexisNexis State Capital Universe.
The second dataset is a 10-year rolling census of interest groups registered in all 50 states,
also by 15 policy areas. The National Institute for Money in State Politics collected group
registrations from officials in the 50 state legislatures. This chapter layers estimates of the
117

policy sector of the groups over the census. An automated text classification procedure,
specifically a Naıve Bayes estimation, was built using lobbying registrations from Colorado,
Massachusetts, Pennsylvania and the U.S. Congress. These datasets were used to train,
test and optimize the classification algorithm. After producing the estimates, I conduct a
number of validation exercises, comparing these estimates to the test-set, real-world events,
and a similar dataset published in the literature that had been hand-coded by research
assistants.
In general, a hand-coded dataset is preferable to one that has been created by an algorithm.
But as Grimmer and Stewart (2013) wrote, all quantitative models are wrong, yet some are
useful. There is a trade-off between these two approaches: the Gray et al. (2005) approach
minimizes measurement error with individual groups and my approach maximizes coverage,
especially over time. My estimates are very similar to current data in the literature, and
offer a reasonable amount of measurement error to conduct social science inference. The
benefits of my approach are seen in Chapter 3, where I analyze group registrations and bill
introductions as time-series, not just cross-sectionally.
Returning to the goals of this chapter, this method has proven capable of being able to
evaluate any groups, it will be replicable in the future, and the validation exercises have
shown it to conform to expectations according to a number of metrics.
118

Table 30: Estimates of group registrations: 2007 (Gray and Lowery estimates in parentheses)
State SING HELT AGRI EDUC E/UT TRAN LAW WELF CONS. F/RE INS MFR TLCO GOVT None Total
AK 9 64 8 30 67 45 2 8 9 55 15 10 9 30 42 403
(26) (40) (2) (22) (21) (29) (13) (15) (12) (27) (13) (27) (13) (43) (118) (421)
AL 20 151 18 87 55 58 15 13 31 88 25 45 14 62 79 761
(14) (82) (19) (62) (17) (17) (43) (11) (25) (47) (22) (84) (17) (110) (174) (744)
AR 12 150 31 63 77 37 14 12 22 84 38 31 26 14 59 670
(21) (184) (47) (118) (76) (16) (26) (41) (32) (51) (78) (100) (40) (36) (304) (1,170)
AZ 58 231 36 212 154 92 27 32 49 171 33 52 33 97 105 1,382
(69) (140) (29) (175) (78) (19) (29) (40) (46) (90) (34) (93) (40) (187) (306) (1,375)
CA 59 380 73 347 225 226 40 28 87 241 61 130 34 208 162 2,301
(58) (221) (85) (269) (117) (85) (37) (25) (84) (125) (58) (239) (50) (356) (487) (2,296)
CO 34 235 29 114 113 65 25 28 33 130 41 40 15 61 87 1,050
(43) (146) (23) (88) (34) (23) (60) (16) (24) (66) (40) (65) (22) (97) (244) (991)
CT 50 262 17 95 94 69 21 29 54 161 36 54 20 30 105 1,097
(41) (156) (15) (81) (42) (20) (15) (18) (37) (66) (35) (78) (25) (41) (235) (905)
DE 17 79 13 38 27 23 9 11 16 72 27 23 14 16 41 426
(35) (84) (10) (39) (23) (20) (27) (31) (30) (77) (28) (65) (31) (19) (234) (753)
FL 86 680 80 437 199 264 80 96 124 494 163 196 63 195 384 3,541
(63) (411) (66) (384) (72) (75) (88) (38) (107) (266) (186) (222) (80) (388) (889) (3,335)
GA 51 356 45 214 136 146 74 52 123 504 51 117 60 93 303 2,325
(63) (186) (44) (86) (40) (32) (97) (53) (160) (365) (58) (128) (52) (192) (472) (2,028)
119
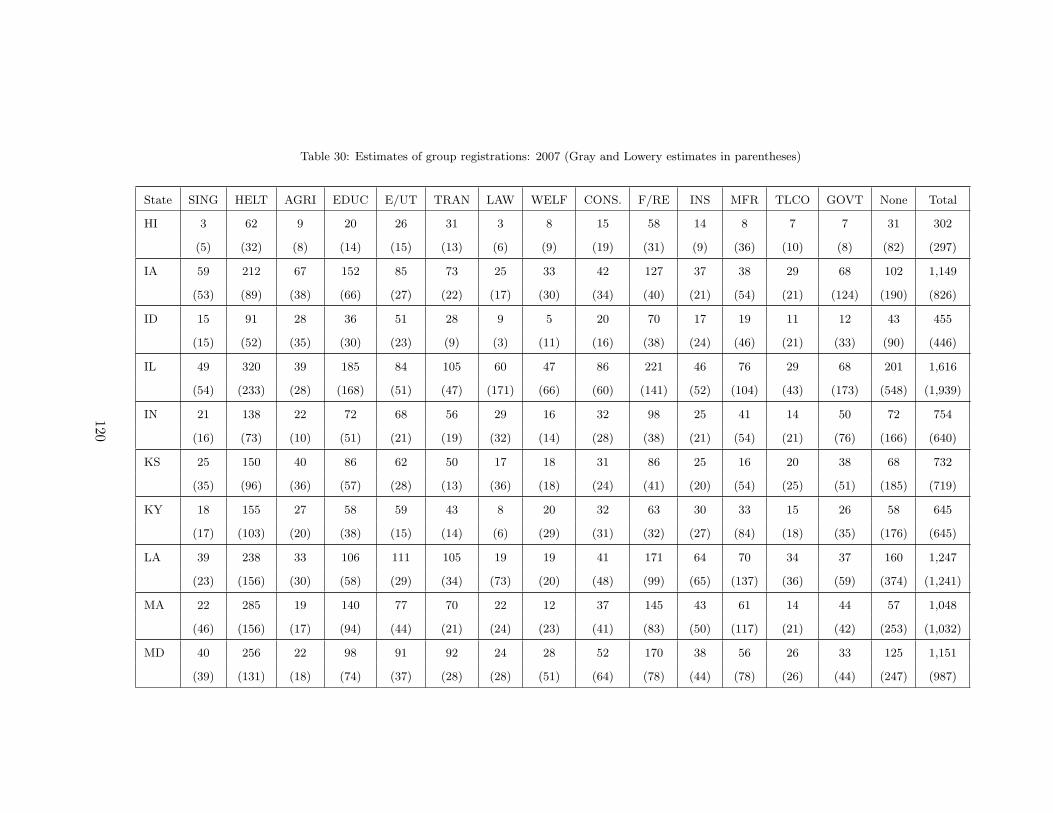
Table 30: Estimates of group registrations: 2007 (Gray and Lowery estimates in parentheses)
State SING HELT AGRI EDUC E/UT TRAN LAW WELF CONS. F/RE INS MFR TLCO GOVT None Total
HI 3 62 9 20 26 31 3 8 15 58 14 8 7 7 31 302
(5) (32) (8) (14) (15) (13) (6) (9) (19) (31) (9) (36) (10) (8) (82) (297)
IA 59 212 67 152 85 73 25 33 42 127 37 38 29 68 102 1,149
(53) (89) (38) (66) (27) (22) (17) (30) (34) (40) (21) (54) (21) (124) (190) (826)
ID 15 91 28 36 51 28 9 5 20 70 17 19 11 12 43 455
(15) (52) (35) (30) (23) (9) (3) (11) (16) (38) (24) (46) (21) (33) (90) (446)
IL 49 320 39 185 84 105 60 47 86 221 46 76 29 68 201 1,616
(54) (233) (28) (168) (51) (47) (171) (66) (60) (141) (52) (104) (43) (173) (548) (1,939)
IN 21 138 22 72 68 56 29 16 32 98 25 41 14 50 72 754
(16) (73) (10) (51) (21) (19) (32) (14) (28) (38) (21) (54) (21) (76) (166) (640)
KS 25 150 40 86 62 50 17 18 31 86 25 16 20 38 68 732
(35) (96) (36) (57) (28) (13) (36) (18) (24) (41) (20) (54) (25) (51) (185) (719)
KY 18 155 27 58 59 43 8 20 32 63 30 33 15 26 58 645
(17) (103) (20) (38) (15) (14) (6) (29) (31) (32) (27) (84) (18) (35) (176) (645)
LA 39 238 33 106 111 105 19 19 41 171 64 70 34 37 160 1,247
(23) (156) (30) (58) (29) (34) (73) (20) (48) (99) (65) (137) (36) (59) (374) (1,241)
MA 22 285 19 140 77 70 22 12 37 145 43 61 14 44 57 1,048
(46) (156) (17) (94) (44) (21) (24) (23) (41) (83) (50) (117) (21) (42) (253) (1,032)
MD 40 256 22 98 91 92 24 28 52 170 38 56 26 33 125 1,151
(39) (131) (18) (74) (37) (28) (28) (51) (64) (78) (44) (78) (26) (44) (247) (987)
120

Table 30: Estimates of group registrations: 2007 (Gray and Lowery estimates in parentheses)
State SING HELT AGRI EDUC E/UT TRAN LAW WELF CONS. F/RE INS MFR TLCO GOVT None Total
ME 14 93 19 34 39 25 7 7 19 38 18 16 13 21 44 407
(20) (47) (27) (20) (22) (5) (3) (18) (12) (20) (20) (43) (14) (24) (101) (396)
MI 31 225 36 169 81 117 40 37 40 178 44 72 32 74 160 1,336
(41) (146) (40) (130) (38) (29) (101) (20) (51) (84) (42) (126) (31) (110) (321) (1,310)
MN 52 237 106 150 117 110 14 37 54 163 31 53 34 73 72 1,303
(58) (112) (45) (88) (36) (20) (10) (39) (51) (56) (36) (80) (37) (123) (200) (991)
MO 53 456 69 260 134 168 66 39 98 354 66 81 50 122 319 2,335
(46) (268) (42) (196) (58) (55) (206) (41) (93) (219) (72) (168) (51) (225) (530) (2,270)
MS 18 141 22 62 35 36 9 15 29 71 28 37 20 30 60 613
(17) (77) (18) (48) (11) (15) (37) (18) (23) (41) (25) (62) (19) (49) (148) (608)
MT 17 88 11 45 63 33 7 12 14 59 20 13 11 36 38 467
(22) (51) (16) (33) (24) (8) (12) (9) (14) (24) (20) (36) (14) (60) (127) (470)
NC 19 228 41 115 46 70 16 13 24 118 33 49 20 42 58 892
(42) (82) (32) (78) (12) (21) (15) (30) (19) (52) (36) (94) (29) (101) (218) (861)
ND 14 83 26 82 65 36 3 10 17 31 29 4 9 13 18 440
(30) (55) (26) (25) (25) (6) (6) (18) (20) (19) (33) (32) (17) (24) (104) (440)
NE 16 101 21 59 54 34 11 12 20 57 19 16 28 29 51 528
(35) (56) (24) (44) (23) (14) (25) (10) (20) (28) (19) (37) (33) (38) (120) (526)
NH 18 131 14 51 62 38 7 17 25 60 19 26 14 23 36 541
(23) (63) (18) (26) (28) (12) (7) (21) (14) (30) (21) (53) (13) (26) (117) (472)
121
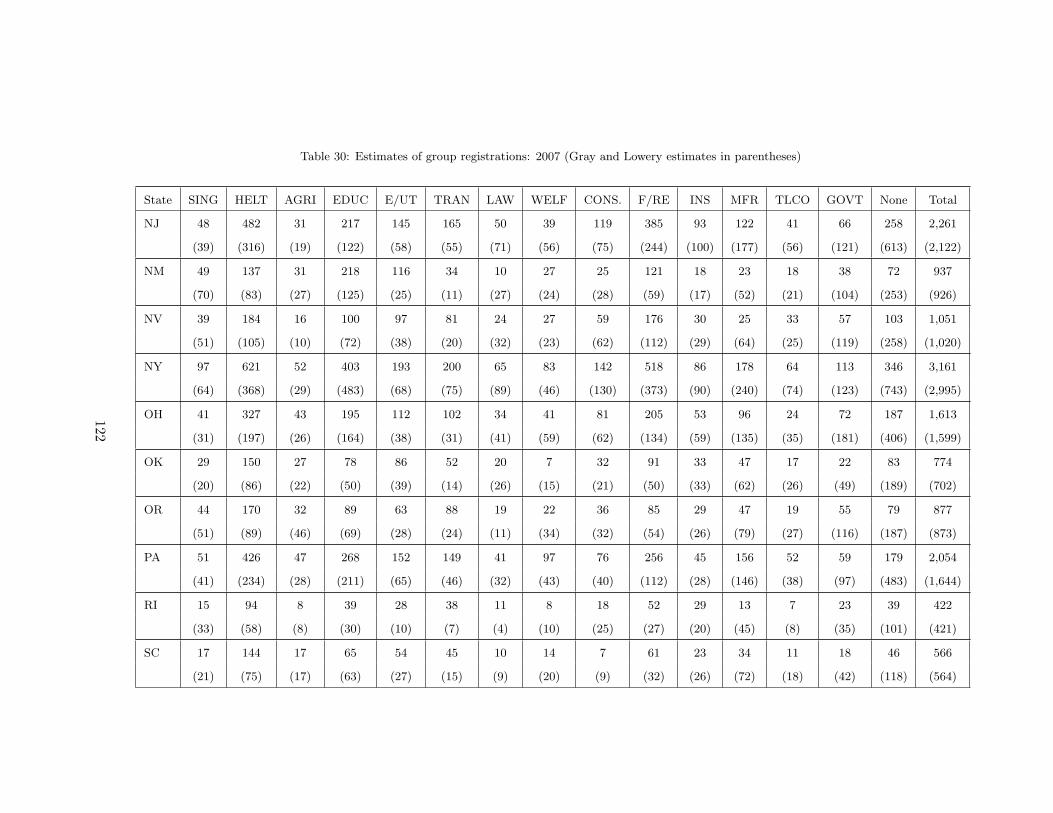
Table 30: Estimates of group registrations: 2007 (Gray and Lowery estimates in parentheses)
State SING HELT AGRI EDUC E/UT TRAN LAW WELF CONS. F/RE INS MFR TLCO GOVT None Total
NJ 48 482 31 217 145 165 50 39 119 385 93 122 41 66 258 2,261
(39) (316) (19) (122) (58) (55) (71) (56) (75) (244) (100) (177) (56) (121) (613) (2,122)
NM 49 137 31 218 116 34 10 27 25 121 18 23 18 38 72 937
(70) (83) (27) (125) (25) (11) (27) (24) (28) (59) (17) (52) (21) (104) (253) (926)
NV 39 184 16 100 97 81 24 27 59 176 30 25 33 57 103 1,051
(51) (105) (10) (72) (38) (20) (32) (23) (62) (112) (29) (64) (25) (119) (258) (1,020)
NY 97 621 52 403 193 200 65 83 142 518 86 178 64 113 346 3,161
(64) (368) (29) (483) (68) (75) (89) (46) (130) (373) (90) (240) (74) (123) (743) (2,995)
OH 41 327 43 195 112 102 34 41 81 205 53 96 24 72 187 1,613
(31) (197) (26) (164) (38) (31) (41) (59) (62) (134) (59) (135) (35) (181) (406) (1,599)
OK 29 150 27 78 86 52 20 7 32 91 33 47 17 22 83 774
(20) (86) (22) (50) (39) (14) (26) (15) (21) (50) (33) (62) (26) (49) (189) (702)
OR 44 170 32 89 63 88 19 22 36 85 29 47 19 55 79 877
(51) (89) (46) (69) (28) (24) (11) (34) (32) (54) (26) (79) (27) (116) (187) (873)
PA 51 426 47 268 152 149 41 97 76 256 45 156 52 59 179 2,054
(41) (234) (28) (211) (65) (46) (32) (43) (40) (112) (28) (146) (38) (97) (483) (1,644)
RI 15 94 8 39 28 38 11 8 18 52 29 13 7 23 39 422
(33) (58) (8) (30) (10) (7) (4) (10) (25) (27) (20) (45) (8) (35) (101) (421)
SC 17 144 17 65 54 45 10 14 7 61 23 34 11 18 46 566
(21) (75) (17) (63) (27) (15) (9) (20) (9) (32) (26) (72) (18) (42) (118) (564)
122

Table 30: Estimates of group registrations: 2007 (Gray and Lowery estimates in parentheses)
State SING HELT AGRI EDUC E/UT TRAN LAW WELF CONS. F/RE INS MFR TLCO GOVT None Total
SD 17 68 17 51 46 37 7 12 10 50 22 5 14 24 35 415
(11) (35) (14) (11) (24) (6) (5) (6) (9) (17) (14) (21) (13) (27) (66) (279)
TN 14 183 23 75 53 36 11 17 41 98 39 39 26 32 71 758
(4) (57) (11) (16) (6) (9) (4) (11) (9) (25) (22) (52) (19) (33) (74) (352)
TX 57 547 78 301 462 246 95 46 94 484 100 144 64 186 352 3,256
(73) (327) (76) (160) (212) (62) (137) (39) (104) (319) (101) (211) (62) (356) (774) (3,013)
UT 22 85 4 40 52 34 13 9 10 58 21 17 14 17 69 465
(20) (38) (5) (32) (21) (8) (25) (12) (13) (32) (12) (41) (19) (28) (126) (432)
VA 29 182 25 96 78 82 20 20 39 132 27 42 17 52 69 910
(39) (108) (23) (77) (38) (24) (20) (31) (40) (73) (32) (76) (25) (100) (188) (894)
VT 14 113 12 26 62 22 7 10 8 47 21 18 14 13 24 411
(24) (53) (15) (29) (35) (6) (7) (16) (12) (17) (18) (43) (15) (19) (71) (380)
WA 47 263 48 129 93 107 34 34 46 150 27 54 25 72 120 1,249
(54) (141) (57) (106) (31) (43) (73) (24) (58) (59) (21) (98) (30) (127) (279) (1,201)
WI 41 157 38 79 61 63 12 21 30 79 21 39 16 39 59 755
(41) (106) (43) (49) (23) (20) (9) (34) (33) (39) (12) (76) (25) (50) (178) (738)
WV 10 107 18 42 54 35 10 8 13 56 24 15 12 16 50 470
(14) (64) (11) (17) (19) (10) (13) (13) (17) (22) (25) (58) (14) (22) (149) (468)
WY 12 57 16 34 60 21 8 5 7 40 15 6 19 19 28 347
(8) (23) (12) (20) (13) (8) (59) (13) (8) (9) (11) (28) (19) (35) (124) (390)
123
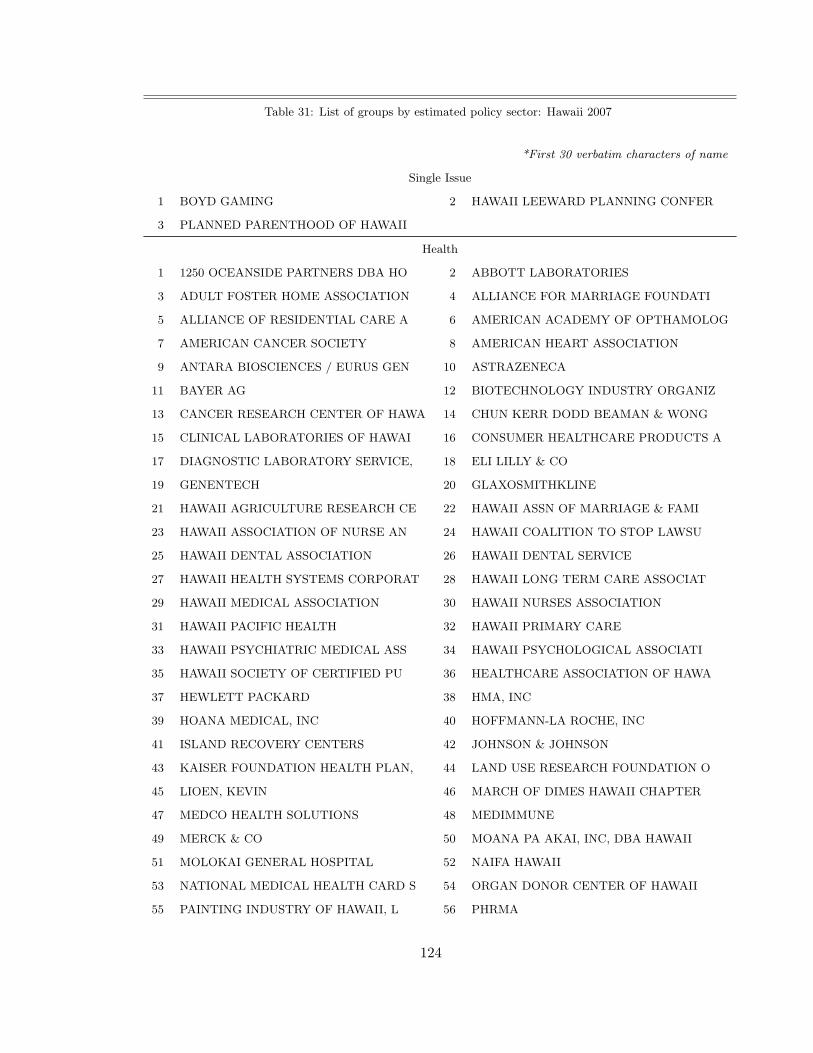
Table 31: List of groups by estimated policy sector: Hawaii 2007
*First 30 verbatim characters of name
Single Issue
1 BOYD GAMING 2 HAWAII LEEWARD PLANNING CONFER
3 PLANNED PARENTHOOD OF HAWAII
Health
1 1250 OCEANSIDE PARTNERS DBA HO 2 ABBOTT LABORATORIES
3 ADULT FOSTER HOME ASSOCIATION 4 ALLIANCE FOR MARRIAGE FOUNDATI
5 ALLIANCE OF RESIDENTIAL CARE A 6 AMERICAN ACADEMY OF OPTHAMOLOG
7 AMERICAN CANCER SOCIETY 8 AMERICAN HEART ASSOCIATION
9 ANTARA BIOSCIENCES / EURUS GEN 10 ASTRAZENECA
11 BAYER AG 12 BIOTECHNOLOGY INDUSTRY ORGANIZ
13 CANCER RESEARCH CENTER OF HAWA 14 CHUN KERR DODD BEAMAN & WONG
15 CLINICAL LABORATORIES OF HAWAI 16 CONSUMER HEALTHCARE PRODUCTS A
17 DIAGNOSTIC LABORATORY SERVICE, 18 ELI LILLY & CO
19 GENENTECH 20 GLAXOSMITHKLINE
21 HAWAII AGRICULTURE RESEARCH CE 22 HAWAII ASSN OF MARRIAGE & FAMI
23 HAWAII ASSOCIATION OF NURSE AN 24 HAWAII COALITION TO STOP LAWSU
25 HAWAII DENTAL ASSOCIATION 26 HAWAII DENTAL SERVICE
27 HAWAII HEALTH SYSTEMS CORPORAT 28 HAWAII LONG TERM CARE ASSOCIAT
29 HAWAII MEDICAL ASSOCIATION 30 HAWAII NURSES ASSOCIATION
31 HAWAII PACIFIC HEALTH 32 HAWAII PRIMARY CARE
33 HAWAII PSYCHIATRIC MEDICAL ASS 34 HAWAII PSYCHOLOGICAL ASSOCIATI
35 HAWAII SOCIETY OF CERTIFIED PU 36 HEALTHCARE ASSOCIATION OF HAWA
37 HEWLETT PACKARD 38 HMA, INC
39 HOANA MEDICAL, INC 40 HOFFMANN-LA ROCHE, INC
41 ISLAND RECOVERY CENTERS 42 JOHNSON & JOHNSON
43 KAISER FOUNDATION HEALTH PLAN, 44 LAND USE RESEARCH FOUNDATION O
45 LIOEN, KEVIN 46 MARCH OF DIMES HAWAII CHAPTER
47 MEDCO HEALTH SOLUTIONS 48 MEDIMMUNE
49 MERCK & CO 50 MOANA PA AKAI, INC, DBA HAWAII
51 MOLOKAI GENERAL HOSPITAL 52 NAIFA HAWAII
53 NATIONAL MEDICAL HEALTH CARD S 54 ORGAN DONOR CENTER OF HAWAII
55 PAINTING INDUSTRY OF HAWAII, L 56 PHRMA
124

Table 31: List of groups by estimated policy sector: Hawaii 2007
*First 30 verbatim characters of name
57 RAMER, LYNN 58 SCHERING-PLOUGH
59 SEPRACOR, INC 60 SUMMERLIN LIFE & HEALTH INSURA
61 TAP PHARMACEUTICALS 62 WYETH PHARMACEUTICALS
Agriculture
1 CIGAR ASSOCIATION OF AMERICA 2 COALITION FOR A TOBACCO FREE H
3 HAWAII CROP IMPROVEMENT ASSOCI 4 HAWAII FARM BUREAU
5 KRAFT FOODS 6 MAUI LAND & PINEAPPLE COMPANY,
7 REYNOLDS AMERICAN INC 8 SHAMROCK IMPORTERS LLC
9 US SMOKELESS TOBACCO CO
Education
1 BISHOP MUSEUM 2 BROMINE SCIENCE & ENVIRONMENTA
3 CASE MANAGEMENT COUNCIL 4 EARTH ISLAND INSTITUTE
5 G A MORRIS, INC 6 HAWAII ASSOCIATION OF INDEPEND
7 HAWAII AUDUBON SOCIETY 8 HAWAII BUSINESS LEAGUE
9 HAWAII SCHOOL BUS ASSOCIATION 10 HAWAII STATE TEACHERS ASSOCIAT
11 KAMEHAMEHA SCHOOLS 12 NATIONAL ASSN OF SOCIAL WORKER
13 NATIONAL FEDERATION OF INDEPEN 14 NATIONAL RIFLE ASSOCIATION
15 PHILIP MORRIS USA, INC 16 PIONEER HI-BRED INTERNATIONAL
17 UNIVERSITY OF HAWAII FOUNDATIO 18 UNIVERSITY OF HAWAII PROFESSIO
19 UNIVERSITY OF PHOENIX 20 YOUNG BROTHERS
Utilities
1 HAWAII ELECTRIC LIGHT COMPANY, 2 HAWAIIAN ELECTRIC COMPANY, INC
3 KAUAI ISLAND UTILITY CO-OP
Energy
1 ALOHA PETROLEUM 2 BLUEEARTH BIOFUELS, LLC
3 CHEVRON CORP 4 COVANTA ENERGY CORPORATION
5 DEPARTMENT OF WATER, COUNTY OF 6 ETHANOL RESEARCH HAWAII LLC
7 HAMAKUA ENERGY PARTNERS 8 HAWAII BIOENERGY
9 HAWAII CLEAN ELECTIONS 10 HAWAII RENEWABLE ENERGY ALLIAN
11 HONOLULU BOARD OF WATER SUPPLY 12 IMPERIUM RENEWABLES HAWAII
13 MARKETING RESOURCE GROUP 14 MAUI ELECTRIC COMPANY, LTD
15 MAUI ETHANOL 16 MEADOW GOLD DAIRIES
125
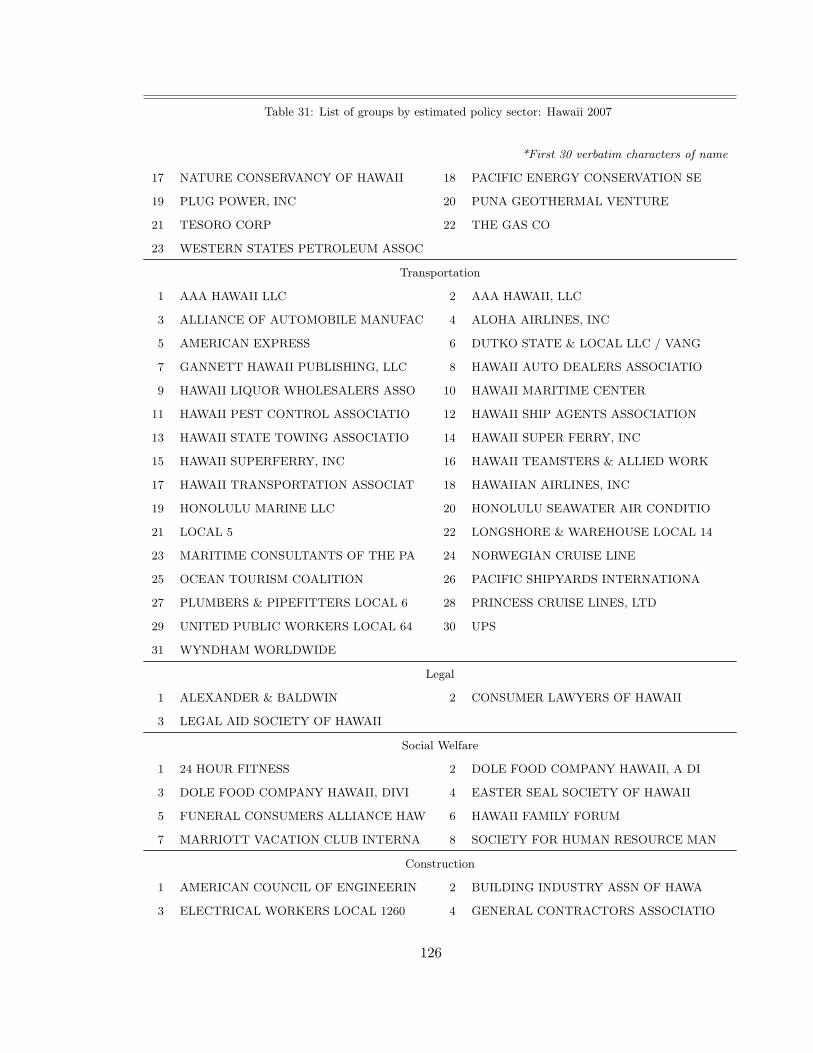
Table 31: List of groups by estimated policy sector: Hawaii 2007
*First 30 verbatim characters of name
17 NATURE CONSERVANCY OF HAWAII 18 PACIFIC ENERGY CONSERVATION SE
19 PLUG POWER, INC 20 PUNA GEOTHERMAL VENTURE
21 TESORO CORP 22 THE GAS CO
23 WESTERN STATES PETROLEUM ASSOC
Transportation
1 AAA HAWAII LLC 2 AAA HAWAII, LLC
3 ALLIANCE OF AUTOMOBILE MANUFAC 4 ALOHA AIRLINES, INC
5 AMERICAN EXPRESS 6 DUTKO STATE & LOCAL LLC / VANG
7 GANNETT HAWAII PUBLISHING, LLC 8 HAWAII AUTO DEALERS ASSOCIATIO
9 HAWAII LIQUOR WHOLESALERS ASSO 10 HAWAII MARITIME CENTER
11 HAWAII PEST CONTROL ASSOCIATIO 12 HAWAII SHIP AGENTS ASSOCIATION
13 HAWAII STATE TOWING ASSOCIATIO 14 HAWAII SUPER FERRY, INC
15 HAWAII SUPERFERRY, INC 16 HAWAII TEAMSTERS & ALLIED WORK
17 HAWAII TRANSPORTATION ASSOCIAT 18 HAWAIIAN AIRLINES, INC
19 HONOLULU MARINE LLC 20 HONOLULU SEAWATER AIR CONDITIO
21 LOCAL 5 22 LONGSHORE & WAREHOUSE LOCAL 14
23 MARITIME CONSULTANTS OF THE PA 24 NORWEGIAN CRUISE LINE
25 OCEAN TOURISM COALITION 26 PACIFIC SHIPYARDS INTERNATIONA
27 PLUMBERS & PIPEFITTERS LOCAL 6 28 PRINCESS CRUISE LINES, LTD
29 UNITED PUBLIC WORKERS LOCAL 64 30 UPS
31 WYNDHAM WORLDWIDE
Legal
1 ALEXANDER & BALDWIN 2 CONSUMER LAWYERS OF HAWAII
3 LEGAL AID SOCIETY OF HAWAII
Social Welfare
1 24 HOUR FITNESS 2 DOLE FOOD COMPANY HAWAII, A DI
3 DOLE FOOD COMPANY HAWAII, DIVI 4 EASTER SEAL SOCIETY OF HAWAII
5 FUNERAL CONSUMERS ALLIANCE HAW 6 HAWAII FAMILY FORUM
7 MARRIOTT VACATION CLUB INTERNA 8 SOCIETY FOR HUMAN RESOURCE MAN
Construction
1 AMERICAN COUNCIL OF ENGINEERIN 2 BUILDING INDUSTRY ASSN OF HAWA
3 ELECTRICAL WORKERS LOCAL 1260 4 GENERAL CONTRACTORS ASSOCIATIO
126
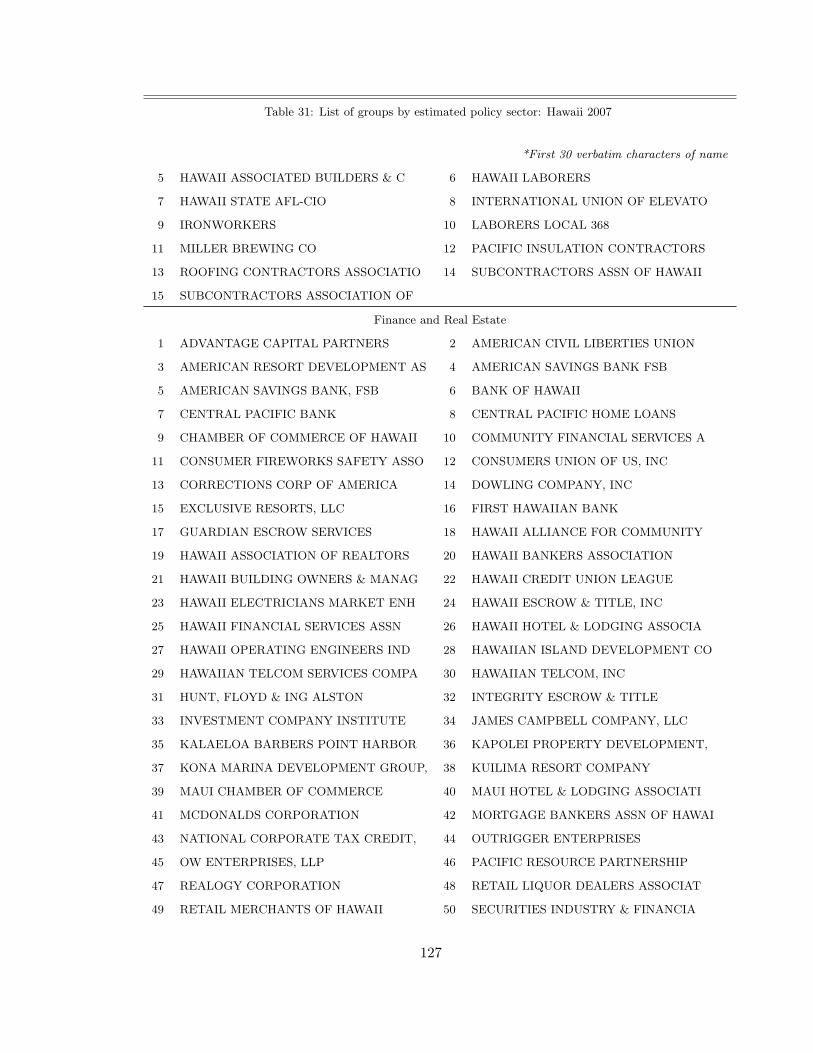
Table 31: List of groups by estimated policy sector: Hawaii 2007
*First 30 verbatim characters of name
5 HAWAII ASSOCIATED BUILDERS & C 6 HAWAII LABORERS
7 HAWAII STATE AFL-CIO 8 INTERNATIONAL UNION OF ELEVATO
9 IRONWORKERS 10 LABORERS LOCAL 368
11 MILLER BREWING CO 12 PACIFIC INSULATION CONTRACTORS
13 ROOFING CONTRACTORS ASSOCIATIO 14 SUBCONTRACTORS ASSN OF HAWAII
15 SUBCONTRACTORS ASSOCIATION OF
Finance and Real Estate
1 ADVANTAGE CAPITAL PARTNERS 2 AMERICAN CIVIL LIBERTIES UNION
3 AMERICAN RESORT DEVELOPMENT AS 4 AMERICAN SAVINGS BANK FSB
5 AMERICAN SAVINGS BANK, FSB 6 BANK OF HAWAII
7 CENTRAL PACIFIC BANK 8 CENTRAL PACIFIC HOME LOANS
9 CHAMBER OF COMMERCE OF HAWAII 10 COMMUNITY FINANCIAL SERVICES A
11 CONSUMER FIREWORKS SAFETY ASSO 12 CONSUMERS UNION OF US, INC
13 CORRECTIONS CORP OF AMERICA 14 DOWLING COMPANY, INC
15 EXCLUSIVE RESORTS, LLC 16 FIRST HAWAIIAN BANK
17 GUARDIAN ESCROW SERVICES 18 HAWAII ALLIANCE FOR COMMUNITY
19 HAWAII ASSOCIATION OF REALTORS 20 HAWAII BANKERS ASSOCIATION
21 HAWAII BUILDING OWNERS & MANAG 22 HAWAII CREDIT UNION LEAGUE
23 HAWAII ELECTRICIANS MARKET ENH 24 HAWAII ESCROW & TITLE, INC
25 HAWAII FINANCIAL SERVICES ASSN 26 HAWAII HOTEL & LODGING ASSOCIA
27 HAWAII OPERATING ENGINEERS IND 28 HAWAIIAN ISLAND DEVELOPMENT CO
29 HAWAIIAN TELCOM SERVICES COMPA 30 HAWAIIAN TELCOM, INC
31 HUNT, FLOYD & ING ALSTON 32 INTEGRITY ESCROW & TITLE
33 INVESTMENT COMPANY INSTITUTE 34 JAMES CAMPBELL COMPANY, LLC
35 KALAELOA BARBERS POINT HARBOR 36 KAPOLEI PROPERTY DEVELOPMENT,
37 KONA MARINA DEVELOPMENT GROUP, 38 KUILIMA RESORT COMPANY
39 MAUI CHAMBER OF COMMERCE 40 MAUI HOTEL & LODGING ASSOCIATI
41 MCDONALDS CORPORATION 42 MORTGAGE BANKERS ASSN OF HAWAI
43 NATIONAL CORPORATE TAX CREDIT, 44 OUTRIGGER ENTERPRISES
45 OW ENTERPRISES, LLP 46 PACIFIC RESOURCE PARTNERSHIP
47 REALOGY CORPORATION 48 RETAIL LIQUOR DEALERS ASSOCIAT
49 RETAIL MERCHANTS OF HAWAII 50 SECURITIES INDUSTRY & FINANCIA
127
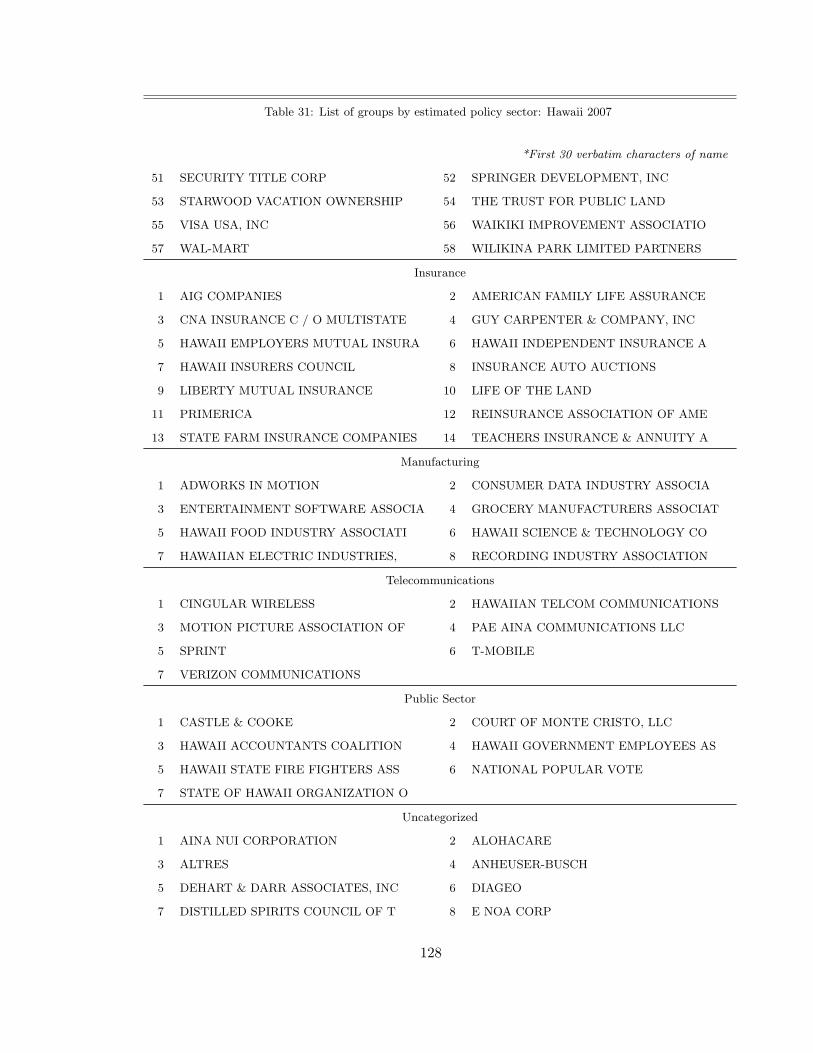
Table 31: List of groups by estimated policy sector: Hawaii 2007
*First 30 verbatim characters of name
51 SECURITY TITLE CORP 52 SPRINGER DEVELOPMENT, INC
53 STARWOOD VACATION OWNERSHIP 54 THE TRUST FOR PUBLIC LAND
55 VISA USA, INC 56 WAIKIKI IMPROVEMENT ASSOCIATIO
57 WAL-MART 58 WILIKINA PARK LIMITED PARTNERS
Insurance
1 AIG COMPANIES 2 AMERICAN FAMILY LIFE ASSURANCE
3 CNA INSURANCE C / O MULTISTATE 4 GUY CARPENTER & COMPANY, INC
5 HAWAII EMPLOYERS MUTUAL INSURA 6 HAWAII INDEPENDENT INSURANCE A
7 HAWAII INSURERS COUNCIL 8 INSURANCE AUTO AUCTIONS
9 LIBERTY MUTUAL INSURANCE 10 LIFE OF THE LAND
11 PRIMERICA 12 REINSURANCE ASSOCIATION OF AME
13 STATE FARM INSURANCE COMPANIES 14 TEACHERS INSURANCE & ANNUITY A
Manufacturing
1 ADWORKS IN MOTION 2 CONSUMER DATA INDUSTRY ASSOCIA
3 ENTERTAINMENT SOFTWARE ASSOCIA 4 GROCERY MANUFACTURERS ASSOCIAT
5 HAWAII FOOD INDUSTRY ASSOCIATI 6 HAWAII SCIENCE & TECHNOLOGY CO
7 HAWAIIAN ELECTRIC INDUSTRIES, 8 RECORDING INDUSTRY ASSOCIATION
Telecommunications
1 CINGULAR WIRELESS 2 HAWAIIAN TELCOM COMMUNICATIONS
3 MOTION PICTURE ASSOCIATION OF 4 PAE AINA COMMUNICATIONS LLC
5 SPRINT 6 T-MOBILE
7 VERIZON COMMUNICATIONS
Public Sector
1 CASTLE & COOKE 2 COURT OF MONTE CRISTO, LLC
3 HAWAII ACCOUNTANTS COALITION 4 HAWAII GOVERNMENT EMPLOYEES AS
5 HAWAII STATE FIRE FIGHTERS ASS 6 NATIONAL POPULAR VOTE
7 STATE OF HAWAII ORGANIZATION O
Uncategorized
1 AINA NUI CORPORATION 2 ALOHACARE
3 ALTRES 4 ANHEUSER-BUSCH
5 DEHART & DARR ASSOCIATES, INC 6 DIAGEO
7 DISTILLED SPIRITS COUNCIL OF T 8 E NOA CORP
128

Table 31: List of groups by estimated policy sector: Hawaii 2007
*First 30 verbatim characters of name
9 GEOPLASMA, LLC 10 HASEKO (EWA), INC
11 HAWAII COMMUNITY FOUNDATION 12 HAWAII FLOORING ASSOCIATION
13 HAWAII MANAGEMENT ALLIANCE ASS 14 HAWAII TOURISM AUTHORITY
15 HAWAIIAN HUMANE SOCIETY 16 HOME & COMMUNITY SERVICES OF H
17 IMAGITEL 18 IMX COMPANIES
19 MANOA VALLEY THEATRE 20 MOHALA, KAHI
21 NALEO POHAI 22 NORTH WEST CRUISESHIP ASSOCIAT
23 OCEANIC INSTITUTE 24 PACIFICAP MANAGEMENT, INC
25 PRO SERVICE HAWAII 26 PROSERVICE HAWAII
27 RADCLIFFE & ASSOCIATES 28 RDD, LLC
29 RESORTQUEST HAWAII, LLC 30 UNIDEV, LLC
31 WINE INSTITUTE
129
APPENDIX Supporting materials for Chapter 4
Chapter 4 presented evidence that there is more party difference on bills lobbied by more
advocacy organizations. In this supplemental chapter, I describe the data used to test this
argument. Specifically, I describe how bill-level data on lobbying was collected from the
Secretaries of State in Ohio and Colorado, as well as the Center for Responsive Politics in
Washington, D.C..
I also present additional evidence on the correlates of polarization, showing that salience, as
measured through newspaper coverage and the ideology of a bill’s sponsor, associates with
party difference on roll call votes. Finally, I use the Policy Agendas Project major topic
codes to describe the amount of party difference in Congress on 20 different policy areas.
B.1. Collecting bill-level lobbying and roll call data
One of the contributions of Chapter 4 is that it uses bill-level lobbying data to test the re-
lationship between lobbying and roll-call voting. With apologies to Grasse and Heidbreder
(2011), this is rare in the field. A challenge to standardizing these data is that they are
produced by three separate agencies. The Congress data comes from the Center for Re-
sponsive Politics. CRP offers data as a bulk download in their free MyOpenSecrets service,
including lobbying expenditures and the bills that groups lobby on since 1997. This data
was nearly ready to analyze. The last column of Table 32 shows the sector codes that the
CRP assigns to each group in its lobbying database. These organizations can be separated
into the conceptual categories described in Chapter 4 by the following sector codes.
The state data presented more challenges. Fortunately, the Colorado Secretary of State
maintains an online registry of lobbyists by their bill activity, available at https://www.
sos.state.co.us/lobby/Home.do. I received a CD-ROM directly from the Secretary of
State’s office1 with this information dating back to 1998. Colorado provided an entry for
1I thank Angela Lawson, the manager of the Lobbyist Program for sending this to me on 10 Dec. 2014.
130

each lobbying organization called “Business Description.” Table 32 shows how I used these
descriptions in a similar fashion to the U.S. Congress data.
Ohio provides the names and client of each lobbyist for each bill before their legislature.2
Ohio provides no additional information about the lobbyist’s client though. Therefore, I
took the following procedure to classify the lobbying groups. First, I looked up the group
name in the Secretary of State’s business lookup service.3 The codes in the Ohio column of
32 are produced by this service. Using this database I could classify all of the businesses in
Ohio as well as most of the non-profit codes.4 Public sector organizations were not in this
database; I looked up these group names in a search engine and coded it as being public if
it had a “.gov” or “.edu” website address.
I took a different approach to classifying advocacy organizations in the states than the U.S.
Congress. For Congress I used the CRP’s “single-issue” code. In the states, I used Project
Vote Smart’s database of interest groups. 5 Vote Smart lists groups in all 50 states that
rate candidates or engage in electioneering activities, the very “outside lobbying” tactics
that I discuss in the body of Chapter 4. This makes this database a good conceptual fit for
my definition. I scraped these data from the Vote Smart website using Kimono6 and cross-
referenced the name of the group against this list to identify these groups. Only non-profits
can be advocacy organizations.
I also collected roll call voting data from both Congress and the states. The Sunlight
Foundation’s OpenStates project makes the legislative calendar and roll call votes from all
50 states available at openstates.com. Their data goes back to 2009 at the earliest, but
picks up in earnest in 2011, this is why my analysis for the states in this chapter begins in
2These data are available for download from www2.jlec-olig.state.oh.us/olac/Reports/
LegislativeDecisionSearch.aspx.3At http://www5.sos.state.oh.us/ords/f?p=100:16:0::NO::P16_HELP_TYPE:BS.4Some non-profits and businesses that register their trademarks in other states did not show up in the
Ohio database. In that case, I would consult the Pennsylvania or Tennessee Secretary of State databasethat I used to code the data in Chapter 5.
5This is available at http://votesmart.org/interest-groups.6R.I.P.
131

Table 32: Coding rules for lobbying group typeState Colorado Ohio U.S. Congress
Data Source CO SOS OH SOS CRP
Business Business Entity Corporation for profit AgribusinessIndustry Limited Liability Company Communic/Electronics
Limited Partnership ConstructionRegistered trade name* Defense
Energy/Nat ResourceFinance/Insur/RealEstHealthMisc BusinessTransportation
Non-profits Group of Persons Corporation for non-profit Business AssociationsNon-Profit Group of Persons General ContractorsOrganizations Organizations Health ProfessionalsProfessional Association Professional Association Homemakers/Non-income earnersTrade Trade Labor
Lawyers/Law FirmsNon-Profit Institutions
Advocacy orgs. Project Vote Smart Project Vote Smart Ideology/Single-Issue
Public sector Government Not in SOS database Civil Servants/Public OfficialsConfirm with .gov or Clergy & Religious Organizations
.edu website url. EducationRetiredOther
2011. Unfortunately, bills and votes are not coded by policy area for either of these states.
For Congress, Poole and Rosenthal (2000) maintain a database of roll call votes taken in
Congress since the 1st Congress.7 The Congressional Bills Project, an offshoot of the Policy
Agendas Project, codes each roll call in the U.S. Congress by a major topic code. I use topic
codes to run models with policy fixed effects and in Figure 17 of this chapter.8 The Policy
Agendas Project also maintains a database of the number of articles in the Congressional
Quarterly Almanac that mention each bill, I used this data for the sections on salience.9
To measure the salience of bills in the states, I conducted a content analysis of the Denver
Post and Columbus dispatch using LexisNexis Academic Universe10, I searched for every
article in 2011-2014 that contained the term “house bill” or “senate bill” in both papers. I
then hand-coded these articles to assign them to an individual bill, and validate that they
7These votes are available at voteview.com.8This data is available at congressionalbills.org.9These data are available at comparativeagendas.net/us.
10Through the University of Pennsylvania’s subscription.
132

Table 33: Lobbying and roll call voting data: 1999-2014
Dependent var. Independent var.Venue Session Year(s) Bills† Votes Groups Avg. per bill
Colorado 2011A 2011 711 1,211 1,358 19.12012A 2012 645 728 1,347 22.12013A 2013 711 2,288 1,493 23.82014A 2014 710 1,715 1,484 25.0
Ohio 129 2011-2012 1,119 1,087 1,243 14.8130 2013-2014 1,206 1,095 1,326 15.1
U.S. Congress 106th 1999-2000 2,075 1,337 17,105 1.5107th 2001-2002 2,837 1,125 20,226 2.5108th 2003-2004 3,101 1,267 24,186 2.7109th 2005-2006 6,769 1,296 27,112 5.4110th 2007-2008 9,005 1,855 28,562 10.7111th 2009-2010 9,112 1,440 30,568 11.2112th 2011-2012 8,443 1,654 26,704 10.2113th 2013-2014 7,689 1,272 23,963 9.5
† Regular House and Senate bills only, excludes resolutions, nominations, etc.
were referring to bills before the state’s legislature.
Working with this many datasets is a challenge in itself. In many cases these adjacent
data sets were linked to each other by forming a bill id, based on the prefix for the bill,
its number, chamber and session of introduction. In the U.S. Congress I only use regular
House bills “H.R.” and Senate bills “S.”, I drop all the resolutions. I also only use regular
House and Senate bills in the states.
B.1.1. Description of data
Table 33 shows a number of interesting trends in these legislatures over time. First, there
are generally more bills and more lobbying groups in the U.S. Congress. However, the bills
in the state legislatures receive more individual attention in terms of the number of lobbying
groups and votes that each bills receives. This relationship is consistent with the findings
presented in Chapter 4 that only three percent of Congressional bills receive a roll-call vote.
This indicates that a great number of bills before Congress do not receive much attention
at all.
133

Figure 10 is a density histogram that plots the distribution within each legislature. It shows
that all three legislatures are skewed to a small number of lobbyists on each bill. The U.S.
Congress has a particularly long trail to the right side.
Figure 10: Most bills in Congress, CO, & OH are lobbied by small no. of groups: 2011-2014
Figures 11 & 12 drill into these distributions more. These figures are frequencies plots, so
they show the raw number of bills with different numbers of lobbying groups. Figure 11
looks at the left side of the distribution, and shows the U.S. Congress in particular has a
large number of bills with very few lobbying groups. The states, and Colorado in particular,
have more bills that groups pay a moderate amount of attention to (10-50 groups).
Figure 12 examines the long right tail of the distribution to show that the U.S. Congress has
the most bills with more than 100 groups, and even a couple of bills with more than 1000
groups. Ohio has a few bills with large amounts of attention, but Colorado’s distribution
maxes out around 200 groups. This empirical data supports the findings in Baumgartner
et al. (2009), that most bills receive very little group activity, but bills that do attract
attention attract a great amount of attention.
134

Figure 11: There are more bills with moderate amounts of lobbyist attention in the states:2011-2014
Figure 12: There are more bills with large amounts of lobbyist attention in Congress: 2011-2014
135
B.2. Data exploration
B.2.1. Covariates of polarization: Ideology
This section provides supporting evidence that that ideology is a covariate of polarization.
This chapter uses the ideal point estimates (Shor and McCarty, 2015) of the bill sponsors
to proxy for the ideology of the legislation. I expected it to more ideological bills to positive
associate with polarization. The upward concave of the lowess curve in Figure 13 shows
that the average ideology of bill sponsors in Colorado does in fact associate with the party
difference of roll-call votes on those bills.
In Ohio, there only appears to be a relationship between party difference and bills with
conservative bill sponsors in Figure 14. An explanation for this difference could be derive
from the party’s control of the agenda in Ohio. Republicans controlled both houses of the
Ohio legislature in both of these sessions. With their control of the agenda they will restrict
access to the agenda in favor of bills with more party unity. Therefore, the party difference
on more ideological bills would be driven by the Democrats voting together and against the
Republicans.
B.2.2. Covariates of polarization: Press attention
Chapter 4 discusses the role that salience plays in attracting polarization and lobbying
activity to a bill. Figure 15 shows that the number of times a bill is mentioned in the
Denver Post positively associates with the party difference of the roll-call votes on that bill.
Figure 16 shows a similar relationship exists in Ohio. The controversial Senate Bill 5 is
excluded from this figure to better show the relationship of the majority of the data. There
were 595 articles about SB 5, and the average party difference on the five votes on the bill
was a very high 0.87.
136
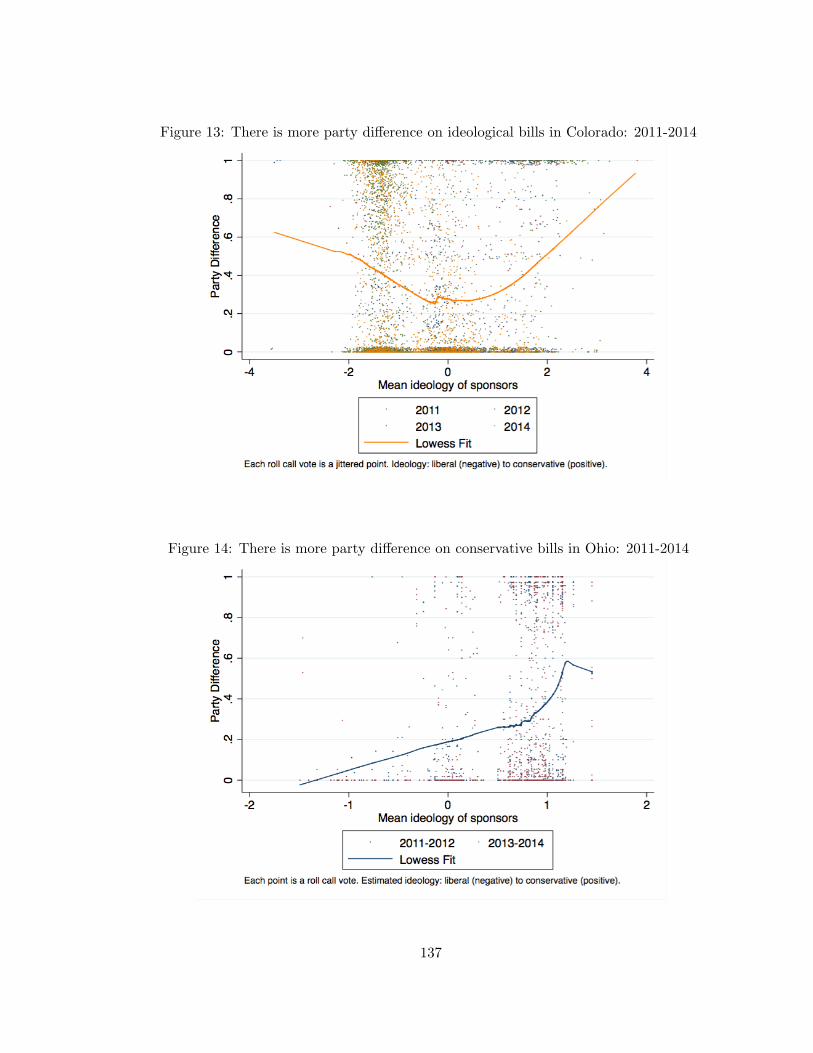
Figure 13: There is more party difference on ideological bills in Colorado: 2011-2014
Figure 14: There is more party difference on conservative bills in Ohio: 2011-2014
137
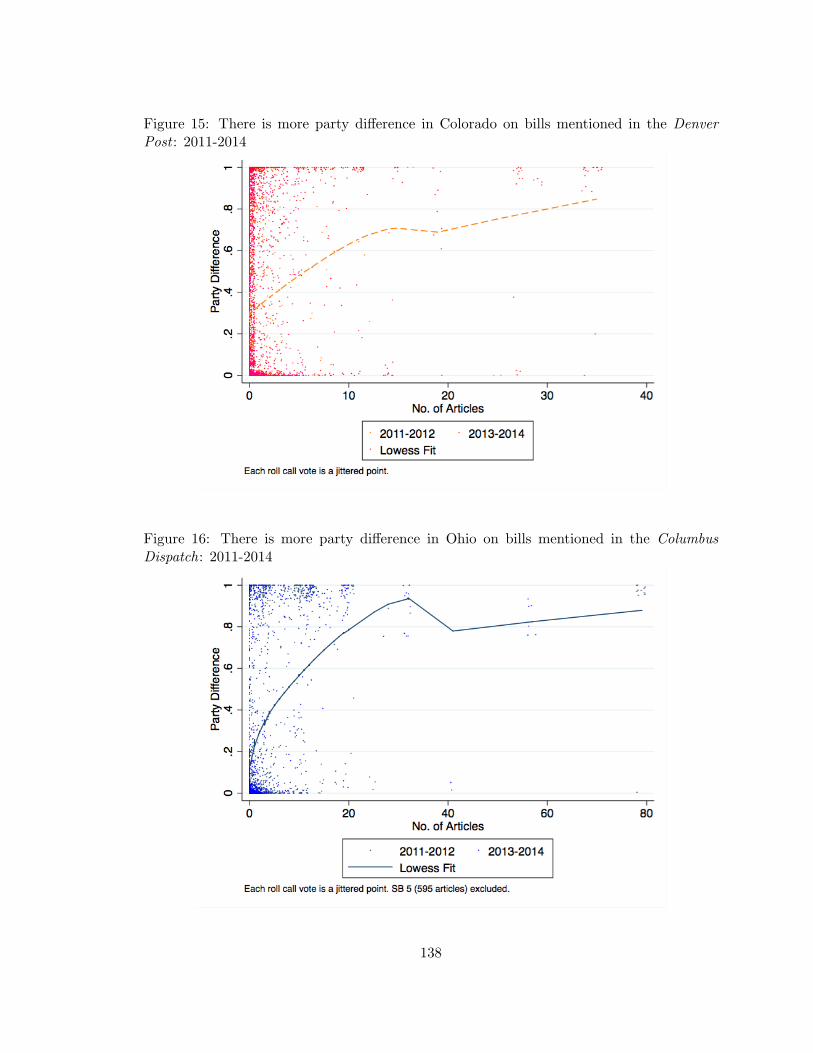
Figure 15: There is more party difference in Colorado on bills mentioned in the DenverPost : 2011-2014
Figure 16: There is more party difference in Ohio on bills mentioned in the ColumbusDispatch: 2011-2014
138

B.2.3. Policy types and polarization
The Congressional Bills Project assigns each roll call vote in Congress a Policy Agendas
Project major topic code. In Chapter 4, I use these codes to insert policy fixed effects
into the Congressional regression model. These codes also allow for the observation of the
varying levels of party difference across policy areas.
The blue bars in Figure 17 show that the policy areas with the most party difference in the
111th and 112th Congresses were environment and macroeconomic policy. This evidence
follows the discussion from Chapter 4, regarding the partisan nature of climate change
legislation and also the economic stiumulus proposed by the Obama administration. The
least polarized issue areas are international affairs and education.
Figure 17 shows that there the association between policies areas and salience is not as
close as it is in the states. Some areas with high amounts of coverage — like agriculture
and defense — are not particularly polarized. These measures come with two caveats
though: they are aggregate measures. So, if a single large bill, such as the climate change
bill, receives a lot of coverage it will not be reflected in the figure. Furthermore, the
Congressional Quarterly Almanac documents Congress differently than more public facing
newspapers, it may not blanket coverage the same way that the Columbus Dispatch covered
SB 5.
B.2.4. Summary
This appendix described the data collection and processing procedure for Chapter 4. It also
explored these data to reinforce a number of the relationships discussed in Chapter 4. It
finds that press coverage of bills associates with party difference in state legislatures. The
ideology of a bill’s sponsor is related to party difference in Colorado; however, it only is
positively associated with conservative ideology in Ohio. Finally, I show the different levels
of party difference by policy area in Congress, as well as the coverage of bills in those policy
139

Figure 17: Party difference and salience by policy area in Congress: 2009-2012
areas in the Congressional Quarterly.
140

APPENDIX Supporting materials for Chapter 5
In Chapter 5, I estimated how national each policy on a state-level agenda is. After pro-
ducing such a measure, I scored each state’s agenda to find that states with more national
agendas were more polarized.
In this supplemental chapter I examine the construction of both of the independent and
dependent variables in these tests. I first describe the data used to produce the national
policy score, the calculation of the score itself, and run a number of validation exercises. I
show that the policies that are national in one state are national in the other states. This
allows me to generalize the national policy scores generated from a sample of three states
to a nationwide sample of 25 states with confidence.
The dependent variable that I use to test how polarized a state’s legislature is: party
difference, differs from much of the literature on state legislative polarization that uses
ideal point estimation. Therefore, in the final section of this chapter I rerun the test using
ideal point estimates of polarization as a dependent variable to replicate my results from
Chapter 5.
C.1. Measuring National Policies
In Chapter 5, I establish a theoretic rationale for using interest group lobbyists to proxy for
the information environment faced by state legislators on a given policy area. There is an
important difference between this model and the interest group lobbying model in Chapter
3. Specifically in Chapter 3 I am interested in the ability of interest groups to get their
issues on the agenda. In Chapter 5, I consider the view of state legislators as they deal
with many interest groups, especially in terms of their constituents. In this regard, there
are two differences. First, the voice of certain groups (advocacy organizations with citizen
membership) will be more important. Second, the information on any issue that these
groups care about, not just their sector, will be important. In Chapter 3, I am measuring
141

where all lobbying groups sit, in Chapter 5, I measure where interest groups stand on the
issues.
With these demands in mind, Table 34 describes the data that was collected because they
met these demands. Only three states (Pennsylvania, Indiana and Tennessee) require lob-
byists to fill out a detailed checklist of their interests.1 An added benefit to these states is
that lobbyists are provided with similar options to describe their interests. In fact, 75 of
the choices in Indiana and Pennsylvania are identical. Tennessee’s subject interests are not
as detailed and do not precisely align with Pennsylvania and Indiana.
Table 34: Lobbyist Registration Data: 2011-2014
State Subjects Organizations Registrations Source
Indiana 84 1,360 4,864 Scraped from in.gov/ilrc/
Pennsylvania 101 1,920 5,186 Downloaded frompalobbyingservices.state.pa.us
Tennessee 44 996 2,570 Scraped from apps.tn.gov
Table 35 shows the mapping of codes provided by Open States (which categorize the roll call
votes in 26 states) and the three sample states. I set out to find the closest match between
the Open States code and the codes across the three states. In order to resolve ambiguities,
I used the detailed codebook provided by the Pennsylvania version of the Policy Agendas
Project (McLaughlin et al., 2010).
There are only two modifications to the Open States codes. First, in subject code 28,
five categories are aggregated to “State Government”: “Legislative affairs”, “Government
reform”, “State agencies”, “Executive branch”, and then “Federal, state and local relations.”
This was done because lobbyists were not queried about their interests in state governmental
issues with that level of detail. There is also a catch-all category in subject code 23 called
“Other,” which includes Open States’ original “Other” category as well as categories that
did not have a sufficient match from the subject codes provided to lobbyists in any of the
three states listed in a footnote to Table 35. Table 36 contains the codes from these states1Texas is the fourth state that uses a checklist, however it organizes its data according to individual
lobbyists who can have a number of clients, so it’s not possible to deduce the interests of principals.
142
that did not fit in to the coding scheme.
Because of the large number of omitted categories, I also code every subject in the three
states’ data according to the Policy Agenda’s major topic codes. I do not do this earlier
because many of the codes which PAP aggregates together (e.g. immigration and gay
rights issues are both coded as “Civil Rights”) are conceptually distinct and separated in
the bill data, which is why I disaggregate the lobbying data. However, later grouping all of
the groups by the PAP major topic codes will allow me to validate that issues which are
national in one state and national in all states. This helps me build a conceptual bridge to
the more specific policy codes that match the subject codes in the roll-call data.
143
Collection Details
The state legislative lobbying data was acquired from each state’s website. The Indiana
data was scraped from the state’s Lobbying Registration Commission website, as it is not
made available to the public as a download. I created an API to cycle through the sev-
eral thousand registrations and return the group name and each group’s stated interests
in spreadsheet format. Pennsylvania’s Department of State makes lobbying disclosures
available via spreadsheet download. I also created an API to scrape the data in Tennessee.
The US Congress lobbying data was downloaded as XML files and converted to a STATA
file for text analysis. Copies of these datasets are available from the author.2
In order to match groups from the state level to the national level, I stripped geographic tags
(e.g. Indiana Chapter of..., National Association of..., Local No. 20 ) from organization
names, and then compared the list of organization using a Latent Dirichlet Allocation
algorithm (see http://fmwww.bc.edu/RePEc/bocode/s/strgroup.html) meant to detect
misspellings and close name associations. The algorithm was run at different bandwidths:
0.15, 0.25, 0.35, and successful matches were identified by hand and removed. This process
was repeated for the IRS dataset.
C.1.1. Identifying national interest groups
To highlight national interest groups, I first separate groups into four categories: business
firms, non-profits, public sector and lobbying firms. Since all advocacy groups are non-
profits by definition, I first identify these groups. This is done differently for the three states.
Indiana requires organizations to report their status as a non-profit 501(c)(3) or 501(c)(4)
organization. Pennsylvania requires associations to self-declare. I code these groups as being
non-profit. I then cross-referenced the list of organizations with each state’s Secretary of
State database of firms. If an organization is listed as not-for-profit I code them as being
2This data collection was done prior to the collection done for Chapter 4 that uses a more completedataset form the Center for Responsive Politics.
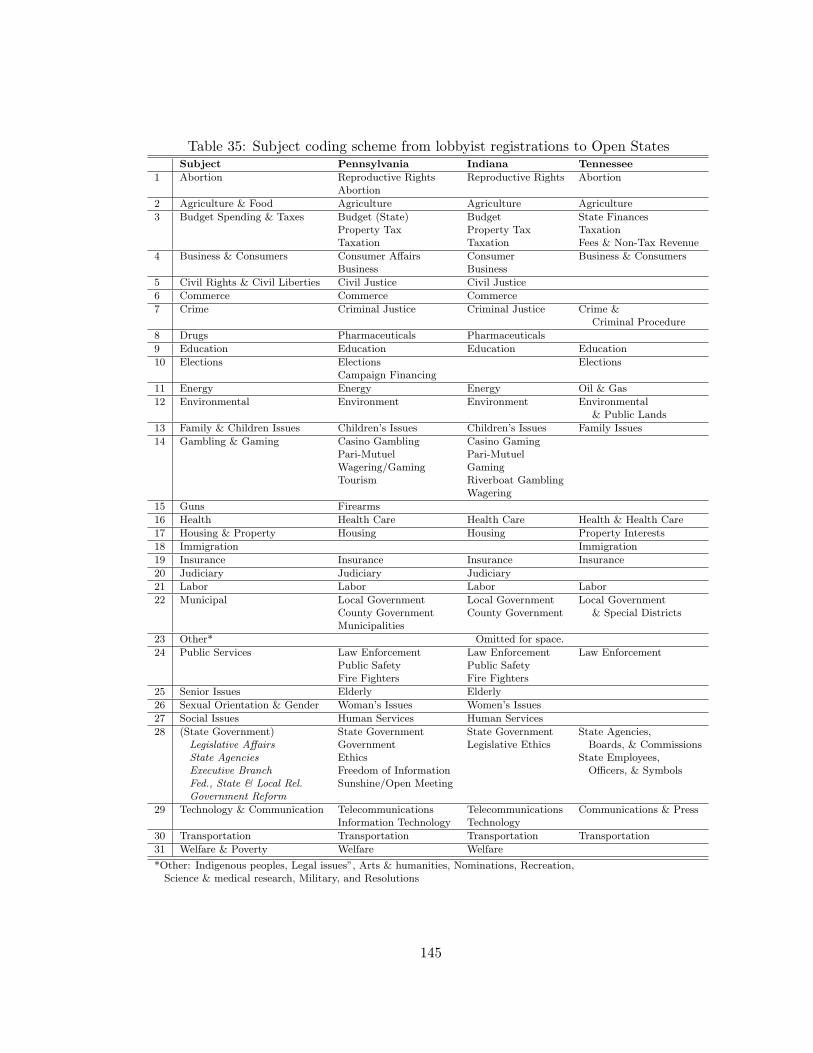
Table 35: Subject coding scheme from lobbyist registrations to Open StatesSubject Pennsylvania Indiana Tennessee
1 Abortion Reproductive Rights Reproductive Rights AbortionAbortion
2 Agriculture & Food Agriculture Agriculture Agriculture
3 Budget Spending & Taxes Budget (State) Budget State FinancesProperty Tax Property Tax TaxationTaxation Taxation Fees & Non-Tax Revenue
4 Business & Consumers Consumer Affairs Consumer Business & ConsumersBusiness Business
5 Civil Rights & Civil Liberties Civil Justice Civil Justice
6 Commerce Commerce Commerce
7 Crime Criminal Justice Criminal Justice Crime &Criminal Procedure
8 Drugs Pharmaceuticals Pharmaceuticals
9 Education Education Education Education
10 Elections Elections ElectionsCampaign Financing
11 Energy Energy Energy Oil & Gas
12 Environmental Environment Environment Environmental& Public Lands
13 Family & Children Issues Children’s Issues Children’s Issues Family Issues
14 Gambling & Gaming Casino Gambling Casino GamingPari-Mutuel Pari-MutuelWagering/Gaming GamingTourism Riverboat Gambling
Wagering
15 Guns Firearms
16 Health Health Care Health Care Health & Health Care
17 Housing & Property Housing Housing Property Interests
18 Immigration Immigration
19 Insurance Insurance Insurance Insurance
20 Judiciary Judiciary Judiciary
21 Labor Labor Labor Labor
22 Municipal Local Government Local Government Local GovernmentCounty Government County Government & Special DistrictsMunicipalities
23 Other* Omitted for space.
24 Public Services Law Enforcement Law Enforcement Law EnforcementPublic Safety Public SafetyFire Fighters Fire Fighters
25 Senior Issues Elderly Elderly
26 Sexual Orientation & Gender Woman’s Issues Women’s Issues
27 Social Issues Human Services Human Services
28 (State Government) State Government State Government State Agencies,Legislative Affairs Government Legislative Ethics Boards, & CommissionsState Agencies Ethics State Employees,Executive Branch Freedom of Information Officers, & SymbolsFed., State & Local Rel. Sunshine/Open MeetingGovernment Reform
29 Technology & Communication Telecommunications Telecommunications Communications & PressInformation Technology Technology
30 Transportation Transportation Transportation Transportation
31 Welfare & Poverty Welfare Welfare
*Other: Indigenous peoples, Legal issues”, Arts & humanities, Nominations, Recreation,Science & medical research, Military, and Resolutions
145
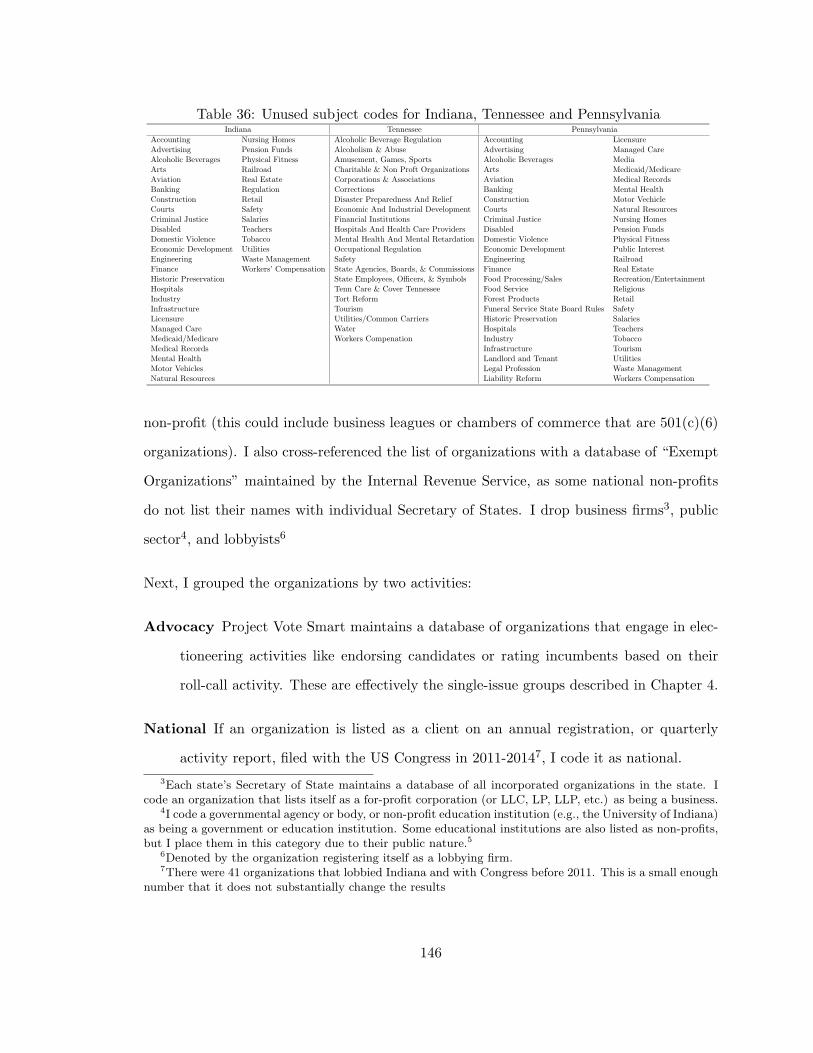
Table 36: Unused subject codes for Indiana, Tennessee and PennsylvaniaIndiana Tennessee Pennsylvania
Accounting Nursing Homes Alcoholic Beverage Regulation Accounting LicensureAdvertising Pension Funds Alcoholism & Abuse Advertising Managed CareAlcoholic Beverages Physical Fitness Amusement, Games, Sports Alcoholic Beverages MediaArts Railroad Charitable & Non Proft Organizations Arts Medicaid/MedicareAviation Real Estate Corporations & Associations Aviation Medical RecordsBanking Regulation Corrections Banking Mental HealthConstruction Retail Disaster Preparedness And Relief Construction Motor VechicleCourts Safety Economic And Industrial Development Courts Natural ResourcesCriminal Justice Salaries Financial Institutions Criminal Justice Nursing HomesDisabled Teachers Hospitals And Health Care Providers Disabled Pension FundsDomestic Violence Tobacco Mental Health And Mental Retardation Domestic Violence Physical FitnessEconomic Development Utilities Occupational Regulation Economic Development Public InterestEngineering Waste Management Safety Engineering RailroadFinance Workers’ Compensation State Agencies, Boards, & Commissions Finance Real EstateHistoric Preservation State Employees, Officers, & Symbols Food Processing/Sales Recreation/EntertainmentHospitals Tenn Care & Cover Tennessee Food Service ReligiousIndustry Tort Reform Forest Products RetailInfrastructure Tourism Funeral Service State Board Rules SafetyLicensure Utilities/Common Carriers Historic Preservation SalariesManaged Care Water Hospitals TeachersMedicaid/Medicare Workers Compenation Industry TobaccoMedical Records Infrastructure TourismMental Health Landlord and Tenant UtilitiesMotor Vehicles Legal Profession Waste ManagementNatural Resources Liability Reform Workers Compensation
non-profit (this could include business leagues or chambers of commerce that are 501(c)(6)
organizations). I also cross-referenced the list of organizations with a database of “Exempt
Organizations” maintained by the Internal Revenue Service, as some national non-profits
do not list their names with individual Secretary of States. I drop business firms3, public
sector4, and lobbyists6
Next, I grouped the organizations by two activities:
Advocacy Project Vote Smart maintains a database of organizations that engage in elec-
tioneering activities like endorsing candidates or rating incumbents based on their
roll-call activity. These are effectively the single-issue groups described in Chapter 4.
National If an organization is listed as a client on an annual registration, or quarterly
activity report, filed with the US Congress in 2011-20147, I code it as national.
3Each state’s Secretary of State maintains a database of all incorporated organizations in the state. Icode an organization that lists itself as a for-profit corporation (or LLC, LP, LLP, etc.) as being a business.
4I code a governmental agency or body, or non-profit education institution (e.g., the University of Indiana)as being a government or education institution. Some educational institutions are also listed as non-profits,but I place them in this category due to their public nature.5
6Denoted by the organization registering itself as a lobbying firm.7There were 41 organizations that lobbied Indiana and with Congress before 2011. This is a small enough
number that it does not substantially change the results
146

Table 37 shows the share of groups reporting an interest in each policy area that are national
and advocacy organizations. This table is sorted by the share national in Pennsylvania and
raises three points. First, the general order of issues in one state, like Insurance being more
national than Education, holds in other states. Later I will test this association directly.
Table 37 also shows that there are gaps in between the subjects. For example, group interest
in guns can only be observed in Pennsylvania. Second, it shows the need to balance between
the share of groups that are national and the share that are advocacy groups.
Table 37: Interest group characteristics by policy area: 2011-2014Pennsylvania Indiana Tennessee
Topic % Nat. % Advoc. % Nat. % Advoc. % Nat. % Advoc.
1 Guns 0.91 0.36
2 Insurance 0.82 0.20 0.67 0.17 0.59 0.13
3 Drugs 0.81 0.24 0.65 0.23
4 Labor & Employment 0.74 0.52 0.59 0.22 0.55 0.21
5 Campaign Finance & Election Issues 0.73 0.66 0.68 0.45
6 Reproductive Issues 0.73 0.57 0.67 0.52 0.85 0.71
7 Crime 0.71 0.30 0.54 0.23 0.61 0.22
8 Sex Gender Issues 0.71 0.33 0.64 0.38
9 Health 0.70 0.14 0.58 0.17 0.62 0.17
10 Business & Consumers 0.66 0.18 0.53 0.14 0.53 0.12
11 Public Services 0.64 0.37 0.52 0.13 0.47 0.22
12 Senior Issues 0.63 0.19 0.56 0.23
13 Gambling & Gaming 0.63 0.28 0.52 0.18
14 State Government 0.62 0.41 0.51 0.21
15 Commerce 0.62 0.24 0.49 0.13
16 Technology & Communications 0.61 0.35 0.46 0.18 0.59 0.21
17 Transportation 0.61 0.20 0.50 0.11 0.54 0.20
18 Civil Liberties & Civil Rights 0.61 0.32 0.67 0.36
19 Budget Spending & Taxes 0.60 0.30 0.45 0.11 0.58 0.19
20 Environmental 0.60 0.24 0.48 0.14 0.65 0.27
21 Housing & Property 0.59 0.09 0.50 0.17 0.61 0.11
22 Energy 0.59 0.19 0.50 0.18 0.51 0.16
23 Welfare & Poverty 0.59 0.16 0.50 0.20
24 Judiciary 0.57 0.35 0.54 0.29
25 Agriculture & Food 0.57 0.23 0.45 0.21 0.59 0.33
26 Municipal & County Issues 0.56 0.35 0.39 0.17 0.45 0.21
27 Family & Children Issues 0.55 0.14 0.51 0.19 0.64 0.32
28 Education 0.49 0.16 0.44 0.17 0.58 0.23
29 Social Issues 0.47 0.10 0.55 0.20
30 Animal Rights & Wildlife Issues 0.70 0.29
31 Immigration 0.53 0.33
To address these concerns I take two steps. First, I standardize the measurements for each
state. This entails subtracting each observation from the category mean, and dividing it
147
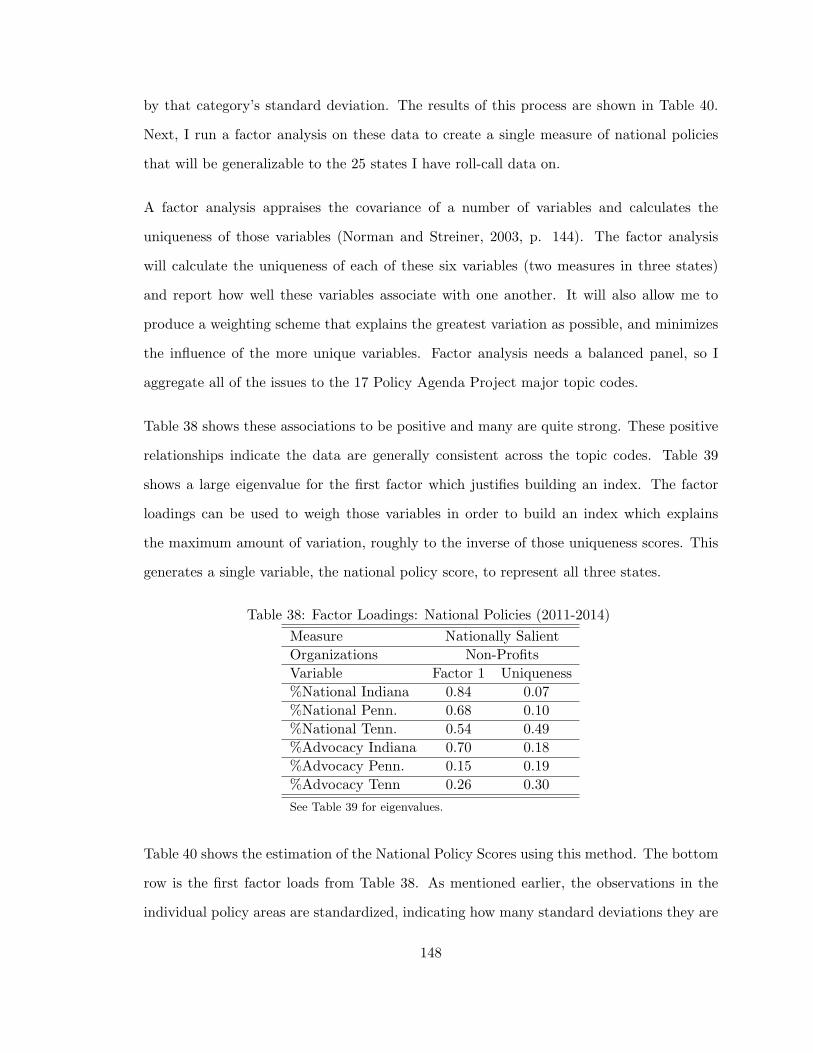
by that category’s standard deviation. The results of this process are shown in Table 40.
Next, I run a factor analysis on these data to create a single measure of national policies
that will be generalizable to the 25 states I have roll-call data on.
A factor analysis appraises the covariance of a number of variables and calculates the
uniqueness of those variables (Norman and Streiner, 2003, p. 144). The factor analysis
will calculate the uniqueness of each of these six variables (two measures in three states)
and report how well these variables associate with one another. It will also allow me to
produce a weighting scheme that explains the greatest variation as possible, and minimizes
the influence of the more unique variables. Factor analysis needs a balanced panel, so I
aggregate all of the issues to the 17 Policy Agenda Project major topic codes.
Table 38 shows these associations to be positive and many are quite strong. These positive
relationships indicate the data are generally consistent across the topic codes. Table 39
shows a large eigenvalue for the first factor which justifies building an index. The factor
loadings can be used to weigh those variables in order to build an index which explains
the maximum amount of variation, roughly to the inverse of those uniqueness scores. This
generates a single variable, the national policy score, to represent all three states.
Table 38: Factor Loadings: National Policies (2011-2014)
Measure Nationally Salient
Organizations Non-Profits
Variable Factor 1 Uniqueness
%National Indiana 0.84 0.07
%National Penn. 0.68 0.10
%National Tenn. 0.54 0.49
%Advocacy Indiana 0.70 0.18
%Advocacy Penn. 0.15 0.19
%Advocacy Tenn 0.26 0.30
See Table 39 for eigenvalues.
Table 40 shows the estimation of the National Policy Scores using this method. The bottom
row is the first factor loads from Table 38. As mentioned earlier, the observations in the
individual policy areas are standardized, indicating how many standard deviations they are
148

Table 39: Factor Analysis Results: National Policies (2011-2014)
Eigenvalue
Factor 1 2.04
Factor 2 1.53
Factor 3 0.83
Factor 4 0.25
Factor 5 -0.09
Factor 6 -0.15
Variables %National & %Advocacy
from the category mean. The last column of Table 40 corresponds to Table 10 in the main
text.
C.1.2. Validating the national policy estimates
The National Policy score produced in 40 bundles lots of information from different. To
evaluate the external validity of the National Policy scores, I first test to see if the individual
policy areas that are national in one state will be national in other states as well.
Due to the missing data issues described in the previous section, I first examine the interest
group community on 75 issues with the exact same terminology in Indiana and Pennsylva-
nia8
Table 41 shows the results of a regression with the share of Indiana non-profits that are
national (or advocacy organizations) for each issue as a dependent variable, and Pennsyl-
vania’s as the independent variable. The coefficient in column (1) shows a 0.47 association
between the 75 identical categories in the two states. On the whole, subject areas are more
national in Pennsylvania, and it is a positive relationship. The association in column (1) is
positive and significantly distinguishable from zero.
Unfortunately this comparison excludes a good deal of organizations in both of these states
that do not have the exact same policy codes. Therefore, I aggregate the subject areas to
8Or at least nearly identical, I align Pennsylvania’s “Woman’s Issues” to Indiana’s “Women’s Issues”,“Workers Compensation” to “Workers’ Compensation”, “Budget (State)” to “Budget”, and “Casino Gam-bling” to “Casino Gaming.”
149

Table 40: Detailed esimation of National Policy ScoresTopic %Nat IN %Nat PA %Nat TN %Adv IN %Adv PA %Adv TN Scaled
1 Abortion 0.28 0.23 0.77 0.67 0.64 1.08 0.52
2 Guns 1.15 0.25 0.26
3 Sex & Gender 0.22 0.20 0.43 0.20 0.20
4 Drugs 0.24 0.46 0.14 0.01 0.19
5 Campaigns 0.30 0.24 0.88 0.52 0.19
6 Insurance 0.28 0.49 0.05 0.00 -0.10 -0.16 0.17
7 Civil Rights 0.28 -0.04 0.38 0.19 0.16
8 Labor 0.11 0.25 -0.04 0.11 0.57 0.05 0.13
9 Crime 0.01 0.20 0.09 0.13 0.15 0.08 0.10
10 Health 0.09 0.16 0.11 -0.02 -0.28 -0.06 0.05
11 Judiciary 0.02 -0.11 0.26 0.24 0.05
12 Seniors 0.05 0.01 0.13 -0.11 0.04
13 State Gov. -0.03 0.00 0.08 0.34 0.03
15 Immigration -0.07 0.30 0.01
16 Family & Kids -0.04 -0.14 0.15 0.05 -0.30 0.28 0.00
17 Gambling -0.02 0.01 0.01 0.06 0.00
18 Environmental -0.11 -0.04 0.18 -0.10 0.01 0.18 -0.01
19 Agriculture -0.17 -0.11 0.05 0.10 -0.01 0.30 -0.02
20 Tech & Comm -0.14 -0.02 0.04 0.01 0.23 0.05 -0.02
21 Welfare & Pov -0.07 -0.07 0.06 -0.19 -0.03
22 Public Services -0.04 0.05 -0.19 -0.12 0.26 0.08 -0.04
23 Business -0.01 0.08 -0.07 -0.09 -0.13 -0.24 -0.04
24 Energy -0.06 -0.07 -0.11 0.03 -0.11 -0.08 -0.06
25 Commerce -0.09 -0.02 -0.14 0.02 -0.06
26 Housing & Prop -0.06 -0.06 0.09 0.00 -0.52 -0.24 -0.06
27 Social Issues 0.03 -0.31 0.08 -0.45 -0.06
28 Transportation -0.07 -0.02 -0.05 -0.21 -0.08 0.02 -0.08
29 Budget & Taxes -0.17 -0.04 0.02 -0.20 0.13 -0.01 -0.09
30 Education -0.20 -0.26 0.03 0.00 -0.20 0.09 -0.11
31 Muni & County -0.29 -0.13 -0.22 -0.01 0.23 0.06 -0.13
Factor 1 Load 0.84 0.68 0.54 0.70 0.15 0.26
Omitted for space (rank): Uncategorized (14). Standardized (i = Subject) = (Xi − Xi)/SDi
150

the major topic codes in the Policy Agendas Project, which allows me to use every regis-
tration. As noted by Ansolabehere, Rodden, and Snyder (2008), the benefit of aggregation
is a reduction in the variance of measurement error. I re-run the Indiana and Pennsylvania
test using this aggregated data. In column (3) of Table 41, where the interest group sub-
jects are aggregated to Policy Agenda Project major topic codes, the association improves
dramatically. This strong relationship is evident in Figure 18, which shows a dotted line to
signify what a perfect 1.0 correlation between the two states would be. The strong associ-
ation between the two states indicates that the share of organizations in Pennsylvania and
Indiana that also lobby Congress, or engage in electioneering activities is consistent.
Table 41: Association between Indiana (DV) and Penn. (IV): Weighed by no. orgs
Subjects Matched PAP Major Topics(1) (2) (3) (4)
% National 0.469∗∗ 0.716∗∗
(0.080) (0.218)
% Advocacy 0.202∗∗ 0.155(0.054) (0.116)
Constant 0.190∗∗ 0.069∗∗ 0.104 0.150∗∗
(0.049) (0.009) (0.138) (0.032)
Observations 75 75 18 18
Standard errors in parentheses∗ p < 0.05, ∗∗ p < 0.01
C.1.3. Summary
This section shows the mechanics behind estimating the how national each policy area on a
state legislative agenda is. Specifically, I describe the collection of interest group lobbying
data from three states that require groups to disclose their interests. Using these interests as
a unit of analysis, I am able to calculate the share of non-profits that 1) also lobbied in the
US Congress, 2) were advocacy organization groups with citizen memberships. Combining
these two measures with a factor analysis, I am able to calculate precisely how national each
issue is. In the main chapter, I describe the face validity of these measures. In this appendix
section I conduct empirical tests to show how issues that are national in one state tend to be
151
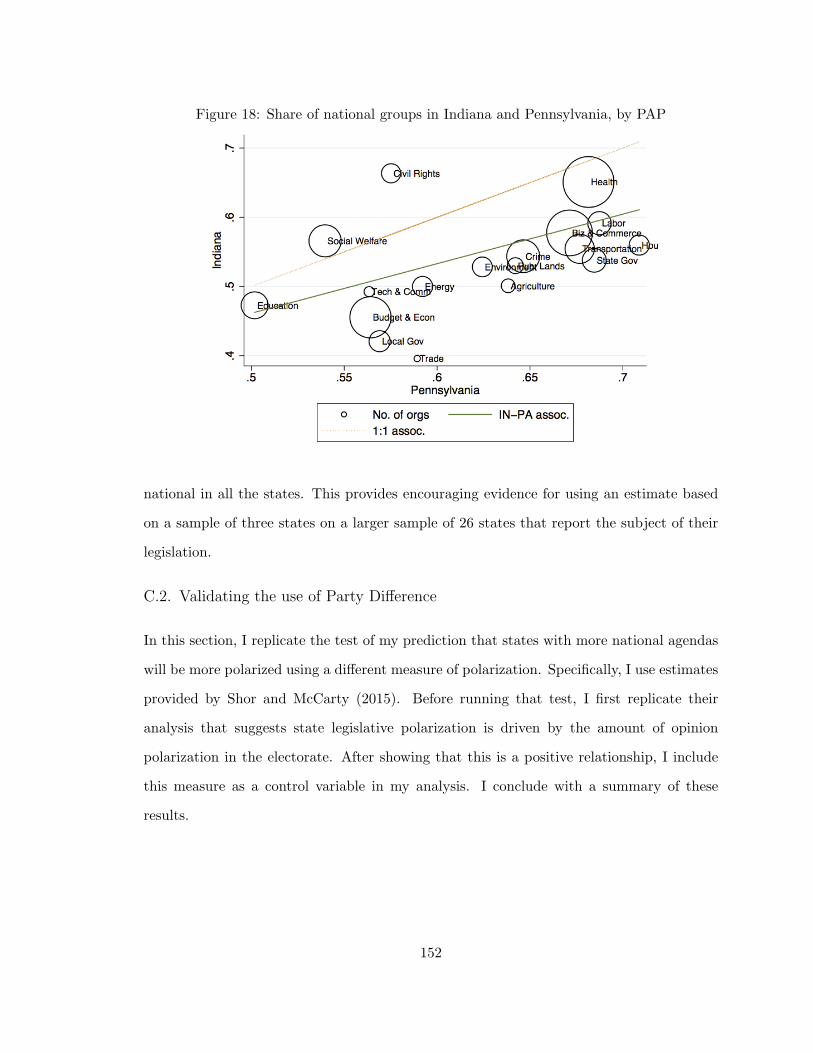
Figure 18: Share of national groups in Indiana and Pennsylvania, by PAP
national in all the states. This provides encouraging evidence for using an estimate based
on a sample of three states on a larger sample of 26 states that report the subject of their
legislation.
C.2. Validating the use of Party Difference
In this section, I replicate the test of my prediction that states with more national agendas
will be more polarized using a different measure of polarization. Specifically, I use estimates
provided by Shor and McCarty (2015). Before running that test, I first replicate their
analysis that suggests state legislative polarization is driven by the amount of opinion
polarization in the electorate. After showing that this is a positive relationship, I include
this measure as a control variable in my analysis. I conclude with a summary of these
results.
152

C.2.1. Does opinion polarization associate with legislative polarization?
Shor and McCarty (2011) report that the spatial variation across state legislatures can be
accounted for by the difference in the ideological divide of self-reported partisans. This is
measured by the ideological distance of self-reported partisans in the 2000, 2004 and 2008
National Annenberg Election Studies aggregated by state. Continuing to use each state
as the unit of analysis, I take two steps to replicate and extend this result. First, I use
an updated dataset from Shor and McCarty (2015) that fills previous gaps in their data.
They report the average difference between party medians in each chamber which I average
together for each state.
Second, I use the 2012 Cooperative Congressional Election Survey since the National An-
nenberg Election Studies was last conducted in 2008. Fortunately, the questions being asked
(about partisan identification and liberal/conservative ideology) were nearly identical across
the two surveys. Table 42 shows that for the years in Shor and McCarty’s original sample,
the relationship holds with their updated data. Furthermore it shows that the 2012 result
is in line with the previous decade’s results.
Table 42: Legislative and Opinion Polarization 2000-2012
(1) (2) (3) (4)2000 2004 2008 2012
Opinion Polarization 0.774∗ 1.150∗ 1.956∗ 1.583∗
(0.242) (0.330) (0.388) (0.404)
Constant 0.709∗ 0.273 -0.907 -1.185(0.202) (0.325) (0.467) (0.712)
N 48 48 50 48R2 0.181 0.209 0.347 0.250
Standard errors in parentheses∗ p < 0.01
C.2.2. Retesting the agenda based account
While the measure I use in Chapter 5, party difference on floor votes, and the spatial
difference in party medians are measuring similar concepts, there are some discrepancies in
153
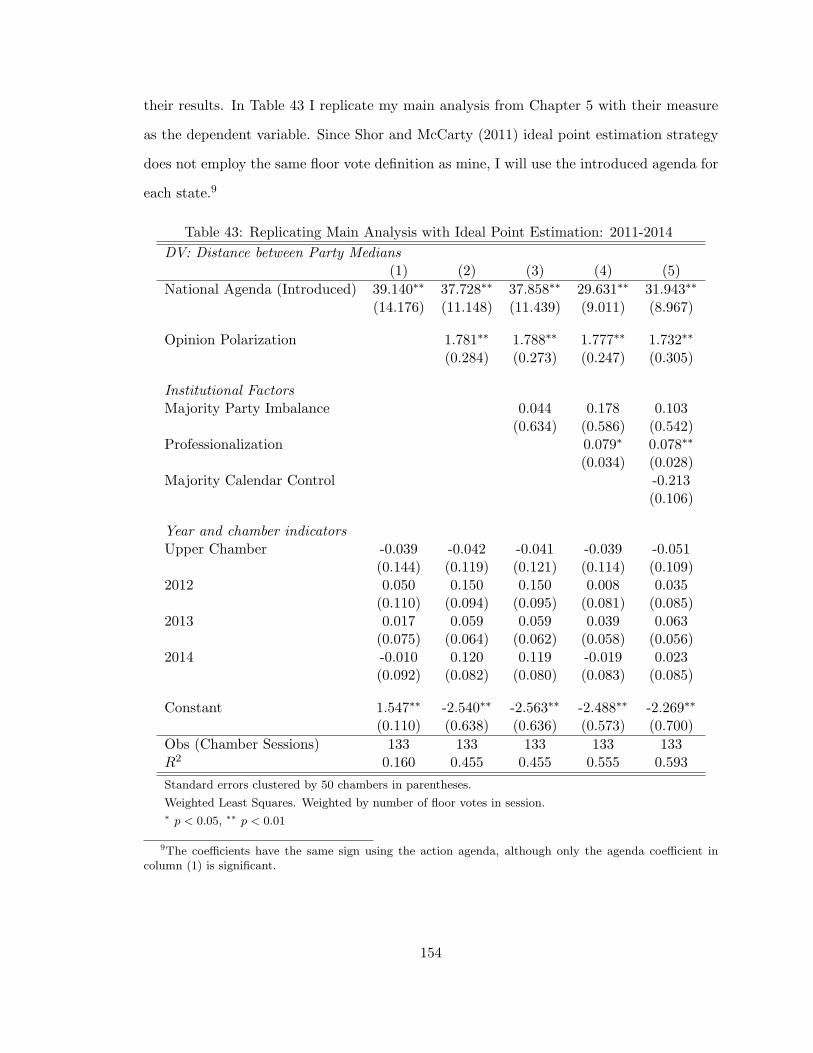
their results. In Table 43 I replicate my main analysis from Chapter 5 with their measure
as the dependent variable. Since Shor and McCarty (2011) ideal point estimation strategy
does not employ the same floor vote definition as mine, I will use the introduced agenda for
each state.9
Table 43: Replicating Main Analysis with Ideal Point Estimation: 2011-2014
DV: Distance between Party Medians(1) (2) (3) (4) (5)
National Agenda (Introduced) 39.140∗∗ 37.728∗∗ 37.858∗∗ 29.631∗∗ 31.943∗∗
(14.176) (11.148) (11.439) (9.011) (8.967)
Opinion Polarization 1.781∗∗ 1.788∗∗ 1.777∗∗ 1.732∗∗
(0.284) (0.273) (0.247) (0.305)
Institutional FactorsMajority Party Imbalance 0.044 0.178 0.103
(0.634) (0.586) (0.542)Professionalization 0.079∗ 0.078∗∗
(0.034) (0.028)Majority Calendar Control -0.213
(0.106)
Year and chamber indicatorsUpper Chamber -0.039 -0.042 -0.041 -0.039 -0.051
(0.144) (0.119) (0.121) (0.114) (0.109)2012 0.050 0.150 0.150 0.008 0.035
(0.110) (0.094) (0.095) (0.081) (0.085)2013 0.017 0.059 0.059 0.039 0.063
(0.075) (0.064) (0.062) (0.058) (0.056)2014 -0.010 0.120 0.119 -0.019 0.023
(0.092) (0.082) (0.080) (0.083) (0.085)
Constant 1.547∗∗ -2.540∗∗ -2.563∗∗ -2.488∗∗ -2.269∗∗
(0.110) (0.638) (0.636) (0.573) (0.700)
Obs (Chamber Sessions) 133 133 133 133 133R2 0.160 0.455 0.455 0.555 0.593
Standard errors clustered by 50 chambers in parentheses.
Weighted Least Squares. Weighted by number of floor votes in session.∗ p < 0.05, ∗∗ p < 0.01
9The coefficients have the same sign using the action agenda, although only the agenda coefficient incolumn (1) is significant.
154

C.2.3. Summary
The results in Table 43 are generally similar to the original results in Chapter 5, the only
difference is that professionalization is positive and significant in this model. This indicates
that party difference is a valid replacement for an ideal point estimation strategy in this
context. Ideal point estimation has its strengths, e.g. it can estimate how extreme an
individual is. However, my method closely tracks this estimation when its median is used
as a measure of polarization.
The only discrepancy between these models is that professionalization is a significant and
positive covariate using ideal point estimation and it is not when using party difference. I
attribute this difference to the extreme rating of state like California. According to Shor and
McCarty (2015), the distance between party medians in the 2014 California house is 3.1,
this is an astronomical figure. It also happens to correlate with California’s high measure
of professionalization. Party difference is bound from 0 to 1, which does not expose it to
outliers as much as ideal point estimation.
Furthermore, polarization as I conceive it in this dissertation: when legislators vote by party
is coherent and distinct from the other party, has a ceiling. Party difference captures this
ceiling.
155
BIBLIOGRAPHY
Abramowitz, Alan I, and Kyle L Saunders. 2008. “Is polarization a myth?” Journal ofPolitics 70 (2): 542-555.
Adler, E. Scott, and John Wilkerson. 2015. “Congressional Bills Project: 1998-2014.” NSF00880066 and 00880061.
Aldrich, John H. 1995. Why Parties?: The Origin and Transformation of Political Partiesin America. University of Chicago Press.
Aldrich, John H, and David W Rohde. 2000. “The republican revolution and the houseappropriations committee.” Journal of Politics 62 (1): 1–33.
Aldrich, John H, and James S Coleman Battista. 2002. “Conditional party government inthe states.” American Journal of Political Science 46 (1): 164–172.
Ansolabehere, Stephen, James Snyder, and Micky Tripathi. 2002. “Are PAC contributionsand lobbying linked? New evidence from the 1995 Lobby Disclosure Act.” Business andPolitics 4 (2): 131–155.
Ansolabehere, Stephen, Jonathan Rodden, and James M Snyder. 2008. “The strength ofissues: Using multiple measures to gauge preference stability, ideological constraint, andissue voting.” American Political Science Review 102 (02): 215–232.
Anzia, Sarah F, and Molly C Jackman. 2013. “Legislative Organization and the SecondFace of Power: Evidence from US State Legislatures.” The Journal of Politics 75 (01):210–224.
Austen-Smith, David, and John R Wright. 1994. “Counteractive lobbying.” American Jour-nal of Political Science: 25–44.
Bachrach, Peter, and Morton S Baratz. 1962. “Two faces of power.” American politicalscience review 56 (04): 947–952.
Bafumi, Joseph, and Michael C Herron. 2010. “Leapfrog representation and extremism: Astudy of American voters and their members in Congress.” American Political ScienceReview 104 (03): 519–542.
Bandow, Doug. 1995. Real term limits: now more than ever. Cato Institute.
Barber, Michael. 2016. “Ideological donors, contribution limits, and the polarization of statelegislatures.” Journal of Politics 78 (1): 1-21.
Barrilleaux, Charles, and Carlisle Rainey. 2014. “The politics of need examining gover-nors decisions to oppose the Obamacare Medicaid expansion.” State Politics & PolicyQuarterly 14 (4): 437–460.
156
Bartels, Larry M. 2009. Unequal democracy: The political economy of the new gilded age.Princeton University Press.
Baumgartner, Frank R, and Bryan D Jones. 1993. Agendas and instability in Americanpolitics. University of Chicago Press.
Baumgartner, Frank R, Jeffrey M Berry, Marie Hojnacki, Beth L Leech, and David CKimball. 2009. Lobbying and policy change: Who wins, who loses, and why. University ofChicago Press.
Baumgartner, Frank R, Virginia Gray, and David Lowery. 2009. “Congressional Influenceon State Lobbying Activity.” Political Research Quarterly 62 (3): 552-587.
Bawn, Kathleen, Martin Cohen, David Karol, Seth Masket, Hans Noel, and John Zaller.2012. “A Theory of Political Parties: Groups, Policy Demands and Nominations in Amer-ican Politics.” Perspectives on Politics 10 (3): 571-597.
Berry, Jeffrey M. 1999. “The new liberalism.” Washington, DC: Brookings Institute.
Binder, Mike, Vladimir Kogan, and Thad Kousser. 2011. “How GAVEL Changed Party Pol-itics in Colorados General Assembly.” State of Change: Colorado Politics in the Twenty-First Century.
Binder, Sarah A. 2003. Stalemate: Causes and consequences of legislative gridlock. Brook-ings Institution Press.
Birnbaum, Jeffrey H, and Alan S Murray. 1988. Showdown at Gucci Gulch: Lawmakers,lobbyists, and the unlikely triumph of tax reform. Vintage.
Bonica, Adam. 2013. “Ideology and interests in the political marketplace.” American Jour-nal of Political Science 57 (2): 294–311.
Bowen, Daniel C, and Zachary Greene. 2014. “Should We Measure Professionalism with anIndex? A Note on Theory and Practice in State Legislative Professionalism Research.”State Politics & Policy Quarterly: 277-296.
Butler, Daniel M, and David W Nickerson. 2011. “Can learning constituency opinion affecthow legislators vote? Results from a field experiment.” Quarterly Journal of PoliticalScience 6 (1): 55–83.
Butler, Daniel M, and Eleanor Neff Powell. 2014. “Understanding the Party Brand: Exper-imental Evidence on the Role of Valence.” The Journal of Politics 76 (02): 492–505.
Carmines, Edward G, and James Woods. 2002. “The role of party activists in the evolutionof the abortion issue.” Political Behavior 24 (4): 361–377.
Clemens, Austin, Michael Crespin, and Charles J Finocchiaro. 2015. “Earmarks
157

and Subcommittee Government in the US Congress.” American Politics Research:1532673X15576952.
Cohen, Jeffrey E. 2012. The President’s Legislative Policy Agenda, 1789–2002. CambridgeUniversity Press.
Cohen, Marty, David Karol, Hans Noel, and John Zaller. 2009. The party decides: Presi-dential nominations before and after reform. University of Chicago Press.
Converse, Philip E. 1962. The nature of belief systems in mass publics. Survey ResearchCenter, University of Michigan.
Darr, Joshua P. 2015. “Presence to Press: How Campaigns Earn Local Media.” PoliticalCommunication: 1–20.
De Figueiredo, John M, and Brian Kelleher Richter. 2014. “Advancing the Empirical Re-search on Lobbying.” Annual Review of Political Science 17: 163–185.
De Soto, William. 1995. “Cities in State Politics: Views of Mayors and Managers.” State &Local Government Review: 188–194.
Delli Carpini, Michael X., Scott Keeter, and J. David Kennamer. 1994. “Effects of the NewsMedia Environment on Citizen Knowledge of State Politics and Government.” Journalism& Mass Communication Quarterly 71 (June): 443–456.
Downs, Anthony. 1957. An Economic Theory of Democracy. New York: Harper.
Drutman, Lee Jared. 2015. The Business of America is Lobbying: How corporations becamepoliticized and politics became more corporate. Oxford University Press.
Dumitrescu, Elena-Ivona, and Christophe Hurlin. 2012. “Testing for Granger non-causalityin heterogeneous panels.” Economic Modelling 29 (4): 1450–1460.
Dusso, Aaron. 2008. “Legislation, political context, and interest group behavior.” PoliticalResearch Quarterly.
Fenno, Richard F. 1973. Congressmen in committees. Little, Brown Boston.
Fiorina, Morris, Samuel J. Abrams, and Jeremy Pope. 2006. Culture War?: The Myth of aPolarized America. Pearson Longman.
Garrett, Kristin N, and Joshua M Jansa. 2015. “Interest group influence in policy diffusionnetworks.” State Politics & Policy Quarterly: 1-24 1-24.
Gilens, Martin, and Benjamin I Page. 2014. “Testing theories of American politics: Elites,interest groups, and average citizens.” Perspectives on politics 12 (03): 564–581.
158

Granger, Clive WJ. 1969. “Investigating causal relations by econometric models and cross-spectral methods.” Econometrica: Journal of the Econometric Society: 424–438.
Grasse, Nathan, and Brianne Heidbreder. 2011. “The Influence of Lobbying Activity in StateLegislatures: Evidence from Wisconsin.” Legislative Studies Quarterly 36 (4): 567–589.
Gray, Virginia, and David Lowery. 1995. “Interest representation and democratic gridlock.”Legislative Studies Quarterly: 531–552.
Gray, Virginia, David Lowery, Matthew Fellowes, and Jennifer L Anderson. 2005. “Leg-islative Agendas and Interest Advocacy Understanding the Demand Side of Lobbying.”American Politics Research 33 (3): 404–434.
Gray, Virginia, John Cluverius, Jeffrey J Harden, Boris Shor, and David Lowery. 2014.“Party competition, party polarization, and the changing demand for lobbying in theAmerican states.” American Politics Research: 1532673X14547678.
Grimmer, Justin, and Brandon M Stewart. 2013. “Text as data: The promise and pitfallsof automatic content analysis methods for political texts.” Political Analysis: mps028.
Grodzins, Morton. 1966. “The American System.” Chicago: Rand McNally 78: 315–40.
Groeling, Tim. 2010. When politicians attack: Party cohesion in the media. CambridgeUniversity Press.
Grossmann, Matt, and Casey BK Dominguez. 2009. “Party coalitions and interest groupnetworks.” American Politics Research 37 (5): 767–800.
Grossmann, Matt, and David A Hopkins. 2015. “Ideological Republicans and group interestDemocrats: The asymmetry of American party politics.” Perspectives on Politics 13 (01):119–139.
Hall, Richard L, and Alan V Deardorff. 2006. “Lobbying as legislative subsidy.” AmericanPolitical Science Review 100 (01): 69–84.
Hansen, Wendy L, Neil J Mitchell, and Jeffrey M Drope. 2005. “The logic of private andcollective action.” American journal of political science 49 (1): 150–167.
Harden, Jeffrey J, and Justin H Kirkland. 2016. “Do Campaign Donors Influence Polar-ization? Evidence from Public Financing in the American States.” Legislative StudiesQuarterly 41 (1): 119–152.
Herrerias, Maria Jesus, Roselyne Joyeux, and Eric Girardin. 2013. “Short-and long-runcausality between energy consumption and economic growth: Evidence across regions inChina.” Applied Energy 112: 1483–1492.
Hertel-Fernandez, Alexander. 2014. “Who Passes Businesss “Model Bills”? Policy Capacityand Corporate Influence in US State Politics.” Perspectives on Politics 12 (03): 582–602.
159
Hertel-Fernandez, Alexander, Theda Skocpol, and Daniel Lynch. 2016. “Business Associa-tions, Conservative Networks, and the Ongoing Republican War over Medicaid Expan-sion.” Journal of health politics, policy and law: 3476141.
Hinchcliffe, Kelsey, and Frances E. Lee. 2015. “Party Competition and Conflict in StateLegislatures.” State Politics & Policy Quarterly Forthcoming.
Hoffmann, Robert, Chew-Ging Lee, Bala Ramasamy, and Matthew Yeung. 2005. “FDI andpollution: a granger causality test using panel data.” Journal of international develop-ment 17 (3): 311–317.
Hood, MV, Quentin Kidd, and Irwin L Morris. 2008. “Two sides of the same coin? Employ-ing Granger causality tests in a time series cross-section framework.” Political Analysis16 (3): 324–344.
Jackman, Molly C. 2014. “Parties, median legislators, and agenda setting: How legislativeinstitutions matter.” The Journal of Politics 76 (01): 259–272.
Jochim, Ashley E, and Bryan D Jones. 2013. “Issue Politics in a Polarized Congress.”Political Research Quarterly: 352–369.
Jones, Bryan D, and Frank R Baumgartner. 2005. The politics of attention: How governmentprioritizes problems. University of Chicago Press.
Jordan, Marty P., and Matt Grossmann. 2016. The Correlates of State Policy Project v.1.0.East Lansing, MI: Institute for Public Policy and Social Research (IPPSR).
Kahn, Matthew E. 1999. “The silver lining of rust belt manufacturing decline.” Journal ofUrban Economics 46 (3): 360–376.
Karch, Andrew. 2006. “National intervention and the diffusion of policy innovations.” Amer-ican Politics Research 34 (4): 403–426.
Karol, David. 2009. Party position change in American politics: Coalition management.Cambridge University Press.
Key, Valdimer O. 1964. “Politics, Parties and Pressure Groups.” New York: Thomas Crow-ell: 77.
Key, Valdimer Orlando. 1966. American State Politics: An Introduction. Knopf.
Kim, Sung Eun, Johannes Urpelainen, and Joonseok Yang. 2016. “Electric utilities andAmerican climate policy: lobbying by expected winners and losers.” Journal of PublicPolicy 36 (02): 251–275.
Kingdon, John W. 1984. Agendas, alternatives, and public policies. Vol. 45 Little, BrownBoston.
160

Kirkland, Justin H. 2014. “Ideological Heterogeneity and Legislative Polarization in theUnited States.” Political Research Quarterly: 1-14.
Koger, Gregory, Seth Masket, and Hans Noel. 2009. “Partisan webs: Information exchangeand party networks.” British Journal of Political Science 39 (03): 633–653.
Kollman, Ken. 1998. Outside lobbying: Public opinion and interest group strategies. Prince-ton University Press.
Krehbiel, Keith. 1993. “Where’s the Party?” British Journal of Political Science 23 (02):235–266.
Krehbiel, Keith. 2010. Pivotal politics: A theory of US lawmaking. University of ChicagoPress.
Laffer, Arthur B, Stephen Moore, and Jonathan Williams. 2011. Rich States, Poor States:ALEC-Laffer State Economic Competitiveness Index. 4th ed. Washington, DC: ALEC.
Langbein, Laura I, and Mark A Lotwis. 1990. “The political efficacy of lobbying and money:Gun control in the US House, 1986.” Legislative Studies Quarterly: 413–440.
Lapinski, John S. 2013. The Substance of Representation: Congress, American PoliticalDevelopment, and Lawmaking. Princeton University Press.
Lax, Jeffrey R, and Justin H Phillips. 2012. “The democratic deficit in the states.” AmericanJournal of Political Science 56 (1): 148–166.
Layman, Geoffrey C, Thomas M Carsey, John C Green, Richard Herrera, and RosalynCooperman. 2010. “Activists and conflict extension in American party politics.” AmericanPolitical Science Review 104 (02): 324–346.
Lee, Frances E. 2009. Beyond ideology: politics, principles, and partisanship in the USSenate. University of Chicago Press.
Lee, Frances E. 2015. “How party polarization affects governance.” Annual Review of Po-litical Science 18: 261–282.
Leech, Beth L, Frank R Baumgartner, Timothy M La Pira, and Nicholas A Semanko. 2005.“Drawing lobbyists to Washington: Government activity and the demand for advocacy.”Political Research Quarterly 58 (1): 19–30.
Lenz, Gabriel S. 2013. Follow the leader?: how voters respond to politicians’ policies andperformance. University of Chicago Press.
Levin, Andrew, Chien-Fu Lin, and Chia-Shang James Chu. 2002. “Unit root tests in paneldata: asymptotic and finite-sample properties.” Journal of econometrics 108 (1): 1–24.
161
Lewis, Daniel C, Saundra K Schneider, and William G Jacoby. 2015. “Institutional Char-acteristics and State Policy Priorities The Impact of Legislatures and Governors.” StatePolitics & Policy Quarterly: 1532440015586315.
Lewis, Jeffrey B, and Drew A Linzer. 2005. “Estimating regression models in which thedependent variable is based on estimates.” Political Analysis 13 (4): 345–364.
Lindblom, Charles E. 1959. “The Science of Muddling Through.” Public administrationreview: 79–88.
Loftis, Matt W, and Jaclyn J Kettler. 2014. “Lobbying from Inside the System Why LocalGovernments Pay for Representation in the US Congress.” Political Research Quarterly:1065912914563764.
Lowery, David, Virginia Gray, and Frank R Baumgartner. 2010. “Policy Attention in Stateand Nation: Is Anyone Listening to the Laboratories of Democracy?” Publius: TheJournal of Federalism: 1-25.
Lowery, David, Virginia Gray, and Matthew Fellowes. 2005. “Organized interests and po-litical extortion: A test of the fetcher bill hypothesis.” Social Science Quarterly 86 (2):368–385.
Lowery, David, Virginia Gray, Matthew Fellowes, and Jennifer Anderson. 2004. “Living inthe moment: Lags, leads, and the link between legislative agendas and interest advocacy.”Social Science Quarterly 85 (2): 463–477.
Lowi, Theodore J. 1972. “Four systems of policy, politics, and choice.” Public administrationreview 32 (4): 298–310.
Maestas, Cherie. 2000. “Professional legislatures and ambitious politicians: Policy respon-siveness of state institutions.” Legislative Studies Quarterly: 663–690.
Mahoney, Christine, and Frank R Baumgartner. 2015. “Partners in Advocacy: Lobbyistsand Government Officials in Washington.” The Journal of Politics 77 (1): 202–215.
Masket, Seth. 2009. No middle ground: How informal party organizations control nomina-tions and polarize legislatures. University of Michigan Press.
Masket, Seth E, and Michael G Miller. 2014. “Does Public Election Funding Create MoreExtreme Legislators? Evidence from Arizona and Maine.” State Politics & Policy Quar-terly: 1-17.
Mason, Lilliana. 2015. “I Disrespectfully Agree: The Differential Effects of Partisan Sortingon Social and Issue Polarization.” American Journal of Political Science 59 (1): 128–145.
Mayer, Jane. 2016. Dark money: The hidden history of the billionaires behind the rise ofthe radical right. Doubleday.
162
Mayhew, David R. 1991. Divided we govern. Yale University.
Mayo, Charles M, David D Perlmutter, and Daniel Riffe. 1988. “Comparison of media andother sources of information for Alabama legislators.” Journalism & Mass Communica-tion Quarterly 65 (1): 46–53.
McCann, Pamela J Clouser, Charles R Shipan, and Craig Volden. 2015. “Top-Down Federal-ism: State Policy Responses to National Government Discussions.” Publius: The Journalof Federalism: 1-31.
McCarty, Nolan, Jonathan Rodden, Boris Shor, Christopher Nicolas Tausanovitch, andChris Warshaw. 2014. “Geography, Uncertainty, and Polarization.” Available at SSRN2477157.
McCarty, Nolan, Keith T Poole, and Howard Rosenthal. 2009. “Does gerrymandering causepolarization?” American Journal of Political Science 53 (3): 666–680.
McGhee, Eric, Seth Masket, Boris Shor, Steven Rogers, and Nolan McCarty. 2013. “APrimary Cause of Partisanship? Nomination Systems and Legislator Ideology.” AmericanJournal of Political Science (October): n/a–n/a.
McLaughlin, Joseph P, Paul Wolfgang, J Wesley Leckrone, Justin Gollob, Jason Bossie, JayJennings, and Michelle J Atherton. 2010. “The Pennsylvania policy database project: Amodel for comparative analysis.” State Politics & Policy Quarterly 10 (3): 320–336.
Mitchell, William C., and Michael C. Munger. 1991. “Economic Models of Interest Groups:An Introductory Survey.” American Journal of Political Science 35 (2): 512-546.
Newmark, Adam J. 2005. “Measuring state legislative lobbying regulation, 1990–2003.”State Politics & Policy Quarterly 5 (2): 182–191.
Noel, Hans. 2014. Political Ideologies and Political Parties in America. Cambridge Univer-sity Press.
Norman, Geoffrey R, and David L Streiner. 2003. PDQ statistics. Vol. 1 PMPH-USA.
Persily, Nathaniel. 2015. Solutions to Political Polarization in America. Cambridge Univer-sity Press.
Pew, Research Center. 2014. “America’s Shifting Statehouse Press.”
Poole, Keith T, and Howard Rosenthal. 1985. “A spatial model for legislative roll callanalysis.” American Journal of Political Science: 357–384.
Poole, Keith T, and Howard Rosenthal. 2000. Congress: A political-economic history of rollcall voting. Oxford University Press.
163
Quadagno, Jill. 2011. “Interest-group influence on the patient protection and affordabilityact of 2010: winners and losers in the health care reform debate.” Journal of HealthPolitics, Policy and Law 36 (3): 449–453.
Quinn, Kevin M, Burt L Monroe, Michael Colaresi, Michael H Crespin, and Dragomir RRadev. 2010. “How to analyze political attention with minimal assumptions and costs.”American Journal of Political Science 54 (1): 209–228.
Riffe, Daniel. 1988. “Comparison of media and other sources of information for Alabamalegislators.” Journalism & Mass Communication Quarterly 65 (1): 46–53.
Rogers, Steven. 2013. “Accountability in State Legislatures: How Parties Perform in Officeand State Legislative Elections.” Vanderbilt University Working Paper.
Rosenthal, Alan. 1998. The decline of representative democracy. Washington, DC: CQ Press.
Schattschneider, Elmer E. 1960. The Semi-Sovereign People: A Realist’s View of Democracyin America. New York: Thomson Learning.
Schlozman, Kay Lehman, Sidney Verba, and Henry E Brady. 2012. The unheavenly chorus.Princeton University Press: Princeton, NJ, USA.
Schutze, Hinrich, Christopher D. Manning, and Prabhakar Raghavan. 2008. Introduction toInformation Retrieval. Cambridge Univ Press.
Seawright, Jason, and John Gerring. 2008. “Case selection techniques in case study researcha menu of qualitative and quantitative options.” Political Research Quarterly 61 (2): 294–308.
Shor, Boris, and Nolan McCarty. 2011. “The ideological mapping of American legislatures.”American Political Science Review 105 (3): 530–51.
Shor, Boris, and Nolan McCarty. 2015. “Aggregate State Legislator Shor-McCarty IdeologyData, June 2015 update.” http://dx.doi.org/10.7910/DVN/K7ELHW.
Sinclair, Barbara Deckard. 1977. “Determinants of aggregate party cohesion in the US Houseof Representatives, 1901-1956.” Legislative Studies Quarterly: 155–175.
Skocpol, Theda. 2004. “Voice and inequality: The transformation of American civic democ-racy.” Perspectives on Politics 2 (1): 3–20.
Snyder, James M, and Tim Groseclose. 2000. “Estimating party influence in congressionalroll-call voting.” American Journal of Political Science: 193–211.
Squire, Peverill. 2007. “Measuring state legislative professionalism: The squire index revis-ited.” State Politics & Policy Quarterly 7 (2): 211–227.
164
Stigler, George J. 1971. “The theory of economic regulation.” The Bell journal of economicsand management science: 3–21.
Stone, Philip J, Dexter C Dunphy, and Marshall S Smith. 1966. “The General Inquirer: AComputer Approach to Content Analysis.”.
Tan, Yue, and David H Weaver. 2009. “Local media, public opinion, and state legislativepolicies: Agenda setting at the state level.” The International Journal of Press/Politics.
Tarr, G Alan. 2001. “Laboratories of democracy? Brandeis, federalism, and scientific man-agement.” Publius: The Journal of Federalism 31 (1): 37–46.
Thomsen, Danielle M. 2014. “Ideological Moderates Wont Run: How Party Fit Matters forPartisan Polarization in Congress.” The Journal of Politics 76 (03): 786–797.
Truman, David B. 1951. “The governmental process: Public interests and public opinion.”Alfred A Knopf: New York.
Uslaner, Eric M, and Ronald E Weber. 1979. “US State Legislators’ Opinions and Percep-tions of Constituency Attitudes.” Legislative Studies Quarterly: 563–585.
Voorheis, John, Nolan McCarty, and Boris Shor. 2015. “Unequal Incomes, Ideology andGridlock: How Rising Inequality Increases Political Polarization.” Ideology and Gridlock:How Rising Inequality Increases Political Polarization (August 21, 2015).
Walker, Jack L. 1991. Mobilizing interest groups in America: Patrons, professions, andsocial movements. University of Michigan Press.
Williamson, Vanessa, Theda Skocpol, and John Coggin. 2011. “The Tea Party and theremaking of Republican conservatism.” Perspectives on Politics 9 (01): 25–43.
Wilson, James Q. 1989. Bureaucracy: What government agencies do and why they do it.Basic Books.
Wolfe, Michelle, Bryan D Jones, and Frank R Baumgartner. 2013. “A failure to commu-nicate: Agenda setting in media and policy studies.” Political Communication 30 (2):175–192.
Wright, Gerald C, and Nathaniel Birkhead. 2014. “The Macro Sort of the State Electorates.”Political Research Quarterly 67 (2): 426–439.
Zaller, John. 1992. The nature and origins of mass opinion. Cambridge university press.
Zhao, Xinshu, John G Lynch, and Qimei Chen. 2010. “Reconsidering Baron and Kenny:Myths and truths about mediation analysis.” Journal of consumer research 37 (2): 197–206.
165