INTERDISCIPLINARY APPROACH TO THE ... -...
70
INTERDISCIPLINARY APPROACH TO THE PREDIABETIC STATE: BONE – ENERGY HOMEOSTASIS AXIS, CLINICAL AND ETIOLOGICAL ASSOCIATIONS OF NON-ALCOHOLIC FATTY LIVER DISEASE AND INSULIN RESISTANCE Barbara Buday MD PhD Thesis Szeged 2016
-
Upload
duongquynh -
Category
Documents
-
view
213 -
download
0
Transcript of INTERDISCIPLINARY APPROACH TO THE ... -...

INTERDISCIPLINARY APPROACH TO THE PREDIABETIC STATE:
BONE – ENERGY HOMEOSTASIS AXIS, CLINICAL AND
ETIOLOGICAL ASSOCIATIONS OF NON-ALCOHOLIC FATTY
LIVER DISEASE AND INSULIN RESISTANCE
Barbara Buday MD
PhD Thesis
Szeged
2016
INTERDISCIPLINARY APPROACH TO THE PREDIABETIC STATE:
BONE – ENERGY HOMEOSTASIS AXIS, CLINICAL AND
ETIOLOGICAL ASSOCIATIONS OF NON-ALCOHOLIC FATTY
LIVER DISEASE AND INSULIN RESISTANCE
Barbara Buday MD
DRC Balatonfüred
PhD Thesis
Tutor:
Csaba Lengyel MD, PhD
First Department of Medicine
Faculty of Medicine, University of Szeged
Graduate School of Basic Medical Science
Szeged
2016

Relevant publications
I. Buday B, Izsóné Katz M, Nagy E, Papp Zs, Korányi L: A metabolikus
szindróma, 2-es típusú diabetes és a csontvesztés epidemiológiai összefüggései a
Balaton felvidék felnőtt lakossága körében [Relationship of cardiovascular risk
factors and bone status in a large adult population of the Balaton Region]. Ca &
Csont 2007; 10(04): 132-137.
II. Buday B, Horváth T, Literáti Nagy B, Kulcsár E, Barta K, Salamon Cs, Péterfai
É, Korányi L: A hagyományosan használt inzulinrezisztencia- és béta-sejt-funkciós
indexek diagnosztikus értéke [The diagnostic value of traditional insulin sensitivity
and beta cell function indices]. Diabetologia Hungarica 2007; 15: 93-105.
III. Buday B, Pach FP, Literati-Nagy B, Vitai M, Vécsei Z, Korányi L: Serum
osteocalcin is associated with improved metabolic state via adiponectin in females
versus testosterone in males. Gender specific nature of the bone-energy homeostasis
axis. Bone 2013; 57(1): 98-104.
Impact factor (2013): 4.461
IV. Buday B, Pach FP, Literáti-Nagy B, Vitai M, Kovács Gy, Vécsei Zs, Korányi L,
Lengyel Cs: Sex influenced association of directly measured insulin sensitivity and
serum transaminase levels: Why alanine aminotransferase only predicts
cardiovascular risk in men?
Cardiovascular Diabetology 2015; 14: 55 (1-13).
Impact factor (2015): 4.02
Impact factor of publications related to the thesis: 8.481
List of Other Publications
I. Buday B, Horváth T, Kulcsár E, Salamon Cs, Literáti-Nagy B, Barta K, Vitai
M, Józsa R, Vecsei I, Bezzegh K, Kiss J, Péterfai E, Koltay L, Korányi L: The
effect of prospektive insulin resistance on the relationship between glucose
metabolism and bone status. Hungarian Medical Journal 2007;1(3). DOI:
10.1556/OH-HMJ.2007.28072
II. Buday B, Kulcsár E, Lieráti-Nagy B, Horváth T, Vitai M, Vecsei I, Bezzegh K,
Kiss J, Péterfai É, Koltay L, Korányi L: Az osteocalcin helye a human cukor- és
csontanyagcsere kapcsolatában. [The role of osteocalcin in the connection of bone
and glucose metabolism in humans]. Orvosi hetilap 2008; 149(52):2453-61.
III. Literáti-Nagy B, Péterfai É., Kulcsár E, Literáti-Nagy Zs, Buday B, Tory K,
Mandl J, Sümegi B, Fleming A, Roth J, Korányi L: Beneficial effect of the
insulin sensitizer (HSP inducer) BGP-15 on olanzapine-induced metabolic
disorders. Brain Research Bulletin 2010;83(6): 340–344.
Impact Factor: 2.498
IV. Literáti-Nagy B, Paragh Gy, Szilvássy Z, Kolonics A, Tory K, Literáti-Nagy Zs,
Barta K, Horváth T, Buday B, Kulcsár E, Péterfai E and Korányi L:
Improvement of insulin sensitivity by a novel drug, BGP-15, in insulin-resistant
patients: a proof of concept randomized double-blind clinical trial. Horm Metab
Res 2010; 41(5):374-380.
Impact factor: 2.414

V. Vitai M, Buday B, Kulcsár E, Literáti-Nagy B, Vecsei I, Bezzegh K, Péterfai É,
Kurucz I, Korányi L: A GRB10 gén (+11275G>A) polimorfizmusának hazai
előfordulása és kapcsolata a cukoranyagcserével. [Occurrence of GRB10
(+11275G > A) polymorphism in Hungarian population and its relationship to
glucose metabolism]. Orvosi Hetilap 2009;150(40):1845-51.
VI. Vitai M, Kocsordi K, Buday B, Literáti Nagy B, Enikő Kulcsár E, Bezzegh K,
Péterfai, E,Koltay L and Korányi L: Nemhez kötött a katalázgén-polimorfizmus
(RS769217) hatása az energia-háztartásra és a csontok állapotára. [Effects of
catalase gene (RS769217) polymorphism on energy homeostasis and bone status
are gender specific]. Orvosi Hetilap 2010;151(23): 923-931.
VII. Kiss J, Barbara B, Literáti-Nagy B, Dr. Faluközi J, Fogarassy Gy, Apró D,
Vecsei I, Fék A, Veress G, Korányi L: A koszorúérbetegség és a csontállapot
kapcsolata másképp: a lumbalis csigolyadenzitás a koszorúérbetegség pozitív
prediktora nőkben? LAM KID 2011;1(3):43-47.
VIII. Buday B, Pach FP, Literáti-Nagy B, Vecsei Zs, Korányi L: A csontátépülés és az
energia háztartás nőkre jellemző kapcsolatai. LAM-KID 2011;1(2):30-35.
IX. Pauer J, Fék A, Buday B, Literáti-Nagy B, Pach P, Vitai M, Péterfai É, Korányi
L: Anyagcsere-eltérések a 2-es típusú cukorbetegek egészséges, első fokú férfi
rokonaiban. [Metabolic alterations in healthy men with first degree type 2
diabetic relatives]. Orvosi Hetilap 2013; 154 (5): 178-186

X. Kovács Gy, Buday B, Fék A, Literáti-Nagy B, Pauer J, Pach P, Vitai M, Péterfai
E, Korányi L: Anyagcsere-eltérések a 2-es típusú cukorbetegek egészséges,
elsőfokú nőrokonaiban. [Metabolic differences in healthy first-degree female
relatives of type 2 diabetic patients]. Orvosi Hetilap 2013; 154(44):1747-53.
XI. Fék A, Buday B, Kovács Gy, Vitai M, Vecsei Z, Pauer J, Literáti-Nagy B,
Bezzegh K, Péterfai É, Korányi L: A genetikai diabeteskockázat hatása a
csontanyagcsere-energiaháztartás kapcsolatokra. [The effect of genetic risk of
diabetes on the correlations in bone and energy homeostasis]. Orvosi Hetilap
2015;156(25):1007-13.
Impact factor of other publications: 4.912
Impact factor of all publications: 13.393

Table of contents
Abbreviations ......................................................................................................................................... 1
1. Introduction and aims of our study ................................................................................................. 4
2. Patients and methods - General considerations .................................................................................. 6
2. 1. Epidemiologic study ....................................................................................................................... 6
2.2. Clamp studies .................................................................................................................................. 7
2.2.1. OGTT, IVGTT and clamp .................................................................................................... 7
2.2.2. Calculations of insulin sensitivity indices ............................................................................ 8
2.2.3. Biochemical measurements .................................................................................................. 9
2.2.4. Statistics .............................................................................................................................. 10
2.2.5. Ethical considerations ......................................................................................................... 13
3. Results .......................................................................................................................................... 14
3.1. Diagnostic evaluation of simple insulin sensitivity indices .................................................. 14
3.1.1. Study population ................................................................................................................. 14
3.1.2. Diagnostic evaluation of simple fasting and OGTT derived insulin sensitivity indices .... 15
3.2. Clamp study on ALT – insulin sensitivity connections ................................................................. 19
3.2.1. Study population ........................................................................................................... 19
3.2.2. Associations between metabolic parameters, insulin sensitivity and liver function tests
20
3.3. Epidemiologic association of metabolic syndrome, type 2 diabetes and bone loss in the adult
population of Balaton Upper-lands ...................................................................................................... 25
3.3.1. Study population ........................................................................................................... 25
3.3.2. Results of epidemiologic data ...................................................................................... 26
3.4. Clamp study; bone – energy homeostasis connections ........................................................ 29
3.4.1. Study population ........................................................................................................... 29
3.4.2. Baseline characteristics ................................................................................................ 29
3.4.3. Metabolic associations of OCN in females .................................................................. 30
3.4.4. Metabolic associations of OCN in males ..................................................................... 33
3.4.5. Feature selection ........................................................................................................... 34
4. Discussion .................................................................................................................................... 37
4.1. Evaluation of simple indices in the estimation of clamp measured insulin sensitivity ........ 37
4.2. ALT – a possible simple indicator of insulin sensitivity in women ..................................... 38
4.3. Bone – energy homeostasis axis ........................................................................................... 40
4.3.1. Discussion of epidemiologic data ................................................................................. 40

4.3.2. The role of OCN; gender difference in the bone – energy homeostasis relationship ... 41
4.4. Limitations of our study ....................................................................................................... 45
5. Summary of new observations and possible future directions ..................................................... 46
6. References .................................................................................................................................... 47
7. Acknowledgements ...................................................................................................................... 58

1
Abbreviations
AC: Abdominal circumference
cAMP: Cyclic adenosine monophosphate
ADA: American Diabetes Association
AIR: Acute insulin response
ALP: Alkaline phosphatase
ALT: Alanine aminotransferase
AST: Aspartate aminotransferase
ATP: Adult Treatment Panel
AUC: Area under the curve
BCF: Beta cell function
BFP: Body fat percent
BMD: Bone mineral density
BMI: Body mass index
CI: Confidence interval
CV: Coefficient of variations
DEXA: Dual-energy X-ray absorptiometry
DI: Disposition index
FBG: Fasting plasma glucose
FFA: Free fatty acid
FSH: Follicular stimulating hormone
GGT: Gamma-glutamyl transferase
GI: Glucose intolerant
GIR: Glucose infusion rate
HbA1c: Hemoglobin A1c
HDL: High density lipoprotein

2
HIRI: Hepatic insulin resistance index
HOMA: Homeostatic Model Assessment
IFCC: International Federation of Clinical Chemistry
IFG: Impaired fasting glucose
IGI: Insulogenic index
IGT: Impaired glucose tolerance
IL-6: Interleukin-6
IR: Insulin resistance
IS: Insulin sensitivity
ISICederholm: Cederholm’s insulin sensitivity index
ISIcomp: Composite insulin sensitivity index
ISIest: Estimated insulin sensitivity index
IVGTT: Intravenous glucose tolerance test
LDL: Low density lipoprotein
MAD: Median absolute deviation
MCRest: Estimated metabolic clearance rate
NAFLD: Non-alcoholic fatty liver disease
NGT: Normal glucose tolerance
OCN: Osteocalcin
OGIS: Oral Glucose Insulin Sensitivity
OGTT: Oral glucose tolerance test
OR: Odds ratio
OPG: Osteoprotegerin
P1NP: Procollagen type 1 amino-terminal propeptide

3
RANKL: Soluble receptor activator NF-kB ligand
RR_Dias: Diastolic blood pressure
SD: Standard deviation
SHBG: Sex hormone binding protein
T1DM: Type 1 diabetes mellitus
T2DM: Type 2 diabetes mellitus
TNF-α: Tumor necrosis factor - alpha
VLDL: Very low density lipoprotein
WHO : World Health Organization
4
1. Introduction and aims of our study
Major challenges of the 21st century health care of the developed world include type 2
diabetes mellitus (T2DM) and the bone loss epidemic. The parallel increase of the two
diseases poses some contradiction. Both are associated with body weight, however increasing
obesity and insulin resistance have a causal role in the pathogenesis of T2DM. Conversely, in
osteoporosis the higher body fat content has a bone protecting effect. Type 1 diabetic patients
have decreased bone mineral density (BMD) and increased fracture risk while in T2DM this
association is less strong, data exist about both increased or decreased BDM in T2DM
patients [1, 2].
In order to investigate the relationship between insulin resistance (IR) or insulin
sensitivity (IS) and other diseases / symptoms, like osteopenia and osteoporosis that may be
associated with insulin resistance we need an easily accessible simple IR measuring method
that is cheap, can be used in a large number of patients, reproducible and is validated via
more sophisticated studies. Precise measurement of IR is also important for the prevention,
diagnosis and the therapeutic follow up of T2DM. For measuring IS, today the “gold
standard” is still the “hyperinsulinemic normoglycemic clamp” developed by DeFronzo et al.
[3]. However, it is an expensive and time consuming method which cannot be used in a large
number of patients in clinical setting, so there have been a number of attempts to develop
methods replacing the clamp, e.g. the Homeostasis Model Assessment (HOMA) indices
which use data from fasting blood samples, or so are a number of indices derived from the
oral glucose tolerance test (OGTT).
The first part of my work deals with the diagnostic evaluation of IS in terms of simple
fasting and OGTT derived indices which still seem to be a hurdle in IS estimation since the
most widely used HOMA indices in clinical practice do not correlate well with the gold
standard clamp methods. We aimed to gain further insights into the pathophysiology and
diagnosis of IR and related complications by studying the association between transaminase
levels and clamp measured insulin sensitivity, moreover we sought to explore a unique side
of the gender specific aspect of insulin homeostasis / energy metabolism, with special regard
on the non-alcoholic fatty liver disease (NAFLD) which is one of the major link between
insulin resistance and cardiovascular disease. By exploring the pathophysiology of the IR
related steatohepatosis often associated with the ‘unexplained’ elevation of transaminase
levels in overweight insulin resistant / T2DM patients, we might be able to improve the value

5
of the HOMA model with no extra costs, although possible gender related differences will
have to be taken into account.
To explore the relationship between T2DM / IR and bone homeostasis first we
analyzed data from a large epidemiological study which included the screening results of
more than 6000 people at Balaton Upper-lands. Based on the results of this epidemiological
study, we conducted a cross over analysis on our existing clamp database where we measured
markers of bone turnover, i.e. total non-carboxylated osteocalcin (OCN) levels and other
metabolic-hormonal factors, like adipocytokines, lipids, lipoproteins, sex hormones.
Previous human studies have shown that serum OCN concentration is negatively associated
with the plasma glucose level and body fat mass [4-7] and positively associated with insulin
secretion [8, 9], lower insulin resistance [5, 6, 10] and higher serum adiponectin
concentration [4, 10]. In most of this work, the HOMA model has mainly been used to assess
β-cell function, insulin sensitivity and the involvement of OCN on glucose metabolism,
although we and others [11] have shown that fasting indices do not always correlate well with
the real insulin resistance, therefore insulin sensitivity was measured by the gold standard
clamp method. Recently, it has been demonstrated that osteoblasts are able to induce
testosterone production by the testes, though they fail to influence estrogen production by the
ovaries [12]. The role of testosterone in the bone–energy homeostasis is presumably gender-
specific, as the effects of OCN were only demonstrated in Leydig cells and not in the ovaries;
moreover, low testosterone levels are only associated with a metabolic syndrome in men [13].
Based on previous data and our preliminary assumptions discussed above our main
goals were:
1. To explore the diagnostic value of the most frequently used simple fasting and OGTT
derived insulin sensitivity indices compared to the gold standard clamp method.
2. To try to justify possible new approaches / directions in the simple diagnostics of insulin
resistance.
3. To explore epidemiological characteristics of the relationship between bone loss and
diabetes / insulin resistance.
4. To explore molecular background of the bone – energy homeostasis axis, by analyzing
the associations between clamp measured insulin sensitivity, total-OCN and other metabolic
biomarkers.

6
5. Since our previous data suggested that basic sex differences exist in the pathogenesis and
manifestations of insulin resistance and associated diseases, male and female populations
were separately analyzed in most of our studies to address this issue.
2. Patients and methods - General considerations
2. 1. Epidemiologic study
In our study we have analyzed the results of general screening tests of the adult
population in Balaton Upper-lands which was performed between 2003 and 2006. Screenings
were done on a voluntary basis advertised as primarily bone density screening measurements
in local surgeries or at working places (Offices, Factories). Since the screening examinations
involved bone density measurements / osteopoporosis screening, there were more women
than men who attended the screenings.
During screening examinations anthropometric assessments (body weight and height,
abdominal circumference [AC]), sitting blood pressure (Omron 705CP digital equipment),
blood sugar (Personal DCont and Optimum, 77 Electronics, Hungary), total cholesterol
measurements (Accutrend GCT 1537962 and Accutrend GC 1418246, Roche, Germany)
from capillary blood and calcaneus bone ultrasound density ultrasound measurements (GE-
Lunar, Achilles Plus, USA) were carried out. Questions about medical history, concomitant
medications and life style were also raised. Screenings were not done always in fasting state
although data were available about the time of last meal besides previous concomitant
treatment for diabetes. We have analyzed the following data: sex, age, systolic and diastolic
blood pressure, plasma glucose, total-cholesterol, AC, BMI and T score calculated by the
calcaneus ultrasound density data of young and healthy population of the same sex.
Based on available data and the results of the screening examinations we defined certain
diseases / syndromes to be present in the population, like diabetes, hypertension, metabolic
syndrome, osteopenia and osteoporosis. ‘Bone density’ measured by ultrasound is not
identical to BMD measured by ‘dual-energy X-ray absorptiometry’ (DEXA), due to the
effect of bone structure, albeit they are closely associated and as such it is widely accepted in
both the diagnosis and the follow up of osteoporotic treatment [14]. Data were analyzed by
sex and age groups.

7
2.2. Clamp studies
2.2.1. OGTT, IVGTT and clamp
All clamp studies were carried out after receiving signed informed consents from the
subjects. Study was approved by the Hungarian Central Ethical Committee (A12988-2/2003-
1018-EKU, ad.8-311/2009-1018EKU). Patients and healthy volunteers were recruited from
our own diabetes outpatient clinic and by referral from regional primary care physicians. All
subjects underwent a standard 75 mg oral glucose tolerance test (OGTT) which determined
the subject’s basal glucose tolerance (i.e. normal or impaired glucose tolerance, impaired
fasting glucose or T2DM) during the screening period. Within 3 weeks after the OGTT
patients were hospitalized for the clamp. Subjects fasted on the night prior to the clamp
examination. They first underwent an intravenous glucose tolerance testing (IVGTT) to
assess insulin secretion (0.3g/body weight kg iv. glucose injection). Following the IVGTT, a
hyperinsulinaemic normoglycaemic clamp examination was carried out, as described by
DeFronzo et al. [3]. During a continuous infusion of insulin (45 mU × min × m−2
) and
glucose (20 %), the steady state was set at the constant glucose infusion rate (earliest from the
120th
minute of clamp), where blood sugar level stayed between 5.0 and 5.9 mM / l for at
least 30 min after the beginning of steady state. Glucose and insulin levels were measured
from venous blood at 0-, 3-, 5-, 10-, 20-, 30-, 40-, 50th
- and 60th
min samples of IVGTT,
before the beginning, and at the 0-, 10- 20-, 30th
min samples of the steady state of clamp.
Insulin secretion was determined from IVGTT by the insulogenic index [IGI = Δ (insulin5’-
insulin3’) / Δ (glucose5’-glucose3’)] and the acute insulin response [AIR = (insulin5’ +
insulin3’) / 2 – insulin0’)], both being sensitive indicators of the first phase insulin response,
and hence the real beta cell function. For the liver function test – IS relationship study hepatic
insulin resistance index (HIRI) was estimated from the OGTT 0th
and 30th
min glucose and
insulin values [HIRI = (GLU-AUC0-30’) × (Ins-AUC0-30’)] described by Muhammad et al.
[15]. Glucose and insulin area under the curve (AUC) values were calculated using the
trapezoidal rule, both from OGTT and IVGTT. We used lean body (= muscle)-adjusted
glucose uptake (M3 value, mg/min/kg) calculated from the glucose infusion rates during
clamp, to measure peripheral (muscle) glucose utilization rates. Formula for calculation of
serum glucose levels from mmol/l to mg/dl for the clamp M3 value: mg/dl = 18×mmol/l.
Body composition was determined by dual-energy X-ray absorptiometry (DPXMD+, GE-
Lunar, USA, Florida). In the insulin sensitivity diagnostic evaluation study we used fasting
and OGTT derived insulin sensitivity indices.
8
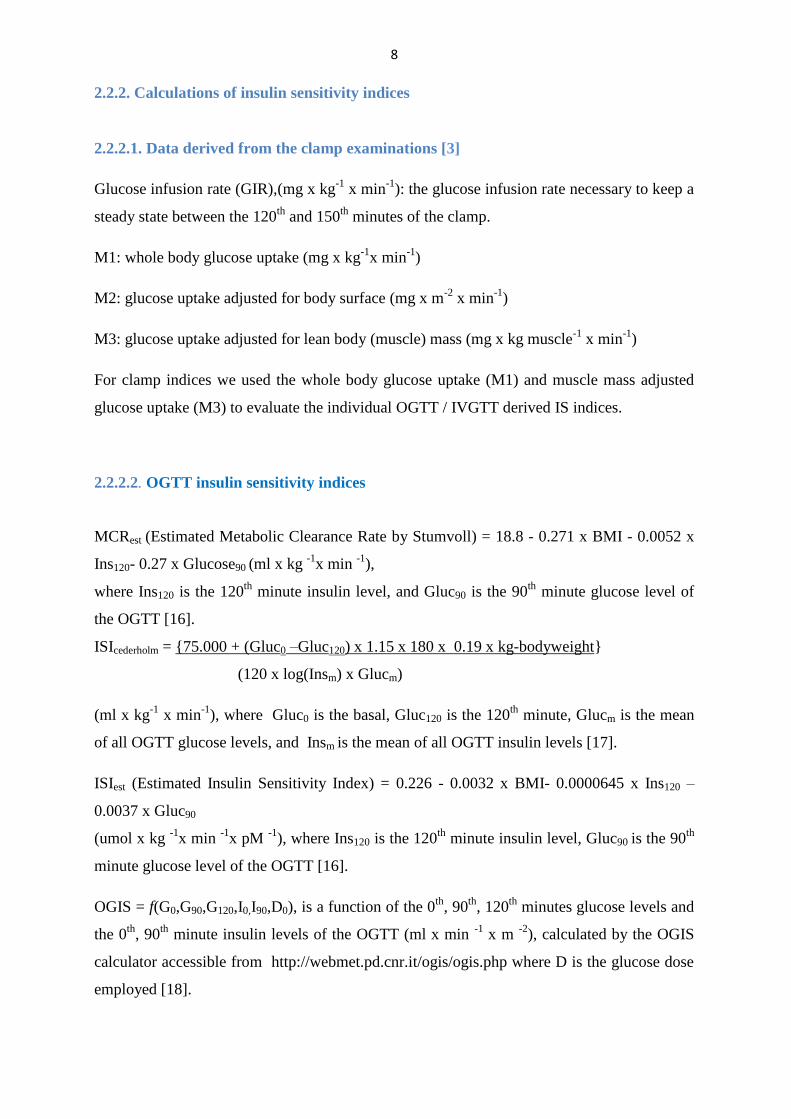
2.2.2. Calculations of insulin sensitivity indices
2.2.2.1. Data derived from the clamp examinations [3]
Glucose infusion rate (GIR),(mg x kg-1
x min-1
): the glucose infusion rate necessary to keep a
steady state between the 120th
and 150th
minutes of the clamp.
M1: whole body glucose uptake (mg x kg-1
x min-1
)
M2: glucose uptake adjusted for body surface (mg x m-2
x min-1
)
M3: glucose uptake adjusted for lean body (muscle) mass (mg x kg muscle-1
x min-1
)
For clamp indices we used the whole body glucose uptake (M1) and muscle mass adjusted
glucose uptake (M3) to evaluate the individual OGTT / IVGTT derived IS indices.
2.2.2.2. OGTT insulin sensitivity indices
MCRest (Estimated Metabolic Clearance Rate by Stumvoll) = 18.8 - 0.271 x BMI - 0.0052 x
Ins120- 0.27 x Glucose90 (ml x kg -1
x min -1
),
where Ins120 is the 120th
minute insulin level, and Gluc90 is the 90th
minute glucose level of
the OGTT [16].
ISIcederholm = {75.000 + (Gluc0 –Gluc120) x 1.15 x 180 x 0.19 x kg-bodyweight}
(120 x log(Insm) x Glucm)
(ml x kg-1
x min-1
), where Gluc0 is the basal, Gluc120 is the 120th
minute, Glucm is the mean
of all OGTT glucose levels, and Insm is the mean of all OGTT insulin levels [17].
ISIest (Estimated Insulin Sensitivity Index) = 0.226 - 0.0032 x BMI- 0.0000645 x Ins120 –
0.0037 x Gluc90
(umol x kg -1
x min -1
x pM -1
), where Ins120 is the 120th
minute insulin level, Gluc90 is the 90th
minute glucose level of the OGTT [16].
OGIS = f(G0,G90,G120,I0,I90,D0), is a function of the 0th
, 90th
, 120th
minutes glucose levels and
the 0th
, 90th
minute insulin levels of the OGTT (ml x min -1
x m -2
), calculated by the OGIS
calculator accessible from http://webmet.pd.cnr.it/ogis/ogis.php where D is the glucose dose
employed [18].

9
ISIcomp (Composite Insulin Sensitivity Index, Matsuda) = 10.0000 ,
√ (Gluc0 x Ins0 x Glucm x Insm)
where Gluc0 is the 0th
minute glucose, Glucm is the mean of all OGTT glucose levels, Ins0 is
the 0th
minute insulin, Insm is the mean of all OGTT insulin levels [19].
2.2.2.3. Fasting indices
HOMA (Homeostasis Model Assessment) [20]:
HOMA-R (for insulin resistance) = Go x Io / 22.5, (HOMA-1), where Go is the basal glucose
level (mM/L), Io is the basal insulin level (uU/ml).
HOMA-S (for insulin sensitivity) = 1/ HOMA-R
QUICKI = 1 / {log (Io) + log (G o)} (logarithmic transformation of HOMA) [21].
HOMA-B (for insulin release) = I0 x 20 / (Gluc0 - 3.5)
HOMA-S% and B% (HOMA-2): indices of insulin sensitivity (S%) and beta cell
function(B%), calculated by the HOMA calculator V2.2 from the 0th
minute IVGTT samples,
downloaded from https://www.dtu.ox.ac.uk/homacalculator (‘the Oxford Model’) [22, 23].
FFA-QUICKI = 1 / {log (Io) + log (Go) + log (FFAo)}, where G0 is the basal glucose, I0 is the
basal insulin, FFA is the basal fatty acid levels (mmol/l) [24].
2.2.3. Biochemical measurements
Routine biochemical parameters were measured on Cobas Mira and Hitachi 912
laboratory automats with the same method (according to IFCC recommendations) during the
recruitment period (2003 – 2008). Reference ranges, detection limits and test principles were
unchanged during this test period. Alanine aminotransferase (ALT), aspartate
aminotransferase (AST), gamma-glutamyl transferase (GGT), alkaline phosphatase (ALP),
serum bilirubin, free fatty acid (FFA), insulin, glucose, HbA1c levels and conventional lipid
parameters were determined using Roche reagents (Roche Diagnostics, Germany). HbA1c
levels were measured by the IFCC reference method. Total (non-carboxylated) OCN,
estradiol, testosterone, follicular stimulating hormone (FSH) and serum insulin levels were

10
measured with an Elecsys 2010 electrochemiluminescense automat (Roche Diagnostic,
Germany). Coefficient of variation (CV) for osteocalcin test varies between 1.8 and 6.5%
respectively for the kits used in our study. Serum leptin, adiponectin, interleukin-6 (IL-6) and
tumor necrosis factor-α (TNF-α) levels were measured by the enzyme-linked immunosorbent
method (Quantikine DLP00, Quantikine DRP300, Quantikine HS600B and Quantikine
HSTA00D kits respectively; R&D Systems, Minneapolis, MN, USA). Lipid fractionation
was done by the Lipoprint System® Quantimetrix, USA). Lipid subfractions (very low
density lipoproteins [VLDL], intermediate-density lipoproteins [IDL-A, −B and –C], and
low-density lipoproteins [LDL1−4 subfractions, LDL 2–4 subfractions = small-dense LDL]),
total LDL and high-density lipoprotein [HDL] were separated by acrylamide gel
electrophoresis.
2.2.4. Statistics
2.2.4.1. Epidemiological study
Data analysis for the epidemiologic study was carried out with an SPSS 10.0 Program
(Statistics for Windows). Numeric data were indicated as mean and standard deviations.
Mean data between the groups were compared with two-sided tests. For comparing disease
prevalence within groups of different genders and ages we used the χ2 test (in small sample
numbers χ2 was calculated by continuity correction), additionally we have applied the Fisher
test. Significance level was considered at p < 0.05 values, with indicating odds ratios (OR)
and 95% confidence intervals (CI). The relationships between T score and the individual
metabolic parameters were analyzed by bivariate correlations (Pearson).
2.2.4.2. Evaluation of fasting and OGTT indices
Coefficients of variations of fasting and OGTT indices were calculated according to the
equation CV = (SD / √2) x 100/¥ , where SD is the standard deviation of the intra-subject
changes of indices, and ¥ is the mean of all values. For evaluating the simple insulin
sensitivity indices we used a score system to evaluate the individual indices and all of the
fasting or OGTT indices within the groups divided by several aspects (Table 1.). It
determined the value of the indices based on the correlation coefficients and their
significance levels between the M1 and the specific index. We considered 12 to be the
11
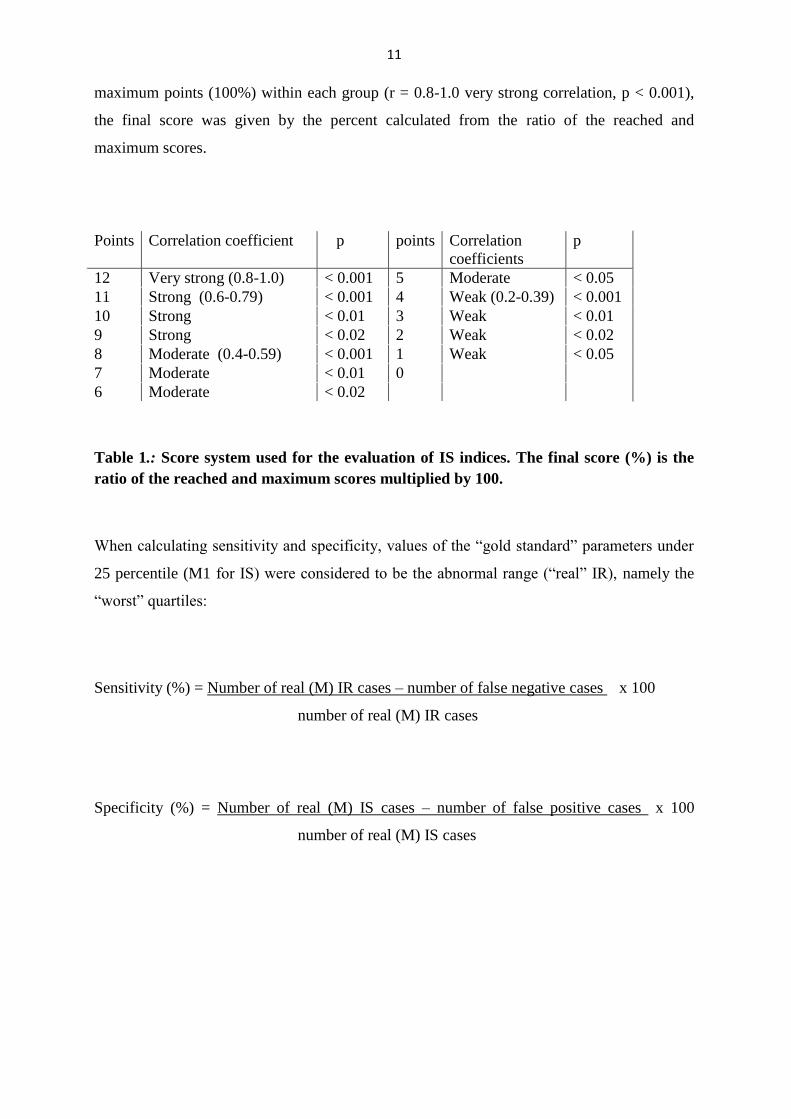
maximum points (100%) within each group (r = 0.8-1.0 very strong correlation, p < 0.001),
the final score was given by the percent calculated from the ratio of the reached and
maximum scores.
Points Correlation coefficient p points Correlation
coefficients
p
12 Very strong (0.8-1.0) < 0.001 5 Moderate < 0.05
11 Strong (0.6-0.79) < 0.001 4 Weak (0.2-0.39) < 0.001
10 Strong < 0.01 3 Weak < 0.01
9 Strong < 0.02 2 Weak < 0.02
8 Moderate (0.4-0.59) < 0.001 1 Weak < 0.05
7 Moderate < 0.01 0
6 Moderate < 0.02
Table 1.: Score system used for the evaluation of IS indices. The final score (%) is the
ratio of the reached and maximum scores multiplied by 100.
When calculating sensitivity and specificity, values of the “gold standard” parameters under
25 percentile (M1 for IS) were considered to be the abnormal range (“real” IR), namely the
“worst” quartiles:
Sensitivity (%) = Number of real (M) IR cases – number of false negative cases x 100
number of real (M) IR cases
Specificity (%) = Number of real (M) IS cases – number of false positive cases x 100
number of real (M) IS cases

12
2.2.4.3. General statistical considerations in clamp studies
All statistical analyses were performed with R Statistical Software (version 2.15.0).
Data points are expressed as mean ± standard deviation, if data were not normally distributed
we used mean, standard deviation, median and mean absolute deviation (MAD) for each
value presented The Wilcoxon test (or in case of normally distributed parameters two-sided T
test) were used to assess group differences. Spearman's correlation coefficients were
calculated to test the association between biochemical and other variables, since non-linearity
characterized these associations. Partial correlation coefficients were used to assess the
influence of possible confounding factors such as age, body mass index (BMI), body fat
percent (BFP), HbA1c levels (as being a mixed diabetic and non-diabetic population),
genetic predisposition. Further adjustment with adiponectin and FSH in females and
testosterone in males was used in the OCN - clamp study to exclude the effect of menopausal
state in women, and the possible role of adiponectin / testosterone in mediating the metabolic
effects of OCN in males/females. A p value of < 0.05 was considered significant.
Sample size determination was done empirically based on other clamp studies in the
original protocol. For the liver – IR analysis we have used boot strap analysis (Monte-Carlo
simulation) to test the minimal sample number to determine statistical differences between
groups.
Feature selection analysis (Boruta algorithm) was used to find the most important
attributes that are related to the M3 value in all of our clamp studies. This algorithm is a
wrapper built around the randomForest classification algorithm (implemented in the R
package randomForest) [25]. The randomForest algorithm is an ensemble approach (divide
and conquer approach); it grows many decision trees and it gives a numerical estimate of the
importance of a feature. A Z score is used as the importance measure since it takes into
account the fluctuations of the mean accuracy loss among trees in the forest. To avoid
random fluctuations in determining the importance of any given attribute, a reference set of
‘shadow attributes’ is used for deciding which attributes are truly important, since the
importance of a shadow attribute can be non-zero only due to random fluctuations [26].
Multiple regression analysis was used in the NAFLD - IR study in men and women in
order to determine the ability of metabolic parameters selected as ‘important attributes’ by
feature selection analysis to predict clamp measured insulin sensitivity:

13
Model for women: y~b0 + b1x1 + b2x2 +…+ b5x5, where response variable y is M3, and
explanatory variables x1, …, x5 are BMI, AC, insulin, fasting FFA, ALT, respectively and
coefficients are in Table 6. The intercept b0 is the expected mean value of M3 when all xi =
0.
Model for men: y~b0 + b1x1 + b2x2 +…+ b9x9, where response variable y is M3, and
explanatory variables x1, …, x9 are AC, leptin, BMI, insulin, TG, FFA, glucose, diastolic
blood pressure (RR_Dias) and age, respectively and coefficients b1…b9 are in Table 7. The
intercept b0 is the expected mean value of M3 when all xi = 0.
2.2.5. Ethical considerations
For the epidemiological study we used database of an adult population screening
between 2003 and 2006 in Balaton Upper-lands, all screenings approved by the local
Hungarian Public Health and Medical Officer Service. Screenings were carried out on a
voluntary basis, most of them were advertised as general screening assessments at General
Practitioners’ outpatient clinics, some of them were screening examinations taken place at
working environment (Factories and Offices).
For clamp studies, data were retrospectively analyzed from a scientific study
approved by the Hungarian Central Ethical Committee (A12988-2/2003-1018-EKU and ad.8-
311/2009-1018EKU) titled ”Diagnostic investigation for the early recognition of insulin
resistance syndrome and its complications” (granted by Hungarian National Research and
Innovation Program: NKFB -1B/0007/2002) and “Development and application of protein
microarray technics to characterize insulin resistance syndrome and autoimmune processes”
(granted by KMOP-1.1.1-08/1-2008-0028 ).
Recruitment started in 2004 and ended in 2010. After obtaining signed informed
consent, in total 306 IVGTTs were carried out followed by a normoglycemic
hyperinsulinemic clamp. Subjects were classified as having normal / impaired glucose
tolerance or type 2 diabetes based on a standard 75 g OGTT at screening. All details about
medical history, concomitant medications and life style were available for the data analysis.

14
3. Results
3.1. Diagnostic evaluation of simple insulin sensitivity indices
3.1.1. Study population
We performed OGTT examinations on 317 subjects during the screening period.
(From the OGTT samples we determined glucose and insulin levels). Patients were
categorized according to the ADA criteria (normal glucose tolerance (NGT): fasting plasma
glucose (FBG) < 5.6 mM/l, impaired fasting glucose (IFG): FBG 5.6 – 6.99 mM/l, impaired
glucose tolerance (IGT): FBG < 7.0 mM/l and 120th
minute glucose: 7.77 – 11.0 mM/l,
T2DM: fasting glucose ≥ 7.0 mM/l, and/or 120th
minute ≥ 11.1 mM/l) [27]. Those, taking any
antidiabetic medications, were treated for hormonal disease or received hormone substitution,
were excluded from the study. Baseline characteristics of the subjects are listed in Table 2.
N m f age BMI
(kg/m2)
HbA1c
(%)
M1
(mg/minxkg-1
)
AIR
(uE/ml)
NGT 45 25 20 40.02±15.07 28.37±6.82 5.53±0.82 11.29±4.87 55.61±49.15
IFG/IGT 67 29 38 49.13±9.24* 30.85±5.21* 6.02±0.74* 8.37±3.26* 28.07±31.56*
DM 24 11 13 52.66±5.63* 32.13±6.10* 6.48±0.88* 6.46±3.38* 14.24±24.18*
Table 2.: Basic characteristics of the examined population. *: Significant (p < 0.05)
difference compared to the NGT group, N: number of subjects m: number of males, f: number of
females, M1: whole body glucose uptake, AIR: acute insulin response of IVGTT, BMI: body mass
index, HbA1c: Hemoglobin A1c, NGT: normal glucose tolerant, IFG: impaired fasting
glucose, IGT: impaired glucose tolerant, DM: diabetic subjects

15
3.1.2. Diagnostic evaluation of simple fasting and OGTT derived insulin sensitivity
indices
The cumulative evaluation is shown on Figures 1. and 2. based on the earlier
described score system (Table 2.). Most of the fasting indices show moderate (R = 0.4-0.6)
correlation with M1 within most groups (correlation matrix not shown here). There was no
significant correlation between fasting indices derived from the OGTT basal samples and M1
in the elder (age above median), normal glucose tolerant (NGT), and less severe (HbA1c
under median) glucose intolerant groups. No correlation found in the elder NGT group
between fasting indices derived from the mean of OGTT and IVGTT basal samples and M1.
In HOMA-2 model we only found good correlations (r = 0.6-0.8) in the young NGT, diabetic
and male groups. Cumulative evaluation of the fasting and OGTT derived indices based on
group subanalyses are shown on Figure 3. and Figure 4. The sensitivity of fasting indices
(average 50.4 ± 4.6%) is low, while their specificity (83.3 ± 1.6%) is high, i.e. there are a
relatively large number of false negative but less of false positive cases (Table 3.).
Mean of
fasting IS
indices
Maximum
value
(HOMAigtt)
Mean of
OGTT IS
indices
Maximum
value
(ISIcederh,
ISIest)
Sensitivity
50.92±4.43%
58.82%
60.25±8.06%
66.6%
Specificity 83.56±1.79% 85.7% 87.29± .87% 89.1%
Table 3.: Mean sensitivity and specificity of IS indices, considering the 25 percentile of
M1 values as the cut-off for “insulin resistant” and “insulin sensitive” (less insulin
resistant) groups. IS: Insulin sensitivity, HOMAigtt: HOMA index from IVGTT 0th
minute
glucose and insulin values, OGTT: oral glucose tolerance test, ISIcederh: Cederholm’s IS
index, ISIest: estimated Stumvoll’s IS index.
ISIcederholm , MCRest, and ISIest, including body weight in their equations, derived from
the OGTT, show the strongest correlations with M (r > 0.6 correlations in most groups). On
Figure 3. and Figure 4. it is clearly shown that all OGTT indices show better cumulative
score than the average (mean of 0th
minute OGTT and IVGTT insulin and glucose values) of

16
fasting indices. The only non-significant correlation was observed with the Matsuda equation
(ISIcomp) in the young NGT group. The mean sensitivity and specificity of OGTT indices
were higher than that of the HOMA model (60.2 ± 8.0%, and 87.2 ± 1.8% respectively, Table
3.).
Figure 1.: Evaluation of fasting IS indices calculated from the 0th
minute OGTT and
IGTT values and the mean of these values, based on the correlation coefficients and
significance levels with M1. “OGTT”: indices derived from 0th
minute OGTT samples,
“IGTT”: indices derived from 0th
minute IVGTT samples, “a”: indices derived from the
average of the two samples.
0
10
20
30
40
50
60
70
80
90
100
HOMA-R HOMA-S QUICKI HOMA-R HOMA-S QUICKI FFA-Q HOMA-Ra HOMA-Sa QUICKIa FFA-Qa HOMA-S%
(%)
OGTT IGTT Calculated from the averages
of 0.minute samples

17
Figure 2.: Evaluation of the individual OGTT indices based on the correlation
coefficients and significance levels with M1 in different subgroups. The mean evaluation
of fasting indices is also indicated on the right side of the graph. ISIcomp: Composite insulin
sensitivity index (Matsuda), ISICederholm: Cederholm’s insulin sensitivity index, MCRest:
estimated metabolic clearance rate (Stumvoll), OGIS: Oral Glucose Insulin Sensitivity Index.
0
10
20
30
40
50
60
70
80
90
100
ISIcomp ISIcederh ISIest MCRest OGIS average of
fasting indices
(%)

18
Figure 3.: Evaluation of fasting IS indices in different subgroups. From left to right: total:
whole population, NGT: normal glucose tolerant, NGT/age: NGT group divided by age
(below and above median), IFG/IGT: all IFG or IGT subjects , D: diabetic subjects,
D/HbA1c: all IFG/IGT/D subjects divided by HbA1c (%, below and above median), D/AIR:
all IFG/IGT/D subjects divided by beta cell function (acute insulin response = AIR), D/age:
all IFG/IGT/D subjects divided by age (years, below and above median), gender: all subjects
grouped by gender, BMI: all subjects divided by the existence of obesity (BMI < or ≥30 kg x
m-2
).

19
Figure 4.: Evaluation of the OGTT indices in different groups. For abbreviations of each
group see Figure 3.
3.2. Clamp study on ALT – insulin sensitivity connections
3.2.1. Study population
General characteristics of the population are shown in Table 4. Mean HbA1c values
were under 6.1% in all groups, i.e. the population consisted of either normal glucose tolerant
or mostly prediabetic (IGT/IFG or fresh T2DM) subjects, both slightly overweight and obese
individuals. Men tended to be younger and slightly more insulin sensitive than women in
both the NGT and glucose intolerant (GI = IFG/IGT/T2DM) groups, although there were a
lower prevalence of genetic predisposition in the NGT male group. The prevalence of genetic
predisposition (the presence of diabetes in 1st degree relatives vs. genetically non-predisposed
groups) were between 20 and 40%, lowest in the male NGT group, as indicated. Significant
differences were found between age and metabolic parameters in NGT vs. GI groups in both

20
genders as expected. ALT and GGT levels were higher in the GI vs. NGT groups in both
sexes, AST levels differed significantly only in the male group between NGT and GI
subjects.
3.2.2. Associations between metabolic parameters, insulin sensitivity and liver
function tests
Simple bivariate and partial correlation coefficients are listed in Table 4. between
liver enzymes (AST, ALT and GGT) and metabolic parameters (including M3, HIRI, blood
sugar level, insulin secretion, lipids and adipocytokines), after correcting for age, BMI,
alcohol consumption, HbA1c, abdominal circumference (and FSH in females). In males
triglyceride, HDL-cholesterol, free fatty acid and Acute Insulin Response (AIR) show
significant correlations with ALT (and AST) after adjusting with the above confounding
factors, while in females it is the clamp measured glucose uptake per se along with blood
sugar values that stay significantly related after correction is done (see on Table 4). GGT is
rather non sex-specific, i.e. corrected associations with GGT show a similar pattern in both
genders.
Multiple regression analysis was carried out in order to determine the ability of the
‘important’ attributes selected by Feature selection analysis (Boruta Algorithm, applied as a
pre-regression analysis here) to predict clamp measured M3 values, separately in the male
and female populations. The results in Table 6. show that F = 29.95 (p < 2.2e-16) for women,
indicating that the ‘important’ variables (BMI, AC, FFA, insulin and ALT) collectively have
a significant effect on M3, ALT and BMI being significant independent predictors in women.
In men (Table 7.) ‘important’ attributes (AC, leptin, BMI, insulin, TG, FFA, glucose, and
diastolic blood pressure) have a significant effect on M3 [F = 14.71 (p < 2.36e-16)], serum
leptin and insulin levels being independent predictors of clamp M3 values.
The ability of the ‘important’ attributes to predict measured M3 is indicated in Figure
5. for women, and in Figure 6. for men, where linear regression scatter plots for fitted vs.
measured M3 values are shown. The regression model gave an excellent estimation of M3 in
women, less so in men.

21
NGT males(n=74) GI (IFG, IGT, T2DM) males(n=74)
mean±SD median MAD mean±SD median MAD
Age (years) 33.43± 11.60 30.00 10.46 48.72±9.33** 51.40 7.75
BMI (kg/m2) 26.66±5.01 25.10 2.42 29.99±4.30** 29.41 4.01
Abdominal circumference(cm) 94.54± 13.11 90.50 6.67 105.07±14.55** 105.00 9.64
HbA1C (%) 5.41± 0.43 5.40 0.44 5.90± 0.68** 5.80 0.59
Fasting glucose (mmol/L) 4.89± 0.72 4.83 0.56 6.09±1.04** 5.96 0.96
M3(mg/min/kg) 8.83±3.10 8.81 2.82 5.88±2.77** 5.74 2.38
Hepatic insulin resistance index 54.42±33.06 48.86 24.98 63.86±33.84** 60.24 32.09
Triglyceride (mmol/l) 1.46±1.14 1.07 0.55 2.65±2.18** 2.00 1.33
HDL-C(mmol/L) 1.35±0.40 1.36 0.36 1.13±0.42** 1.08 0.29
LDL-C(mmol/L) 2.48±0.83 2.31 0.80 3.00± 1.05** 3.03 0.79
AST(U/L) 21.68±5.44 20.00 4.45 27.57±12.93** 25.00 8.90
ALT(U/L) 24.81±10.56 22.00 7.41 36.24±26.98** 29.50 15.57
GGT(U/L) 26.93±15.73 22.00 10.38 48.44±33.50** 39.00 28.17
Alcohol (g/day) 0.09±0.38 0.00 0.00 0.30±0.67** 0.00 0.00
Hypertension(%) 10.81 NA NA 43.24 NA NA
Smoking(%) 14.86 NA NA 20.22 NA NA
Genetic predisposition(%) 21.62 NA NA 32.89 NA NA
NGT females (n=47) GI (IFG, IGT, T2DM) females(n=111)
Age (years) 45.10±10.39 46.00 10.43 50.80±8.54** 53.00 7.41
BMI (kg/m2) 26.85± 4.25 26.57 4.74 31.49±5.25** 31.57 4.96
Abdominal circumference(cm) 91.95±12.18 92.00 14.08 104.42±12.49** 103.00 11.86
HbA1C (%) 5.62± 0.50 5.60 0.59 6.06± 0.63** 6.02 0.62
Fasting glucose (mmol/L) 5.08± 0.49 5.08 0.44 5.75±0.77** 5.65 0.76
M3(mg/min/kg) 6.64± 3.24 6.29 2.79 4.36±2.08** 3.92 1.69
Hepatic insulin resistance index 63.07±32.51 54.76 27.80 75.23±49.42** 60.77 36.46
Triglyceride (mmol/l) 1.43±0.83 1.24 0.43 1.79± 0.81** 1.57 0.74
HDL-C(mmol/L) 1.48±0.55 1.49 0.61 1.33±0.51 1.27 0.36
LDL-C(mmol/L) 2.65±0.81 2.51 0.61 3.20±1.06** 3.17 0.87
AST(U/L) 23.00±9.76 21.00 5.93 23.75±10.37 20.00 4.45
ALT(U/L) 21.79±14.21 20.00 10.38 25.33±12.98* 22.00 8.90
GGT(U/L) 25.95±28.13 19.00 11.86 31.76±25.29** 25.00 11.86
Alcohol (g/day) 0.14±0.55 0.00 0.00 0.02±0.15 0.00 0.00
Hypertension(%) 23.40 NA NA 43.24 NA NA
Smoking(%) 14.86 NA NA 18.18 NA NA
Genetic predisposition(%) 21.62 NA NA 36.36. NA NA
Table 4. : Baseline biochemical and clinical characteristics of male and female
populations. All values are means, medians and mean absolute deviation (MAD). NGT:
normal glucose tolerant, GI= glucose intolerant, IFG=impaired fasting glucose, IGT=impaired
glucose tolerant, T2DM= type 2 diabetes. M3: muscle mass adjusted glucose uptake. p<0.05*,
p<0.01**, p<0.001***, p<0.0001****

22
Table 5.
Bivariate
correlation
s adjusted
for
confoundin
g factors
between
metabolic
parameters
and liver
enzymes in
male and
female
subjects.
Glu-0:
fasting
glucose,
AIR: acute
insulin
response,
FFA: free
fatty acid,
M3: muscle
adjusted
glucose
uptake,
HIRI:
hepatic
insulin
sensitivity
index.
p<0.05*,
p<0.01**,
p<0.001***,
p<0.0001**
**.
Significant
Partial
correlations
are
indicated
after
adjustment
for age,
BMI,
abdominal
circumferen

23
Coefficients: Estimate Std. Error t value Pr(>|t|)
(Intercept) 15.81509 1.22936 12.864 < 2e-16 ***
BMI -0.23375 0.05272 -4.434 1.9e-05 ***
AC - 0.01780 0.02081 -0.856 0.39377
Insulin -0.04213 0.02469 -1.706 0.09028 .
IVFFA_0 -1.00410 0.56730 -1.770 0.07899 .
ALT - 0.03159 0.01208 -2.616 0.00991 **
Table 6: Multiple regression analysis for clamp M3 in women based on the ‘important’
attributes’ chosen by the feature selection analysis. Signifiance codes: 0.0001 ‘***’ 0.001 ‘**’
0.01 ‘*’ 0.05. Residual standard error: 1.88 on 158 degrees of freedom. Multiple R-squared: 0.5259,
adjusted R-squared: 0.5084, F-statistic: 29.95, p value: < 2.2e-16. . Significant independent
predictors: BMI (***) and ALT (**). AC: abdominal circumference, IVFFA_0: 0th minute FFA of the
IVGTT.
Figure 5: Linear regression for original versus fitted M3 values in women estimated by multiple
regression analysis for attributes determined by feature selection. BMI (p=1.9e-05), AC (p=
0.39377), serum-insulin (p= 0.09028), serum-FFA (p=0.07899), ALAT (p= 0.00991). Multiple R-
squared: 0.5259, Adjusted R-squared: 0.5084

24
Table 7: Multiple regression analysis for clamp M3 in men, based on the ‘important’ attributes
chosen by the feature selection analysis. Significance codes: 0 ‘***’ 0.001 ‘**’ 0.01 ‘*’ 0.05.
Residual standard error: 2.331 on 148 degrees of freedom. Multiple R-squared: 0.4989, Adjusted R-
squared: 0.465, F-statistic: 14.71, p value: 2.368e-16. Significant predictors: leptin (*) and insulin (*)
levels. TG = triglyceride, AC: abdominal circumferemce, IVFFA_0: basal FFA.
Figure 6.: Linear regression for original vs. fitted M3 values in men estimated by multiple
regression analysis for attributes determined by feature selection. AC (p= 0.2813), leptin (p=
0.0294), BMI (p = 0.4253), serum insulin (p = 0.0210), triglyceride (p = 0.5699), serum-FFA
(p=0.2364), serum-glucose (p = 0.1067), diastolic RR (p = 0.6340), age (p = 0.0516). Multiple R-
squared: 0.4989, Adjusted R-squared: 0.465.
Coefficients: Estimate Std. Error t value Pr(>|t|)
(Intercept) 19.30144 2.35704 8.189 1.9e-13***
AC -0.03122 0.02886 -1.082 0.2813
Leptin -0.09451 0.04291 -2.202 0.0294 *
BMI -0.07101 0.08879 -0.800 0.4253
Insulin -0.09684 0.04147 -2.335 0.0210 *
TG -0.07363 0.12927 -0.570 0.5699
IVFFA_0 -0.69004 0.58016 -1.189 0.2364
Glucose -0.37848 0.23299 -1.624 0.1067
RR_Dias -0.01234 0.02586 -0.477 0.6340
Age -0.03591 0.01828 -1.964 0.0516 .

25
3.3. Epidemiologic association of metabolic syndrome, type 2 diabetes and bone
loss in the adult population of Balaton Upper-lands
3.3.1. Study population
In our epidemiological database the results of 6282 screening tests were available,
1561 men (mean age 56±13 years) and 4726 women (mean age 54±13 years). The baseline
characteristics (age and gender) of the screened population are shown in Table 8.
Age groups (year) Men (n) Women (n)
<40 163 (20.6%) 628 (79.4%)
40–50 329 (22%) 1166 (78%)
51–60 504 (27.2%) 1351 (72.8%)
61–70 356 (26.33%) 996 (73.67%)
>70 194 (26.5%) 538 (73.5%)
Table 8.: Distribution of screened subjects based on gender and age.
Based on the data that were available we have defined syndromes / diseases shown in Table
9.
Diabetes : presence of impaired glucose tolerance: fasting capillary plasma glucose >5.6 mmol/l
and/or 2 hours capillary plasma glucose >7.8 mmol/l, any value ≥11.1 mmol/l and / or
known / treated diabetes mellitus
Hypertension: untreated or treated known hypertension or systolic blood pressure > 140
And/or diastolic blood pressure >90 Hgmm
Overweight: 25<BMI<30, obesity: BMI≥30, severe obesity: BMI≥35 kg/m2
Hypercholesterolemia: total capillary plasma cholesterol >5.2 mmol/l
Android obesity: Abdominal circumference: men >102 cm, women >88 cm
Table 9.: Definitions of diseases / syndromes that were assessed
Categories do not always mean definitive diagnoses as one time capillary plasma
measurements may not enable us to adapt internationally used criteria systems although we
have tried to define categories based on the valid international / national guidelines at the

26
time of the publication [27-31]. In case of “Metabolic syndrome” we have defined an ‘insulin
resistant’ state not necessarily identical to the disease / syndrome defined by the ATP-III or
WHO criteria (Table 10.).
Metabolic syndrome: Presence of DM/IGT/IFG, hypertension, hypercholesterolemia,
obesity and/or android obesity in overweight patient: the presence of
at least 3 of these criteria at the same time.
Osteoporosis: T-score: <–2.5 and / or treated osteoporosis
Osteopenia: T-score: between –1 and –2.5
Table 10.: Definition of Metabolic syndrome, osteoporosis and osteopenia
3.3.2. Results of epidemiologic data
When assessing the correlations between bone density (T score) and some of the
metabolic parameters (Table 11.) we found that there is a significant positive correlation
between BMI and T score in every age group in women (except in women under the age of
40), the correlation being strongest in the population > 70 years . This relationship was
missing in men. Abdominal circumference shows a weak positive correlation with T score in
women < 40 years and in men between 40 and 50 years. Blood sugar showed significant
positive association with T score only in men over 70 years.
BMI R= Abdominal circumference R= Blood sugar R=
T score Men Women Men Women Men Women
<40 n.s. n.s. n.s. +0.254** n.s. n.s.
41–50 n.s. n.s +0.234* +0.185** n.s. n.s.
51–60 n.s. +0.115** n.s. +0.152** n.s. n.s.
61–70 n.s. +0.110* n.s. n.s. n.s. n.s.
>70 n.s. +0.230**** n.s. n.s. +0.359**** n.s.
Table 11.: Correlation coefficients of bivariate correlations measured between T score, BMI
abdominal circumference and blood sugar levels within genders and age groups. Significant
correlations are indicated: *p<0.05, **p<0.02, ***p<0.01, ****p<0.001
We have examined the prevalence of osteoporosis / osteopenia in patients with
metabolic syndrome and diabetes based on gender and age groups. There was no significant

27
difference in the prevalence of decreased bone density between patients with metabolic
syndrome and controls (those with no metabolic syndrome) in either gender or age groups.
Looking at the frequency of osteoporosis / osteopenia in diabetic subjects we found that
amongst 51-60 years old women the prevalence of osteopenia was significantly higher in the
diabetic than in the normal glucose tolerant group (50 vs. 36.34% in diabetic vs. non-diabetic
females, χ2: 5.237, p<0.022, OR: 1.711, 95% CI: 1.076–2.722). Mean age of the two groups
(diabetic and normal glucose tolerant) was not significantly different (55.7±4.2 vs. 55.2±4.1
years, p = 0.7), however the mean BMI in this diabetic group was significantly higher than in
the normal glucose tolerant group (29.42±5.27 vs. 27.73±4.77, p<0.008) which makes our
data even stronger, as high BMI is generally accepted as a protective factor against bone loss.
There was no significant difference in the prevalence of osteoporosis or osteopenia in other
age groups in women or in any of the age groups in men between diabetic and control
subjects. Due to high BMI having presumably both diabetogenic and osteoprotective role we
have separately analyzed the prevalence of different stages of bone loss in normal weight
diabetic (BMI < 25), normal weight non-diabetic, all diabetic and all non-diabetic subjects
(Figure 8. and Figure 9.).
Figure 8.: Prevalence of osteoporosis, osteopenia and normal BMD in normal weight
(BMI<25) diabetic, normal weight non-diabetic, all non-diabetic and all non-diabetic
subjects ≤ 60 years old.

28
Figure 9.: Prevalence of osteoporosis, osteopenia and normal BMD in normal weight
(BMI<25) diabetic, normal weight non-diabetic, all diabetic and all non-diabetic
subjects > 60 years old.
Considering the small sample size in each group, for statistical rationale we only defined
two age groups, below 60 and over 60 years, and genders were not separately analyzed either.
Within the individual age groups there was no difference between the mean age of the normal
weight and all diabetic patients (53.8±10.0 vs. 56.4±8.6 and 70.6±6.4 vs. 69.4 ±5.9 years).
We didn’t find significant difference in the prevalence of osteoporosis / osteopenia in the
population under 60 years although there was a trend for increased prevalence of osteoporosis
in normal weight diabetic versus all diabetic patients (Figure 8.). In the > 60 years group the
frequency of osteoporosis was higher within the normal weight diabetic group than in all
diabetic subjects, the difference being border significant with ‘osteoporosis’ (63.63 vs.
26.2%, OR: 2.71, 95% CI: 0.969–7.6, p = 0.054) but only a trend was seen with ‘ostopenia’
(53.38 vs. 43.31%, p = 0.359), (Figure 9.). There was no difference noted in the prevalence
of osteoporosis / osteopenia in the all diabetic versus all non-diabetic group. (Figure 9.)

29
3.4. Clamp study; bone – energy homeostasis connections
3.4.1. Study population
After obtaining signed informed consent, we included 135 women (aged 49 ± 9 years)
and 155 men (aged 42 ± 13) in our study. Subjects were classified based on results of a
standard 75-g OGTT at screening (blood drawn at the 0, 30, 60, 90 and 120th
minute),
according to ADA criteria [27]. We included 47 normal glucose-tolerant (NGT) and 89
glucose-intolerant (GI: IFG and IGT and drug naïve T2DM) subjects in the female group; in
the male group, there were 72 NGT and 83 GI subjects. The same inclusion and exclusion
criteria were applied in this study as in the earlier clamp studies.
3.4.2. Baseline characteristics
General metabolic and other characteristics of male and female subjects in the study
are summarized in Table 12. NGT and GI subjects are presented separately. Although OCN
mean values were slightly higher in the NGT than in the GI groups in both genders, no
significant difference was observed in OCN levels between NGT and GI subjects. In women
this is the result of the effect of varying ages, that masks the positive association between
OCN and glycemic state, in men however (see later) OCN is mainly associated with
indicators of insulin sensitivity (i.e. glucose uptake rates and body composition) rather than
with plasma glucose levels per se. OCN mean values were somewhat lower than described in
healthy male and female population, although stayed in the normal range [32]. Subjects with
extreme values were excluded from the study. Significantly higher total testosterone values
were found in NGT than in GI males, while no such difference was observed between the
respective female groups.

30 Women Men
NGT, n=47 GI, n=89 NGT, n=72 GI, n=83
BMI(kg/m2) 27.1±5 31.6 ±5*** 26.7 ±5.1 28.2 ±5.25***
Body Fat % 42.5 ±7.4 46.5 ±6** 26.8 ±7.98 28.7 ±8.11***
HbA1c (%) 5.84 ±0.8 6.06 ±0.6*** 5.37 ±0.44 5.83 ±0.69***
OGTT glucose 0 min 5.1±0.45 6.1±0.83*** 5.01±0.45 6.32 ±0.89***
OGTT glucose AUC (mmol/l) 38.69 ±19.3 94.96 ±45.5*** 30.2 ±25.36 90.43 ±49.61***
OGTT insulin AUC (U/ml) 6627.3
±4017
8448 ±5617* 5402 ±3534 6796 ±4282*
M1 (mg/min/BW kg)
11.28 ±4.4 7.92 ±3.2*** 12.32 ±3.78 8.76 ±3.63***
M3 (mg/min/muscle kg)
6.62±3.22 4.31±2.03*** 8.95±3.45 6.11±2.71***
Leptin (ng/ml) 27.8 ±22.7 31.94 ±20.8 10.13 ±9.89 8.72 ±6.63
Adiponectin (µg/ml) 5.7 ±3.1 5.4 ±3.1 4.58 ±2.62 3.46 ±1.92
Testosterone (ng/ml) 0.74 ± 0.84 ± 15.51±5.21 13.44 ±6.24*
Osteocalcin (ng/ml) 18.89 ±7.49 18.13 ±7.66 19.87±8.27 19.08 ±9.15
Table 12.: General characteristics of the study subjects. OCN Normal range: 11–48 ng/ml
for women, 14–46 ng/ml for men. Normal glucose-tolerant (NGT) and glucose-intolerant
(GI) subjects, the latter consisting of impaired fasting glucose (IFG), impaired glucose-
tolerant (IGT), or drug-naive type 2 diabetic (2DM) subjects, are represented separately.
Significant differences between NGT and IGT groups are shown. *p < 0.05, **p <0.01,
***p<0.001.
3.4.3. Metabolic associations of OCN in females
Spearman's correlations and partial correlations between OCN and metabolic
parameters of female subjects are shown in Table 13. Significant association was observed
between OCN and adiponectin levels independent of age, HbA1c, BMI and BFP. Higher
OCN values were associated with increasing age in women. Significant correlation between
OCN and improving metabolic state (lower OGTT glucose values, BMI, BFP, higher M1 and
M3 levels) became apparent after the adjustment for age alone. Most of these associations
ceased after further adjustment with HbA1c, BMI and BFP, except for fasting glucose.
Further adjustment with adiponectin resulted in lost correlation between OCN and fasting
glucose value, i.e. OCN effect on improving glycemic control might be partly mediated by
adiponectin in females. Further adjustment was done with FSH levels in a subset of 68
women (where FSH levels were available) in order to exclude the effect of menopausal state

31
on the metabolic associations of OCN (not represented in Table 13.). Positive associations
between improved metabolic state and OCN became apparent after the adjustment with FSH,
similar to the influence of age: R = −0.323, p = 0.0062 with HbA1c, R = −0.349, p = 0.0026
with IVGTT glucose AUC, and R = −0.288, p = 0.0153 with OGTT glucose 0th
min, R =
+0.260, p = 0.031 with M3. As expected, a strong positive association was found between
FSH levels and OCN, independent age, BMI, body composition and HbA1c values (R =
+0.413, p = 0.00047).

32
OCN and:
R= R =
(adjusted for age)
R=(adjusted for
BMI, BFP, age and
HbA1c)
Cor R=
(ad(adjusted for age, BMI, BFP, HbA1c
and adiponectin)
Age +0.231** - - -
HbA1c n.s. -0.267** - -
OGTT glucose 0 min n.s. -0.236** n.s. n.s.
OGTT glucose 120 min n.s. -0.205* n.s. n.s.
OGTT glucose AUC n.s. n.s. n.s. n.s.
OGTT insulin AUC n.s. n.s. n.s. n.s.
IVGTT glucose 0 min. n.s. -0.269** -0.190* n.s.
IVGTT glucose AUC n.s. -0.182* n.s. n.s.
IVGTT insulin AUC n.s. n.s. n.s. n.s.
AIR n.s n.s. n.s. n.s.
IGI n.s. n.s. n.s. n.s.
M1 n.s. +0.221** n.s. n.s.
M3 n.s. +0.240** n.s. n.s.
Leptin n.s. n.s. n.s. n.s.
Adiponectin +0.254** +0.254** +0.335*** -
Triglyceride n.s. n.s. n.s n.s.
Testosterone n.s. n.s. n.s. n.s.
BMI n.s. -0192* - -
BFP n.s. -0.224** - -
Waist circumference n.s. -0.212* n.s n.s.
Table 13.: Bivariate (Spearman) and partial correlation coefficients adjusted for
possible confounding factors (age, BMI, BFP and HbA1c), between OCN and metabolic
parameters in women. When adjusted for age alone significant associations with metabolic
parameters were disclosed, i.e. these were concealed due to age. When adiponectin was
added for further adjustment as possible confounding factor, the significant association
between fasting glucose and OCN ceased. The simple coefficients are shown in column 1,
and partial correlation coefficients in columns 2–4. *p < 0.05, **p < 0.01, ***p < 0.001. n.s.:
not significant; BMI: body mass index; BFP: body fat percent; OGTT: oral glucose tolerance
test; AUC: area under the curve; IVGTT: intravenous glucose tolerance test; AIR: acute
insulin response of the IVGTT. IGI: insulogenic index of the IVGTT: (insulin 5 min −
insulin 3 min) / (glucose 5 min − glucose 3 min).

33
3.4.4. Metabolic associations of OCN in males
Spearman's and partial correlation coefficients between OCN and metabolic parameters in
males are shown in Table 14.
OCN and R=
R=
(Adjusted for
age,
BMI, BFP
and HbA1c)
R=
(Adjusted for age,
BMI, BFP,
HbA1c and
testosterone)
R=
(Adjusted for
testosterone alone)
Age
n.s.
-
-
n.s.
HbA1c
n.s.
-
-
n.s.
OGTT glucose 0.min
n.s.
n.s.
n.s.
n.s.
OGTT glucose 120.min.
n.s.
n.s.
n.s.
n.s.
OGTT glucose AUC n.s. n.s. n.s. n.s.
OGTT insulin AUC
-0.179*
n.s.
n.s.
n.s.
IVGTT glucose 0.min
n.s.
n.s.
n.s
.
n.s.
IVGTT glucose AUC
n.s.
n.s.
n.s.
n.s.
IVGTT insulin AUC
n.s.
n.s
n.s
n.s
AIR
n.s.
n.s.
n.s.
n.s.
IGI n.s. n.s. n.s. n.s.
M1 +0.229** n.s. n.s. +0.174*
M3
+0.221**
n.s.
n.s.
n.s.
Triglyceride
-0.183* n.s. n.s. -0.178*
Leptin -0.168* n.s. n.s. n.s.
Adiponectin n.s. n.s. n.s. n.s.
Testosterone +0.243** +0.193* - -
BMI -0.199* - - n.s.
BFP -0.172* - - -0.171*
Waist circumference -0.224** n.s. n.s. -0.221**
Table 14: Spearman and partial correlation coefficients adjusted for possible
confounding factors (age, BMI, BFP, HBA1c and testosterone), between OCN and
metabolic parameters in men. When adjusted only for testosterone alone, significant
association between muscle glucose uptake (M3) and OCN ceased, but stayed significant
between M1 and OCN. The simple coefficients are shown in column 1, and partial
correlation coefficients in columns 2–4. *p < 0.05, **p <0.01, ***p < 0.001. See list of
abbreviations below Table 13.
34
The OCN levels were significantly associated with improving metabolic state
(decreasing OGTT insulin AUC, leptin, BMI, BFP and increasing insulin sensitivity; i.e., M1
and M3 values). These correlations disappeared after the adjustment for age, HBA1c, BMI
and BFP. The significant positive correlation between OCN and testosterone levels was
independent of age, HBA1c, BMI and BFP. After correction for testosterone alone, the
significant positive association between OCN and M3, as well as the significant negative
correlation with leptin and BMI was lost, i.e. metabolic associations of OCN were at least
partly mediated by testosterone in males.
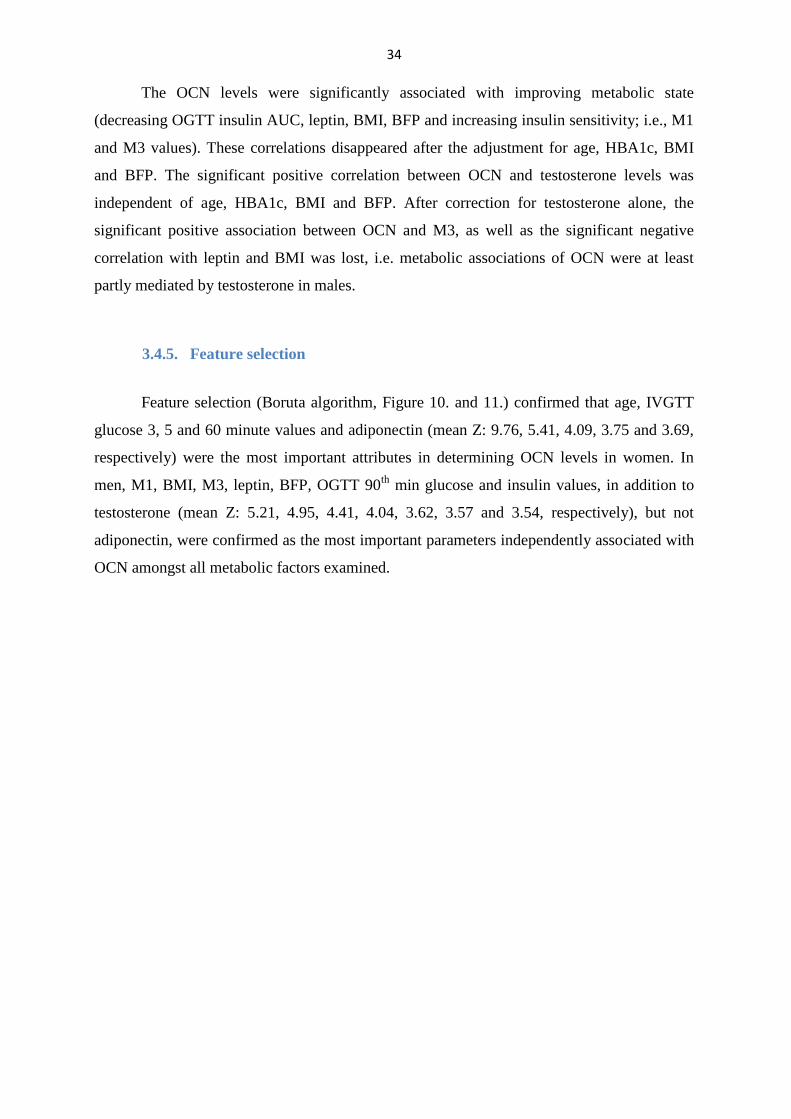
3.4.5. Feature selection
Feature selection (Boruta algorithm, Figure 10. and 11.) confirmed that age, IVGTT
glucose 3, 5 and 60 minute values and adiponectin (mean Z: 9.76, 5.41, 4.09, 3.75 and 3.69,
respectively) were the most important attributes in determining OCN levels in women. In
men, M1, BMI, M3, leptin, BFP, OGTT 90th
min glucose and insulin values, in addition to
testosterone (mean Z: 5.21, 4.95, 4.41, 4.04, 3.62, 3.57 and 3.54, respectively), but not
adiponectin, were confirmed as the most important parameters independently associated with
OCN amongst all metabolic factors examined.

35
Figure 10.: Feature selection analysis (Boruta method) to identify variables most closely
related to OCN values in women. All IVGTT (0-60th
minutes: ‘IVGTTGlu- and Ins0-, 3-, 5-
, 10-, 15-, 20-, 30-, 40-, 50- and 60’) and OGTT (0-120th
minutes: ‘OGTTGlu- and Ins0-, 30-,
60-, 90- and 120’) glucose and insulin values, lipids [TG, total-cholesterol (total-chol)] and
lipoprotein subfractions (total-LDL, total-HDL, IDL-A,- B,- and C, LDL1-4 subfractions),
adipokines (leptin, adiponectin), anthropometric parameters (BMI, body fat percent [BFP],
waist circumference [WC]), testosterone, systolic- and diastolic blood pressure (systBP,
diastBP), acute insulin response (AIR), age, whole- and muscle glucose uptake (M1 and M3)
values were ranked for OCN association. Age, IVGTT glucose 0-, 3-, and 5th
min values and
adiponectin were confirmed as being ‘important’ attributes for OCN; these are represented as
green columns. Yellow and red columns represent attributes that were ‘rejected’ or ‘tentative’
as being important variables for OCN. Blue columns represent ‘shadow attributes’. The Y
axis represents the value of importance (mean, median, minimum, and maximum Z).

36
Figure 11.: Feature selection analysis (Boruta algorithm) to identify variables most
closely related to OCN values in men. All IVGTT (0-60. minutes: ‘IVGTTGlu- and Ins0-,
3-, 5-, 10-, 15-, 20-, 30-, 40-, 50- and 60’) and OGTT (0-120. minutes: ‘OGTTGlu- and Ins0-,
30-, 60-, 90- and 120) glucose and insulin values, lipids [TG, total-cholesterol (total-chol)]
and lipoprotein subfractions (total-LDL, total-HDL, IDL-A,- B,- and C, LDL1-4
subfractions), adipokines (leptin, adiponectin), anthropometric parameters (BMI, body fat
percent [BFP], waist circumference [WC]), testosterone, systolic- and diastolic blood
pressure (systBP, diastBP), acute insulin response (AIR), age, whole- and muscle glucose
uptake (M1 and M3) values were ranked for OCN association. M1, BMI, M3, leptin, BFP,
90-minute glucose and insulin of the OGTT and testosterone were confirmed as ‘important’
attributes for OCN; these are represented as green columns. Yellow and red columns
represent attributes that were rejected or ‘tentative’ for being important attributes for OCN.
Blue columns represent ‘shadow attributes’. The Y axis represents the value of importance
(Z), (mean, median, minimum, and maximum).
37
Discussion
4.1. Evaluation of simple indices in the estimation of clamp measured insulin
sensitivity
Quantitative determination of IS and/or beta cell function (BCF) has a great
significance when studying metabolic diseases, i.e. the relationship between bone metabolism
and energy homeostasis. Although, a number of indices have been developed earlier [22], the
comparison between the simplest fasting HOMA and clamp indices show a quite
heterogeneous picture, there are those reporting about strong [33], week [34] and non-
significant [18] results. Strong correlation was found between clamp index and HOMA-R in
young or middle-aged NGT subjects, or in smaller studies with T2DM patients [33, 35-37].
QUICKI, the logarithmic transformation of HOMA, improved the correlation in a small,
heterogeneous population (r = 0.78 vs. 0.6) [21]. No significant correlation was found
between either HOMA, or QUICKI and clamp indices in other reports in elderly, poorly
controlled diabetic populations [38].
In our study, which included drug-naïve prediabetic or normal glucose tolerant
subjects with a wide range of insulin resistance, the correlation were moderate (r = 0.4-0.6)
between HOMA and clamp measured glucose uptake in most groups. We found weaker
correlations in the NGT and in the glucose intolerant groups with higher age (above median).
Correlations between fasting and clamp indices were weaker in the IGT group with lower
HbA1c and higher AIR (i.e. less severe metabolic state) than in IGT subjects with higher
HbA1c and lower AIR (i.e. more decreased beta cell function). According to our results the
utility of HOMA-S% (Oxford Model) was far behind the expected, although today it is
considered the most accepted, best fasting index [39,40]. Correlations between QUICKI and
M was not improved by FFA in our study which is in contrast with previous results [24].
Amongst OGTT indices we compared the values of the five most often used indices
based on empiric equations validated by clamp [16-19]. An independent study used
discrepancy index (DI) to compare several OGTT indices, which showed that MCRest and
OGIS adjusted for body weight are structurally the closest indices to clamp, i.e. these two
least under- or overestimated the correlations between basic parameters (Ins0 ,Glu0, BMI,
Glumean, Glu120) and M1 [41]. In our study we found that the three OGTT indices including
body weight or BMI in their equations, MCRest, ISIest and ISICederholm showed the best
correlation with clamp M1, as expected in a population with wide range of BMI. Based on

38
the correlations measured within the different groups, the cumulative scores approached 90%.
We conclude that in this mostly overweight population with varying glucose tolerance,
including BMI/weight into the equation improves its value compared to indices based only on
glucose and insulin values. Another advantage of OGTT indices is that they show a fairly
homogeneous value in most examined groups, except in elderly NGT subjects, where their
value was decreased, similar to fasting indices. Individual diagnostic values of the HOMA
and OGTT based IS models may still be a matter of debate, since the best sensitivity for IR
diagnosis was only 50% for fasting and 67% for OGTT indices. The lower sensitivity of
HOMA versus OGTT indices is shown in a study where OGTT insulin area under the curve
(AUC) indicated IR in 44%, while HOMA-R only 18% of 49 normal weight women with
polycystic ovary syndrome [42]. A gender (and racial) difference in the utility of insulin-
based fasting and OGTT-based models has recently been described, as both gender and race,
had a significant effect on explaining the predictability of clamp-measured glucose disposal
rates [43]. Although we did not find significant difference between genders in the value of
either fasting or OGTT indices and could not assess the effect of race as all subjects were
Caucasian in our study, we did find some basic gender difference when the associations
between liver enzymes and insulin sensitivity were analyzed.
4.2. ALT – a possible simple indicator of insulin sensitivity in women
One of the most important findings of our study in this healthy / prediabetic
population is that after the adjustment for confounding factors such as age, BMI, abdominal
circumference, body fat percent, HbA1c, alcohol consumption (and FSH levels in women),
all three liver enzymes (ALT, AST and GGT) stayed significantly associated with clamp-
measured insulin sensitivity (i.e. muscle glucose uptake) in women but disappeared in men.
This difference was only applicable for the gold standard clamp measured peripheral insulin
sensitivity, i.e. the association with the estimated OGTT derived Hepatic Insulin Resistance
Index (although stronger in females than in males) disappeared in both genders after the
correction was done (Table 5.). Moreover, the multiple regression model has found that ALT
was a significant independent predictor of clamp insulin sensitivity besides BMI in females.
In men, this was fasting insulin and leptin but none of the transaminase levels. Lee et al.
described a similar gender difference in a study on adolescent population: obesity and
triglyceride were the major determinants of HOMA-IR in boys, and obesity and GGT in girls,
so liver function test (i.e. transaminase level) only predicted insulin resistance measured by
HOMA model in females [44]. Furthermore, the independent association with IR and ALT
39
was stronger in girls than in boys (p = 0.034 vs. p = 0.005) [44], albeit the latter result was
not confirmed by clamp studies. Those studies having found an independent association
between ALT and directly (clamp or minimal model analysis) measured insulin sensitivity
were carried out on mixed-gender populations (either healthy prediabetic or IGT subjects),
although results stayed significant after the adjustment for sex and other confounding factors
[45, 46].
Our results support the hypothesis that a very delicate sex difference exists in the
progression / association of NAFLD with metabolic parameters in the adult population and
this has an important clinical implication. In women, it is clearly evident that insulin
resistance per se might indicate liver fat accumulation, and vice versa, elevated ALT levels
might indicate decreased insulin sensitivity earlier than fasting insulin, lipoprotein or
adipokine levels. In men, ALT (also AST and GGT) elevations coexist with other metabolic
changes followed / caused by insulin resistance. Therefore liver enzyme elevation per se is
not an indicator of decreased insulin sensitivity but a general metabolic deterioration along
with insulin resistance in men, with no independent associations with the clamp M3 value.
The obvious sex difference in fat distribution leads to increased susceptibility to intra-
abdominal, visceral and liver fat accumulation in men, which is at least partially driven by
differential sex hormone settings [47]. A further explanation and/or consequence is the sexual
dimorphism displayed by liver-associated markers, such as sex hormone-binding globulin
(SHBG) and adiponectin levels being much lower in men, consistent with their greater
insulin resistance and greater risk of diabetes and cardiovascular disease at a younger age [48,
49] and the more severe metabolic phenotype at the diagnosis of NAFLD [50]. This is in
agreement with the finding of Feitosa et al., that ALT is a significant independent predictor of
coronary heart disease in men but not in women, with the association being stronger in non-
diabetic men [51].
Based on the above results slightly elevated ALT may strongly indicate the presence
of insulin resistance in females even without hyperinsulinemia, especially in overweight
women. Hence, the use of ALT in estimating clamp measured insulin sensitivity might be
more relevant in females, while that of fasting insulin-based indices (i.e. the HOMA model)
physiologically seems to be more appropriate in males according to our results. A future
direction could be to include transaminase levels within the HOMA index, which may
increase the diagnostic value of the HOMA model, especially in females (correlations with
HOMA-S in all females is improved by including ALT into the equation in women: R =
0.495 vs. R = 0.588, non-published data). As a conclusion we found that: 1. Conventional

40
fasting IS indices only correlate moderately with the clamp results, 2. OGTT derived IS
indices correlate well with the clamp data so whenever it is possible they should be used
instead of the less precise fasting indices, 3. Liver transaminase levels may increase the
diagnostic value of the conventional fasting indices, especially in females, and as such they
always should to be considered to be a useful tool for IR diagnosis as part of the routine
laboratory assessments, either with or without HOMA model. Moreover, we must take this
into consideration when trying to interpret unexplained transaminase elevation, especially in
female patients.
4.3. Bone – energy homeostasis axis
4.3.1. Discussion of epidemiologic data
Numerous studies have been published about the bone effects of diabetes, most of
these show higher BMD in T2DM [52-54] and lower in T1DM patients [52, 55, 56]. Diabetes
is and independent risk factor for osteoporosis and bone fracture in the elderly normal weight
women [57]. Patients suffering from T2DM initially even with higher BMD seem to have an
accelerated bone loss and increased risk of bone fracture [58]. In most of the studies the
favorable effect of T2DM on BMD and osteoporosis is decreased or ceased if data are
adjusted with BMI, suggesting that the protective effect of diabetes is via increased body
weight. This finding has been confirmed in our study as based on our results the increased
BMD in T2DM is primarily due to increased BMI; diabetes per se is rather increases the risk
of than protects against osteoporosis.
Less results are available about gender differences, studies done in this field have
found that the positive correlation between T2DM and bone density is weaker or lacking in
men, furthermore the positive association between hyperinsulinemia and BMD appears to be
stronger in women than in men [52, 54, 59, 60]. Our preliminary clamp studies have
confirmed that during the initial stages of impaired carbohydrate tolerance the whole body
glucose utilization rate (which is the gold standard method of insulin sensitivity) shows a
significant association with bone density only in females [61]. The results of our screening
tests showed that blood sugar level has a significant correlation with bone density only in
elderly males and the classic positive correlation between BMI and BMD was only
demonstrated in females. We found that in women in their early postmenopausal age
(between 50 – 60 years) osteopenia was significantly more frequent than in the normal

41
glucose tolerant group despite the significantly increased BMI, although no difference was
observed in the prevalence of osteoporosis.
In conclusion our results have confirmed findings which show that T2DM (similar to
T1DM) increases the frequency of osteopenia and osteoporosis in certain populations (like
postmenopausal women and normal weight diabetic patients), furthermore the increased
BMD generally found in T2DM is a consequence of increased body mass index as such
diabetes can be considered rather risk increasing than protective factor. Our results have also
drawn the attention to the notion that basic gender differences may exist in the bone – energy
homeostasis relationship.
4.3.2. The role of OCN; gender difference in the bone – energy homeostasis
relationship
4.3.2.1. OCN and adiponectin
Between 2005 and 2010 we have measured non-carboxylated OCN levels of all either
normal or impaired glucose tolerant subjects, or drug naïve type 2 diabetic patients who
underwent a hyperglycemic normoglycemic clamp to measure their insulin sensitivity. OCN
is believed to be one of the most important neurohumoral link between bone and energy
homeostasis and as such measuring total OCN levels in patients with known insulin
sensitivity in a wide range of different levels of glucose tolerance may give us important
clues about the pathophysiologic background of diabetes induced bone loss and causes of
possible gender differences. In our preliminary clamp studies we have first shown on human
data that OCN shows a positive correlation with insulin sensitivity [62], furthermore we have
also described the existence of a basic gender difference in the relationship of insulin
sensitivity with bone functional metabolic unit derived from the ratio of bone formation
(osteoprotegerin (OPG), procollagen type 1 N-terminal propeptide (P1NP)) and resorption
markers (cathepsin-k, soluble receptor activator NF-kB ligand (RANKL) and β-crosslaps)
[63].
A putative feed-forward regulatory loop ties bone turnover to energy regulation as
proposed by Ferron et al. and Fulzele et al. in 2010 [64, 65]. Insulin activates skeletal
remodeling (that is, increases bone formation by osteoblasts and resorption by osteoclasts),
which in turn releases uncarboxylated osteocalcin from the skeletal matrix into the

42
circulation. This enhances insulin secretion and increases the insulin sensitivity of adipocytes.
Based on the findings of Lee et al. OCN also increases insulin sensitivity by stimulating the
secretion of adiponectin besides having a direct hypoglycemic effect via its secretagogue
function on pancreatic beta cells [66]. We have found that even following the adjustment by
confounding factors, higher OCN values were associated with higher adiponectin levels in
female subjects (Table 2), similar to earlier studies [4, 10]. The same association was not
found in male subjects. This is in accordance with the study of Kanazawa et al. who found a
significant positive association of serum osteocalcin and adiponectin levels only in
postmenopausal women, but not in men [67]. The authors suggested that the difference in
adiponectin levels within sexes may have contributed to these findings but no further
assessments were done to explore the possible rationale behind. In contrast it was also
reported by others that the inverse relationship between carboxylated OCN and adiponectin is
independent of gender and stays significant after correction with BMI [68]. Our study
confirms the association of serum OCN with improved metabolic state (i.e. increased insulin
sensitivity and glycemic control) but based on our findings the mechanism of action may
differ significantly between sexes.
4.3.2.2. OCN in postmenopausal women
Bone turnover is accelerated with increasing age, especially in women [69, 70], which
may be the reason for elevated serum OCN levels with higher age found both genders [71].
Our results confirmed that higher OCN was indeed associated with increasing age and FSH
levels in female but not in male subjects. The significant positive correlation between OCN
and improved metabolic parameters were only found after the correction for age and FSH, i.e.
higher OCN levels due to increased bone turnover with increasing age and insulin resistance
would mask its ‘true’ metabolic character. After further adjustment with body composition
and HbA1c in addition to age, most of the significant correlations between OCN and
metabolic parameters decreased or disappeared entirely, except for fasting glucose. Further
adjustment with adiponectin resulted in lost correlation between OCN and fasting glucose,
which supports the mediating role of adiponectin in some but not all of the metabolic effects
of OCN in females. These findings disagree with recent data from Hwang et al. [9], who
found that although serum OCN levels were indeed associated with improved glucose
tolerance, beta cell function and OGTT measured insulin sensitivity, these were independent

43
of the plasma adiponectin levels. However, their data were derived from a mixed-gender
population. According to our results the positive metabolic effect of OCN in women is not
related to pancreatic beta cell function (as no correlation was found with AIR) but rather to
adiponectin. In fact, the adiponectin mediated insulin sensitization pathways first confirmed
in mice [66] were at least partly confirmed in women by our findings.
4.3.2.3. OCN in men
In contrast to female subjects, no sign of an ‘OCN–adiponectin axis’ was detected in
men; i.e. no correlation was found between adiponectin and serum OCN level albeit the
expected strong independent association with improved insulin sensitivity was indeed
present. Recently, it was demonstrated that osteoblasts may induce testosterone production by
the testes, although ovarian estrogen production in females is unaffected. Analysis of cell-
specific loss- and gain-of-function models has revealed that OCN performs this endocrine
function by binding to a G protein-coupled receptor expressed in Leydig cells, and OCN
regulates the expression of enzymes required for testosterone synthesis in an cAMP response
element-binding protein-dependent manner, thus promoting germ cell survival [12]. On the
other hand, meta-analysis of cross-sectional data suggests that the metabolic syndrome is
associated with male hypogonadism / hypotestosteronemia [72]. The same association was
not confirmed in females [13]. Our results show that adiponectin is not associated with OCN
levels in male subjects; however, increasing OCN levels were indeed associated with higher
testosterone values, independent of age, weight, adiposity and HbA1c. When data were
adjusted for testosterone levels, some of the significant correlation between OCN and insulin
sensitivity, leptin and BMI disappeared. Correlations with whole body glucose utilization,
BFP, waist circumference, and triglyceride values were not affected. These results might
suggest a partial role of testosterone in the metabolic connections of OCN in males, although
because these data were cross-sectional, the cause–causality relationship needs to be further
clarified.
4.3.2.4. Lessons learned from feature selection analysis
Feature selection analysis clearly describes the gender difference: in women, OCN is
independently associated with adiponectin, age, and three of the IVGTT glucose values;
while in men, it is associated with testosterone, BMI, BFP, M1 and M3, OGTT 90th
minute
insulin and glucose, and leptin levels. Thus, an ‘OCN–adiponectin–glycemic state axis’
44
versus ‘OCN–testosterone–insulin resistance axis’ may exist in women versus men,
according to our data. The sex difference might be partially explained by the difference in
adiponectin concentration, as adiponectin levels are significantly higher in women at all
levels of glucose tolerance (normal, prediabetes and type 2 diabetes) than in men [73]. The
fact that several papers have confirmed the positive association between serum OCN and
adiponectin in postmenopausal women [74, 75] but not in men [4, 67] supports the notion
that OCN stimulates the expression of adiponectin only in female adipocytes in humans. In
an earlier study, testosterone treatment reduced plasma adiponectin concentration in male
mice, whereas testosterone also reduced adiponectin secretion in adipocytes [76]. It is
therefore plausible to assume that high testosterone levels counteract with OCN in
stimulating the expression of adiponectin in adipocytes in men. This could explain why we
(and others) did not find any association between OCN and adiponectin in men. Furthermore,
recently a large cross-over study has shown that adiponectin is inversely and independently
associated with bone mass only in women but not in men [77] which result also underlines
the importance of adiponectin in female over male bone physiology. The fact that in men
OCN still has the earlier described positive associations with metabolic parameters proves
that adiponectin independent pathways may indeed play a role in the male bone–energy
homeostasis. Testosterone can only be partially responsible as our results have also
confirmed this notion. Moreover, lower testosterone levels indeed coincide with worsening
metabolic state with decreasing OCN, and this could alone explain numerous observations
that may interfere with the interpretations of our results. Further longitudinal studies are
needed to determine the real nature of the OCN–testosterone axis, particularly its long term
effect on metabolic state of men.
Further data analysis of our clamp studies have shown that basic gender differences
exist in other neurohumoral links of the bone – energy homeostasis relationship, i.e. the
OPG/RANKL system which besides being important regulators of the bone resorption /
formation cycle, have also been associated diabetes severity, diabetic micro- and
macrovascular complications, including acute cardiovascular mortality and morbidity [78, 79,
80]. We have recently shown that while osteoprotegerin (OPG) seemed to be an indicator of
the presence of small-dense LDL subfractions (LDL-2-5) along with decreased presence of
the ‘normal’ large buoyant (LDL-1) subfraction fenotype in women, a positive association
with clamp measured insulin sensitivity was shown only in men, with no clinically relevant
associations with lipid subfractions [81].

45
The significance of this finding is still unclear, although it draws the attention to the
gender specific nature of the association between bone turnover markers and metabolic
diseases. Since the OPG/RANKL system is deeply involved in the OCN – insulin
homeostasis axis by regulating bone resorption and so providing the acidic environment in
the resorption pit for OCN undercarboxylation which results in the production of functionally
active, i.e. ‘undercarboxylated’ OCN, it is plausible to presume that the OPG/RANKL system
has an important role in the metabolic functions of OCN although this needs to be further
assessed by in vitro / in vivo / observational and clinical studies.
4.4. Limitations of our study
Our study has several limitations. First, based on its cross sectional study design, the
present findings are inherently limited in the ability to eliminate causal relationships between
the investigated metabolic / bone parameters / liver markers and insulin resistance or
sensitivity. Total instead of undercarboxylated OCN values were measured which latter is the
metabolically active form of OCN. Some of the discrepancies found between our results and
earlier data might have been resulted from this (i.e. lack of relationship between serum OCN
and parameters of insulin secretion, like AIR or IGI of IVGTT), at least in part. We measured
total instead of free testosterone levels, which is the bioavailable form of testosterone,
although its metabolic role was indeed proven by large scale studies using both total and free
testosterone measurements. The population we investigated involved both diabetic as well as
non-diabetic subjects, both pre- and postmenopausal women although appropriate
adjustments were made for confounding factors such as HbA1c, body composition, age or
FSH. Since some of the study population had several risk factors, including hypertension,
and dyslipidemia, we could not eliminate the possible confounding effect of underlying
diseases on the findings, although the prevalence of controlled hypertension, smoking and
dyslipidemia were similar throughout the male and female groups in our study population.

46
5. Summary of new observations and future implications
Between 2005 and 2010 we have carried out approximately 300 hyperinsulinemic
normoglycemic clamp tests mostly on normal glucose tolerant and prediabetic subjects also
including drug naïve type 2 diabetic patients at the time of the clamp. Our major purpose was
to find metabolic associations in this patient population that would help us to identify
potential subjects who later develop insulin resistance and type 2 diabetes and find clinical
characteristics that would accompany insulin resistance although not necessarily being
essential part of the ‘insulin resistance syndrome’. At first we have assessed the diagnostic
value of simple fasting and OGTT derived insulin sensitivity indices on normal and impaired
glucose tolerant (prediabetic) population and we found that the HOMA model used to
diagnose insulin resistance in the everyday clinical practice does not precisely predict clamp
measured insulin sensitivity especially in the elder populations. OGTT derived insulin
sensitivity indices may be better alternative, because of the need for serial insulin
measurements the cost of such investigations however may be high. In Hungary this was the
first large sample sized clamp study which specifically addressed this issue. Using simple
liver function test (like ALT) to improve the value of the HOMA model might be helpful,
albeit because of the gender specific nature of the aethiopathogenesis of IR driven
steatohepatosis described by us first in detail, it can only be a valuable approach in women
according to our findings.
The results of a large sample sized epidemiologic study in ‘Balaton Upper-land’
carried out by us between 2005 and 2007 including more than 6000 subjects, drew our
attention to the ‘Janus faced’ nature of the relationship between type 2 diabetes and bone
metabolism, i.e. although higher BMI predicts higher BMD values, there is still an increasing
prevalence of osteoporosis and osteopenia on certain diabetic / prediabetic populations, like
normal weight diabetic subjects. Moreover, we have found important data about a possible
gender difference in this respect which was also confirmed by our preliminary clamp data.
We have measured non-carboxylated OCN in all prediabetic patients who underwent a
hyperinsulinemic clamp study to assess the association between metabolic data including
clamp measured insulin sensitivity and OCN values which believed to be the most important
link in the bone – energy homeostasis axis. We have proved that an ‘OCN–adiponectin–
glycemic state axis’ versus ‘OCN–testosterone–insulin resistance axis’ exist in women versus

47
men which draws the attention to the gender specific nature of the bone – energy homeostasis
association but also gave insight to the potential mode of actions OCN may have on insulin
and glucose metabolism.
Future directions include gender specific approach in insulin resistance studies,
including the assessment of bone specific biomarkers like OCN, OPG and RANKL, their
possible role in interventions to prevent or predict insulin resistance / type 2 diabetes and
complications. Furthermore, studying gut microbiome in relation to bone metabolism, which
is the collective metagenomic character of the overall bacterial composition of the gut
(microbiota) in prediabetic state may be a promising new direction, since microbiota may be
an important etiological factor and a possible promising therapeutic target for T2DM (and
T1DM) [82], however only very few data exist about the association of microbiome and bone
metabolism, mostly in preclinical models [83]. Moreover besides genetic, epigenetic studies
are also being urged to identify possible markers of the prediabetic state, and type 2 diabetes
[84]. Most importantly to find biomarkers and other characteristics in the juvenile /
adolescent population in long term follow-up observational / epidemiologic studies that
predict the parallel development of type 2 diabetes and bone loss later in life which could
possibly make the development of these diseases / symptoms preventable. Systems medicine
is a promising tool to identify factors that play a role in the etiology, disease progression and
the success of therapeutic interventions of insulin resistance and type 2 diabetes [85].
Discovering more sides of the bone – energy homeostasis by using systems medicine will
enable us to understand clinically meaningful associations that would help us to prevent
diabetes linked bone loss, which would have a great impact on the diagnosis and prevention
of the two most burdening diseases in today’s health care.

48
6. References
1. Sert M, Tetiker T, Kirim S, Soyupak S, Canataroglu A, Kocak M et al. Type 2
diabetes mellitus and osteopenia: is there an association? Acta Diabetol 2003; 40:105-
8.
2. Van Daele PL, Stolk RP, Burger H, Algra D, Grobbee DE, Hofman A et al. Bone
density in non-insulin-dependent diabetes mellitus. The Rotterdam Study. Ann Intern
Med 1995; 122: 409-14.
3. DeFronzo RA, Tobin JD, Andres R. Glucose clamp technique: a method for
quantifying insulin secretion and resistance. Am J Physiol 1979; 237: E214-E223.
4. Kanazawa I, Yamaguchi T, Yamamoto M, Yamauchi M, Kurioka S, Yano S et al.
Serum osteocalcin level is associated with glucose metabolism and atherosclerosis
parameters in type 2 diabetes mellitus. J Clin Endocrinol Metab 2009; 94(1):45–9.
5. Pittas AG, Harris SS, Eliades M, Stark P, Dawson-Hughes B. Association between
serum osteocalcin and markers of metabolic phenotype. J Clin Endocrinol Metab
2009; 94(3):827–32.
6. Fernández-Real JM, Izquierdo M, Ortega F, Gorostiaga E, Gomez-Ambrosi J,
Moreno-Navarrete JM et al. The relationship of serum osteocalcin concentration to
insulin secretion, sensitivity, and disposal with hypocaloric diet and resistance
training J Clin Endocrinol Metab 2009; 94(1):237–45.
7. Kindblom JM, Ohlsson C, Ljunggren, Karlsson MG, Tivesten A, Smith U et al.
Plasma osteocalcin is inversely related to fat mass and plasma glucose in elderly
Swedish men. J Bone Miner Res 2008; 24:785–91.
8. Zhou M, Ma X, Li H, Pan X, Tang J, Gao Y et al. Serum osteocalcin concentrations
in relation to glucose and lipid metabolism in Chinese individuals. Eur J Endocrinol
2009; 161:723–9.

49
9. Hwang YC, Jeong IK, Ahn KJ, Chung HY. The uncarboxylated form of osteocalcin is
associated with improved glucose tolerance and enhanced beta-cell function in
middle-aged male subjects. Diabetes Metab Res Rev 2009; 25:768–72.
10. Shea MK, Gundberg CM, Meigs JB, Dallal GE, Saltzman E, Yoshida M et al.
Gammacarboxylation of osteocalcin and insulin resistance in older men and women.
Am J Clin Nutr 2009; 90:1230–5.
11. Pacini G, Mari A. Methods for clinical assessment of insulin sensitivity and beta-cell
function. Best Pract Res Clin Endocrinol Metab 2003; 17:305–22.
12. Qury F, Sumara G, Sumara O, Ferron M, Chang H, Smith CE et al. Endocrine
regulation of male fertility by the skeleton. Cell 2011; 144(5):796–809.
13. Brand JS, van der Tweel I, Grobbee DE, Emmelot-Vonk MH, van der Schouw YT.
Testosterone, sex hormone-binding globulin and the metabolic syndrome: a
systematic review and meta-analysis of observational studies. Int J Epidemiol 2011;
40(1):189–207.
14. Végh Z, Kiss J, Nagy E, Deli Á, Tahy Á, Korányi L. Az ultrahanggal történt
Csontsűrűségmérés értéke és helye a gyakorlatban. Orv Hetilap 1995; 136:19-23.
15. Muhammad AA, Matsuda M, Bogdan B, DeFronzo R. Muscle and liver insulin
resistance indices derived from the oral glucose tolerance test. Diabetes Care 2007;
30:89–94.
16. Stumvoll M, Mitrakou A, Pimenta,W, Jenssen T, Yki-Jarvinen H, Van Haeften T,
Renn W, Gerich J. Use of oral glucose tolerance test to assess Insulin Release and
Insulin sensitivity. Diabetes Care 2000; 23: 295-301.
17. Cederholm J, Wibell L. Insulin release and peripheral sensitivity at the oral glucose
tolerance test. Diabetes Res Clin Pract 1990; 10: 167-175.
50
18. Mari A, Pacini G, Murph E, Bernhard L, Nolan JJ. A model-based method for
assessing insulin sensitivity from the oral glucose tolerance test. Diabetes Care 2001;
24: 539-548.
19. Matsuda A, DeFronzo R. Insulin sensitivity indices obtained from oral glucose
tolerance test. Diabetes Care 1999; 22: 1462-1470.
20. Matthews DR, Hosker JP, Rudensky AS, Naylor BA, Treacher DF, Turner RC.
Homeostasis model assessment: insulin resistance and ß-cell function from fasting
plasma glucose and insulin concentrations in man. Diabetologia 1985; 28: 312-419.
21. Katz A, Nambi SS, Mather K, Baron AD, Follmann DA, Sullivan G and Quon MJ.
Quantitative insulin sensitivity check index: a simple, accurate methods for assessing
insulin sensitivity in humans. J Clin Endocrinol Metab 2000; 85: 2402 – 2410.
22. Pacini G, Mari A. Methods for clinical assessment of insulin sensitivity and beta cell
function. Best Pract Res Cl En 2003; 17(3): 305-322.
23. Levy JC, Matthews DR, Hermans MP. Correct homeostasis model assessment
(HOMA) evaluation uses the computer program (Letter). Diabetes Care 1988; 21:
2191-2192.
24. Perseghin G, Caumo A, Caloni M, Testolin G, Luzi L. Incorporation of the fasting
plasma FFA concentration into QUICKI improves its association with insulin
sensitivity in nonobese individuals. J Clin Endocrinol Metab 2001; 86: 4776 – 4781.
25. Liaw A, Wiener M. Classification and regression by randomForest. R News 2000;
2:18–22.
26. Kursa MB, Rudnicki WR. Feature selection with the Boruta Package. J Stat Softw
2010; 36:1–13.
27. ADA Expert Committee on the Diagnosis and Classification of Diabetes Mellitus.
Position Statement. Diabetes Care 2003; 26: 3160-3167.

51
28. WHO definition, diagnosis and classification of diabetes mellitus and its
complications. Report of a WHO Condensation. Part: Diagnosis and Classification of
diabetes mellitus. Geneva, 1999. Diabetol Hungarica 2000; 8(Suppl 2):1-2.
29. National Cholesterol Education Program (NCEP), Expert Panel on Detection,
Evaluation, and Treatment of High Blood Cholesterol in Adults (Adult Treatment
Panel III): Third Report on the National Cholesterol Program (NCEP): Expert Panel
on Detection, Evaluation, and Treatment of high blood cholesterol in adults. (ATP III)
Final Report. Circulation 2002; 106:3143-51.
30. Diagnosis of osteoporosis in men, postmenopausal women and children. Writing
Group for the ISCD Position Development Conference. International Society for
Clinical Densitometry Position Development Conference, Cincinnati, OH, USA. J
Clin Densitom 2004; 7(1):17-26.
31. Kahn R, Buse J, Ferranini E, Stern M. The metabolic syndrome: time for a critical
appraisal. Joint statement from the American Diabetes Association and the European
Association for the study of Diabetes. Diabetologia 2005; 48(9):1684-99.
32. Chen JT, Hosoda K, Hasumi K, Ogata E, Shiraki M. Serum N-terminal osteocalcin is
a good indicator for estimating responders to hormone replacement therapy in
postmenopausal women. J Bone Miner Res 1996; 11(11):1784–92.
33. Bonora E, Targher G, Alberiche M, Bonadonna RC, Saggiani F, Zenere MB.
Homeostasis Model Assessment closely mirrors the glucose clamp technique in the
assessment of insulin sensitivity. Diabetes Care 2000; 23: 57-63.
34. Ferranini E, Balkan B. Insulin: in search of a syndrome. Diabetic Medicine 2002; 19:
724-729.
35. Garcia-Estevez DA, Aranjo-Vilar D, Fiestras-Janeiro G, Saavedra-Gonzales A,
Cabezas-Cerrato J. Comparison of several insulin sensitivity indices derived from
52
basal plasma insulin and glucose levels with minimal model indices. Horm Metab Res
2003; 35: 13-17.
36. Hermans MP, Levy JC, Morris RJ, Turner R. Comparison of tests of β cell function
across a range of glucose tolerance from normal to diabetes. Diabetes 1999; 48: 1779-
1786.
37. Emoto M, Nishizawa Y, Maikawa K, HiuraY, Kanda H, Kawakishi T et al.
Homeostasis Model Assessment as a clinical index of insulin resistance in type 2
diabetic patients treated with sulfonylureas. Diabetes Care 1999; 22: 818-822.
38. Katsuki A, Sumida Y, Urakawa H, Gabazza EC, Muramisha S, Morioka K et al.
Neither Homeostasis Assessment nor Quantitative insulin sensitivity check index can
predict insulin resistance in elderly patients with poorly controlled type 2 Diabetes
mellitus. J Clin Endocrinol Metab 2002; 87: 5332-5335.
39. Wallace TM, Levy JC, Matthews DR. Use and Abuse of HOMA modeling. Diabetes
Care 2004; 27:1487-1495.
40. Levy JC, Matthwes DR, Hermans MP. Correct Homeostasis Model Assessment
(HOMA) evaluation uses the computer program (letter) in Diabetes Care 1998;
21(12):2191-2192.
41. Mari A, Pacini G, Brazzale AR, Ahren B. Comparative evaluation of simple insulin
sensitivity methods based on the oral glucose tolerance test. Diabetologia 2005; 48:
748-751.
42. Fulghesu AM, Angioni S, Portoghese E, Milano F, Paletti B, Paoletti AM and Melis
GB. Failure of the Homeostasis Model Assessment calculation score for detecting
metabolic deterioration in young patients with polycystic ovarium syndrome. Fertil
Steril 2006; 86(2): 398-404.
43. Pisprasert V, Ingram KH, Lopez-Davila MF, Munoz AJ, Garvey WT. Limitations in
the use of indices using glucose and insulin levels to predict insulin sensitivity: impact
53
of race and gender and superiority of the indices derived from oral glucose tolerance
test in African Americans. Diabetes Care 2013; 36:845–53.
44. Lee SY, Sung E, Chang Y. Elevated serum gamma-glutamyl transferase is a strong
marker of insulin resistance in obese children. Int J Endocrinol 2013;13. Article ID
578693, 6 pages, http://www.hindawi.com/journals/ije/2013/ 578693/.
45. Vozarova B, Stefan N, Lindsay RS, Saremi A, Pratley RE, Bogardus C et al. High
alanine aminotransferase is associated with decreased hepatic insulin sensitivity and
predicts the development of type 2 diabetes. Diabetes 2002; 51:1889–95.
46. Hanley AJ, Wagenknecht LE, Festa A, D’Agostino Jr RB, Haffner SM. Alanine
aminotransferase and directly measured insulin sensitivity in a multiethnic cohort: the
insulin resistance atherosclerosis study. Diabetes Care 2007; 30:1819–27.
47. Sattar N. Gender aspects in type 2 diabetes mellitus and cardiovascular risk. Best
Pract Res Clin Endocrinol Metab. 2013; 27:501–7.
48. Ding EL, Song Y, Manson JE, Hunter DJ, Lee CC, Rifai N et al. Sex hormone
binding globulin and risk of type 2 diabetes in women and men. N Eng J Med 2009;
361:1152–63.
49. Sattar N, Wannamethee G, Sarwar N, Tchernova J, Cherry L, Wallace AM et al.
Adiponectin and coronary heart disease: a prospective study and meta-analysis.
Circulation 2006; 114:623–629.
50. Ayonrinde OT, Olynyk JK, Beilin LJ, Mori TA, Pennell CE, de Klerk N et al. Gender
specific differences in adipose distribution and adipocytokines influence adolescent
nonalcoholic fatty liver disease. Hepatology 2011; 53:800–9.
51. Feitosa MF, Reiner AP, Wojczynski MK, Graff M, North KE, Carr JJ et al. Sex-
influenced association of nonalcoholic fatty liver disease with coronary heart disease.
Atherosclerosis 2013; 227:420–4.

54
52. Rakic V, Davis WA, Chubb SA, Islam FM, Prince RL, David TM. Bone mineral
density and its determinants in diabetes: the Fremantle Diabetes Study. Diabetologia
2006; 49:863-71.
53. Bauer DC, Browner WS, Cauley, Orwoll ES, Scott JC, Black DM et al. Factors
associated with appendicular bone mass in older women. The Study of Osteoporotic
Fractures Research Group. Ann Intern Med 1993; 118(9):657-65.
54. Dennison EM, Sydall HE, Sayer A, Craiqhead S, Phillips DI, Cooper C. Type 2
diabetes mellitus is associated with increased axial bone density in men and women
from the Hertfordshire Cohort Study: evidence for an indirect effect of insulin
resistance? Diabetologia 2004; 46:1963-8.
55. Soejima K, Landing BH. Osteoporosis in juvenile-onset diabetes mellitus:
morphometric and comparative studies. Pediatr Pathol 1986;6:289-99.
56. Lopez-Ibarra PJ, Pastor MM, Escobar-Jimenez F, Pardo MD, Gonzalez AG, Luna JD
et al. Bone mineral density at the time of clinical diagnosis of adult-onset type 1
diabetes mellitus. Endocrin Pract 2001; 7:346-51.
57. Korpelainen R, Korpelainen J, Heikkinen J, Vaananen K, Keinanen- Kiukaanniemi S.
Lifelong risk factors for osteoporosis and fractures in elderly women, with low body
mass index – a population based study. Bone 2006; 39:385-91.
58. Schwartz AV, Sellmeyer DE, Strotmeyer ES, Tylavsky FA, Feingold KR, Resnick
HE et al. Diabetes and bone loss at the hip in older black and white adults. J Bone
Min Res 2005; 20(4):596-603.
59. El Miedany YM, el Gaafary S, el Baddini MA. Osteoporosis in older adults with non-
insulin dependent diabetes mellitus: is it sex related? Clin Exp Rheumatol 1999;
17(5):561-7.
60. Barrett-Connor E, Holbrook TL. Sex differences in osteoporosis in older adults with
non-insulin dependent diabetes mellitus. JAMA 1992 ;268:3333-7.

55
61. Buday B, Horváth T, Kulcsár E, Salamon Cs, Literáti Nagy B et al. A progrediáló
inzulinrezisztencia hatása a glükózanyagcsere-csontállapot kapcsolatokra. Orv Hetilap
2007; 148(24):1127-33.
62. Tory K, Literat-Nagy P, Literáti-Nagy B, Buday B, Kulcsar E, Peterfai E, Koranyi L,
Vitai M, Koltay L: Evidence of osteocalcin glucose utilization feed-back connection
in humans. Diabetes 2008; 57(Suppl1): A707, 2597.
63. Buday B, Kulcsár E, Literati-Nagy B, Péterfai E, Korányi L. The regulation of energy
metabolism activity connection is gender-specific. Bone 2009; 44:S234-S252.
64. Ferron M, Wei J, Yoshizawa T, Del Fattore A, DePinho RA, Teti A et al. Insulin
signaling in osteoblasts integrates bone remodeling and energy metabolism. Cell
2010; 142(2):296-308.
65. Fulzele K, Riddle RC, DiGirolamo DJ, Cao X, Wan C, Chen D et al. Insulin receptor
signaling in osteoblasts regulates postnatal bone acquisition and body composition.
Cell 2010; 142(2):309-19.
66. Lee NK, Sowa H, Hinoi E, Ferron M, Ahn JD, Confavreux C et al. Endocrine
regulation of energy metabolism by the skeleton. Cell 2007; 130(3):456–69.
67. Kanazawa I, Yamaguchi T, Tada Y, Yamauchi M, Yano S, Sugimoto T. Serum
osteocalcin level is positively associated with insulin sensitivity and secretion in
patients with type 2 diabetes. Bone 2011; 48(4):720–5.
68. Polgreen LE, Jacobs DR, Nathan BM, Steinberger J, Moran A, Sinaiko AR.
Association of osteocalcin with obesity, insulin resistance, and cardiovascular risk
factors in young adults. Obesity (Silver Spring) 2012; 11:2194–201.
69. Riggs BL, Wahner HW, Dunn WL, Mazess RB, Offord KP, Melton III JL.
Differential changes in bone mineral density of the appendicular and axial skeleton
with aging: relationship to spinal osteoporosis. J Clin Invest 1981; 67:328–35.

56
70. Mazess RB. On aging bone loss. Clin Orthop Relat Res 1982; 165:239–52.
71. Del Pino J, Martín-Gómez E, Martín-Rodríguez M, López-Sosa C, Cordero M,
Lanchares JL et al. Influence of sex, age, and menopause in serum osteocalcin (BGP)
levels. J Mol Med 1991; 69(24):1135–8.
72. Corona G, Monami M, Rastrelli G, Aversa A, Tishova Y, Saad F et al. Testosterone
and metabolic syndrome: a meta-analysis study. J Sex Med 2011; 1:272–83.
73. Saltevo J, Kautiainen H, VanhalaM. Gender differences in adiponectin and low-grade
inflammation among individuals with normal glucose tolerance, prediabetes, and type
2 diabetes. Gend Med 2009; 6(3):463–70.
74. Kanazawa I, Yamaguchi T, Yamamoto M, Yamauchi M, Yano S, Sugimoto T.
Relationships between serum adiponectin levels versus bone mineral density, bone
metabolic markers, and vertebral fractures in type 2 diabetes mellitus. Eur J
Endocrinol 2009; 160: 265-273.
75. Richards JB, Valdes AM, Burling K, Perks UC, Spector TD. Serum adiponectin and
bone mineral density in women. J Clin Endocrinol Metab 2007; 92:1517–23.
76. Nishizawa H, Shimomura I, Kishida K, Maeda N, Kuriyama H, Hiroyuki et al.
Androgens decrease plasma adiponectin, an insulin-sensitizing adipocyte derived
protein. Diabetes 2002; 51:2734–41.
77. Napoli N, Pedone C, Pozzilli P, Lauretani F, Ferrucci L, Incalzi RA. Adiponectin and
bone mass density: the InCHIANTI study. Bone 2010; 47(6):1001–5.
78. Flyvberg A. Diabetic angiopathy, the complement system and tumor necrosis factor
superfamily. Nat Rev Endocrinol 2009; 6(2):94-101.

57
79. Browner WS, Lui LY and Cummings SR. Association of serum osteoprotegerin
levels with diabetes, stroke, bone density, fractures and mortality in elderly women. J
Clin Ebdocrinol Metab 2001; 86(2):631-637.
80. Anand V, Lahiri A, Lim E, Hopkins D, Corder R. The relationship between plasma
osteoprotegerin levels and coronary artery calcification in uncomplicated type 2
diabetic patients. J Am Coll Cardiol 2006; 47(9):1850-1857.
81. Buday B, Pach PF, Literati-Nagy B, Vecsei Z, Vitai M, L. Koranyi L. Dual character
of osteoprotegerin as a metabolic biomarker in a healthy/ prediabetic population.
Diabetologia 2014; 57:[Suppl1]S1–S564.
82. Tai N, Wong FS, Wen L. The role of gut microbiota in the development of type 1,
type 2 diabetes mellitus and obesity. Rev Endocr Metab Disord 2015; 16(1): 55-65.
83. Sjögren K, Engdahl C, Henning P, Lerner UH, Tremaroli V Lagerquist MK, et al.
The gut microbia regulates bone mass in mice. J Bone Min Res 2012;27(6):1357-
1367.
84. Hanson MA, Godfrey KM. Genetics: Epigenetic mechanisms underlying type 2 diabetes
mellitus. Nat Rev Endocrinol 2015; 11, 261–263 .
85. Federoff H, Lawrence OG. Evolving from Reductionism to Holism: Is There a Future
for Systems Medicine? J Am Med Assoc 2009; 302 (9): 994–996.

58
7. Acknowledgements
I would like to thank to Professor László Korányi his guidance and encouragement during all
these years, and his advices when compiling this work.
I would like to express my gratitude to Dr. Csaba Lengyel who provided me with an
indispensable help in writing this thesis.
I would like to say thanks to all of my colleagues who have been my co-workers and co-
authors of the clinical studies described in this thesis: Kovács Györgyi, Vitai Márta, Vecsei
Zsuzsa, Kiss Magdolna, Péterfai Éva, Literáti-Nagy Botond, Kulcsár Enikő, Isóné Katz
Melitta, Kiss Tímea, Réka Pauer, Nagy Elvira, Harangozó Hajnalka, Nagy Judit, Fehér
Ágota, Hanák magdolna, Csomai Melinda and Bezzegh Katalin.
A special thanks to my statistician without whom many parts of this work would not have
been possible, Dr. Péter Pach.
Thanks to my former teacher and colleague, Aladár Rónaszéki who had given me the chance
to start my scientific research in 2006.
Thanks for my Parents to give inspiration for my work.

59
I.

60
II.

61
III.

62
IV.