Interdisciplinary Applied Mathematics · Mechanics and Materials R.V. Kohn Systems and Control S.S....
30
Interdisciplinary Applied Mathematics Volume 30 Editors S.S. Antman J.E. Marsden L. Sirovich S. Wiggins Geophysics and Planetary Sciences Mathematical Biology L. Glass, J.D. Murray Mechanics and Materials R.V. Kohn Systems and Control S.S. Sastry, P.S. Krishnaprasad Problems in engineering, computational science, and the physical and biological sciences are using increasingly sophisticated mathematical techniques. Thus, the bridge between the mathematical sciences and other disciplines is heavily traveled. The correspondingly increased dialog between the disciplines has led to the estab- lishment of the series: Interdisciplinary Applied Mathematics. The purpose of this series is to meet the current and future needs for the interaction between various science and technology areas on the one hand and mathematics on the other. This is done, firstly, by encouraging the ways that that mathematics may be applied in traditional areas, as well as point towards new and innovative areas of applications; and, secondly, by encouraging other scientific disciplines to engage in a dialog with mathematicians outlining their problems to both access new methods and suggest innovative developments within mathematics itself. The series will consist of monographs and high-level texts from researchers working on the interplay between mathematics and other fields of science and technology.
Transcript of Interdisciplinary Applied Mathematics · Mechanics and Materials R.V. Kohn Systems and Control S.S....

Interdisciplinary Applied Mathematics
Volume 30
EditorsS.S. Antman J.E. MarsdenL. Sirovich S. Wiggins
Geophysics and Planetary Sciences
Mathematical BiologyL. Glass, J.D. Murray
Mechanics and MaterialsR.V. Kohn
Systems and ControlS.S. Sastry, P.S. Krishnaprasad
Problems in engineering, computational science, and the physical and biologicalsciences are using increasingly sophisticated mathematical techniques. Thus, thebridge between the mathematical sciences and other disciplines is heavily traveled.The correspondingly increased dialog between the disciplines has led to the estab-lishment of the series: Interdisciplinary Applied Mathematics.
The purpose of this series is to meet the current and future needs for the interactionbetween various science and technology areas on the one hand and mathematics onthe other. This is done, firstly, by encouraging the ways that that mathematics may beapplied in traditional areas, as well as point towards new and innovative areas ofapplications; and, secondly, by encouraging other scientific disciplines to engage in adialog with mathematicians outlining their problems to both access new methodsand suggest innovative developments within mathematics itself.
The series will consist of monographs and high-level texts from researchers workingon the interplay between mathematics and other fields of science and technology.
Macheras-FM.qxd 11/17/05 9:36 AM Page i

Interdisciplinary Applied MathematicsVolumes published are listed at the end of the book
Macheras-FM.qxd 11/17/05 9:36 AM Page ii
Panos Macheras Athanassios Iliadis
Modeling inBiopharmaceutics,Pharmacokinetics, andPharmacodynamicsHomogeneous and HeterogeneousApproaches
With 131 Illustrations
Macheras-FM.qxd 11/17/05 9:36 AM Page iii

Panos Macheras Athanassios IliadisSchool of Pharmacy Faculty of PharmacyZographou 15771 Marseilles 13385 CX 0713284Greece [email protected] [email protected]
Series Editors J.E. MarsdenS.S. Antman Control and Dynamical SystemsDepartment of Mathematics and Mail Code 107-81Institute for Physical Science and Technology California Institute of TechnologyUniversity of Maryland Pasadena, CA 91125College Park, MD 20742 USAUSA [email protected]@math.umd.edu
L. Sirovich S. WigginsLaboratory of Applied Mathematics School of MathematicsDepartment of Biomathematics University of BristolMt. Sinai School of Medicine Bristol BS8 1TWBox 1012 UKNYC 10029 [email protected]
Cover illustration: Left panel: Stochastic description of the kinetics of a population of particles,Fig 9.15. Middle panel: Dissolution in topologically restricted media, Fig. 6.8B (reprinted withpermission from Springer). Right panel: A pseudophase space for a chaotic model of cortisolkinetics, Fig.11.11.
Mathematics Subject Classification (2000): 92C 45 (main n°), 62P10, 74H65, 60K20.
Library of Congress Control Number: 2005934524
ISBN-10: 0-387-28178-9ISBN-13: 978-0387-28178-0
© 2006 Springer Science+Business Media, Inc.All rights reserved. This work may not be translated or copied in whole or in part without thewritten permission of the publisher (Springer Science+Business Media, Inc., 233 Spring Street,New York, NY 10013, USA), except for brief excerpts in connection with reviews or scholarlyanalysis. Use in connection with any form of information storage and retrieval, electronic adap-tation, computer software, or by similar or dissimilar methodology now known or hereafterdeveloped is forbidden.The use in this publication of trade names, trademarks, service marks, and similar terms, evenif they are not identified as such, is not to be taken as an expression of opinion as to whetheror not they are subject to proprietary rights.
While the advice and information in this book are believed to be true and accurate at the dateof going to press, neither the authors nor the editors nor the ublisher can accept any legalresponsibility for any errors or omissions that may be made. The publisher makes no warranty,express or implied, with respect to the material contained herein.
Printed in the United States of America. (MVY)
9 8 7 6 5 4 3 2 1
springeronline.com
Macheras-FM.qxd 11/17/05 9:36 AM Page iv

♦ To our ancestors who inspired us♦ To those teachers who guided us♦ To our families
Macheras-FM.qxd 11/17/05 9:36 AM Page v

Interdisciplinary Applied Mathematics
1. Gutzwiller: Chaos in Classical and Quantum Mechanics2. Wiggins: Chaotic Transport in Dynamical Systems3. Joseph/Renardy: Fundamentals of Two-Fluid Dynamics: Part I:
Mathematical Theory and Applications4. Joseph/Renardy: Fundamentals of Two-Fluid Dynamics: Part II:
Lubricated Transport, Drops and Miscible Liquids5. Seydel: Practical Bifurcation and Stability Analysis: From Equilibrium to
Chaos6. Hornung: Homogenization and Porous Media7. Simo/Hughes: Computational Inelasticity8. Keener/Sneyd: Mathematical Physiology9. Han/Reddy: Plasticity: Mathematical Theory and Numerical Analysis
10. Sastry: Nonlinear Systems: Analysis, Stability, and Control11. McCarthy: Geometric Design of Linkages12. Winfree: The Geometry of Biological Time (Second Edition)13. Bleistein/Cohen/Stockwell: Mathematics of Multidimensional Seismic
Imaging, Migration, and Inversion14. Okubo/Levin: Diffusion and Ecological Problems: Modern Perspectives
(Second Edition)15. Logan: Transport Modeling in Hydrogeochemical Systems16. Torquato: Random Heterogeneous Materials: Microstructure and
Macroscopic Properties17. Murray: Mathematical Biology I: An Introduction (Third Edition)18. Murray: Mathematical Biology II: Spatial Models and Biomedical
Applications (Third Edition)19. Kimmel/Axelrod: Branching Processes in Biology20. Fall/Marland/Wagner/Tyson (Editors): Computational Cell Biology21. Schlick: Molecular Modeling and Simulation: An Interdisciplinary Guide22. Sahimi: Heterogeneous Materials: Linear Transport and Optical Properties
(Vol. I)23. Sahimi: Heterogeneous Materials: Nonlinear and Breakdown Properties
and Atomistic Modeling (Vol. II)24. Bloch: Nonholonomic Mechanics and Control25. Beuter/Glass/Mackey/Titcombe: Nonlinear Dynamics in Physiology and
Medicine26. Ma/Soatto/Kosecka/Sastry: An Invitation to 3-D Vision27. Ewens: Mathematical Population Genetics (2nd Edition) 28. Wyatt: Quantum Dynamics with Trajectories29. Karniadakis: Microflows and Nanoflows30. Macheras/Iliadis: Modeling in Biopharmaceutics, Pharmacokinetics, and
Pharmacodynamics: Homogeneous and Heterogeneous Approaches
Macheras-FM.qxd 11/17/05 9:36 AM Page vi

Preface
H µεγαλη τ εχνη βρισκεται oπoυδηπoτε o ανθρωπoς κατoρθωνειν′αναγνωριζει τoν εαυτ oν τoυ και να τoν εκϕραζει µε πληρoτηταµες στo ελαχιστo.
Great art is found wherever man achieves an understanding of selfand is able to express himself fully in the simplest manner.
Odysseas Elytis (1911-1996)1979 Nobel Laureate in LiteratureThe magic of Papadiamantis
Biopharmaceutics, pharmacokinetics, and pharmacodynamics are the mostimportant parts of pharmaceutical sciences because they bridge the gap betweenthe basic sciences and the clinical application of drugs. The modeling approachesin all three disciplines attempt to:
• describe the functional relationships among the variables of the systemunder study and
• provide adequate information for the underlying mechanisms.
Due to the complexity of the biopharmaceutic, pharmacokinetic, and phar-macodynamic phenomena, novel physically physiologically based modeling ap-proaches are sought. In this context, it has been more than ten years since westarted contemplating the proper answer to the following complexity-relevantquestions: Is a solid drug particle an ideal sphere? Is drug diffusion in a well-stirred dissolution medium similar to its diffusion in the gastrointestinal fluids?Why should peripheral compartments, each with homogeneous concentrations,be considered in a pharmacokinetic model? Can the complexity of arterial andvenular trees be described quantitatively? Why is the pulsatility of hormoneplasma levels ignored in pharmacokinetic-dynamic models? Over time we real-ized that questions of this kind can be properly answered only with an intuitionabout the underlying heterogeneity of the phenomena and the dynamics of theprocesses. Accordingly, we borrowed geometric, diffusional, and dynamic con-cepts and tools from physics and mathematics and applied them to the analysisof complex biopharmaceutic, pharmacokinetic, and pharmacodynamic phenom-ena. Thus, this book grew out of our conversations with fellow colleagues,
vii

viii Preface
correspondence, and joint publications. It is intended to introduce the conceptsof fractals, anomalous diffusion, and the associated nonclassical kinetics, andstochastic modeling, within nonlinear dynamics and illuminate with their usethe intrinsic complexity of drug processes in homogeneous and heterogeneousmedia. In parallel fashion, we also cover in this book all classical models thathave direct relevance and application to the biopharmaceutics, pharmacokinet-ics, and pharmacodynamics.The book is divided into four sections, with Part I, Chapters 1—3, presenting
the basic new concepts: fractals, nonclassical diffusion-kinetics, and nonlineardynamics; Part II, Chapters 4—6, presenting the classical and nonclassical mod-els used in drug dissolution, release, and absorption; Part III, Chapters 7—9,presenting empirical, compartmental, and stochastic pharmacokinetic models;and Part IV, Chapters 10 and 11, presenting classical and nonclassical phar-macodynamic models. The level of mathematics required for understandingeach chapter varies. Chapters 1 and 2 require undergraduate-level algebra andcalculus. Chapters 3—8, 10, and 11 require knowledge of upper undergraduateto graduate-level linear analysis, calculus, differential equations, and statistics.Chapter 9 requires knowledge of probability theory.We would like now to provide some explanations in regard to the use of
some terms written in italics below, which are used extensively in this bookstarting with homogeneous vs. heterogeneous processes. The former term refersto kinetic processes taking place in well-stirred, Euclidean media where theclassical laws of diffusion and kinetics apply. The term heterogeneous is usedfor processes taking place in disordered media or under topological constraintswhere classical diffusion-kinetic laws are not applicable. The word nonlinearis associated with either the kinetic or the dynamic aspects of the phenomena.When the kinetic features of the processes are nonlinear, we basically refer toMichaelis—Menten-type kinetics. When the dynamic features of the phenomenaare studied, we refer to nonlinear dynamics as delineated in Chapter 3.A process is a real entity evolving, in relation to time, in a given environment
under the influence of internal mechanisms and external stimuli. A model is animage or abstraction of reality: a mental, physical, or mathematical represen-tation or description of an actual process, suitable for a certain purpose. Themodel need not be a true and accurate description of the process, nor need theuser have to believe so, in order to serve its purpose. Herein, only mathematicalmodels are used. Either processes or models can be conceived as boxes receiv-ing inputs and producing outputs. The boxes may be characterized as gray orblack, when the internal mechanisms and parameters are associated or not witha physical interpretation, respectively. The system is a complex entity formedof many, often diverse, interrelated elements serving a common goal. All theseelements are considered as dynamic processes and models. Here, determinis-tic, random, or chaotic real processes and the mathematical models describingthem will be referenced as systems. Whenever the word “system” has a specificmeaning like process or model, it will be addressed as such.For certain processes, it is appropriate to describe globally their properties
using numerical techniques that extract the basic information from measured

Preface ix
data. In the domain of linear processes, such techniques are correlation analysis,spectral analysis, etc., and in the domain of nonlinear processes, the correlationdimension, the Lyapunov exponent, etc. These techniques are usually callednonparametric models or, simply, indices. For more advanced applications, itmay be necessary to use models that describe the functional relationships amongthe system variables in terms of mathematical expressions like difference or dif-ferential equations. These models assume a prespecified parametrized structure.Such models are called parametric models.Usually, a mathematical model simulates a process behavior, in what can
be termed a forward problem. The inverse problem is, given the experimentalmeasurements of behavior, what is the structure? A difficult problem, but animportant one for the sciences. The inverse problem may be partitioned into thefollowing stages: hypothesis formulation, i.e., model specification, definition ofthe experiments, identifiability, parameter estimation, experiment, and analysisand model checking. Typically, from measured data, nonparametric indices areevaluated in order to reveal the basic features and mechanisms of the underlyingprocesses. Then, based on this information, several structures are assayed forcandidate parametric models. Nevertheless, in this book we look only intovarious aspects of the forward problem: given the structure and the parametervalues, how does the system behave?Here, the use of the term “model” follows Kac’s remark, “models are cari-
catures of reality, but if they are good they portray some of the features of thereal world” [1]. As caricatures, models may acquire different forms to describethe same process. Also, Fourier remarked, “nature is indifferent toward the dif-ficulties it causes a mathematician,” in other words the mathematics should bedictated by the biology and not vice versa. For choosing among such compet-ing models, the “parsimony rule,” Occam’s “razor rule,” or Mach’s “economyof thought” may be the determining criteria. Moreover, modeling should bedependent on the purposes of its use. So, for the same process, one may de-velop models for process identification, simulation, control, etc. In this vein,the tourist map of Athens or the system controlling the urban traffic in Mar-seilles are both tools associated with the real life in these cities. The first is anidentification model, the second, a control model.Over the years we have benefited enormously from discussions and collab-
orations with students and colleagues. In particular we thank P. Argyrakis,D. Barbolosi, A. Dokoumetzidis, A. Kalampokis, E. Karalis, K. Kosmidis, C.Meille, E. Rinaki, and G. Valsami. We wish to thank J. Lukas whose suggestionsand criticisms greatly improved the manuscript.
A. IliadisMarseilles, FranceAugust 2005
P. MacherasPiraeus, GreeceAugust 2005

Contents
Preface vii
List of Figures xvii
I BASIC CONCEPTS 1
1 The Geometry of Nature 51.1 Geometric and Statistical Self-Similarity . . . . . . . . . . . . . . 61.2 Scaling . . . . . . . . . . . . . . . . . . . . . . . . . . . . . . . . . 81.3 Fractal Dimension . . . . . . . . . . . . . . . . . . . . . . . . . . 91.4 Estimation of Fractal Dimension . . . . . . . . . . . . . . . . . . 11
1.4.1 Self-Similarity Considerations . . . . . . . . . . . . . . . . 111.4.2 Power-Law Scaling . . . . . . . . . . . . . . . . . . . . . . 12
1.5 Self-Affine Fractals . . . . . . . . . . . . . . . . . . . . . . . . . . 121.6 More About Dimensionality . . . . . . . . . . . . . . . . . . . . . 131.7 Percolation . . . . . . . . . . . . . . . . . . . . . . . . . . . . . . 14
2 Diffusion and Kinetics 172.1 Random Walks and Regular Diffusion . . . . . . . . . . . . . . . 182.2 Anomalous Diffusion . . . . . . . . . . . . . . . . . . . . . . . . . 222.3 Fick’s Laws of Diffusion . . . . . . . . . . . . . . . . . . . . . . . 232.4 Classical Kinetics . . . . . . . . . . . . . . . . . . . . . . . . . . . 27
2.4.1 Passive Transport Processes . . . . . . . . . . . . . . . . . 282.4.2 Reaction Processes: Diffusion- or Reaction-Limited? . . . 292.4.3 Carrier-Mediated Transport . . . . . . . . . . . . . . . . . 30
2.5 Fractal-like Kinetics . . . . . . . . . . . . . . . . . . . . . . . . . 312.5.1 Segregation of Reactants . . . . . . . . . . . . . . . . . . . 312.5.2 Time-Dependent Rate Coefficients . . . . . . . . . . . . . 322.5.3 Effective Rate Equations . . . . . . . . . . . . . . . . . . . 342.5.4 Enzyme-Catalyzed Reactions . . . . . . . . . . . . . . . . 352.5.5 Importance of the Power-Law Expressions . . . . . . . . . 36
2.6 Fractional Diffusion Equations . . . . . . . . . . . . . . . . . . . 36
xi

xii Contents
3 Nonlinear Dynamics 393.1 Dynamic Systems . . . . . . . . . . . . . . . . . . . . . . . . . . . 413.2 Attractors . . . . . . . . . . . . . . . . . . . . . . . . . . . . . . . 423.3 Bifurcation . . . . . . . . . . . . . . . . . . . . . . . . . . . . . . 433.4 Sensitivity to Initial Conditions . . . . . . . . . . . . . . . . . . . 453.5 Reconstruction of the Phase Space . . . . . . . . . . . . . . . . . 473.6 Estimation and Control in Chaotic Systems . . . . . . . . . . . . 493.7 Physiological Systems . . . . . . . . . . . . . . . . . . . . . . . . 51
II MODELING IN BIOPHARMACEUTICS 53
4 Drug Release 574.1 The Higuchi Model . . . . . . . . . . . . . . . . . . . . . . . . . . 584.2 Systems with Different Geometries . . . . . . . . . . . . . . . . . 604.3 The Power-Law Model . . . . . . . . . . . . . . . . . . . . . . . . 63
4.3.1 Higuchi Model vs. Power-Law Model . . . . . . . . . . . . 644.4 Recent Mechanistic Models . . . . . . . . . . . . . . . . . . . . . 674.5 Monte Carlo Simulations . . . . . . . . . . . . . . . . . . . . . . . 68
4.5.1 Verification of the Higuchi Law . . . . . . . . . . . . . . . 694.5.2 Drug Release from Homogeneous Cylinders . . . . . . . . 704.5.3 Release from Fractal Matrices . . . . . . . . . . . . . . . . 75
4.6 Discernment of Drug Release Kinetics . . . . . . . . . . . . . . . 824.7 Release from Bioerodible Microparticles . . . . . . . . . . . . . . 834.8 Dynamic Aspects in Drug Release . . . . . . . . . . . . . . . . . 86
5 Drug Dissolution 895.1 The Diffusion Layer Model . . . . . . . . . . . . . . . . . . . . . 90
5.1.1 Alternative Classical Dissolution Relationships . . . . . . 925.1.2 Fractal Considerations in Drug Dissolution . . . . . . . . 935.1.3 On the Use of the Weibull Function in Dissolution . . . . 945.1.4 Stochastic Considerations . . . . . . . . . . . . . . . . . . 97
5.2 The Interfacial Barrier Model . . . . . . . . . . . . . . . . . . . . 1005.2.1 A Continuous Reaction-Limited Dissolution Model . . . . 1005.2.2 A Discrete Reaction-Limited Dissolution Model . . . . . . 1015.2.3 Modeling Supersaturated Dissolution Data . . . . . . . . 107
5.3 Modeling Random Effects . . . . . . . . . . . . . . . . . . . . . . 1095.4 Homogeneity vs. Heterogeneity . . . . . . . . . . . . . . . . . . . 1105.5 Comparison of Dissolution Profiles . . . . . . . . . . . . . . . . . 111
6 Oral Drug Absorption 1136.1 Pseudoequilibrium Models . . . . . . . . . . . . . . . . . . . . . . 114
6.1.1 The pH-Partition Hypothesis . . . . . . . . . . . . . . . . 1146.1.2 Absorption Potential . . . . . . . . . . . . . . . . . . . . . 115
6.2 Mass Balance Approaches . . . . . . . . . . . . . . . . . . . . . . 1176.2.1 Macroscopic Approach . . . . . . . . . . . . . . . . . . . . 118

Contents xiii
6.2.2 Microscopic Approach . . . . . . . . . . . . . . . . . . . . 1216.3 Dynamic Models . . . . . . . . . . . . . . . . . . . . . . . . . . . 122
6.3.1 Compartmental Models . . . . . . . . . . . . . . . . . . . 1226.3.2 Convection—Dispersion Models . . . . . . . . . . . . . . . 124
6.4 Heterogeneous Approaches . . . . . . . . . . . . . . . . . . . . . . 1296.4.1 The Heterogeneous Character of GI Transit . . . . . . . . 1296.4.2 Is in Vivo Drug Dissolution a Fractal Process? . . . . . . 1306.4.3 Fractal-like Kinetics in Gastrointestinal Absorption . . . . 1326.4.4 The Fractal Nature of Absorption Processes . . . . . . . . 1346.4.5 Modeling Drug Transit in the Intestines . . . . . . . . . . 1366.4.6 Probabilistic Model for Drug Absorption . . . . . . . . . . 142
6.5 Absorption Models Based on Structure . . . . . . . . . . . . . . . 1476.6 Regulatory Aspects . . . . . . . . . . . . . . . . . . . . . . . . . . 148
6.6.1 Biopharmaceutics Classification of Drugs . . . . . . . . . 1486.6.2 The Problem with the Biowaivers . . . . . . . . . . . . . . 151
6.7 Randomness and Chaotic Behavior . . . . . . . . . . . . . . . . . 158
III MODELING IN PHARMACOKINETICS 161
7 Empirical Models 1657.1 Power Functions and Heterogeneity . . . . . . . . . . . . . . . . . 1677.2 Heterogeneous Processes . . . . . . . . . . . . . . . . . . . . . . . 169
7.2.1 Distribution, Blood Vessels Network . . . . . . . . . . . . 1697.2.2 Elimination, Liver Structure . . . . . . . . . . . . . . . . . 171
7.3 Fractal Time and Fractal Processes . . . . . . . . . . . . . . . . . 1747.4 Modeling Heterogeneity . . . . . . . . . . . . . . . . . . . . . . . 175
7.4.1 Fractal Concepts . . . . . . . . . . . . . . . . . . . . . . . 1767.4.2 Empirical Concepts . . . . . . . . . . . . . . . . . . . . . 177
7.5 Heterogeneity and Time Dependence . . . . . . . . . . . . . . . . 1787.6 Simulation with Empirical Models . . . . . . . . . . . . . . . . . 181
8 Deterministic Compartmental Models 1838.1 Linear Compartmental Models . . . . . . . . . . . . . . . . . . . 1848.2 Routes of Administration . . . . . . . . . . . . . . . . . . . . . . 1868.3 Time—Concentration Profiles . . . . . . . . . . . . . . . . . . . . 1878.4 Random Fractional Flow Rates . . . . . . . . . . . . . . . . . . . 1888.5 Nonlinear Compartmental Models . . . . . . . . . . . . . . . . . 189
8.5.1 The Enzymatic Reaction . . . . . . . . . . . . . . . . . . . 1918.6 Complex Deterministic Models . . . . . . . . . . . . . . . . . . . 193
8.6.1 Geometric Considerations . . . . . . . . . . . . . . . . . . 1948.6.2 Tracer Washout Curve . . . . . . . . . . . . . . . . . . . . 1958.6.3 Model for the Circulatory System . . . . . . . . . . . . . . 197
8.7 Compartmental Models and Heterogeneity . . . . . . . . . . . . . 199

xiv Contents
9 Stochastic Compartmental Models 2059.1 Probabilistic Transfer Models . . . . . . . . . . . . . . . . . . . . 206
9.1.1 Definitions . . . . . . . . . . . . . . . . . . . . . . . . . . 2069.1.2 The Basic Steps . . . . . . . . . . . . . . . . . . . . . . . 208
9.2 Retention-Time Distribution Models . . . . . . . . . . . . . . . . 2109.2.1 Probabilistic vs. Retention-Time Models . . . . . . . . . . 2109.2.2 Markov vs. Semi-Markov Models . . . . . . . . . . . . . . 2129.2.3 Irreversible Models . . . . . . . . . . . . . . . . . . . . . . 2149.2.4 Reversible Models . . . . . . . . . . . . . . . . . . . . . . 2179.2.5 Time-Varying Hazard Rates . . . . . . . . . . . . . . . . . 2229.2.6 Pseudocompartment Techniques . . . . . . . . . . . . . . 2259.2.7 A Typical Two-Compartment Model . . . . . . . . . . . . 231
9.3 Time—Concentration Profiles . . . . . . . . . . . . . . . . . . . . 2359.3.1 Routes of Administration . . . . . . . . . . . . . . . . . . 2369.3.2 Some Typical Drug Administration Schemes . . . . . . . . 2379.3.3 Time-Amount Functions . . . . . . . . . . . . . . . . . . . 2399.3.4 Process Uncertainty or Stochastic Error . . . . . . . . . . 2439.3.5 Distribution of Particles and Process Uncertainty . . . . . 2459.3.6 Time Profiles of the Model . . . . . . . . . . . . . . . . . 249
9.4 Random Hazard-Rate Models . . . . . . . . . . . . . . . . . . . . 2519.4.1 Probabilistic Models with Random Hazard Rates . . . . . 2539.4.2 Retention-Time Models with Random Hazard Rates . . . 258
9.5 The Kolmogorov or Master Equations . . . . . . . . . . . . . . . 2609.5.1 Master Equation and Diffusion . . . . . . . . . . . . . . . 2639.5.2 Exact Solution in Matrix Form . . . . . . . . . . . . . . . 2659.5.3 Cumulant Generating Functions . . . . . . . . . . . . . . 2659.5.4 Stochastic Simulation Algorithm . . . . . . . . . . . . . . 2679.5.5 Simulation of Linear and Nonlinear Models . . . . . . . . 272
9.6 Fractals and Stochastic Modeling . . . . . . . . . . . . . . . . . . 2819.7 Stochastic vs. Deterministic Models . . . . . . . . . . . . . . . . 285
IV MODELING IN PHARMACODYNAMICS 289
10 Classical Pharmacodynamics 29310.1 Occupancy Theory in Pharmacology . . . . . . . . . . . . . . . . 29310.2 Empirical Pharmacodynamic Models . . . . . . . . . . . . . . . . 29510.3 Pharmacokinetic-Dynamic Modeling . . . . . . . . . . . . . . . . 296
10.3.1 Link Models . . . . . . . . . . . . . . . . . . . . . . . . . . 29710.3.2 Response Models . . . . . . . . . . . . . . . . . . . . . . . 303
10.4 Other Pharmacodynamic Models . . . . . . . . . . . . . . . . . . 30510.4.1 The Receptor—Transducer Model . . . . . . . . . . . . . . 30510.4.2 Irreversible Models . . . . . . . . . . . . . . . . . . . . . . 30510.4.3 Time-Variant Models . . . . . . . . . . . . . . . . . . . . . 30610.4.4 Dynamic Nonlinear Models . . . . . . . . . . . . . . . . . 308
10.5 Unification of Pharmacodynamic Models . . . . . . . . . . . . . . 309

Contents xv
10.6 The Population Approach . . . . . . . . . . . . . . . . . . . . . . 31010.6.1 Inter- and Intraindividual Variability . . . . . . . . . . . . 31010.6.2 Models and Software . . . . . . . . . . . . . . . . . . . . . 31110.6.3 Covariates . . . . . . . . . . . . . . . . . . . . . . . . . . . 31210.6.4 Applications . . . . . . . . . . . . . . . . . . . . . . . . . 313
11 Nonclassical Pharmacodynamics 31511.1 Nonlinear Concepts in Pharmacodynamics . . . . . . . . . . . . . 316
11.1.1 Negative Feedback . . . . . . . . . . . . . . . . . . . . . . 31611.1.2 Delayed Negative Feedback . . . . . . . . . . . . . . . . . 322
11.2 Pharmacodynamic Applications . . . . . . . . . . . . . . . . . . . 33411.2.1 Drugs Affecting Endocrine Function . . . . . . . . . . . . 33411.2.2 Central Nervous System Drugs . . . . . . . . . . . . . . . 34411.2.3 Cardiovascular Drugs . . . . . . . . . . . . . . . . . . . . 34811.2.4 Conclusion . . . . . . . . . . . . . . . . . . . . . . . . . . 350
A Stability Analysis 353
B Monte Carlo Simulations in Drug Release 355
C Time-Varying Models 359
D Probability 363D.1 Basic Properties . . . . . . . . . . . . . . . . . . . . . . . . . . . 363D.2 Expectation, Variance, and Covariance . . . . . . . . . . . . . . . 364D.3 Conditional Expectation and Variance . . . . . . . . . . . . . . . 365D.4 Generating Functions . . . . . . . . . . . . . . . . . . . . . . . . . 365
E Convolution in Probability Theory 367
F Laplace Transform 369
G Estimation 371
H Theorem on Continuous Functions 373
I List of Symbols 375
Bibliography 383
Index 433

List of Figures
1.1 The Koch curve . . . . . . . . . . . . . . . . . . . . . . . . . . . . 61.2 The Sierpinski triangle and the Menger sponge . . . . . . . . . . 71.3 Cover dimension . . . . . . . . . . . . . . . . . . . . . . . . . . . 101.4 A 6× 6 square lattice site model . . . . . . . . . . . . . . . . . . 141.5 Percolation cluster derived from computer simulation . . . . . . . 15
2.1 One-dimensional random walk . . . . . . . . . . . . . . . . . . . . 192.2 Random walks in two dimensions . . . . . . . . . . . . . . . . . . 202.3 Solute diffusion across a plane . . . . . . . . . . . . . . . . . . . . 242.4 Concentration-distance profiles derived from Fick’s law . . . . . . 272.5 Rate vs. solute concentration in Michaelis—Menten kinetics . . . 30
3.1 Difference between random and chaotic processes . . . . . . . . . 403.2 Schematic representation of various types of attractors . . . . . . 423.3 The logistic map, for various values of the parameter θ . . . . . . 443.4 The bifurcation diagram of the logistic map . . . . . . . . . . . . 463.5 The Rössler strange attractor . . . . . . . . . . . . . . . . . . . . 48
4.1 The spatial concentration profile of a drug . . . . . . . . . . . . . 594.2 Case II drug transport with axial and radial release from
a cylinder . . . . . . . . . . . . . . . . . . . . . . . . . . . . . . . 624.3 Fractional drug release vs. time . . . . . . . . . . . . . . . . . . . 654.4 Schematic of a system used to study diffusion . . . . . . . . . . . 694.5 Monte Carlo simulation of the release data . . . . . . . . . . . . . 704.6 Number of particles inside a cylinder vs. time . . . . . . . . . . . 734.7 Simulations with the Weibull and the power-law model . . . . . . 744.8 Fluoresceine release data from HPMC matrices . . . . . . . . . . 764.9 Buflomedil pyridoxal release from HPMC matrices . . . . . . . . 774.10 Chlorpheniramine maleate release from HPMC
K15M matrices . . . . . . . . . . . . . . . . . . . . . . . . . . . . 774.11 A percolation fractal embedded on a 2-dimensional
square lattice . . . . . . . . . . . . . . . . . . . . . . . . . . . . . 794.12 Plot of the release rate vs. time . . . . . . . . . . . . . . . . . . . 804.13 Number of particles remaining in the percolation fractal . . . . . 81
xvii
xviii List of Figures
4.14 Fitting of the power law to pseudodata . . . . . . . . . . . . . . . 844.15 Triphasic drug release kinetics . . . . . . . . . . . . . . . . . . . . 854.16 Conversion of pH oscillations to oscillations in drug flux . . . . . 864.17 Schematic of pulsating drug delivery device . . . . . . . . . . . . 87
5.1 Basic steps in the drug dissolution mechanism . . . . . . . . . . . 905.2 Schematic representation of the dissolution mechanisms . . . . . 915.3 Accumulated fraction of drug dissolved vs. time . . . . . . . . . . 955.4 Cumulative dissolution profile vs. time . . . . . . . . . . . . . . . 985.5 Plot of MDT vs. θ . . . . . . . . . . . . . . . . . . . . . . . . . . 995.6 Discrete, reaction-limited dissolution process . . . . . . . . . . . 1025.7 Dissolved fraction vs. generations (part I) . . . . . . . . . . . . . 1035.8 Dissolved fraction vs. generations (part II) . . . . . . . . . . . . 1055.9 Fraction of dose dissolved for danazol data
(continuous model) . . . . . . . . . . . . . . . . . . . . . . . . . . 1065.10 Fraction of dose dissolved for danazol data
(discrete model) . . . . . . . . . . . . . . . . . . . . . . . . . . . 1065.11 Fraction of dose dissolved for nifedipine data
(discrete model) . . . . . . . . . . . . . . . . . . . . . . . . . . . 108
6.1 Fraction of dose absorbed vs. Z . . . . . . . . . . . . . . . . . . . 1176.2 The small intestine as a homogeneous cylindrical tube . . . . . . 1186.3 Fraction of dose absorbed vs. the permeability . . . . . . . . . . 1216.4 Schematic of the ACAT model . . . . . . . . . . . . . . . . . . . 1246.5 Schematic of the velocity of the fluid inside the tube . . . . . . . 1256.6 Snapshots of normalized concentration inside the
intestinal lumen . . . . . . . . . . . . . . . . . . . . . . . . . . . . 1266.7 A gastrointestinal dispersion model with
spatial heterogeneity . . . . . . . . . . . . . . . . . . . . . . . . . 1286.8 Geometric representation of dissolution . . . . . . . . . . . . . . . 1326.9 Geometry of the heterogeneous tube . . . . . . . . . . . . . . . . 1376.10 Cross sections of the tube at random positions . . . . . . . . . . 1386.11 Mean transit times vs. the forward probability . . . . . . . . . . 1416.12 Frequency of mean transit times vs. time . . . . . . . . . . . . . 1426.13 Fraction of dose absorbed vs. An . . . . . . . . . . . . . . . . . . 1466.14 Three-dimensional graph of fraction dose absorbed . . . . . . . . 1476.15 The Biopharmaceutics Classification System (BCS). . . . . . . . 1496.16 Characterization of the classes of the QBCS . . . . . . . . . . . . 1506.17 The classification of 42 drugs in the plane of the QBCS . . . . . 1526.18 Dose vs. the dimensionless solubility—dose ratio . . . . . . . . . . 1556.19 Mean dissolution time in the intestine vs.
effective permeability . . . . . . . . . . . . . . . . . . . . . . . . . 1566.20 Dose vs. 1/θ for the experimental data of Table 6.1 . . . . . . . . 1576.21 Phase plane plot for a one-compartment model . . . . . . . . . . 159
7.1 Plots of empirical models . . . . . . . . . . . . . . . . . . . . . . 166

List of Figures xix
7.2 A vascular network describes the fate of a drug in the body . . . 1707.3 Time-courses of V (t) /V0 and k (t) for empirical models . . . . . 180
8.1 The rates of transfer of material for the ith compartment . . . . 1848.2 Compartment model with gamma-distributed elimination
flow rate . . . . . . . . . . . . . . . . . . . . . . . . . . . . . . . . 1908.3 Profiles of dimensionless reactant amounts . . . . . . . . . . . . . 1928.4 Influence of ε on the substrate x (τ) profiles . . . . . . . . . . . . 1928.5 Schematic representation of the dichotomous
branching network . . . . . . . . . . . . . . . . . . . . . . . . . . 1958.6 Schematic representation of the ring-shaped tube model . . . . . 1978.7 Indocyanine profile after intravenous administration . . . . . . . 200
9.1 Two-compartment configuration . . . . . . . . . . . . . . . . . . 2099.2 Markov, semi- and general semi-Markov
2-compartment models . . . . . . . . . . . . . . . . . . . . . . . . 2139.3 State probabilities and hazard functions . . . . . . . . . . . . . . 2159.4 Complex 3-compartment configuration . . . . . . . . . . . . . . . 2219.5 Block diagram representation of the complex system . . . . . . . 2219.6 Pseudocompartment configurations . . . . . . . . . . . . . . . . . 2279.7 Densities generated by pseudocompartment configurations . . . . 2289.8 Structured Markovian model . . . . . . . . . . . . . . . . . . . . 2309.9 Total probabilities of a structured model . . . . . . . . . . . . . . 2319.10 Time—p1 (t) profiles using Laplace transform . . . . . . . . . . . . 2329.11 Time—p1 (t) profiles using Erlang distribution . . . . . . . . . . . 2349.12 Time—p1 (t) profiles using pseudocompartments . . . . . . . . . . 2359.13 Two-compartment irreversible system . . . . . . . . . . . . . . . 2379.14 Time—p∗1 (t) profiles for a 6-h infusion . . . . . . . . . . . . . . . 2409.15 Particle probabilities observed in compartment 1 . . . . . . . . . 2469.16 Particle probabilities observed in compartment 2 . . . . . . . . . 2469.17 Normalized particle-count profiles in compartment 1 . . . . . . . 2489.18 Normalized particle-count profiles in compartment 2 . . . . . . . 2489.19 Auto- and cross-compartment serial correlations . . . . . . . . . . 2499.20 Time—concentration curves for hypotheses on V and CL . . . . . 2509.21 Random absorption hazard rate model . . . . . . . . . . . . . . . 2569.22 Random elimination hazard rate model . . . . . . . . . . . . . . 2579.23 Time—p1 (t) profiles with λ ∼Gam(λ2, µ2) . . . . . . . . . . . . . 2599.24 Two-way catenary compartment model . . . . . . . . . . . . . . . 2649.25 Exact solution for probabilities of particles in
compartment 1 . . . . . . . . . . . . . . . . . . . . . . . . . . . . 2749.26 Exact solution for probabilities of particles in
compartment 2 . . . . . . . . . . . . . . . . . . . . . . . . . . . . 2749.27 Exact solution for probabilities of substrate particles . . . . . . . 2769.28 Exact solution for probabilities of complex particles . . . . . . . 2769.29 Cumulant κ11 (t) profile for the compartment model . . . . . . . 2789.30 Cumulant κ11 (t) profile for the enzymatic model . . . . . . . . . 280

xx List of Figures
9.31 Simulations in compartment 1 with the stochastic algorithm . . . 2829.32 Substrate simulations with the stochastic algorithm . . . . . . . . 2829.33 Coefficient of variation for the particles in compartment 1 . . . . 2839.34 Coefficient of variation for the substrate particles . . . . . . . . . 283
10.1 Processes involved in pharmacokinetic-dynamic models . . . . . . 29810.2 Effect-concentration state space for the indirect link model . . . 30110.3 Indirect link model with bolus intravenous injection . . . . . . . 30210.4 Effect-plasma drug concentration state space for tolerance . . . . 307
11.1 Graphical analysis using the binding and feedback curves . . . . 31911.2 Eigenvalues and positions of equilibrium points . . . . . . . . . . 32011.3 State space for different initial conditions . . . . . . . . . . . . . 32111.4 The organization of normal hemopoiesis . . . . . . . . . . . . . . 32411.5 Homeostatic control for regulation of neutrophil production . . . 32611.6 Roots of characteristic equation . . . . . . . . . . . . . . . . . . . 32911.7 Critical frequency ω• and delay τ• vs. φ′ (1) . . . . . . . . . . . . 33011.8 Period T of oscillations vs. τ• . . . . . . . . . . . . . . . . . . . . 33011.9 Simulation of the neutrophil count kinetics . . . . . . . . . . . . 33211.10 Simulated profile of cortisol kinetics . . . . . . . . . . . . . . . . 33611.11 A pseudophase space for cortisol kinetics . . . . . . . . . . . . . 33611.12 Implication of the nonlinear dynamics in cortisol
secretion processes . . . . . . . . . . . . . . . . . . . . . . . . . . 33811.13 Experimental data and simulation of cortisol blood levels . . . . 34011.14 Prolactin time series and the pseudophase attractor . . . . . . . 34211.15 The state space of the dimensionless model variables . . . . . . 34611.16 The dynamics of the dimensionless temperature variable . . . . 34611.17 Snapshots of a spiral wave pattern in cardiac tissue . . . . . . . 349
B.1 A cylindrical cross section for Monte Carlo simulations . . . . . . 356B.2 Monte Carlo simulation of particles in the cylinder . . . . . . . . 356

Part I
BASIC CONCEPTS

BASIC CONCEPTS 3
Biopharmaceutics, pharmacokinetics, and pharmacodynamics have been de-veloped and expanded, as have many other scientific subjects, based on theconcepts of homogeneity and linearity.Homogeneity is a presupposition in almost all research in these fields. Some
typical examples can be quoted. The shape of a drug particle is assumed to bean ideal sphere and its surface smooth. The permeability of the intestinal com-plex membrane is considered constant along the gastrointestinal tract while theconcentration of drug is postulated to be homogeneous in the gastrointestinalfluids. Homogeneous conditions are assumed for each one of the hypotheti-cal compartments of pharmacokinetic models and the effect compartment ofpharmacokinetic-dynamic models. However, common intuition and scientificknowledge tell us that the drug particle is not an ideal sphere, and its surface isnot smooth: the permeability of the gastrointestinal wall is position- and time-dependent. Moreover, the assumed concentration homogeneity of drug in (1◦)the gastrointestinal tract, (2◦) the peripheral compartments of compartmentalsystems, and (3◦) the biophase at receptor’s level, is synonymous with a wellmixed system.Linearity is the basic assumption behind classical biopharmaceutics, phar-
macokinetics, and pharmacodynamics. Formally, a system is linear if the outputof an operation is proportional to the input. This property of proportionalityalong with the property of independence, i.e., the response of the system to aninput is equal to the sum of the outcomes, is the fundamental feature of linearsystems. In contrast, nonlinear kinetic phenomena are frequently observed inpharmacokinetic and pharmacodynamic studies, when the output (e.g., the areaunder the time—concentration curve) is nonlinearly related to the input (e.g.,the dose). However, we deal with complicated biological systems consisting ofa large number of interrelated components and processes. Linear approachesneglect these intrinsic relations and therefore are not complete.In various fields of research, e.g., physics, chemistry, and physiology, sci-
entists are increasingly finding that at the research level it is the nonlinearphenomena that control the game; physical or physiological heterogeneity iseverywhere, while heterogeneous conditions prevail in numerous physical, phys-iological, and biochemical processes. Today, science shows that the real worldis relentlessly nonlinear, and therefore the techniques of nonlinear dynamicsare required to analyze the nonlinear phenomena. In parallel, structural andfunctional heterogeneities can be described and understood with the concept offractals.Kinetic processes in various scientific fields are traditionally treated with
classical kinetics. The latter is quite satisfactory for reactions and processes inwell-stirred media, i.e., under homogeneous conditions. In fact, the kinetics ofdiffusion-controlled processes and reactions in 3-dimensional homogeneous sys-tems obey the classical laws of diffusion where the rate constant of the process islinearly proportional to the diffusion coefficient. However, this proportionalityis not valid for systems with smaller dimensions, fractal spaces, or disorderedsystems since the laws of transport are different in these media. Accordingly,fractal kinetics has been developed since classical kinetics was found to be un-

4 BASIC CONCEPTS
Table 1: Classical and nonclassical considerations of the in vitro and in vivodrug processes.
Fields Classical NonclassicalGeometry Euclidean FractalTopology Ordered media Disordered mediaDiffusion Regular AnomalousKinetics Deterministic StochasticDynamics Linear Nonlinear
satisfactory under dimensional constraints, e.g., phase boundaries, understirredmedia, or membrane reactions.The concepts delineated above are quoted in Table 1 in a comparative man-
ner. The clear message of the middle column of Table 1 is that classical behavioris expected when the phenomena are taking place in Euclidean spaces and/orordered media (e.g., well-stirred systems) since the classical laws of diffusion andkinetics are valid. According to the third column of Table 1, deviations from thenormal behavior appear when the processes take place in fractal spaces and/orunder topological constraints since neither diffusion nor kinetics follow the clas-sical pattern in that case. Finally, the dynamics of the systems are linear whenthe variable of interest is considered to be detached from the remainder of thesystem. On the contrary, nonlinear dynamic behavior exists when the interac-tion of the studied variable with the other variables constituting the system istaken into account.We do believe that it is only through the understanding of underlying prin-
ciples that adequate exploration in the fields of biopharmaceutics, pharmacoki-netics, and pharmacodynamics can be carried out. To this end, in this first,introductory part of the book we deal with the basic nonclassical concepts.Chapter 1 gives the essentials of fractals such as self-similarity, scaling laws,and fractal dimension. Chapter 2 deals with the basics of diffusion-kinetics ineither Euclidean or disordered media. The concepts of nonlinear dynamics arediscussed in Chapter 3, where reference is made to a number of characteristicsof dynamic systems, e.g., phase space, attractor, bifurcation.

1
The Geometry of Nature
The proper route to an understanding of the world is an examinationof our errors about it.
Euclid (325-265 BC)
Our understanding of nature has been based on the classical geometric figuresof smooth line, triangle, circle, cube, sphere, etc. Each of these regular forms canbe determined by a characteristic scale. For example, the length of a straightline can be measured with a ruler that has a finer resolution than the entirelength of the line. In general, each Euclidean object has a unique value forits characteristics (length, area, or volume). It is also known that when theseobjects are viewed at higher magnification they do not reveal any new features.In the real world, however, the objects we see in nature and the traditional
geometric shapes do not bear much resemblance to one another. Mandelbrot [2]was the first to model this irregularity mathematically: clouds are not spheres,mountains are not cones, coastlines are not circles, and bark is not smooth,nor does lightning travel in a straight line. Mandelbrot coined the word fractalfor structures in space and processes in time that cannot be characterized by asingle spatial or temporal scale. In fact, the fractal objects and processes in timehave multiscale properties, i.e., they continue to exhibit detailed structure overa large range of scales. Consequently, the value of a property of a fractal objector process depends on the spatial or temporal characteristic scale measurement(ruler size) used.The physiological implications of the fractal concepts are serious since fractal
structures and processes are ubiquitous in living things, e.g., the lung, the vas-cular system, neural networks, the convoluted surface of the brain, ion channelkinetics, and the distribution of blood flow through the blood vessels. Besides,many applications of fractals exist for the morphology of surfaces, e.g., the sur-face area of a drug particle, surface reactions on proteins. Thus, fractal geometryallows scientists to formulate alternative hypotheses for experimental observa-tions, which lead to more realistic explanations compared to the traditionalapproaches. These fractal hypotheses can be expressed in terms quantifying the
5
6 1. THE GEOMETRY OF NATURE
0=i
1=i
2=i
3=i
4=i
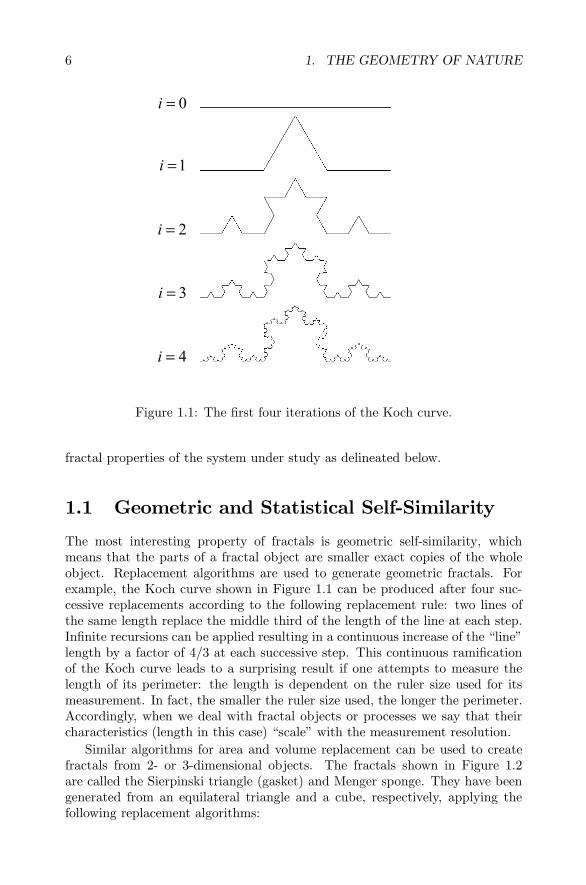
Figure 1.1: The first four iterations of the Koch curve.
fractal properties of the system under study as delineated below.
1.1 Geometric and Statistical Self-Similarity
The most interesting property of fractals is geometric self-similarity, whichmeans that the parts of a fractal object are smaller exact copies of the wholeobject. Replacement algorithms are used to generate geometric fractals. Forexample, the Koch curve shown in Figure 1.1 can be produced after four suc-cessive replacements according to the following replacement rule: two lines ofthe same length replace the middle third of the length of the line at each step.Infinite recursions can be applied resulting in a continuous increase of the “line”length by a factor of 4/3 at each successive step. This continuous ramificationof the Koch curve leads to a surprising result if one attempts to measure thelength of its perimeter: the length is dependent on the ruler size used for itsmeasurement. In fact, the smaller the ruler size used, the longer the perimeter.Accordingly, when we deal with fractal objects or processes we say that theircharacteristics (length in this case) “scale” with the measurement resolution.Similar algorithms for area and volume replacement can be used to create
fractals from 2- or 3-dimensional objects. The fractals shown in Figure 1.2are called the Sierpinski triangle (gasket) and Menger sponge. They have beengenerated from an equilateral triangle and a cube, respectively, applying thefollowing replacement algorithms:

1.1. GEOMETRIC AND STATISTICAL SELF-SIMILARITY 7
0=i 1=i 2=i 3=i
0=i 1=i 2=i
B
A
Figure 1.2: Generation of the (A) Sierpinski triangle (gasket) (the first threeiterations are shown), (B) Menger sponge (the first two iterations are shown)from their Euclidean counterparts.
• Sierpinski triangle: At each step an equilateral triangle with area equal toone-quarter of the remaining triangle is removed.
• Menger sponge: At each step one-third of the length of the side of eachcube is removed taking care to apply this rule in 3 dimensions and avoidingremoval of corner cubes. This means that if the original cube has beenconstructed from 3 × 3 × 3 = 27 small cubes, after the first iteration 20small cubes are remaining (6 are removed from the center of the faces andone is removed from the center of the cube).
These line, area, and volume replacement rules give fractal structures (Fig-ures 1.1 and 1.2), which are quite different from the original Euclidean objects.This obvious difference in shape has implications when one considers physicalmeasurements or (bio)chemical processes taking place in Euclidean vs. frac-tal spaces. For example, surface and/or surface/volume ratios are extremelyimportant for reactions or transport processes taking place at interfaces of dif-ferent phases like liquid—solid boundaries, e.g., drug dissolution, drug uptakefrom the gastrointestinal mucosa. In general, objects with fractal surfaces arevery efficient for surface reactions.Replacement rules are expressed mathematically by difference equations,
which can be used to generate the fractal structures. These equations are usuallycalled maps and have the form
zi+1 = g (zi) , (1.1)
where zi and zi+1 are the input and output, respectively, at two successivesteps, while the functional form of g in (1.1) depends on the exact features

8 1. THE GEOMETRY OF NATURE
of the recursion process. The discrete nature of (1.1) allows for a recursivecreation of the fractal object utilizing the output zi+1 as the next input zi. Inthis respect, (1.1) operates like a copy machine, which produces the self-similarobject in accord with the rule imposed on g.The replacement rules used for the generation of fractal objects ensure
the geometric self-similarity discussed above. However, the fractal objects orprocesses we encounter in nature are not generated by exact mathematical rules.For example, some biological objects with fractal structure like the venular andarterial tree cannot be characterized by geometric self-similarity; rather theypossess statistical self-similarity. The fractal is statistically self-similar sincethe characteristics (such as the average value or the variance or higher mo-ments) of the statistical distribution for each small piece are proportional to thecharacteristics that concern the whole object. For example, the average rate atwhich new vessels branch off from their parent vessels in a physiological struc-ture can be the same for large and small vessels. This is due to the fact thatportions of fractal biological objects resemble the whole object instead of be-ing exact copies of the whole. The term random fractal is used for these fractalstructures to underline their statistical character. Also, statistical self-similaritycan be observed when time series data are recorded for physiological processes,e.g., the electroencephalogram or the electrocardiogram. In this case, we speakof statistical self-similarity in time and not in space.At this point, a distinction should be made between geometrically and sta-
tistically self-similar fractals. The pure mathematical basis of geometric fractalsdoes not impose any restriction on the range of application of their scaling laws.In contrast, scaling laws for statistically self-similar fractals adhering to biologi-cal objects or processes are subject to the limitations imposed by the physiologyand/or the resolution of the measurement technique. In other words, experimen-tal data usually obey scaling laws over a finite range of resolution measurements.This important aspect of scaling laws, with regard to the range of their applica-tion, should be carefully considered when one is applying scaling principles forthe analysis of experimental data.
1.2 ScalingThe issue of scaling was touched upon briefly in the previous section. Here,the quantitative features of scaling expressed as scaling laws for fractal objectsor processes are discussed. Self-similarity has an important effect on the char-acteristics of fractal objects measured either on a part of the object or on theentire object. Thus, if one measures the value of a characteristic θ (ω) on theentire object at resolution ω, the corresponding value measured on a piece ofthe object at finer resolution θ (rω) with r < 1 will be proportional to θ (ω):
θ (rω) = kθ (ω) , (1.2)
where k is a proportionality constant that may depend on r. When statisticalself-similarity in time for recordings of an observable is examined, the scale rω

1.3. FRACTAL DIMENSION 9
is a finer time resolution than scale ω. Relation (1.2) reveals that there is aconstant ratio k between the characteristic θ (ω) measured at scale ω and thesame characteristic θ (rω) measured at scale rω.The above-delineated dependence of the values of the measurements on the
resolution applied suggests that there is no true value of a measured character-istic. Instead, a scaling relationship exists between the values measured and thecorresponding resolutions utilized, which mathematically may have the form ofa scaling power law:
θ (ω) = βωα, (1.3)
where β and a are constants for the given fractal object or process studied.Equation (1.3) can be written
ln θ (ω) = lnβ + α lnω.
This equation reveals that when measurements for fractal objects or processesare carried out at various resolutions, the log-log plot of the measured char-acteristic θ (ω) against the scale ω is linear. Such simple power laws, whichabound in nature, are in fact self-similar: if ω is rescaled (multiplied by a con-stant), then θ (ω) is still proportional to ωa, albeit with a different constant ofproportionality. As we will see in the rest of this book, power laws, with integeror fractional exponents, are one of the most abundant sources of self-similaritycharacterizing heterogeneous media or behaviors.
1.3 Fractal Dimension
The objects considered are sets of points embedded in a Euclidean space. Thedimension of the Euclidean space that contains the object under study is calledthe embedding dimension, de, e.g., the embedding dimension of the plane isde = 2 and of 3-dimensional space is de = 3.One is accustomed to associating topological dimensions with special objects:
dimension 1 with a curve, dimension 2 with a square, and dimension 3 with acube. Because there are severe difficulties for the definition of the topologicaldimension dt, it is convenient to associate the topological dimension of an objectwith its cover dimension do.A curve in the plane is covered with three different arrangements of disks
(Figure 1.3 center). In the right part of the figure there are only pairs of diskswith nonempty intersections, while in the center part there are triplets and inthe left part even quadruplets. Thus, one can arrange coverings of the curve byonly one intersection of each disk with another, and the cover dimension of aline is defined as do = dt = 1.A set of points (Figure 1.3 top) can be covered with disks of sufficiently small
radius so that there is no intersection between them. Their covering dimension isdo = dt = 0. A surface (Figure 1.3 bottom) has covering dimension do = dt = 2,because one needs at least two overlapping spheres to cover the surface. Thesame ideas generalize to higher dimensions.

10 1. THE GEOMETRY OF NATURE
Figure 1.3: The cover dimension.
Similarly, the degree of irregularity of a fractal object is quantified with thefractal dimension, df . This term is used to show that apart from the Euclid-ean integer dimensions (1 or 2 or 3) for the usual geometric forms, fractal ob-jects have noninteger dimensions. The calculation of df using the concept ofself-similarity requires in essence the knowledge of the replacement rule, whichdictates how many similar pieces m are found when the scale is reduced by agiven factor r at each step. Thus, if we count the number m of the exact copiesof the entire geometric fractal that are observed when the resolution of scale ischanged by a factor of r, the value of df can be derived from
df =lnm
ln r(1.4)
after logarithmic transformation of
m = rdf . (1.5)
For example, the fractal dimension of the Koch curve is 1.2619 since four (m = 4)identical objects are observed (cf. levels i = 0 and i = 1 in Figure 1.1) when thelength scale is reduced by a factor r = 3, i.e., df = ln 4/ ln 3 ≈ 1.2619. Whatdoes this noninteger value mean? The Koch curve is neither a line nor an areasince its (fractal) dimension lies between the Euclidean dimensions, 1 for linesand 2 for areas. Due to the extremely ramified structure of the Koch curve,it covers a portion of a 2-dimensional plane and not all of it and therefore its“dimension” is higher than 1 but smaller than 2.Similarly, the first iteration in the generation of the Sierpinski gasket, (Figure
1.2 A) involves the reduction of the scale by a factor r = 2 and results in 3

1.4. ESTIMATION OF FRACTAL DIMENSION 11
identical black equilateral triangles (m = 3); thus, df = ln 3/ ln 2 ≈ 1.5815. Forthe Menger sponge, (Figure 1.2 B), the reduction of the scale by a factor r = 3results in m = 20 identical cubes, i.e., df = ln 20/ ln 3 ≈ 2.727. Both values ofdf are consistent with their dimensions since the Sierpinski gasket lies between1 and 2, while the Menger sponge lies between 2 and 3.Equations (1.4) and (1.5) are also valid for Euclidean objects. For example,
if one creates m = 16 identical small squares in a large square by reducing thelength scale by one-fourth, r = 4, the value of df is ln 16/ ln 4 = 2, which is theanticipated result, i.e., the topological dimension dt = 2 for a plane.
1.4 Estimation of Fractal DimensionIrrespective of the origin of fractals or fractal-like behavior in experimental stud-ies, the investigator has to derive an estimate for df from the data. Since strictself-similarity principles cannot be applied to experimental data extracted fromirregularly shaped objects, the estimation of df is accomplished with methodsthat unveil either the underlying replacement rule using self-similarity principlesor the power-law scaling. Both approaches give identical results and they willbe described briefly.
1.4.1 Self-Similarity Considerations
In principle, the object under study is covered with circles for 1- and 2-dimensio-nal objects or spheres for 3-dimensional objects. This process is repeated usingvarious sizes ω for circles or spheres, while overlapping may be observed. Then,the minimum number of “balls” (circles or spheres) m(ω) of size ω needed tocover the object are calculated. Finally, the fractal dimension, which in thiscase is called the capacity dimension, dc is calculated from the relationship
dc = limω→0
lnm (ω)
ln (1/ω). (1.6)
Note that (1.6) relies on the self-similarity concept since the number of identicalobjects m and the scale factor r in (1.5) have been replaced by the number of“balls” m(ω) and the reciprocal of the size 1/ω, respectively. The limit (ω → 0)is being used to indicate the estimation of dc at the highest possible resolution,i.e., as the “ball” size ω decreases continuously.The reference situation implied in this definition is that at ω = 1, one “ball”
covers the object. A clearer definition of dc is
dc =ln [m (ω) /m (1)]
ln (1/ω),
or in general, if at ω = 1, k “balls” cover the object,
dc =ln [m (kω) /m (k)]
ln (k/kω)

12 1. THE GEOMETRY OF NATURE
and
dc = −d ln [m (ω)]d lnω. (1.7)
The capacity dimension tells us how the number of “balls” changes as the sizeof the “balls” is decreased. This method is usually called box counting sincethe method is implemented in computers with a variety of algorithms utilizingrectangular grids instead of “balls”. Dimensions df and dc are quite similar,and the differences between them are usually much smaller than the error ofestimates [3].
1.4.2 Power-Law Scaling
When the scaling law (1.3) of the measured characteristic θ can be derived fromthe experimental data (ω, θ), an estimate of the fractal dimension df of theobject or process can be obtained as well. In order to apply this method onehas first to derive the relationship between the measured characteristic θ andthe function of the dimension g(df ), which satisfies
θ ∝ ωg(df ), (1.8)
where ω represents the various resolutions used. Then, the exponents of (1.3)and (1.8) are equated,
g(df ) = α, (1.9)
and (1.9) is solved in terms of df to derive an estimate for df .The form of the function g(df ) in (1.9) depends on the measured character-
istic θ [4]. For instance:
• When the characteristic is the mass of the fractal object, the exponent of(1.8) corresponds to the value of df , df = α.
• When the characteristic is the average density of a fractal object, df =de + α, where de is the embedding dimension.
• For measurements regarding lengths, areas, or volumes of objects, a simpleequation can be derived using scaling arguments, df = de − α.
Apart from the estimation of df from experimental data for mass, density,and purely geometric characteristics, the calculation of df for a plethora ofstudies dealing with various characteristics like frequency, electrical conductiv-ity, and intensity of light is also based on the exact relationship that is applicablein each case between df and the scaling exponent α, (1.9).
1.5 Self-Affine Fractals
The replacement rule we have used so far to generate geometric fractals createsisotropic fractals. In other words, the property of geometric self-similarity is

1.6. MORE ABOUT DIMENSIONALITY 13
the same in all directions. Thus, a unique value for the fractal dimension dfis being used to quantify an irregular structure. When either the replacementalgorithm or the actual physical object exhibits an asymmetry in different di-rections, then the anisotropic fractal is characterized as a self-affine fractal. Forexample, if one divides a large square into 6 identical small parallelograms anddiscards 3 of them in an alternate series at each iteration, the result is a discon-nected self-affine fractal. Obviously, the unequal horizontal and vertical sides ofthe parallelograms produced with the successive replacements follow differentscaling laws in accord with the dimensions of the sides. The basic differencebetween self-similarity and self-affinity lies in the fact that self-similar fractalsbecome identical upon simple magnification (classical scaling), while to becomeidentical, self-affine fractals should be scaled by different amounts of the spatialdirections. Accordingly, there is no single value of df for self-affine fractals;it varies with the ruler size used for measurements. Usually, the box-countingmethod is applied in conjunction with (1.6) with limits ω → 0 and ω → ∞;two estimates for df are derived, namely, df,local and df,global, respectively, andused to characterize a self-affine fractal. Both values indicate limiting valuesof the fractal dimension: the former is relevant when the size of the boxes de-creases infinitely, while the latter corresponds to the largest length scale usedfor measurements.
1.6 More About DimensionalityThe concept of fractals has helped us to enrich the notion of dimensionality.Apart from the classical systems with dimensions 1, 2 and 3 there are disorderedsystems with noninteger dimensions.In the simplest case, a system is called Euclidean or nonfractal if its topologi-
cal dimension dt is identical to the fractal dimension df . This means dt = df = 1for a curve, dt = df = 2 for a surface, and dt = df = 3 for a solid. The followingrelationship holds for the three expressions of dimensionality
dt ≤ df ≤ de.Although we have used the value of the fractal dimension df as a means toquantify the degree of disorderliness, it is the magnitude of the difference df−dtthat in essence reflects how irregular (disordered) the system is. Geometricallyspeaking, this difference df − dt allows the disordered system to accommodatestructure within structure, and the larger this difference is, the more disorderedthe system.The above-defined df and dt are structural parameters characterizing only
the geometry of a given medium. However, when we are interested in processeslike diffusion or reactions in disordered media, we need functional parameters,which are associated with the notion of time in order to characterize the dynamicbehavior of the species in these media. The spectral or fracton dimension ds andrandom-walk dimension dw are two such parameters, and they will be definedin Section 2.2.