
Interdependence, Resilience and Sustainability of
30
Interdependence, Resilience and Sustainability of Infrastructure Systems for Biofuel Development PI: Ximing Cai, Co-PIs/SPs: Yanfeng Ouyang, Madhu Khanna, Atul Jain, Gregory McIsaac, Steven Eckhoff, Imad Al-Qadi, Sivapalan Murugesu, Tze Ling Ng University of Illinois at Urbana-Champaign Stephen Gasteyer Michigan State University
Transcript of Interdependence, Resilience and Sustainability of

Interdependence, Resilience and Sustainability of Infrastructure Systems for Biofuel DevelopmentPI: Ximing Cai, Co-PIs/SPs: Yanfeng Ouyang, Madhu Khanna, Atul Jain, Gregory
McIsaac, Steven Eckhoff, Imad Al-Qadi, Sivapalan Murugesu, Tze Ling NgUniversity of Illinois at Urbana-Champaign
Stephen GasteyerMichigan State University

• Interdependencies of subsystems– Input/output (e.g. biofuel production
transportation refineries)– Proximity (e.g. refineries & farms,
refineries & water supply)– Common environmental (e.g., climate,
land, water quality etc.) and social factors (community support, institutional settings)
• Infrastructure resilience and sustainability
– The emerging bio-economy will increase the interdependencies among infrastructure systems and interactions among engineered infrastructures, social communities and the natural environment.
– Physical resilience vs. social resilience• 3-D approach to assess infrastructure
sustainability
Biofuel refinery
Water supply Transportation
Human Inputs
Weather/Climate
Natural Resources
Biofuel crop production
Wate
r/was
te wate
r
Discharge
Proximity
Proximity
Supply/demand
Proximity
DischargeIrrigation
Environmental Criteria
Engineering Criteria
Socio-Economic Criteria
RESOURCE EFFICIENCY PERFORMACNE
Natural Environment -Resources
InfrastructureSocioeconomic-Demand-Revenue
EnergyMaterials
ProductsServices
Cost effectiveness and recovery
Minimization of residualResidual

System of Systems (a coupled human‐natural system)
Water Supply
RefineryBiofuel Economics
Biofuel Shipment
+ Facility cost+ Traffic loadTraffic load
Biomass Production
Yields Benefit/Cost
EnvironmentCommunities
Water supply Water supply
Waste water

Research activities and findings
•Biomass production: integrated biophysical‐economic modeling
• Social impacts
• Environmental impacts
• Infrastructure planning • Integrated analysis on interdependence, sustainability and resilience

ISAM-Land-Surface Model
Energy
Hydrology
Carbon
and
Nitrogen
Cycling
Calculate fluxes of carbon, nitrogen, energy, water, and the dynamical processes that alter these fluxes
• 18 Biome types 0.5 x 0.5 degree resolution
• 30 minutes temporal scale• Season-to-interannual
variability (penology)

Average (2006-2010) Miscanthus Yield (t/ha) With and Without Water Stress
Fraction Yield Change Due to Water Stress
Evapotranspiration (mm/yr)
With Temp. & Water Stresses With Temp. & Without Water Stress

50% Higher Switchgrass Yield
0
20
40
60
80
100
120
140
0 100 200 300 400 500 600 700 800 900 1000
Pri
ce o
f B
iom
ass
($
/MT
)
Biomass (MMT)
0
20
40
60
80
100
120
140
0 100 200 300 400 500 600 700 800 900 1000
Pri
ce o
f B
iom
ass
($
/MT
)Biomass (MMT)
Economically viable supply of agricultural biomass and mix of cellulosic feedstocks at various biomass prices in 2030
Corn Stover Wheat Straw Miscanthus Switchgrass Total Biomass
0.9 B metric dry tons of agricultural biomass can be produced but at$140 per dry metric ton; Relatively small contribution of switchgrass and wheat straw even if switchgrass yields were to increase by 50%

Miscanthus Wheat Straw
Switchgrass Corn Stover
Regional Pattern and Mix of Feedstock Production at $50/MT

Assessing social impact via community capitals framework
A conceptual framework for understanding assets and interactions of assets within a systems setting…

What ARE the Impacts of Biofuels?• Biofuels are sited in more urban counties with
– Lower commute time– Higher personal income– Lower increase in median income– Higher percent minority– Higher educational attainment– Higher petroleum use
• There are at least apparent natural capital effects– Effects on air quality– Possible effects on water
• Impacts of siting Include– Increased farm employment– Increased farm income– Increased personal income– Declining farm proprietors– Increased petroleum use
Implications for Social Resiliency• Biofuels DO have returns to individual financial capital – as well as evidence in generation of employment—at least in the farm sector
• It does not, however, change trends in declining numbers of farmers…or use of petroleum…
• Returns also have traditionally accrued to more urban counties – closer to commodity agriculture and petroleum processing facilities.
• Continuation of demographic and agricultural‐structural and economic trends – no returns fundamentally alter the system in most cases.

BloomingtonSangamon River Basin
St. Louis
Springfield
Kaskaskia River Basin
• Sangamon & Kaskaskia
• The two basins are different in terms of:
— Climate— Crop yields— Urban areas— Land cover
Environmental impact: Two case studies

Shallow Aquifer Subbasin 29: Downstream, 289 km2
0
50
100
150
200
250
300
350
400
450
1999.0 1999.1 1999.2 1999.2 1999.3 1999.4 1999.5 1999.6 1999.7 1999.7 1999.8 1999.9 2000.0
Shal
low
Aqu
ifer S
tora
ge a
t End
of M
onth
(mm
)
SoyCornMiscanthusUrbanCRP
Jan Feb Mar Apr May Jun Jul Aug Sep Oct Nov Dec Jan
• Soil moisture storage under five different land uses.– Different location within the basin, but similar results.
Sangamon Results

January February March April May June July August September October November December0
1
2
3
4
5
6x 10
8S
trea
mfl
ow
(m
3 /mo
)SubBasin 29, 4th Order Stream
CornSoyMiscanthus
January February March April May June July August September October November December0
0.5
1
1.5
2
2.5x 10
8
Str
eam
flo
w (
m3 /m
o)
CornSoyMiscanthus
Streamflow at subbasin outlet for 1999 (top), 2003 (bottom)
SubBasin 29: Downstream (4th order stream)

Integrated Planning of Biofuel Supply Chain Networks and Multimodal Infrastructure Expansion
15
Highway Network
Railroad Network
Passengers O/D
Sink Node
Source Node
Biomass/Biofuel O/DBiomass FlowBiofuel Flow
Biorefinery
• Number/Location of Biorefineries
• Construction CostFacility Location
Transportation Plan
• Shipment Route Choice• Travel Time/Delay
Congestion
Infrastructure Capacity
Expansion
Congestion
Shipment O/D
• Lane Addition/Railroad Expansion
• Infrastructure Cost
Road Capacity

Scenarios of infrastructure planning
1. No transportation infrastructure expansion
2. Scenario 1 + highway expansion:
3. Scenario 2+ intermodal shipments
4. Scenario 3 + railroad expansion
5. Multimodal transportation and railroad
expansion only
16

Numerical Results
17
1. No infrastructure expansion
2. Scenario 1 + highway expansion:
3. Scenario 2+ intermodal shipments
4. Scenario 3 + railroad expansion
5. Multimodal transportation and
railroad expansion only

Biofuel Supply Chain Design under Competitive Agricultural Land Use and Feedstock Market Equilibrium
A new energy supply chain penetrates into the existing system‐ Compete for feedstock supply‐ Balance among facility costs, transportation costs, and market profits
Supply chain design Facility location &
capacity Supply procurement Product distribution
Farmer reaction Production level Supply allocation
Bio-refineries New Biofuel Markets
Existing Local Grain Markets
Farmers
Existing Local Grain Markets
Farmers
Food
Feed
1
2
3
.
.
.
1
2
3...
1
2
3...

Illinois Case Study
1) a benchmark scenario with no refinery built, where farmers only ship and sell corn to local markets;
2) a cooperative scenario, where the total supply chain profit is maximized;
3) a noncooperative scenario, where the farmers and the biofuel company maximize their own profits;
4) a hybrid scenario, where the biofuel company first builds refineries strategically based on the cooperative game solutions, but makes the pricing decisions in a noncooperative setting.
Biofuel production generally increases the net social welfare
Substantial impact on food market
Cooperative scenario generates highest social welfare

Research activities and findings
•Biomass production: integrated biophysical‐economic modeling
• Social impacts• Environmental impacts• Infrastructure planning • Integrated analysis on interdependence, sustainability and resilience

A generic mathematical framework to address interdependence, resiliency and sustainability:
Recovery time Interdependency:
Sustainability:
Resiliency & Sustainability Conceptual Development
The dependency of subsystem i on subsystem j is defined as the change in system i resulted from one unit change in subsystem j.
The resiliency of an infrastructure system is its capability to get back to its operational boundary after being affected by disruptions. Measures of resiliency include functionality degradation, recovery time, recovery speed and adaptability.
System sustainability is its long-term capability to use its limited resources effectively to maintain its functionality and to endure stresses.
Nguyen, Cai and Ouyang (2011), Modeling Infrastructure Interdependencies, Resiliency and Sustainability

A Statistical Definition of Interdependence
22
The interdependence between two systems is measured by the statistical correlation between representative variables from each of the systems (Rinaldi et al. 2001)
System 2 System 2 System 2 System 2 System 2
Correlation = -1 Correlation = -0.5 Correlation = 0 Correlation = 0.5 Correlation = 1
The Pearson product-moment correlation coefficient is the covariance of the representative variables divided by the product of the standard deviations.
Source: Rinaldi, S. M.; J. P. Peerenboom and T. K. Kelly (2001). Identifying, understanding, and analyzing critical infrastructure interdependencies. IEEE Control Systems Magazine, 21(6), 11-25.

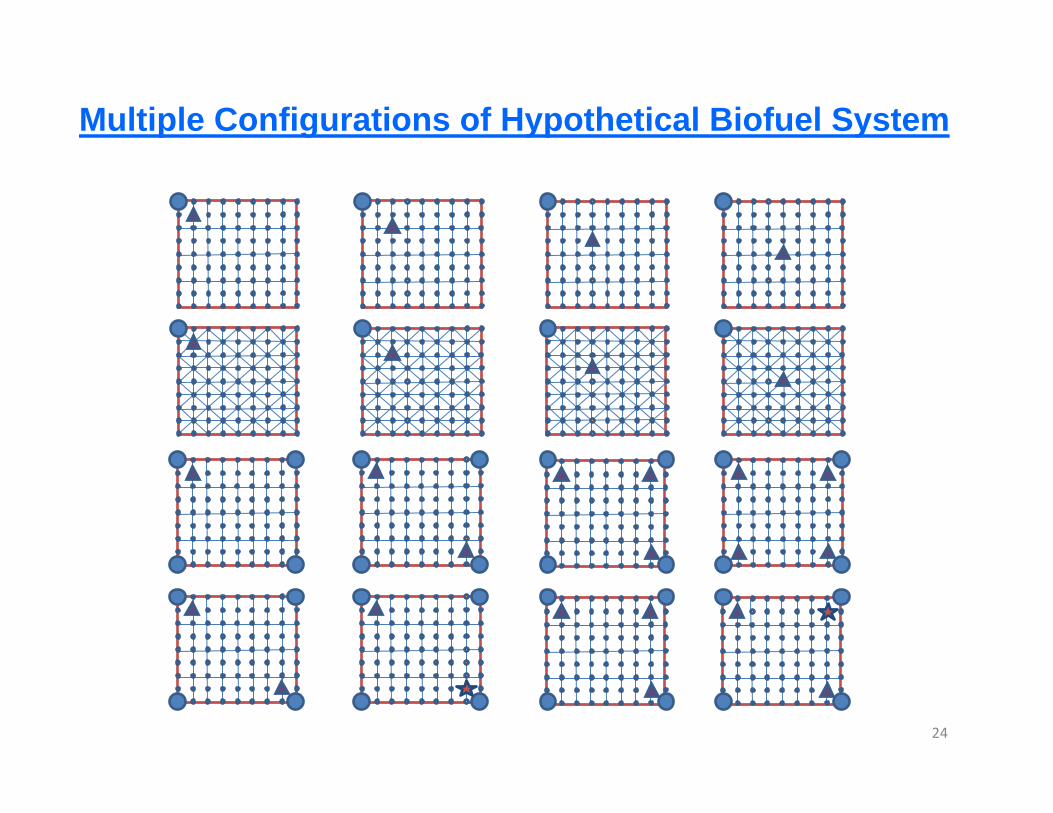
Description of Hypothetical Biofuel System
Demand point
Demand point
Each plot of land is 1,000 ha
Corn ethanol refinery
Demand point
Demand point
Cellulosic ethanol refinery
24
Multiple Configurations of Hypothetical Biofuel System

Preliminary Results
25
Reliability-Interdependence Vulnerability-Interdependence
Monte Carlo simulations are carried out for different configurations of a hypothetical biofuel system to estimate the relationships between reliability and interdependence, and vulnerability and interdependence. The results have been normalized to remove the effects of mean and variance.

Optimization Model Overview
LAND USE
TRANSPORT-ATION REFINERIES
WATER QUANTITY
MAX PROFIT
WATER QUALITY

Objective Functiono To maximize the overall profitability of the system
Constraintso Environmental resource and infrastructure
constraints
Decisions variableso Allocation of land to cropso Refinery locations o Refinery capacitieso Traffic flow capacitieso Water supply capacities
Overview of Model

Scope of ModelSub-systemsTransportationRefineriesLand useWater qualityWater supply
Refinery typesCorn ethanolCellulosic ethanol
Transportation RoadRail
ProductsCorn for food Corn for ethanolSoybeans for foodCorn stoverMiscanthusSwitchgrassEthanolDried distillers grainsLignin

Applications of the Integrated Model• Sensitivity analysis to model parameters and assumptions
• Scenario analysis• Analysis of various scenarios of water availability, possible locations of refineries, climate etc.
• In particular, scenarios on system failures for the Insights into how the failure of one sub‐system (or a part of it) might affect other sub‐systems.
• Policy analysis• Strategic changes in water supply, transportation system and feedstock
production • Impact of environmental regulations, climate control policies and
technology advances • The need of the mix of knowledge, resources and social networks to
enable social resiliency • Bottlenecks and areas of possible investment/ expansion

Summary
– Work at both system level and subsystem level provides guidance to crop choice, price choice, refinery and shipment facility location and size, strategies for infrastructure design and management
– The interaction between environmental, social and engineering systems will lead to radically new technology in biomass production, biofuel refinery and shipment and associated infrastructure expansion
– Understanding of the dynamics of a “system of systems” will lead to paradigm shifts in the expansion of interdependent engineering infrastructures