interdependence between point load index, compressive strength ...
17
Oil Shale, 2015, Vol. 32, No. 3, pp. 252–268 ISSN 0208-189X doi: 10.3176/oil.2015.3.05 © 2015 Estonian Academy Publishers INTERDEPENDENCE BETWEEN POINT LOAD INDEX, COMPRESSIVE STRENGTH AND CRUSHING RESISTANCE OF JORDAN OIL SHALE AND RELATION TO CALORIFIC VALUE VIVIKA VÄIZENE * , INGO VALGMA, ENNO REINSALU, JÜRI-RIVALDO PASTARUS, ERKKI KAISLA Department of Mining, Tallinn University of Technology, Ehitajate tee 5, 19086 Tallinn, Estonia Abstract. Rock parameters are important to be considered in mine design. Physical-mechanical tests were carried out on oil shale and dolostone samples from the Attarat Um Ghudran oil shale area in central Jordan, in order to determine the rock mass properties. It was necessary for assessing the feasibility of excavation and processing. Half-core and core samples were compressed up to failure during the Point Load Test (PLT) and Uni- axial Compressive Strength Test (UCST), respectively, and the PLT index (PLTI) and compressive strength were calculated. A conversion factor between PLTI and UCS for Jordan oil shale and dolostone was determined. The Crushing Resistance Test (CRT) on samples was conducted. Taking into consideration confidence limits, the recommended conversion factor 1 for Attarat oil shale and dolostone is respectively 14 and 12 and the recommended conversion factor 2 is 33 and 12, respectively. This knowledge is relevant in designing selective excavation and dry separation of oil shale. Keywords: Uniaxial Compressive Strength, Point Load Test index, crushing resistance, conversion factor, oil shale, dolostone, Rock mass factor. 1. Introduction Oil shale as a potential source for oil or electricity is being investigated in many countries. By today, the largest amount of oil shale has been extracted and used in Estonia. Based on Estonian practice, the yield of oil or energy of a deposit depends to a great extent on the extraction and separation technologies applied [1, 2]. Both selective breaking and impact crushing are employed in Estonian (organic rich) kukersite oil shale industry for achieving suitable rock size and necessary calorific value [3]. At the same * Corresponding author: e-mail [email protected]
Transcript of interdependence between point load index, compressive strength ...

Oil Shale, 2015, Vol. 32, No. 3, pp. 252–268 ISSN 0208-189X doi: 10.3176/oil.2015.3.05 © 2015 Estonian Academy Publishers
INTERDEPENDENCE BETWEEN POINT LOAD INDEX, COMPRESSIVE STRENGTH AND CRUSHING RESISTANCE OF JORDAN OIL SHALE AND RELATION TO CALORIFIC VALUE
VIVIKA VÄIZENE*, INGO VALGMA, ENNO REINSALU, JÜRI-RIVALDO PASTARUS, ERKKI KAISLA Department of Mining, Tallinn University of Technology, Ehitajate tee 5, 19086 Tallinn, Estonia
Abstract. Rock parameters are important to be considered in mine design. Physical-mechanical tests were carried out on oil shale and dolostone samples from the Attarat Um Ghudran oil shale area in central Jordan, in order to determine the rock mass properties. It was necessary for assessing the feasibility of excavation and processing. Half-core and core samples were compressed up to failure during the Point Load Test (PLT) and Uni-axial Compressive Strength Test (UCST), respectively, and the PLT index (PLTI) and compressive strength were calculated. A conversion factor between PLTI and UCS for Jordan oil shale and dolostone was determined. The Crushing Resistance Test (CRT) on samples was conducted. Taking into consideration confidence limits, the recommended conversion factor 1 for Attarat oil shale and dolostone is respectively 14 and 12 and the recommended conversion factor 2 is 33 and 12, respectively. This knowledge is relevant in designing selective excavation and dry separation of oil shale. Keywords: Uniaxial Compressive Strength, Point Load Test index, crushing resistance, conversion factor, oil shale, dolostone, Rock mass factor.
1. Introduction
Oil shale as a potential source for oil or electricity is being investigated in many countries. By today, the largest amount of oil shale has been extracted and used in Estonia. Based on Estonian practice, the yield of oil or energy of a deposit depends to a great extent on the extraction and separation technologies applied [1, 2]. Both selective breaking and impact crushing are employed in Estonian (organic rich) kukersite oil shale industry for achieving suitable rock size and necessary calorific value [3]. At the same * Corresponding author: e-mail [email protected]

Interdependence between Point Load Index, Compressive Strength and Crushing Resistance...
253
time, selective crushing could give considerable increase in yield [4]. Most of the selective breakage and crushing technologies have already been tested in Estonia on kukersite [5, 6].
The use of a particular breakage technology is determined by the oil shale resource quality [7]. The employment of mining technologies depends directly on the mechanical properties of rock layers inside the mined seam [8]. Koitmets et al. have found total oil yield to depend on the specific oil yield of each particular layer as well [9]. Energy rating of a deposit varies by both layer and location and has a great influence on total output. Sustainability of production is directly related to energy rating. Criteria for determining energy rating have been studied earlier by Reinsalu [10]. Rein-salu and Valgma have established that production cost is remarkably influenced by the crushing method used [11]. Also, according to Reinsalu, rock quality parameters contribute a lot to price formulation [12].
The extent of environmental impacts of mining depends greatly on mine design [13]. One of the impacts is stability of the ground surface [14, 15]. Ground stability has an indirect influence on the water movement in a min-ing area [16]. In case of surface mining, stripping has been chosen as a com-promise, which takes rock properties as well as technological possibilities into account [17]. As Estonian practice shows, breakage and crushing are moving towards more precise or selective techniques [18]. This suggests that future mining technologies might be classified according to mining con-ditions [19]. Many design and technology related decisions are made based on mechanical tests as methods. Mine design, as well the use of specific mining technologies, such as rock breakage, rock crushing, screening, separating and selective extracting, depend on the mechanical properties of rock, which in turn are closely related to its content of organic matter (kerogen), limestone or clay. The mechanical properties of rock are related to its oil yield and calorific value.
Since core samples for the study were available in Jordan, appropriate methods for testing had to be chosen. Formerly potential methods have been tested in several conditions for kukersite oil shale. Point load (PL), uniaxial compressive strength (USC) and crushability (C) tests have been compared earlier for usability and the former has been found to be the most operative and feasible approach for oil shale testing in situ [20]. Point Load Test (PLT) has been applied to evaluating mine wall stability as well [21]. It has been suggested in the literature that there is a relationship between Point Load index (PLI) and USC for various rocks [11], but not for oil shale. Addi-tionally, methods like Crushing Resistance Test (CRT) could be utilised for evaluating oil shale mechanical properties. The established correlation could help determine oil shale structure more easily. Thus the main question of this study is: what are the correlation factors between the figures from available tests to enable their complex use in the planning phase of mining.
Vivika Väizene et al.
254
2. Methods
The aim of this study was to collect data to design mining and choose an appropriate crushing technology. For this purpose, laboratory tests were per-formed on samples of shale rock from central Jordan, in order to determine its physical and mechanical properties, crushability included. A conversion factor between the point load index (PLI) and uniaxial compressive strength (UCS) was determined in the interests of an efficient and cost-effective exploration [22]. A conversion factor for Jordan oil shale has not been determined before. For all rock types a generalised conversion factor with the value of 22 [23] or between 20 and 22 [24] has been used to estimate the outcome. The Point Load Test index (PLTI) was determined for rock samples obtained from the three studied drill holes, 15–30 samples from each. 34 samples from one drill hole were tested for UCS. Samples were taken sequentially to those for PLT. CRT was done on four oil shale samples, with a weight more than 5 kg each. All tests were performed using dried samples. The samples were dried to constant mass at a temperature of 105 °C for 24 hours with air circulation. 2.1. Point Load Test (PLT)
During PLT, half-core samples were compressed up to failure by applying a point load using a pair of standard-sized steel cones and then PLTI was calculated.
A digital rock strength index apparatus 45-D0550/E was used to obtain information on rock strength indexes quickly. The apparatus has a load range of 0–60 kN and its frame is adjustable to allow testing a sample up to 102 mm in diameter [23]. PLT represents one of the most popular approaches for classification of rocks. The International Society of Rock Mechanics (ISRM) has established the basic procedures for testing and calculating PLTI [25]. Following these procedures, PLTI was calculated by Heidari et al. [26].
During testing, a core or irregular block of rock sample has to be com-pressed up to failure by applying a point load by a couple of steel conical points of standard size. It is possible to operate with rock samples of different diameter and shape. PLT allows determination of the uncorrected PLT index, Is, for a rock sample. This has to be corrected to the standard equivalent diameter DE of 50 mm [27]. The procedure for size correction can be obtained graphically or mathematically as outlined in the ISRM pro-cedures. PLTI can be used for estimating other rock strength parameters. The test was carried out on half-core samples of oil shale and dolostone. First, PLT parallel to the planes of weakness was done (Fig. 1) and subsequently, PLT normal to the planes of weakness (Fig. 2) was performed on the same sample.

Interdependence between Point Load Index, Compressive Strength and Crushing Resistance...
255
Fig. 1. PLT parallel to the planes of weakness.
Fig. 2. PLT normal to the planes of weakness.
Vivika Väizene et al.
256
2.2. Uniaxial compressive strength test (UCST)
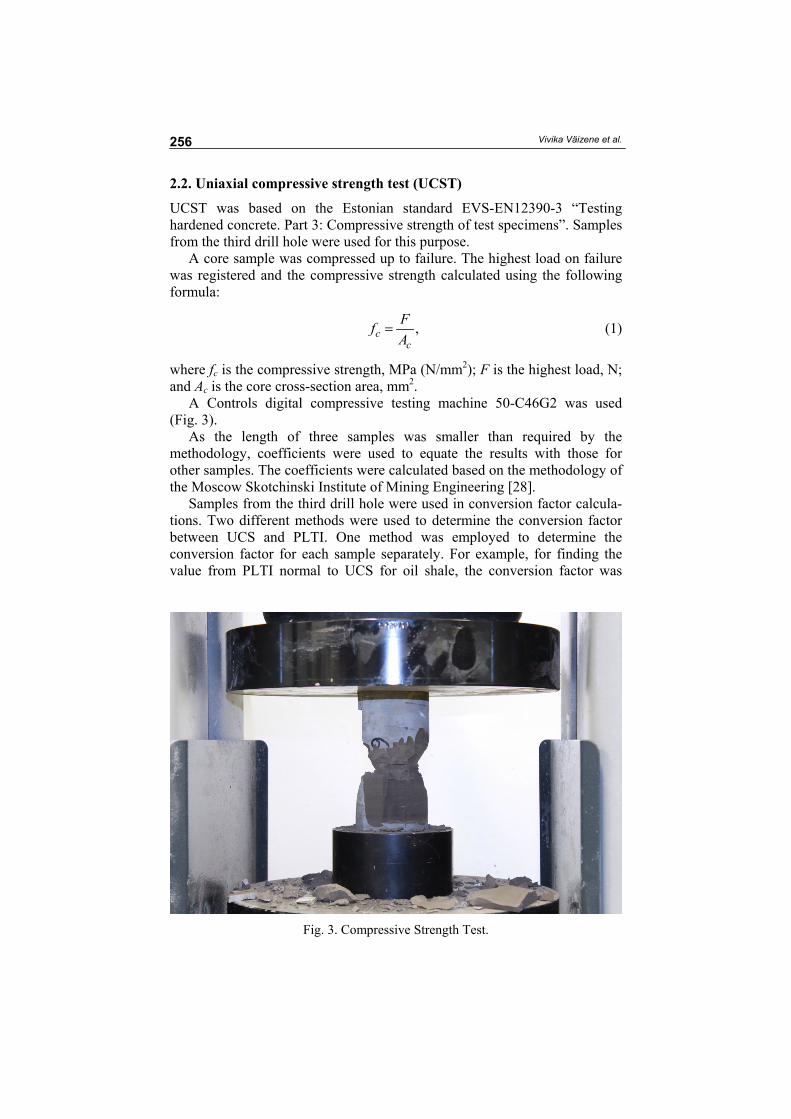
UCST was based on the Estonian standard EVS-EN12390-3 “Testing hardened concrete. Part 3: Compressive strength of test specimens”. Samples from the third drill hole were used for this purpose.
A core sample was compressed up to failure. The highest load on failure was registered and the compressive strength calculated using the following formula:
,cc
Ff
A (1)
where fc is the compressive strength, MPa (N/mm2); F is the highest load, N; and Ac is the core cross-section area, mm2.
A Controls digital compressive testing machine 50-C46G2 was used (Fig. 3).
As the length of three samples was smaller than required by the methodology, coefficients were used to equate the results with those for other samples. The coefficients were calculated based on the methodology of the Moscow Skotchinski Institute of Mining Engineering [28].
Samples from the third drill hole were used in conversion factor calcula-tions. Two different methods were used to determine the conversion factor between UCS and PLTI. One method was employed to determine the conversion factor for each sample separately. For example, for finding the value from PLTI normal to UCS for oil shale, the conversion factor was
Fig. 3. Compressive Strength Test.

Interdependence between Point Load Index, Compressive Strength and Crushing Resistance...
257
14.0 ± 5.4 with a probability of 95% (Table 1). All calculations were based on the normal (Gaussian) distribution. Both oil shale and dolostone samples were involved.
Table 1. Conversion factors with confidence limit calculated for rock samples
Oil shale Dolostone Average
conversion factor
Confidence limit
Probability, %
Average conversion
factor
Confidence limit
Probability, %
UCS/PLTI normal
14.0 5.4 95 17.0 23.0 95
UCS/PLTI parallell
36.2 16.8 95 12.2 4.7 95
PLTI normal/ PLTI parallell
2.7 1.1 95 0.8 0.8 95
normal – normal to the planes of weakness parallel – parallel to the planes of weakness
The other method consisted in determining the conversion factor by layer,
both oil shale and dolostone layers were included. Based on samples nine oil shale and two dolostone layers could to be distinguished. From layer OS9, there was only sample which was suitable for the USC test. The PLTI normal to the planes of weakness for oil shale varied from 0.9 to 2.9 MPa and average UCS values were between 10.4 and 34.4 MPa by layer (Table 2). The conversion factors of weighted average UCS values calculated for different layers are presented in Table 3. The average conversion factors calculated by layer are somewhat higher than conversion factors calculated by rock type (Tables 4 and 5).
According to Hoek, shales are classified as medium strong to strong rocks with a PLTI of 1–4 MPa and UCS 25–100 MPa [29]. In our study, the PLTI and UCS values for the tested oil shale samples were 1.9 MPa (medium strong) and 21.8 MPa (weak), respectively.
Table 2. Point Load Test index and compressive strength by layer
Layer PLTI parallel, MPa PLTI normal, MPa UCS, MPa
OS1 0.4 1.4 10.4 OS2 0.5 0.9 16.3 OS3 0.6 2.0 23.9 OS4 0.6 1.0 15.4 OS5 0.6 1.1 34.4 OS6 0.9 1.9 14.7 OS7 1.0 2.2 26.9 OS8 1.1 2.9 29.3 OS9 – – 17.2 DOL1 4.5 2.6 60.2 DOL2 4.8 4.8 53.1

Vivika Väizene et al.
258
Table 3. Point Load Test index and compressive strength by rock type
PLTI parallel,
MPa PLTI normal,
MPa UCS, MPa
OS 0.8 1.9 21.8 DOL 4.7 4.1 56.6
Table 4. Average weighted conversion factors calculated by rock type
Average conversion factor
Oil shale Dolostone
UCS/PLTI normal 11.8 13.9 UCS/PLTI parallel 28.7 12.0 PLTI normal/PLTI parallel 2.4 0.9
Table 5. Average conversion factors with confidence limit calculated by layer
Oil shale Dolostone
Layer Factor 1 Factor 2 Factor 3 Factor 1 Factor 2 Factor 3
OS1 7.3 25.6 3.5 OS2 19.0 30.4 1.6 OS3 11.9 42.4 3.6 OS4 15.1 25.4 1.7 OS5 30.9 54.1 1.8 OS6 7.9 16.6 2.1 OS7 12.2 28.0 2.3 OS8 10.0 26.9 2.7 DOL1 23.0 13.4 0.6 DOL2 11.0 11.0 1.0 Average 14.3 31.2 2.4 17.0 12.2 0.8
Factor 1 – UCS/PLTI normal Factor 2 – UCS/PLTI parallel Factor 3 – PLTI normal/PLTI parallel 2.3. Crushing Resistance Test (CRT)
Crushing energy of mineral matter is proportional to the newly formed particle surface. The specific surface of a particle is inversely proportional to its diameter. Theoretical particle size is calculated using an empirical approximating formula:
x = a/(E + p), (2)
where x is theoretical particle size, mm; E is the gross energy consumption in the test, MJ is determined from the electrical power consumption during testing; p is the imaginary energy consumption during sampling, MJ (theoretical) is the energy used for sample breaking; a is the factor

Interdependence between Point Load Index, Compressive Strength and Crushing Resistance...
259
expressing the resistance of rock to crushing (crushing index), MJ/mm = MJ*mm2/mm3.
The method of the Department of Mining of Tallinn University of Technology for determining the resistance of rock to crushing is based on measuring the reduction in its particle diameter in a sequential increase of fracture energy. Resistance of rock to crushing is characterized by the specific energy of crushing per square millimetre of a newly formed surface. The dried sample of approximately 5 kg is screened and the median of particle size is determined. Subsequently, all the material is rolled in the Los Angeles Test (LA) drum equipped with 12 steel balls (5120 to 5300 g). After a 50-revolution rolling (31–33 r/min) sieve analysis is made and the median of particle size is determined again. The process starts over, giving results of at least four sieve analyses (Table 6): one before crushing and next ones every 50-revolution cycle. Four samples of Jordan oil shale taken from different layers were tested for crushing.
Table 6. Correlation between particle size median and crushing cycle
Probe 1 Probe 2 Probe 3 Probe 4 Rolling
revolutions Median, mm
0 75 76 77 70
50 42 40 43 48
100 30 32 39 42
150 26 29 34 38
Factors a and p were calculated using the median of particle size and the
value of specific energy employed in rolling (Table 7).
Table 7. Resistance to crushing index
Factor Probe 1 Probe 2 Probe 3 Probe 4
a, MJ/mm 5.8 9.0 15.6 16.7
p, MJ 0.089 0.176 0.312 0.298
The values of the above factors are compared with the crushing resistance
of Estonian oil shale in Figures 4 and 5 [29]. Test results show that the resistance of Jordan oil shale to crushing is similar to that of Estonian oil shale. The extracting technology depends on the usability of equipment [30]. Further testing is required to determine the applicability of the selective crushing system to Jordan oil shale.

Vivika Väizene et al.
260
Fig. 4. Comparison between resistances of Attarat oil shale, kukersite and graptolite oil shale samples to crushing.
Fig. 5. Increase of resistance of different rocks to crushing and extracting with depth.
3. Results
3.1. PLT results
The average PLTI parallel and normal to the planes of weakness for different rock layers are presented in Figures 6 and 7.

Interdependence between Point Load Index, Compressive Strength and Crushing Resistance...
261
Fig. 6. Average PLTI according to depth and type of rock (drill hole 1); (OB – overburden; DOL – dolostone; OS – oil shale; GS rich OS – grainstone rich oil shale; CHERT – chert).
Fig. 7. Average PLTI according to depth and type of rock (drill hole 2); (WOS – weathered oil shale; LMS – limestone; OS – oil shale; DOL – dolostone).

Vivika Väizene et al.
262
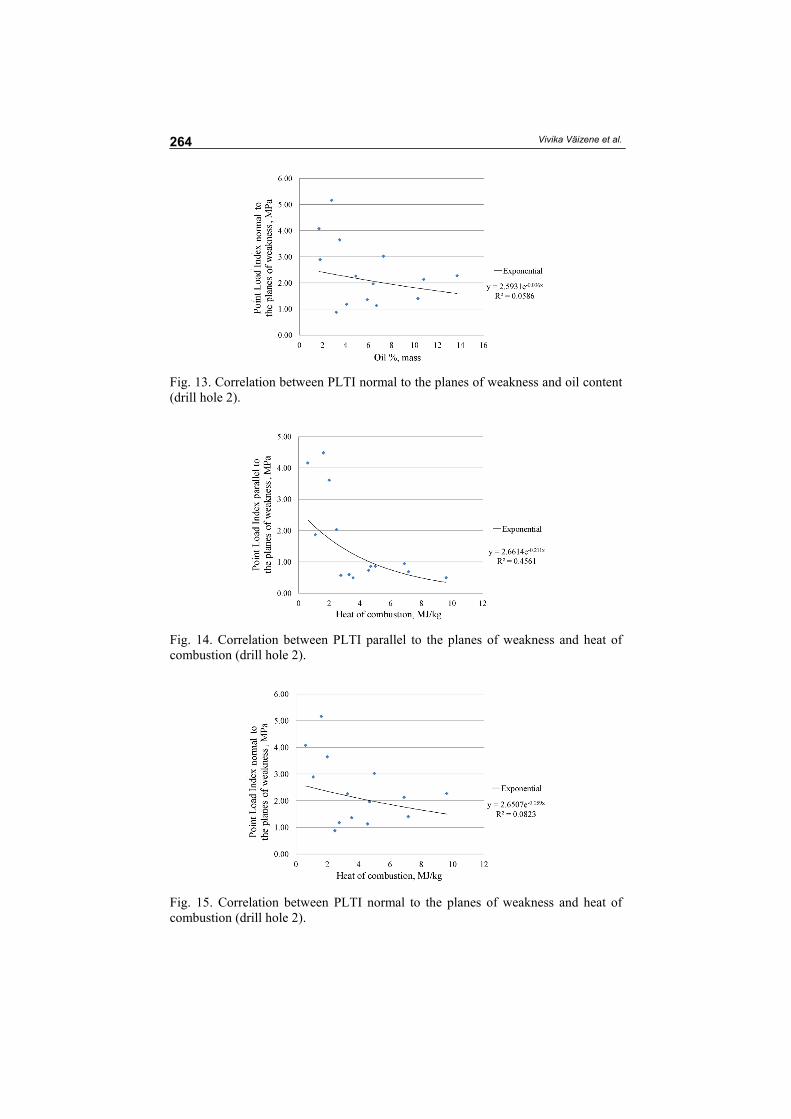
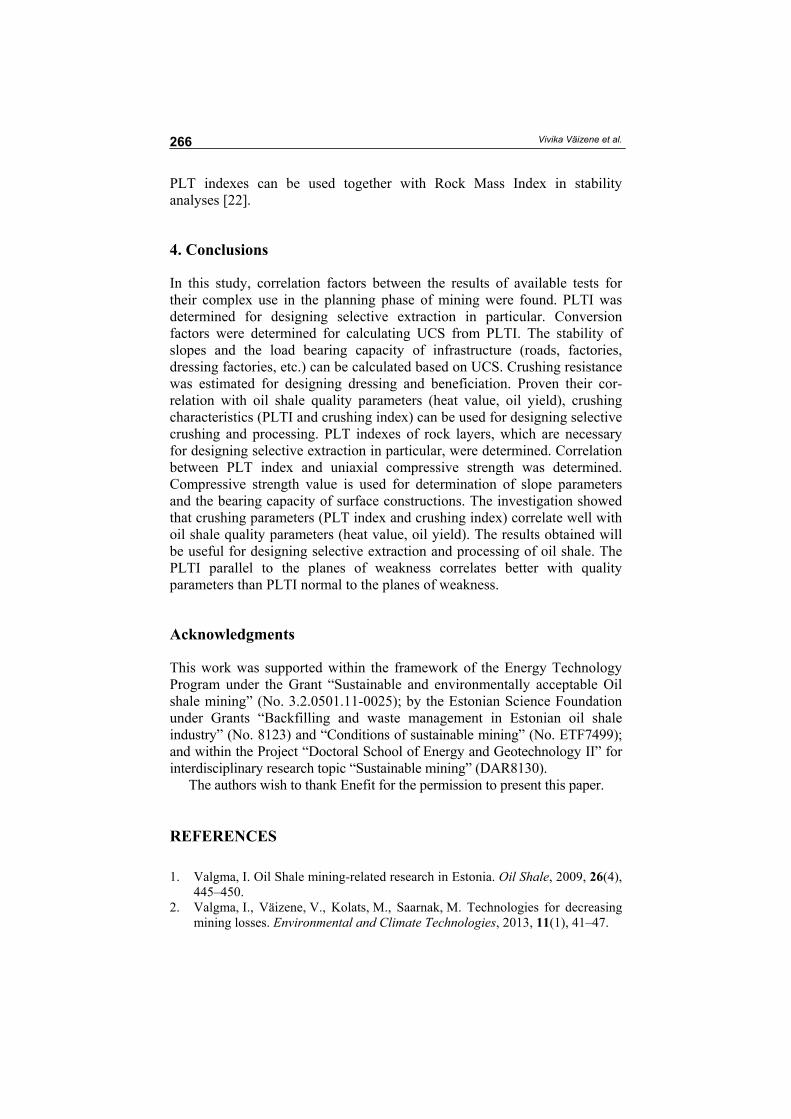
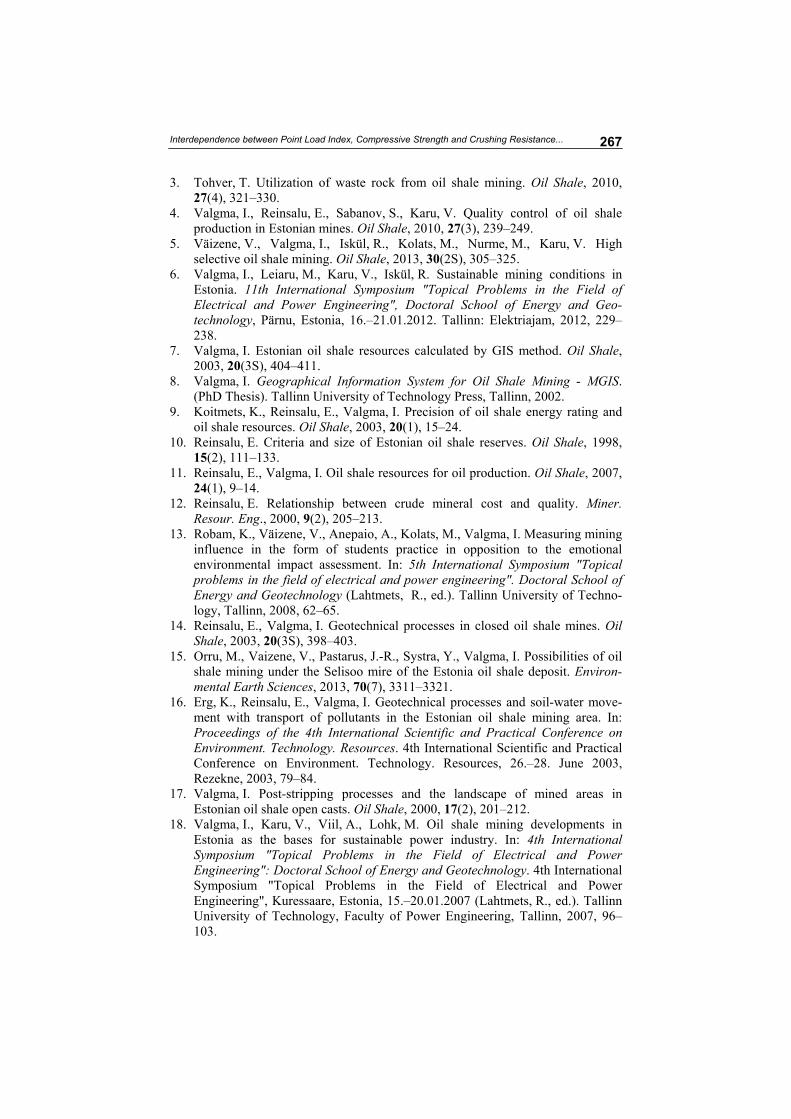
Analysis showed (Figs. 6 and 7) that the average PLTI of samples depends on the location of a drill hole and depth of layers in the oil shale deposit. This means that the layers are vertically anisotropic. For this reason, the number of drill holes and samples for the study must be increased. Only in this case can the reliability of obtained results be guaranteed [31]. Correlations between different parameters of the rocks were determined. Figure 14 shows the dependence between the PLTI and heat of combustion of rocks. As shown in Figures 8 to 15, high quality oil shale is weaker in strength. The dependence of calorific value and oil yield of oil shale on kerogen content holds true also for Estonian oil shale [32]. Hence it is recommended to use selective crushing before oil shale processing [33].
Fig. 8. Correlation between PLTI parallel to the planes of weakness and oil content (drill hole 1).
Fig. 9. Correlation between PLTI normal to the planes of weakness and oil content (drill hole 1).

Interdependence between Point Load Index, Compressive Strength and Crushing Resistance...
263
Fig. 10. Correlation between PLTI parallel to the planes of weakness and heat of combustion (drill hole 1).
Fig. 11. Correlation between PLTI normal to the planes of weakness and heat of combustion (drill hole 1).
Fig. 12. Correlation between PLTI parallel to the planes of weakness and oil content (drill hole 2).
Vivika Väizene et al.
264
Fig. 13. Correlation between PLTI normal to the planes of weakness and oil content (drill hole 2).
Fig. 14. Correlation between PLTI parallel to the planes of weakness and heat of combustion (drill hole 2).
Fig. 15. Correlation between PLTI normal to the planes of weakness and heat of combustion (drill hole 2).

Interdependence between Point Load Index, Compressive Strength and Crushing Resistance...
265
3.2. UCST results
UCS values were calculated by sample and the averages and confidence limits are presented by layer in Table 8.
Table 8. UCST results by layer
Rock type No. of tests Average compressive strength, MPa
Confidence limit
OS1 2 10.38 11.38 OS2 4 16.30 3.46 OS3 1 23.85 – OS4 5 15.40 4.51 OS5 2 34.36 19.29 OS6 4 14.71 9.34 OS7 8 26.87 6.55 OS8 5 29.34 7.71 OS9 1 17.22 –
DOL1 1 60.16 – DOL2 1 53.12 –
3.3. Conversion factor (CF)
Different conversion factors apply to rocks of different strength [34]. The conversion factor between UCS and PLTI (Factor 1 and Factor 2) was determined for oil shale and dolostone layers by using different methods. The anisotropy of resistance of oil shale and dolostone to disjointing was also determined (Factor 3).
Taking into account the confidence limit, the recommended Factor 1 for oil shale was 14 and for dolostone 17.
This factor can be used to calculate UCS when PLTI normal to the planes of weakness is known.
As drill holes are different, it is recommended to use Factor 1 when PLTI in another drill hole is known.
The recommended Factor 2 for oil shale was 33 and for dolostone 12. This factor can be used to calculate UCS when PLTI parallel to the planes
of weakness is known, for example, in core testing. The resistance of oil shale to disjointing (Factor 3) parallel to the planes
of weakness was 2.5 times smaller than that normal to the planes of weakness. This means that the Jordan oil shale is highly anisotropic. It must be taken into account by excavation and designing of slopes. The tested dolostone samples were isotropic.
PLT results correlate well with oil shale quality parameters. It is important to estimate rock quality instantly during planning. Based on the corresponding information, selective crushing or selective mining can be chosen. Other operative methods, such as employing of indentors in drill holes, could be used in the future for instant and in situ testing [35].
Vivika Väizene et al.
266
PLT indexes can be used together with Rock Mass Index in stability analyses [22].
4. Conclusions
In this study, correlation factors between the results of available tests for their complex use in the planning phase of mining were found. PLTI was determined for designing selective extraction in particular. Conversion factors were determined for calculating UCS from PLTI. The stability of slopes and the load bearing capacity of infrastructure (roads, factories, dressing factories, etc.) can be calculated based on UCS. Crushing resistance was estimated for designing dressing and beneficiation. Proven their cor-relation with oil shale quality parameters (heat value, oil yield), crushing characteristics (PLTI and crushing index) can be used for designing selective crushing and processing. PLT indexes of rock layers, which are necessary for designing selective extraction in particular, were determined. Correlation between PLT index and uniaxial compressive strength was determined. Compressive strength value is used for determination of slope parameters and the bearing capacity of surface constructions. The investigation showed that crushing parameters (PLT index and crushing index) correlate well with oil shale quality parameters (heat value, oil yield). The results obtained will be useful for designing selective extraction and processing of oil shale. The PLTI parallel to the planes of weakness correlates better with quality parameters than PLTI normal to the planes of weakness.
Acknowledgments
This work was supported within the framework of the Energy Technology Program under the Grant “Sustainable and environmentally acceptable Oil shale mining” (No. 3.2.0501.11-0025); by the Estonian Science Foundation under Grants “Backfilling and waste management in Estonian oil shale industry” (No. 8123) and “Conditions of sustainable mining” (No. ETF7499); and within the Project “Doctoral School of Energy and Geotechnology II” for interdisciplinary research topic “Sustainable mining” (DAR8130).
The authors wish to thank Enefit for the permission to present this paper.
REFERENCES
1. Valgma, I. Oil Shale mining-related research in Estonia. Oil Shale, 2009, 26(4), 445–450.
2. Valgma, I., Väizene, V., Kolats, M., Saarnak, M. Technologies for decreasing mining losses. Environmental and Climate Technologies, 2013, 11(1), 41–47.
Interdependence between Point Load Index, Compressive Strength and Crushing Resistance...
267
3. Tohver, T. Utilization of waste rock from oil shale mining. Oil Shale, 2010, 27(4), 321–330.
4. Valgma, I., Reinsalu, E., Sabanov, S., Karu, V. Quality control of oil shale production in Estonian mines. Oil Shale, 2010, 27(3), 239–249.
5. Väizene, V., Valgma, I., Iskül, R., Kolats, M., Nurme, M., Karu, V. High selective oil shale mining. Oil Shale, 2013, 30(2S), 305–325.
6. Valgma, I., Leiaru, M., Karu, V., Iskül, R. Sustainable mining conditions in Estonia. 11th International Symposium "Topical Problems in the Field of Electrical and Power Engineering", Doctoral School of Energy and Geo-technology, Pärnu, Estonia, 16.–21.01.2012. Tallinn: Elektriajam, 2012, 229–238.
7. Valgma, I. Estonian oil shale resources calculated by GIS method. Oil Shale, 2003, 20(3S), 404–411.
8. Valgma, I. Geographical Information System for Oil Shale Mining - MGIS. (PhD Thesis). Tallinn University of Technology Press, Tallinn, 2002.
9. Koitmets, K., Reinsalu, E., Valgma, I. Precision of oil shale energy rating and oil shale resources. Oil Shale, 2003, 20(1), 15–24.
10. Reinsalu, E. Criteria and size of Estonian oil shale reserves. Oil Shale, 1998, 15(2), 111–133.
11. Reinsalu, E., Valgma, I. Oil shale resources for oil production. Oil Shale, 2007, 24(1), 9–14.
12. Reinsalu, E. Relationship between crude mineral cost and quality. Miner. Resour. Eng., 2000, 9(2), 205–213.
13. Robam, K., Väizene, V., Anepaio, A., Kolats, M., Valgma, I. Measuring mining influence in the form of students practice in opposition to the emotional environmental impact assessment. In: 5th International Symposium "Topical problems in the field of electrical and power engineering". Doctoral School of Energy and Geotechnology (Lahtmets, R., ed.). Tallinn University of Techno-logy, Tallinn, 2008, 62–65.
14. Reinsalu, E., Valgma, I. Geotechnical processes in closed oil shale mines. Oil Shale, 2003, 20(3S), 398–403.
15. Orru, M., Vaizene, V., Pastarus, J.-R., Systra, Y., Valgma, I. Possibilities of oil shale mining under the Selisoo mire of the Estonia oil shale deposit. Environ-mental Earth Sciences, 2013, 70(7), 3311–3321.
16. Erg, K., Reinsalu, E., Valgma, I. Geotechnical processes and soil-water move-ment with transport of pollutants in the Estonian oil shale mining area. In: Proceedings of the 4th International Scientific and Practical Conference on Environment. Technology. Resources. 4th International Scientific and Practical Conference on Environment. Technology. Resources, 26.–28. June 2003, Rezekne, 2003, 79–84.
17. Valgma, I. Post-stripping processes and the landscape of mined areas in Estonian oil shale open casts. Oil Shale, 2000, 17(2), 201–212.
18. Valgma, I., Karu, V., Viil, A., Lohk, M. Oil shale mining developments in Estonia as the bases for sustainable power industry. In: 4th International Symposium "Topical Problems in the Field of Electrical and Power Engineering": Doctoral School of Energy and Geotechnology. 4th International Symposium "Topical Problems in the Field of Electrical and Power Engineering", Kuressaare, Estonia, 15.–20.01.2007 (Lahtmets, R., ed.). Tallinn University of Technology, Faculty of Power Engineering, Tallinn, 2007, 96–103.
Vivika Väizene et al.
268
19. Karu, V., Västrik, A., Valgma, I. Application of modelling tools in Estonian oil shale mining area. Oil Shale, 2008, 25(2S), 135–144.
20. Santi, P. M. Field methods for characterizing weak rock for engineering. Environ. Eng. Geosc., 2006, XII(1), 1–11.
21. Bell, F. G., Lindsay, P. Durability of shales of the Pietermaritzburg Formation, greater Durban area, South Africa. In: Engineering Geology and the Environ-ment: Proceedings of the 8th International Conference of the IAEG, Vancouver, British Columbia, Canada, 21–25 September, 1998 (Moore, D., Hungr, O., eds.), 1–5, 275–282.
22. Hoek, E., Diederichs, M. S. Empirical estimation of rock mass modulus. Int. J. Rock Mech. Min. Sci., 2006, 43(2), 203–215.
23. Wirtgen Surface Mining Manual. Application and Planning Guide. Wirtgen GmbH, 2010, p. 200.
24. Rusnak, J., Mark, C. Using the point load test to determine the uniaxial com-pressive strength of coal measure rock. In: Proceedings of the 19th Inter-national Conference on Ground Control in Mining, August 8–10, 2000, Morgantown, West Virginia (Peng, S. S., Mark, C., eds.). West Virginia University, Morgantown, 2000, 362–371.
25. ISRM. International Society of Rock Mechanics Commission on Testing Methods, Suggested Method for Determining Point Load Strength. Int. J. Rock Mech. Min. Sci. & Geomech. Abstr., 1985, 22, 51–60.
26. Heidari, M., Khanlari, G. R., Mehdi Torabi Kaveh, Kargarian, S. Predicting the uniaxial compressive and tensile strengths of gypsum rock by point load testing. Rock Mech. Rock Eng., 2012, 45, 265–273.
27. Digital Rock Strength Index Apparatus 45-D0550/E. Instruction Manual, 2007. 28. Methodology of Taking Samples and Determination of Physical-Mechanical
Parameters of the Rock. Skotchinski Institute of Mining Engineering, Academy of Science, Soviet Union, Moscow, 1984, p. 23 (in Russian).
29. Hoek, E. Practical Rock Engineering. Rocscience, 2007. 30. Karu, V., Västrik, A., Anepaio, A., Väizene, V., Adamson, A., Valgma, I.
Future of oil shale mining technology in Estonia. Oil Shale, 2008, 25(2S), 125–134.
31. Taylor, J. R. An Introduction to Error Analysis: The Study of Uncertainties in Physical Measurements (Commins, E. D., ed.). University Science Books, Sausalito, California, 1982, 272 pp.
32. Väli, E., Valgma, I., Reinsalu, E. Usage of Estonian oil shale. Oil Shale, 2008, 25(2S), 101–114.
33. Haabu, T. Evaluation of Selective Crushing. Master Thesis. TUT Department of Mining, Tallinn, 2010.
34. Cobanoglu, I., Celik, S. B. Estimation of uniaxial compressive strength from point load strength, Schmidt hardness and P-wave velocity. Bull Eng Geol Environ, 2008, 67(4), 491–498.
35. Unrug, K. F. Characterization of rock strength and jointing in situ. In: Rock Mechanics for Industry: Proceedings of the 37th U.S. Rock Mechanics Symposium, Vail, Colorado, USA, 6–9 June 1999 (Amadei, B., Kranz. R. L., Scott, G. A., Smeallie, P. H., eds.), 1–2, 999–1006.
Received August 7, 2014