Intercos Europe S.p.A.web.intercos.it/bond/files/fin/Intercos Europe SpA - Financial... · Intercos...
61
Intercos Europe S.p.A. (sole shareholder) Registered Office in Milan – Via S. Tecla 3 Share capital Euros 3,000,000 paid-in Milan REA Register No. 1125524 Direction and coordination by INTERCOS S.p.A. Register of Companies and Tax Code No. 00712410190 SEPARATE FINANCIAL STATEMENTS AT DECEMBER 31, 2012 PREPARED IN CONFORMITY WITH IFRS ADOPTED BY THE EUROPEAN UNION
Transcript of Intercos Europe S.p.A.web.intercos.it/bond/files/fin/Intercos Europe SpA - Financial... · Intercos...

Intercos Europe S.p.A. (sole shareholder)
Registered Office in Milan – Via S. Tecla 3
Share capital Euros 3,000,000 paid-in
Milan REA Register No. 1125524
Direction and coordination by INTERCOS S.p.A.
Register of Companies and Tax Code No. 00712410190
SEPARATE FINANCIAL STATEMENTS
AT DECEMBER 31, 2012
PREPARED IN CONFORMITY WITH IFRS
ADOPTED BY THE EUROPEAN UNION

PricewaterhouseCoopers SpA
Sede legale e amministrativa: Milano 20149 Via Monte Rosa 91 Tel. 0277851 Fax 027785240 Cap. Soc. Euro 6.812.000,00 i.v., C .F. e P.IVA eReg. Imp. Milano 12979880155 Iscritta al n° 119644 del Registro dei Revisori Legali - Altri Uffici: Ancona 60131 Via Sandro Totti 1 Tel.0712132311 - Bari 70124 Via Don Luigi Guanella 17 Tel. 0805640211 - Bologna Zola Predosa 40069 Via Tevere 18 Tel. 0516186211 - Brescia25123 Via Borgo Pietro Wuhrer 23 Tel. 0303697501 - Catania 95129 Corso Italia 302 Tel. 0957532311 - Firenze 50121 Viale Gramsci 15 Tel.0552482811 - Genova 16121 Piazza Dante 7 Tel. 01029041 - Napoli 80121 Piazza dei Martiri 58 Tel. 08136181 - Padova 35138 Via Vicenza 4Tel. 049873481 - Palermo 90141 Via Marchese Ugo 60 Tel. 091349737 - Parma 43100 Viale Tanara 20/A Tel. 0521275911 - Roma 00154Largo Fochetti 29 Tel. 06570251 - Torino 10122 Corso Palestro 10 Tel. 011556771 - Trento 38122 Via Grazioli 73 Tel. 0461237004 - Treviso31100 Viale Felissent 90 Tel. 0422696911 - Trieste 34125 Via Cesare Battisti 18 Tel. 0403480781 - Udine 33100 Via Poscolle 43 Tel.043225789 - Verona 37135 Via Francia 21/C Tel.0458263001
www.pwc.com/it
AUDITORS’ REPORT IN ACCORDANCE WITH ARTICLE 14 OF LEGISLATIVE DECREENO. 39 OF 27 JANUARY 2010
To the shareholder ofIntercos Europe SpA
1. We have audited the separate financial statements of Intercos Europe SpA as of 31 December2012 which comprise the statement of financial position, separate income statement,statement of comprehensive income, statement of changes in equity, statement of cash flowsand related notes. The directors of Intercos Europe SpA are responsible for the preparation ofthese financial statements in compliance with the International Financial Reporting Standardsas adopted by the European Union. Our responsibility is to express an opinion on theseseparate financial statements based on our audit.
2. We conducted our audit in accordance with the auditing standards and criteria recommendedby Consob, the Italian Commission for listed Companies and the Stock Exchange. Thosestandards and criteria require that we plan and perform the audit to obtain the necessaryassurance about whether the separate financial statements are free of material misstatementand, taken as a whole, are presented fairly. An audit includes examining, on a test basis,evidence supporting the amounts and disclosures in the financial statements. An audit alsoincludes assessing the accounting principles used and significant estimates made by thedirectors. We believe that our audit provides a reasonable basis for our opinion.
The separate financial statements present, for comparative purposes, the financial statementsof the previous year prepared applying the same accounting principles. Furthermore, thedisclosure note nr. 6 discloses the effects of the transition to the International FinancialReporting Standards as adopted by the European Union. The disclosure reported in the abovementioned note has been analyzed by us for the purpose of issuing an opinion on the separatefinancial statements as of 31 December 2012.
3. In our opinion, the separate financial statements of Intercos Europe SpA as of 31 December2012 comply with the International Financial Reporting Standards as adopted by theEuropean Union; accordingly, they have been prepared clearly and give a true and fair view ofthe financial position, result of operations and cash flows of Intercos Europe SpA for theperiod then ended.

2 of 3
4. Without qualifying our opinion, we draw your attention to the fact that the company hasexercised the option provided for by law and by paragraph 10 of IAS 27 not to prepare theconsolidated financial statements, despite controlling investments held during the year, as theparent company Intercos SpA is required to prepare the consolidated financial statements.Italian language copy of the consolidated financial statements of the parent, the reports onoperations and the report of the control body will be made public in accordance with law.
5. The directors of Intercos Europe SpA are responsible for the preparation of a report onoperations in compliance with the applicable laws. Our responsibility is to express an opinionon the consistency of the report on operations with the financial statements, as required bylaw. For this purpose, we have performed the procedures required under Italian AuditingStandard No. 001 issued by the Italian Accounting Profession (Consiglio Nazionale dei DottoriCommercialisti e degli Esperti Contabili) and recommended by Consob. In our opinion, thereport on operations is consistent with the consolidated financial statements of IntercosEurope SpA as of 31 December 2012.
Milan, 19 April 2013
PricewaterhouseCoopers SpA
Signed byGiovanni Andrea Toselli(Partner)
This report has been translated into the English language from the original, which was issued inItalian, solely for the convenience of international readers.We have not examined the translation of the financial statements referred to in this report.

1
Intercos Europe S.p.A. (sole shareholder)
Registered office in Milan - Via Santa Tecla 3
Share capital Euros 3,000,000 paid in
Milan REA Register No. 1125524
Direction and coordination by INTERCOS S.p.A.
Register of Companies and Tax Code No. 00712410190
Separate Financial Statements at December 31, 2012
REPORT ON OPERATIONS
To the Shareholders,
The year 2012 closed with a profit of Euros 7,505,926 in a backdrop of good growth in terms of both orders and sales for Intercos Europe S.p.A. in all the geographic areas and business lines, thanks to
advances in the reference markets, the globalization of the supply chain and our strategy of continuous
innovation. Even though the recession in Mediterranean countries, the slow recovery of the American economy and uncertainties about growth in emerging nations conditioned the development of the cosmetics
markets, the Company was able to expand in Europe, with a sharp gain in the Private Label and cosmetic pencil segment.
Below is an analysis of the general economic and sector performance in 2012, projects completed in 2012 and economic performance for the year.
General Economic and Sector Performance in 2012
In 2012 the slowdown in the growth of the global economy continued, settling at about 3%, highlighting
different trends in different geographical areas, in a context of lower inflation in Western countries but also
difficulties in handling public debt in Europe and a reduction in the prices of non-petroleum raw materials. Whereas, in Eastern Asia, both the aim of achieving socio-geographic equilibrium and the global economic
context led to a slowing of high growth rates, in the United States, consolidation of growth was still sustained by vigorous expansive fiscal and monetary policies, the consequences of which, in terms of
bringing the public debt under control, may prove difficult to solve in years to come. A case apart is Japan,
which also implemented an expansive monetary policy, despite the sizeable public deficit accumulated. Overall, the Eurozone recorded a slight decline despite the positive trend of its strongest member, Germany,
which benefited simultaneously from the particularly low cost of refinancing its debt and the weakness of the euro, which improved the balance of trade. In fact, the financial crisis prevailing in peripheral countries
strongly influenced the economic cycle and it was only thanks to the measures adopted by the ECB in the
last quarter that there were the first signs of a renewed propensity to risk on the part of investors. As far as Italy is concerned, the contraction of GDP was significant: although, on the one hand, the drastic
measures taken to improve the economy led to a fundamental improvement in the spread between Italian and German debt, on the other, it had a significant and adverse effect on consumption. In the last twelve months, almost all of the economic sectors have been affected by the economic crisis;
however, companies that manufacture luxury goods, including cosmetics, seem to remain immune. The
global market of personal luxury goods increased by 10.4% in 2012 and an even higher increase, between 6-7%, is expected over the next two years.

2
Reasons behind this trend include the fact that the growth of GDP in emerging countries continues to be
steady, resulting in the appearance of new medium-high income classes which try to consolidate their new
status through consumption. One of the countries in which the luxury goods market is expanding rapidly is China, at an average annual rate of 30%. In this context, Europe continues to be the main global market,
where successful companies concentrate, on the one hand, on promoting, within their brand, factors such as tradition, craft skills, and genuine values to encourage global consumers to be loyal to the brand and
whatever makes them feel part of a broader system of positive values. On the other, there is a need to
create value through greater efficiency, greater cost control, and the optimization of the production chain while keeping quality high, and identifying new distribution strategies.
Programs and Projects completed in 2012
There follows a brief description of the programs and projects completed in 2012:
Following the resolution passed by the Board of Directors on October 3, 2011, as part of the operations
for the reorganization of the Company, during the year ended December 31, 2012 Intercos Europe
finalized the sale of its 100% investment held in Interfila Shanghai Co. Ltd. to the parent, Intercos S.p.A.
The sales price was equal to the carrying amount of the investment of Euros 2.7 million.
During the year, the industrialization and commercialization activities of Prisma Shine products, the
Intercos Group’s revolutionary and exclusive technology, were consolidated. This factor contributed
decisively to increasing the sales of Intercos Europe, where Prisma products registered an increase of 103% to approximately Euro 13.9 million, thus confirming the success of the investments and the
efforts made by the Group.
During 2012, a process to review the control model of the Intercos Group, which will affect Intercos
Europe, was undertaken and partly completed. This plan will allow greater transparency to be acquired
with regard to the cost of the product and will also make it possible to generate reporting on the consolidated sales of the Group, with details of various analysis parameters such as customer, brand,
product category, area of sale, kind of service, and so on.
Comparison of the Statement of Comprehensive Income and Statement of Financial Position 2012-2011
For purposes of comparison with the results of the previous year, account should be taken of the fact that
the Company’s income statement for the year 2011 included all the revenues and costs associated with the manufacturing and marketing processes of the typical operating activities of Intercos Europe S.p.A. only
starting from the fourth quarter of the year - subsequent to the acquisition of the business segment on
October 1, 2011. In addition, the financial statements of Intercos Europe S.p.A. at December 31, 2012 have been prepared
for the first time in accordance with International Financial Reporting Standards issued by the International Accounting Standards Board and adopted by the European Union, including all Interpretations of the
International Financial Reporting Interpretation Committee (hereinafter “EU IFRS”).
International Financial Reporting Standards IAS/IFRS have been applied in the preparation of the financial
statements for the year ended December 31, 2012 (date of the financial statements), in the comparative data at December 31, 2011 or for the year then ended presented in those statements, and in the
preparation of the opening IFRS financial statements at January 1, 2011.
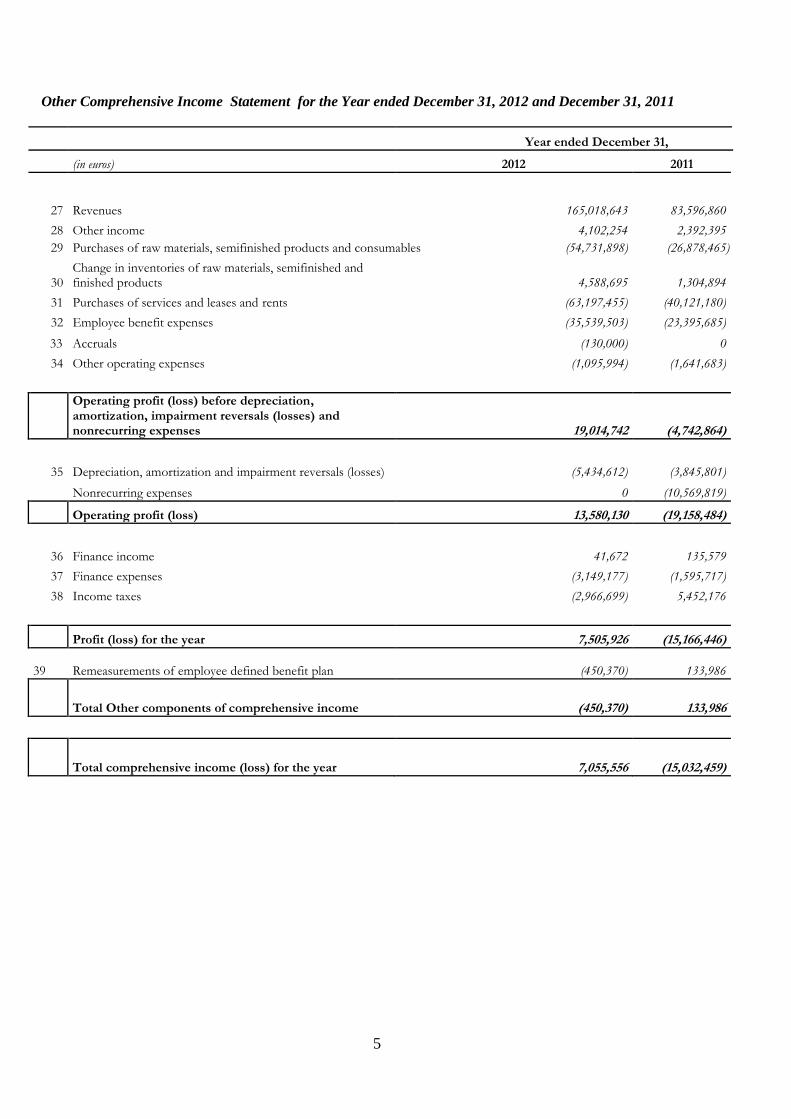
The statements of comprehensive income for the years 2012 and 2011 are presented below:

3
Year ended December 31,
(in euros) 2012 2011
Revenues 165,018,643 83,596,860
Other income 4,102,254 2,392,395
Purchases of raw materials, semifinished products and consumables (54,731,898) (26,878,465)
Change in inventories of raw materials, semifinished and finished products 4,588,695 1,304,894
Purchases of services and leases and rents (63,197,455) (40,121,180)
Employee benefit expenses (35,539,503) (23,395,685)
Accruals (130,000) 0
Other operating expenses (1,095,994) (1,641,683)
Operating profit (loss) before depreciation, amortization, impairment reversals (losses) and nonrecurring expenses 19,014,742 (4,742,864)
Depreciation, amortization and impairment reversals (losses) (5,434,612) (3,845,801)
Nonrecurring expenses 0 (10,569,819)
Operating profit (loss) 13,580,130 (19,158,484)
Finance income 41,672 135,579
Finance expenses (3,149,177) (1,595,717)
Income taxes (2,966,699) 5,452,176
Profit (loss) for the year 7,505,926 (15,166,446)
Remeasurements of employee defined benefit plan (450,370) 133,986
Total Other components of comprehensive income (450,370) 133,986
Total comprehensive income (loss) for the year 7,055,556 (15,032,459)
2012 Economic and Financial Review
Revenues amount to Euros 165,019 thousand compared to Euros 83,597 thousand in 2011. Revenues by geographic area show a notably different breakdown compared to the prior year and are analyzed in the
following table.

4
(Amounts in thousands of euros)
AREA 2012 2011
ITALY 20,795 13% 26,666 32%
U.S.A. 61,312 37% 26,908 32%
FRANCE 42,227 26% 12,028 14%
EMEA (excluding France) 36,402 22% 16,944 20%
ASIA 4,283 3% 1,051 1%
TOTAL 165,019 100.00% 83,597 100.00%
N.B. EMEA = Europe, Middle East and Africa.
Purchases of services and leases and rents stand at Euros 63,197 thousand for the year (compared to
Euros 40,121 thousand in 2011) and are 38.3% as a percentage of sales; such percentage is considerably
lower than the 49.9% last year.
Employee benefit expenses in 2012 are Euros 35,540 thousand, of which Euros 5,724 thousand relates to temp work, and are 21.5% as a percentage of sales. The substantial percentage improvement from 27.8%
last year is due to the improved corporate structure following the reorganization which took place on October
1, 2011.
Operating profit before depreciation, amortization, impairment reversals (losses) and nonrecurring expenses is Euros 19,014 thousand. The margin is 11.5%, thus confirming the decision
taken by Intercos Europe to consolidate European manufacturing and sales operations in order to take
advantage of possible synergies.
From a financial standpoint, net debt with third parties at December 31, 2012 totals Euros 32,520 thousand, highlighting a significant improvement over the balance at December 31, 2011 thanks to positive
cash flows generated.
Net working capital at the end of the year is Euros 12,036 thousand, and 7.3% as a percentage of
revenues. This is a significant improvement over the prior year owing to more effective management of trade receivables and payables which led to a benefit, respectively, of Euros 11,427 thousand and Euros 3,697
thousand. Inventories instead increased by Euros 4,588 thousand.
2012 2011
Inventories 36,622 32,034
Trade receivables 31,318 42,745
Other current assets 2,796 3,798
70,736 78,577
Trade payables (53,428) (49,731)
Other current payables (5,272) (3,843)
(58,700) (53,574)
NET WORKING CAPITAL 12,036 25,003
As a % of Revenues 7.3% 30%

5
Reclassified Operational Statement of Financial Position
2012 2011 2012 2011
Operating net invested capital
Net capital 17,535 10,479
Fixed assets 40,519 40,688 Net working capital 12,036 25,003 Provisions (203) (100) Employee benefit obligations (5,106) (4,606)
Total 47,246 60,985
Non-operating net invested capital
Financial liabilities
medium/long-term 35,127 35,200
Financial assets 0 0 Liquidity 16,902 3,286 Non-operating provisions (taxes) 2,809 6,129
Total 19,711 9,415
Financial liabilities
short-term 14,295 24,721
Total invested capital 66,957 70,400 Total capital financed 66,957 70,400
Fixed assets: (+) property, plant and equipment, intangible assets and financial assets (+) goodwill (+) other non-current assets
Net working capital: (+) inventories, (+) trade receivables, (+) other current assets, (-) trade payables, (-) other payables
Provisions: (-) provisions
Employee benefit obligations: (-) employee benefit obligations
Financial assets: (+) other non-current financial assets (+) loans receivable Liquidity: (+) cash and cash equivalents
Non-operating provisions (taxes): (+) deferred tax assets (-) deferred tax liabilities
Net capital: (+) equity
Financial liabilities medium/long-term: (+) borrowings from banks and other lenders
Financial liabilities short-term: (+) borrowings from banks and other lenders, current
Some important profit and financial and balance sheet ratios compared to the prior year are listed below:
Profit and financial ratios 2012 2011 EBIT (Operating profit)/000 13,580 (19,158) EBITDA (Operating profit (loss) before depreciation,
amortization, impairment reversals (losses) and nonrecurring expenses)/000
19,014 (4,742)
EBITDA margin % EBITDA/Revenues 11.50% (5.67%)
Finance exp. ratio Finance expenses/Revenues 1.90% 1.90%
Further information is provided in the Notes.
Capital expenditures in property, plant and equipment and intangible assets
Capital expenditures in property, plant and equipment in 2012 amounted to Euros 5,014 thousand and mainly referred to production plant and machinery, equipment and molds.
Capital expenditures in intangible assets in 2012 primarily relate to software development and totaled
Euros 2 thousand.
6
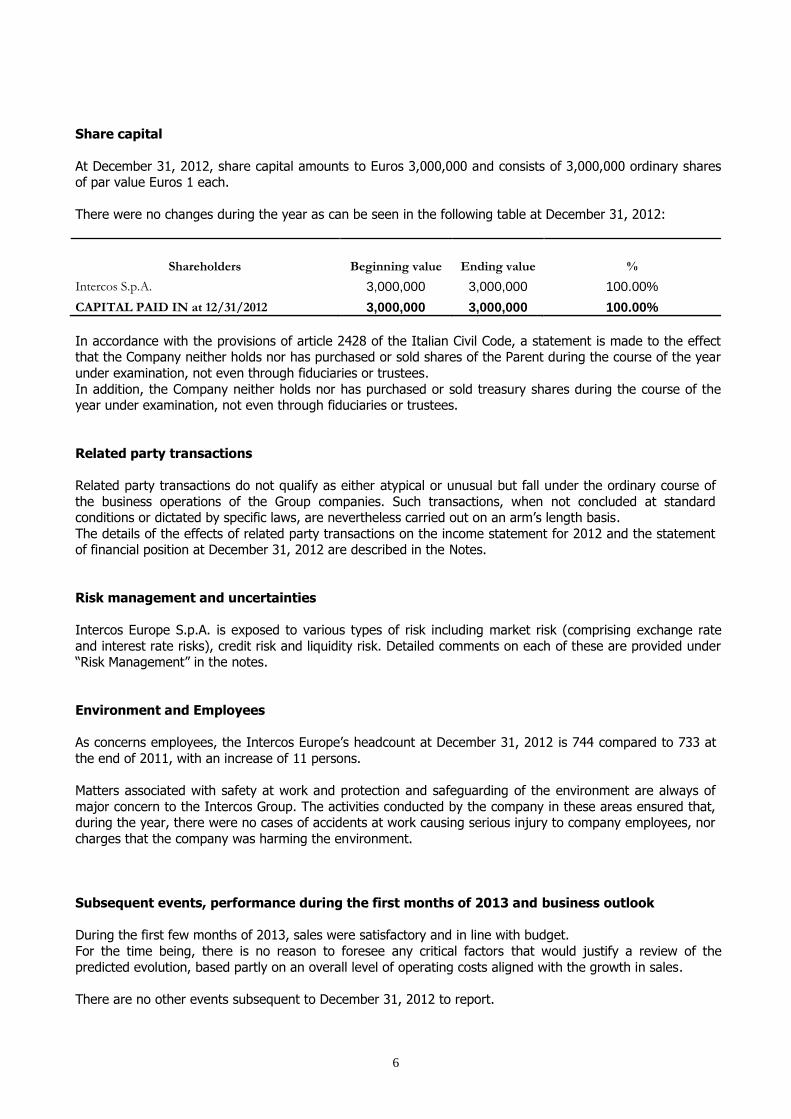
Share capital
At December 31, 2012, share capital amounts to Euros 3,000,000 and consists of 3,000,000 ordinary shares of par value Euros 1 each.
There were no changes during the year as can be seen in the following table at December 31, 2012:
Shareholders Beginning value Ending value %
Intercos S.p.A. 3,000,000 3,000,000 100.00%
CAPITAL PAID IN at 12/31/2012 3,000,000 3,000,000 100.00%
In accordance with the provisions of article 2428 of the Italian Civil Code, a statement is made to the effect that the Company neither holds nor has purchased or sold shares of the Parent during the course of the year
under examination, not even through fiduciaries or trustees.
In addition, the Company neither holds nor has purchased or sold treasury shares during the course of the year under examination, not even through fiduciaries or trustees.
Related party transactions
Related party transactions do not qualify as either atypical or unusual but fall under the ordinary course of
the business operations of the Group companies. Such transactions, when not concluded at standard conditions or dictated by specific laws, are nevertheless carried out on an arm’s length basis.
The details of the effects of related party transactions on the income statement for 2012 and the statement of financial position at December 31, 2012 are described in the Notes.
Risk management and uncertainties
Intercos Europe S.p.A. is exposed to various types of risk including market risk (comprising exchange rate
and interest rate risks), credit risk and liquidity risk. Detailed comments on each of these are provided under “Risk Management” in the notes.
Environment and Employees
As concerns employees, the Intercos Europe’s headcount at December 31, 2012 is 744 compared to 733 at
the end of 2011, with an increase of 11 persons.
Matters associated with safety at work and protection and safeguarding of the environment are always of
major concern to the Intercos Group. The activities conducted by the company in these areas ensured that, during the year, there were no cases of accidents at work causing serious injury to company employees, nor
charges that the company was harming the environment.
Subsequent events, performance during the first months of 2013 and business outlook
During the first few months of 2013, sales were satisfactory and in line with budget.
For the time being, there is no reason to foresee any critical factors that would justify a review of the
predicted evolution, based partly on an overall level of operating costs aligned with the growth in sales.
There are no other events subsequent to December 31, 2012 to report.

7
Appropriation of the profit for the year
To the Shareholders,
We ask you to approve the Directors’ Report on Operations for the year 2012 and the financial statements for the year ended December 31, 2012 as submitted to you, resolving on the manner of appropriating the profit
for the year of Euros 7,505,926 as follows:
Euros 488,860 to the Legal reserve
Euros 8,231 to the Revaluation reserve Euros 4,008,835 to the Extraordinary reserve
and also resolving on the payment of dividends of Euros 3,000,000 to Intercos S.p.A.
Milan, April 10, 2013
INTERCOS EUROPE S.p.A.
On behalf of the Board of Directors
___________________________

2
Boards and Independent Auditors
BOARD OF DIRECTORS
Name Post
Dario Gianandrea Ferrari Chairman and CEO
Paolo Valsecchi Director
Martin Breuer Director
Matteo Milani Director
Gianandrea Ferrari Director
BOARD OF STATUTORY AUDITORS
Name Post
Mario Valenti Chairman
Riccardo Foglia Taverna Standing statutory auditor
Giuseppe Moretti Standing statutory auditor
Marino Marrazza Alternate statutory auditor
Pierluigi Bottinelli Alternate statutory auditor
INDEPENDENT AUDITORS
PricewaterhouseCoopers S.p.A.

3
Statement of Financial Position at December 31, 2012 and December 31, 2011
At December 31,
(in euros) 2012 2011
ASSETS
NON-CURRENT ASSETS
7 Property, plant and equipment 16,976,639 17,280,661
8 Intangible assets 147,115 329,057
9 Goodwill 20,300,000 20,300,000
10 Investments in subsidiaries 0 2,738,082
11 Deferred tax assets 3,400,180 7,049,692
12 Other non-current receivables 3,094,929 42,816
Non-current assets 43,918,863 47,740,308
CURRENT ASSETS
13 Inventories 36,622,416 32,033,722
14 Trade receivables 31,317,923 42,744,889
15 Taxes receivable 1,054,373 3,592,874
16 Other current assets 1,741,655 204,545
17 Cash and cash equivalents 16,901,564 3,286,076
Current assets 87,637,931 81,862,105
TOTAL ASSETS 131,556,994 129,602.413

4
At December 31,
(in euros) 2012 2011
EQUITY
Share capital 3,000,000 3,000,000
Legal reserve 111,140 111,140
Other reserves 5,231,813 21,776,337
Retained earnings (Accumulated losses) 9,192,111 (14,408,086)
18 TOTAL EQUITY 17,535,064 10,479,391
LIABILITIES
NON-CURRENT LIABILITIES
19 Borrowings from banks and other lenders 35,126,822 35,200,471
20 Provisions 203,347 100,000
21 Deferred tax liabilities 590,819 920,854
22 Employee benefit obligations 5,106,025 4,606,303
Non-current liabilities 41,027,013 40,827,628
CURRENT LIABILITIES
23 Borrowings from banks and other lenders 162,052 19,791804 24 Loans payable to Group companies - short-term 14,133,247 4,929,000
25 Trade payables 53,427,605 49,731,304
26 Other payables 5,272,012 3,843,286
Current liabilities 72,994,916 78,295,394
TOTAL EQUITY AND LIABILITIES 131,556,994 129,602,413
5
Other Comprehensive Income Statement for the Year ended December 31, 2012 and December 31, 2011
Year ended December 31,
(in euros) 2012 2011
27 Revenues 165,018,643 83,596,860
28 Other income 4,102,254 2,392,395
29 Purchases of raw materials, semifinished products and consumables (54,731,898) (26,878,465)
30 Change in inventories of raw materials, semifinished and finished products 4,588,695 1,304,894
31 Purchases of services and leases and rents (63,197,455) (40,121,180)
32 Employee benefit expenses (35,539,503) (23,395,685)
33 Accruals (130,000) 0
34 Other operating expenses (1,095,994) (1,641,683)
Operating profit (loss) before depreciation, amortization, impairment reversals (losses) and nonrecurring expenses 19,014,742 (4,742,864)
35 Depreciation, amortization and impairment reversals (losses) (5,434,612) (3,845,801)
Nonrecurring expenses 0 (10,569,819)
Operating profit (loss) 13,580,130 (19,158,484)
36 Finance income 41,672 135,579
37 Finance expenses (3,149,177) (1,595,717)
38 Income taxes (2,966,699) 5,452,176
Profit (loss) for the year 7,505,926 (15,166,446)
39
Remeasurements of employee defined benefit plan (450,370) 133,986
Total Other components of comprehensive income (450,370) 133,986
Total comprehensive income (loss) for the year 7,055,556 (15,032,459)

6
Statement of Cash Flows for the Years ended December 31, 2012 and December 31, 2011
Year ended December 31,
(in thousands of euros) 2012 2011
Cash and cash equivalents at beginning of the year 3,286 2
Cash flows from operating activities
Profit (Loss) for the year 7,506 (16,859)
Depreciation, amortization and impairment reversals/losses 5,435 5,436
Extraordinary expenses 0 10,570
Impairment of investments 0
Net change in employee severance indemnities 500 (443)
Change in provisions 103 (107)
Change in deferred income taxes 3,319 (116)
(Gains) losses on disposal of fixed assets (12) (50)
Change in working capital:
Inventories (4,589) (1,891)
Trade receivables 11,404 23,396
Other assets (2,051) (7,152)
Trade payables 3,696 (15,512)
Other liabilities 1,429 6,812
Total 26,741 4,084
Cash flows used in investing activities
Acquisitions of:
. Intangible assets (2) (437)
. Property, plant and equipment (4,912) (2,802)
. Investments 2,738
Total investments in intangible assets, property, plant and
equipment and equity investments (2,176) (3,239)
Total (2,176) (3,239)
Cash flows from (used in) financing activities
Change in share capital and reserves (450) 0
Change in bank borrowings (19,704) 3,919
Change in receivables
Change in financial payables 9,204 (2,925)
Total (10,949) 994
Cash flows during the year 13,616 1,839
Cash and banks from merger - 1,450
Cash and cash equivalents at end of the year 16,902 3,289
7
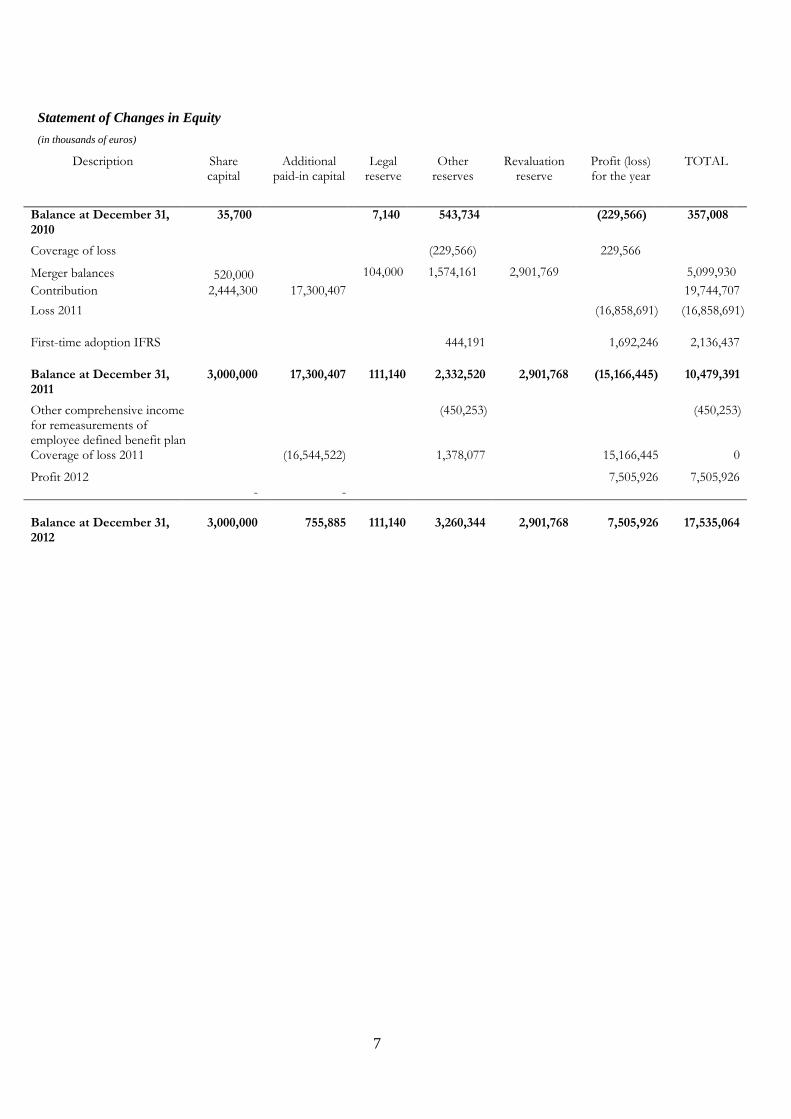
Statement of Changes in Equity
(in thousands of euros)
Description Share capital
Additional paid-in capital
Legal reserve
Other reserves
Revaluation reserve
Profit (loss) for the year
TOTAL
Balance at December 31, 2010
35,700 7,140 543,734 (229,566) 357,008
Coverage of loss (229,566) 229,566
Merger balances
520,000 104,000 1,574,161 2,901,769 5,099,930
Contribution 2,444,300 17,300,407 19,744,707
Loss 2011 (16,858,691) (16,858,691)
First-time adoption IFRS 444,191 1,692,246 2,136,437
Balance at December 31, 2011
3,000,000 17,300,407 111,140 2,332,520 2,901,768 (15,166,445) 10,479,391
Other comprehensive income for remeasurements of employee defined benefit plan
(450,253) (450,253)
Coverage of loss 2011 (16,544,522) 1,378,077 15,166,445 0
Profit 2012 -
-
7,505,926 7,505,926
Balance at December 31, 2012
3,000,000
755,885
111,140
3,260,344
2,901,768
7,505,926
17,535,064

8
NOTES TO THE SEPARATE FINANCIAL STATEMENTS
1. GENERAL INFORMATION
Intercos Europe S.p.A (formerly Color Cosmetics S.r.l.) is a corporation organized under the laws of the Republic
of Italy. It was set up on December 22, 1982 and has its registered office in Milan, at Via Santa Tecla 3. During the
course of 2011 Intercos Europe S.p.A. was involved in certain reorganization operations.
The Company took advantage of the right allowed by paragraph 10 of IAS 27 and did not prepare consolidated
financial statements, even though it held controlling investments during the year, as it is controlled by Intercos
S.p.A., which is required to draw up consolidated financial statements. A copy of the Italian language consolidated
financial statements of the parent, the report on operations and the report by the statutory auditors will be rendered
public pursuant to law.
Significant transactions during the year ended December 31, 2012
Following the resolution passed by the board of directors on October 3, 2011, as part of the operations for the
reorganization of the Company, during the year ended December 31, 2012 Intercos Europe finalized the sale of its
100% investment held in Interfila Shanghai Co. Ltd. to the parent, Intercos S.p.A., at its carrying amount of Euros
2.7 million.
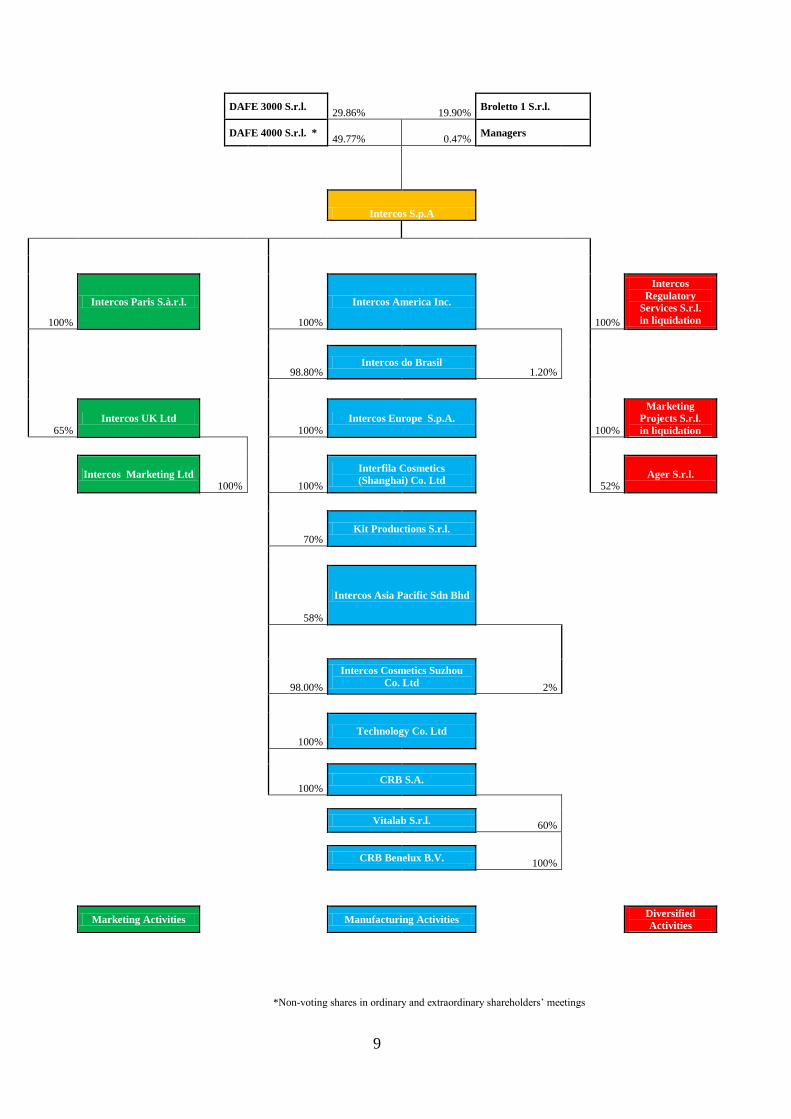
At the date of the preparation of the financial statements, the Company’s business is carried out through the
following Group companies:
9
DAFE 3000 S.r.l.
29.86% 19.90% Broletto 1 S.r.l.
DAFE 4000 S.r.l. *
49.77% 0.47% Managers
100
Intercos S.p.A
100%
Intercos Paris S.à.r.l.
100%
Intercos America Inc.
100%
Intercos
Regulatory
Services S.r.l.
in liquidation
98.80% Intercos do Brasil
1.20%
65% Intercos UK Ltd
100% Intercos Europe S.p.A.
100%
Marketing
Projects S.r.l.
in liquidation
Intercos Marketing Ltd
100% 100%
Interfila Cosmetics
(Shanghai) Co. Ltd 52% Ager S.r.l.
70% Kit Productions S.r.l.
58%
Intercos Asia Pacific Sdn Bhd
98.00%
Intercos Cosmetics Suzhou
Co. Ltd 2%
100% Technology Co. Ltd
100% CRB S.A.
Vitalab S.r.l. 60%
CRB Benelux B.V.
100%
Marketing Activities
Manufacturing Activities
Diversified
Activities
*Non-voting shares in ordinary and extraordinary shareholders’ meetings
10
2. PREPARATION OF THE FINANCIAL STATEMENTS
Basis of presentation
The financial statements for the year ended December 31, 2012 of Intercos Europe S.p.A. are expressed in euros.
The financial statements consist of the statement of financial position, the statement of comprehensive income, the
statement of cash flows and the statement of changes in equity and the notes thereto. All amounts in the notes are
expressed in thousands of euros, unless otherwise indicated. The statement of comprehensive income format
presents a classification according to costs by nature.
The separate financial statements at December 31, 2012 have been prepared in accordance with International
Financial Reporting Standards (“IFRS”) issued by the International Accounting Standards Board (“IASB”), and
approved by the European Commission for the preparation of consolidated and separate financial statements of
companies with share capital and/or debt securities listed on a regulated market in the European Community.
By IFRS is meant all “International Financial Reporting Standards”, all International Accounting Standards
(“IAS”), all interpretations of the International Financial Reporting Interpretations Committee (“IFRIC”), formerly
the Standing Interpretations Committee (“SIC”), adopted by the European Union and contained in the relative
European Union Regulations published up to April 10, 2013, the date on which the board of directors of Intercos
Europe S.p.A. approved these draft financial statements. Any future guidance and updated interpretations will be
adopted in subsequent years in the manner established each time by the benchmark accounting standards.
The financial statements were approved for publication by the board of directors on April 10, 2013.
Early adoption of standards
The Company has early adopted in these financial statements the revised version of IAS 19 “Employee Benefits”,
described below.
Recently issued accounting standards
By Commission Regulation (EU) 475/2012 issued on June 5, 2012, the amendments to IAS 19 “Employee
Benefits” were endorsed as revised by the IASB on June 16, 2011. The amendments provide, among other things:
(i) the obligation to record actuarial gains and losses in the statement of comprehensive income, removing the
option of adopting the corridor method. The actuarial gains and losses recorded in the statement of comprehensive
income may not subsequently be reclassified to the income statement (ii) the elimination of the separate
presentation of the cost components relating to defined benefit plans, represented by the expected return on plan
assets and the interest expense, and replacement by the concept of “Net interest expense”. The new requirements
are applicable from January 1, 2013.
By Commission Regulation (EU) 1254/2012 issued on December 11, 2012, the following were adopted: IFRS 10
“Consolidated Financial Statements”, IFRS 11 “Joint Arrangements”, IFRS 12 “Disclosures of Interests in Other
Entities” as well as amended IAS 27 reissued as “Separate Financial Statements” and amended IAS 28
“Investments in Associates and Joint Ventures”.
IFRS 10 “Consolidated Financial Statements” and the reissued IAS 27 “Separate Financial Statements” outline,
respectively, the requirements for the presentation and preparation of the consolidated and separate financial
statements. IFRS 10 also provides a new definition of control to be applied uniformly to all companies (including
special purpose entities). According to this definition, a company exercises control if it is exposed, or has rights, to
variable returns (positive and negative) from its involvement with the investee or has the ability to affect those
returns through its power over the investee. The standard provides some indicators to consider for purposes of the
assessment of the existence of control which include, among others, potential voting rights, protective rights only,
the presence of agency relationships or franchising agreements. The new requirements also recognize the
possibility of exercising control over an investee even in the absence of the majority of voting rights as a result of
the dispersion of the shareholder base or a passive attitude on the part of the other investors.

11
IFRS 11 “Joint Arrangements” supersedes IAS 31 “Interests in joint ventures” and SIC 13 “Jointly controlled
entities - non-monetary contributions by venturers”. IFRS 11 identifies, based on the rights and obligations of the
parties to the arrangement, two types of joint arrangements: joint operations and joint ventures, fixing the criteria
for identifying joint arrangements and defining the rules for their accounting treatment in the financial statements.
As for the recognition of joint ventures, the new criteria require a single valuation method, the equity method,
eliminating the possibility of using the proportional consolidation method. Amended IAS 28 defines, among other
things, the accounting treatment to adopt in the event of the total or partial disposal of an investment in a joint
venture or associate.
IFRS 12 “Disclosures of Interests in Other Entities” includes the disclosure requirements about an entity’s interests
in joint arrangements, associates and subsidiaries, specifically disclosing significant assumptions (and changes to
those assumptions) made for the purpose of assessing the existence of joint control of an arrangement or significant
influence and the type of joint arrangement, when the arrangement is structured through a special purpose entity).
The requirements of IFRS 10, IFRS 11, IFRS 12 and the new IAS 27 and IAS 28 are effective for annual periods
beginning on or after January 1, 2014.
By Commission Regulation (EU) 1255/2012 issued on December 11, 2012, IFRS 13 “Fair Value Measurement”
was endorsed. IFRS 13 provides a series of guidelines to measure the fair value of financial and non-financial
assets and liabilities in cases in which another IFRS permits or requires a fair value measurement or the
presentation of disclosure based on fair value. IFRS 13 is applicable for annual periods beginning on or after
January 1, 2013.
By Commission Regulation (EU) 1256/2012 issued on December 13, 2012, the amendments were adopted to IFRS
7 “Financial Instruments: Disclosures” and IAS 32 “Financial Instruments: Presentation”. The amendments
provide, respectively, for the cancellation of paragraph 13 of IFRS 7 (relating to the transfer of financial assets
which do not qualify for derecognition from the transferring entity’s financial statements) and the inclusion of
additional guidance to reduce inconsistencies in the practical application of the standard (with particular reference
to netting arrangements for financial assets and liabilities). The amendments to IFRS 7 and IAS 32 are effective,
respectively, for annual periods beginning on or after January 1, 2013 and January 1, 2014.
The same Commission Regulation (EU) 1255/2012 endorsed the amendments to IFRS 1 “First-time adoption of
International Financial Reporting Standards”, IAS 12 “Income taxes” and IFRIC 20 “Stripping costs in the
production phase of a surface mine”. These amendments refer, respectively, to the introduction of an exception to
the application of IFRS 1 for entities subject to severe hyperinflation, the introduction of an exception to the tax
treatment of investment property measured at fair value and the definition of practical guidance on the recognition
of stripping costs in the production phase of the mining industry. These amendments to IFRS 1, IAS 12 and IFRIC
20 do not apply to Intercos.
Standards and interpretations issued by IASB/IFRIC and not yet endorsed by the European Commission
On March 13, 2012, the IASB issued “Amendments to IFRS 1” which introduces an exception to be applied by
entities that adopt international financial reporting standards for the first time, on the basis of which government
loans must be measured prospectively, at the transition date, according to the requirements of IFRS 9 “Financial
Instruments” and IAS 20 “Accounting for government grants and disclosure of government assistance”.
On May 17, 2012, the IASB issued “Annual Improvements to IFRSs 2009 – 2011 Cycle” containing amendments to
the standards, mainly referring to changes in terminology or editorial changes.
On June 28, 2012, the IASB issued “Consolidated Financial Statements, Joint Arrangements and Disclosure of
Interests in Other Entities: Transition Guidance (Amendments to IFRS 10, IFRS 11 and IFRS 12)” which provides
some explanations and simplifications on the transition requirements of IFRS 10, IFRS 11 and IFRS 12.
The requirements contained in these IFRS are applicable for annual periods beginning on or after January 1, 2013.
At this time the Company is analyzing the main points and evaluating whether their adoption will have a significant
impact on the financial statements.
On October 31, 2012, the IASB issued “Investment entities (Amendments to IFRS 10, IFRS 12 and IAS 27)” which
clarifies the definition of the area of consolidation for companies which qualify as investment entities. The
requirements of these IFRS are applicable for annual periods beginning on or after January 1, 2014. The Company
is evaluating the effects that the application of these standards could have on the separate financial statements.
Summary of significant accounting policies
12
As stated, the financial information has been prepared in accordance with IFRS adopted by the European Union.
The financial statements have been prepared under the historical cost convention except as specifically described in
the following notes, in which case, fair value was used.
The financial statements are prepared under the going concern assumption.
The most significant accounting policies adopted are described below. The accounting polices described have been
applied on a basis consistent to all the periods presented.
These financial statements will be submitted for the approval of the shareholders’ meeting which is authorized to
make changes, if any, to the financial statements, where necessary.
Property, plant and equipment
Property, plant and equipment is stated at purchase or production cost less accumulated depreciation and
impairment losses, if any. Purchase cost includes all directly attributable costs necessary to make the asset ready for
use and any expenses for decommissioning and restoration that will be incurred as a result of contractual
obligations that require the assets to be restored to their original condition.
Any borrowing costs incurred for the acquisition, production or construction of property, plant and equipment are
capitalized to the relative asset up to the time such asset is ready for use. Ordinary and/or cyclical maintenance and
repairs are charged directly to the income statement in the year in which they are incurred. Costs for the expansion,
refurbishment or betterment of structural elements owned or leased are capitalized solely to the extent that they
meet the requisites for being classified separately as assets or part of an asset under the component approach.
Likewise, the replacement costs of identifiable components of complex assets are charged to assets and depreciated
over their estimated useful lives; the remaining carrying amount of the component being replaced is charged to the
income statement.
Spare parts of significant amount are capitalized and depreciated over the estimated useful life of the asset to which
they refer.
The carrying amount of property, plant and equipment is adjusted by systematic depreciation, calculated on a
straight-line basis from the date the asset is available and ready for use, over the estimated useful life of the asset.
In particular, depreciation is recognized starting from the month in which the asset is available for use or is
potentially able to provide the economic benefits associated with it and is charged on a monthly basis on a straight-
line basis at rates designed to write off the assets up to the end of their useful life or, for disposals, up to the last
month of utilization.
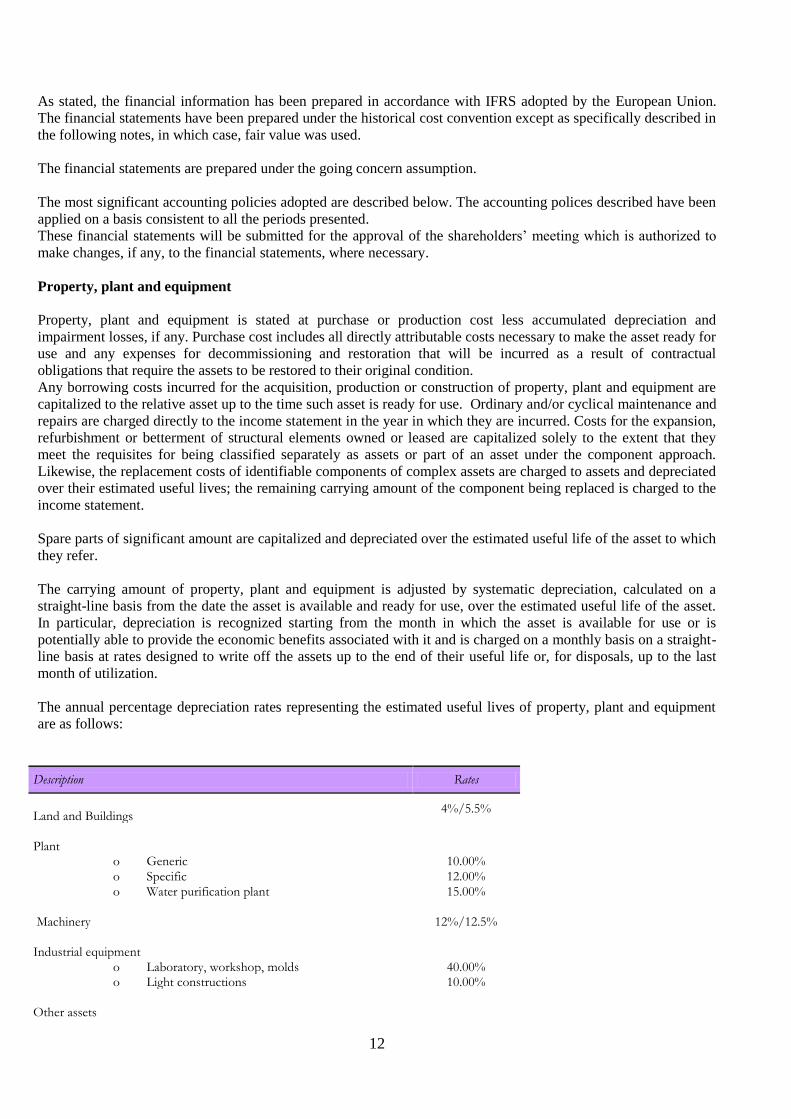
The annual percentage depreciation rates representing the estimated useful lives of property, plant and equipment
are as follows:
Description Rates
Land and Buildings
4%/5.5%
Plant
o Generic 10.00%
o Specific 12.00% o Water purification plant 15.00%
Machinery 12%/12.5% Industrial equipment
o Laboratory, workshop, molds 40.00% o Light constructions 10.00%
Other assets

13
o Office furniture and fixtures 12.00% o Electronic machines 20.00% o Internal transportation equipment 20.00% o Motor vehicles and transportation equipment 25.00%
The useful life of property, plant and equipment and the residual amount is reviewed and updated, where
applicable, at the end of every year.
Whenever the depreciable asset is composed of distinctly identifiable elements whose useful life differs
significantly from the other parts that compose the asset, depreciation is taken separately for each of the parts that
compose the asset in accordance with the component approach.
The depreciation period referring to costs for the expansion, upgrading or improvement of the structural elements
used by third parties corresponds to the lower of the remaining estimated useful life of the property, plant and
equipment and the remaining term of the lease contract.
Gains and losses on the sale or disposal of property, plant and equipment are calculated as the difference between
the proceeds from the sale and the net carrying amount of the assets sold or disposed of and are recognized in the
income statement in the year to which they refer.
Leasehold improvements are classified in property, plant and equipment, consistently with the nature of the cost
incurred. The depreciation period corresponds to the lower of the remaining estimated useful life of the property,
plant and equipment and the remaining term of the lease contract.
Land is not depreciated and is measured at cost net of accumulated impairment losses.
Gains and losses on the sale or disposal of property, plant and equipment are calculated as the difference between
the proceeds from the sale and the net carrying amount of the assets sold or disposed of.
Leased assets
Assets owned under finance lease contracts in which substantially all the risks and rewards of ownership are
transferred to the Company are recognized as property, plant and equipment at fair value or, if lower, at the present
value of the minimum lease payments. The corresponding liability payable to the lessor is shown in the financial
statements under borrowings. The assets are depreciated according to the policies and rates indicated for property,
plant and equipment unless the term of the lease contract is shorter than the useful life represented by these rates
and reasonable certainty of transferring ownership of the leased asset at the natural expiration of the contract is not
assured. In that case, the depreciation period is represented by the term of the lease contract. The lease payment is
divided into its components of finance expense, recognized in the income statement, and the repayment of
principal, recorded as a reduction of the financial liability.
Leases in which the lessor retains substantially all the risks and rewards of ownership associated with ownership of
the assets are classified as operating leases. Payments made under operating leases are recognized in the income
statement on a straight-line basis over the term of the lease contract.
Intangible assets
Intangible assets are identifiable non-monetary assets without physical substance able to produce future economic
benefits. Such assets are recorded at the cost of purchase and/or production, including incidental expenses directly
attributable to the preparation of the asset for its intended use, net of accumulated amortization, and any
impairment losses. Any borrowing costs arising during and for the development of intangible assets are expensed in
the income statement. Amortization starts when the asset is available for use and is charged on a straight-line basis
over the remaining period of possible utilization, intended as the estimated useful life.

14
(i) Goodwill
Goodwill represents the excess of the cost of an acquisition over the fair value at the date of purchase, of assets and
liabilities of acquired companies or business segments at the date of purchase. Goodwill is not subject to
amortization but is tested for impairment at least annually or whenever events indicate an impairment, to verify the
adequacy of the relative carrying amount in the financial statements. To test for impairment, goodwill must be
allocated to cash-generating units or groups of cash-generating units (hereinafter also “CGU”). An impairment loss
on goodwill is recognized when the recoverable amount of goodwill is below the carrying amount in the financial
statements. The recoverable amount is the higher of the fair value of the CGU or groups of CGUs, less costs to sell,
and the relative value in use (see the following paragraph on the “Impairment of property, plant and equipment and
intangible assets” for additional information on the determination of the value in use). Reversal of a previous
impairment loss on goodwill is prohibited.
When the impairment loss is higher than the carrying amount of goodwill allocated to the cash-generating unit, the
remaining excess is allocated to the assets of the CGU in proportion to their carrying amount. The carrying amount
of an asset should not be reduced below the higher of:
the fair value of the asset less costs to sell;
the value in use, as defined above.
(ii) Trademarks, licenses and similar rights
Licenses are amortized on a straight-line basis so as to allocate the cost incurred for the purchase of the right over
the shortest period between the expected utilization period and the term of the relative contracts starting from the
time in which the acquired right becomes exercisable. Software licenses are amortized on a straight-line basis over
their estimated useful lives (5 years).
(iii) Research and development costs
Costs associated with research and development are charged to the income statement in the year incurred except for
development costs recognized in intangible assets when the following conditions are met:
a) the project can be clearly identified and the costs associated with it can be identified and measured reliably;
b) the technical feasibility of the project can be demonstrated;
c) the intention to complete the project and sell the intangible assets generated by the project can be demonstrated;
d) a potential market exists or, in the case of internal use, the utility of the intangible asset for the production of
intangible assets generated by the project can be demonstrated;
e) the technical and financial resources for the completion of the project are available.
Amortization of any capitalized development costs recorded in intangible assets starts from the date in which the
result generated by the project can be marketed. Amortization is charged on a straight-line basis over a period of
five years, which represents the estimated useful life of capitalized expenditures.
Impairment of property, plant and equipment and intangible assets
At each balance sheet date, property, plant and equipment with a finite life are reviewed to identify the existence of
any indicators of an impairment in their value. When the presence of these indicators is identified, the recoverable
amount of such assets is estimated and any impairment is recognized in the income statement. The recoverable
amount of an asset is the higher of its fair value less costs to sell and its value in use where the value in use is the
present value of the estimated future cash flows for such asset. The value in use is determined by discounting the
estimated future cash flows from the use of the asset to present value at a pretax rate which reflects current market
assessments of the time value of money, in relation to the period of the investment and the risks specific to the

15
asset. For an asset that does not generate independent financial flows, the recoverable amount is determined by
reference to the cash-generating unit to which such asset belongs.
An impairment loss is recognized in the income statement when the carrying amount of the asset, or the cash-
generating unit to which it is allocated, is higher than the recoverable amount. Where an impairment loss on assets
subsequently no longer exists or has decreased, the carrying amount of the asset, except for goodwill, is increased
and the reversal is recognized in the income statement. The asset is increased to the net carrying amount that would
have been recorded and reduced by the depreciation and amortization that would have been charged had no
impairment loss been recognized.
Financial instruments
Financial assets
Financial assets mainly relate to accounts receivable from customers, with fixed or determinable payments, that are
non-derivative and are not listed on an active market. They are included in current assets, except for maturities
greater than 12 months after the balance sheet date which are classified in non-current assets. Such assets are
recognized initially at fair value and subsequently measured at amortized cost using the effective interest rate
method. Where there is objective evidence of an indication of impairment, the asset is reduced so that it equals the
present value of estimated future cash flows. The impairment loss is recognized in the income statement. Where an
impairment loss on assets subsequently no longer exists or has decreased, the carrying amount of the asset is
increased up to the carrying amount that would have been recorded under the amortized cost method had no
impairment loss been recognized.
Financial assets are eliminated from the financial statements when the right to receive cash flows from the
instrument is extinguished or when the Company has substantially transferred all the risks and rewards relating to
the receivable and the relative control.
Financial liabilities
Purchases and sales of financial liabilities are recognized on the trade date, that is, the date in which the Company
commits to purchase or sell the financial instrument.
Financial liabilities are borrowings, trade payables and other obligations payable. They are recognized initially at
fair value and subsequently measured at amortized cost using the effective interest rate method. When there is a
change in estimated cash flows and it is possible to estimate them reliably, the amount of the borrowings is
recalculated to reflect this change on the basis of the present value of the new estimated cash flows and the internal
yield rate determined initially. Financial liabilities are classified in current liabilities unless the company has an
unconditional right to defer settlement of the liabilities for at least 12 months after the balance sheet date.
Financial liabilities are eliminated from the financial statements when they are extinguished or when the Company
has transferred all the risks and expenses relating to the liability to third parties.
Inventories
Inventories are stated at the lower of purchase or production cost, determined using the weighted average cost
method, and estimated realizable value.
Inventories, where necessary, are adjusted to take into account obsolete or slow-moving goods. When the
circumstances which previously led to the adjustment no longer exist or when there is a clear indication of an
increase in net realizable value, the adjustments are reversed in whole or in part so that the new carrying amount is
the lower of purchase or production cost and net realizable value at the balance sheet date.
Cash and cash equivalents

16
Cash and cash equivalents include bank deposits, postal deposits, cash and valuables in cash. They are stated at
nominal value.
Provisions
Provisions include accruals for present legal or constructive obligations as a result of past events for which it is
more likely than not that an outflow of resources will be required to settle the obligation and the amount can be
reliably estimated. The accrual is measured using the best possible estimate of the amount that the Company would
be expected to pay to extinguish the obligation. Where the effect of the time value of money is material and the
dates of payment can be reliably estimated, the accrual is measured at present value. The rate used to determine the
present value of the liability reflects fair value and includes the additional effects relating to the specific risk that
can be associated with each liability. The change in the amount of the provision connected with the passage of time
is recognized in the income statement in “Finance expenses”.
Risks associated with liabilities that are only considered possible are disclosed under Guarantees and other
commitments.
Employee benefit obligations
Defined benefit pension plans, which also included until December 31, 2006 the employee severance indemnities
due to Italian employees as set forth in article 2120 of the Italian Civil Code, are based on the working life and the
compensation received by the employee over a predetermined service period. In particular, the liability relating to
employee severance indemnities is recognized in the financial statements based on actuarial calculations since it
qualifies as an employee benefit due on the basis of a defined benefit plan. Recognition of a defined benefit plan in
the financial statements requires actuarial techniques to estimate the amount of benefits accruing to employees in
exchange for work performed during the current and prior years and the discounting of such benefits in order to
determine the present value of the Company’s commitments. The determination of the present value of such
commitments is calculated using the Projected Unit Credit Method. This method, which is one of the actuarial
techniques used for calculating accrued benefits, considers each active service period by the employee in the
company as an additional unit which gives the right to benefits: the actuarial liability must therefore be quantified
on the basis of only the service life accrued at the date of measurement; therefore, the total liability is normally
recalculated on the basis of the ratio of the number of years of service accrued at the measurement date to the total
estimated service life that will be reached at the time of settlement. Furthermore, this method calls for considering
future increases in compensation, for whatever reasons (inflation, career, contract renewals, etc.) up until the time
of termination of employment.
The cost accrued during the year for defined benefit plans and recognized in the income statement under employee
benefit expenses is equal to the sum of the average present value of the defined benefits accrued by active
employees for the work performed during the year and the annual interest accrued on the present value of the
Company’s commitments at the beginning of the year, calculated using the discount rate of future cash outflows
adopted for the estimate of the liability at the end of the preceding year.
Remeasurements of employee defined benefit plan comprise actuarial gains and losses expressing the effects of
differences arising from experience adjustments and changes in actuarial assumptions. Such actuarial gains and
losses are recorded in the statement of comprehensive income.
Following the Reform of Supplementary Pension Benefits, as amended by the Budget Law 2007 and subsequent
decrees and regulations issued during the early months of 2007, employee severance indemnities that accrue
starting from the date of January 1, 2007 are assigned to pension funds or to a treasury fund managed by INPS or,
in the case of companies with less than 50 employees, may be retained in the company and calculated similarly to
the method used in past years. Employees have the right to choose the destination of their employee severance
indemnities up to June 30, 2007.

17
To this end, account was taken of the effect of the new provisions and only the liability relating to employee
severance indemnities that is retained in the company is measured in accordance with IAS 19, since the amount of
employee severance indemnities accruing from 2007 is assigned to alternative forms of pension or paid into a
treasury fund managed by INPS, according to the choice of destination made by each single employee.
Consequently, the portion of employee severance indemnities accruing and assigned to pension funds or to the
INPS-managed fund is classified as a defined contribution plan since the company’s obligation is only represented
by the payment of contributions to the pension fund or to INPS. The liability for severance indemnities previously
accrued continues to be considered a defined benefit plan and is measured on the basis of actuarial assumptions.
Translation of foreign currency balances and transactions
Transactions in foreign currency are translated to euros using the exchange rate in effect at the dates of the relative
transactions. Foreign exchange gains and losses realized on the receipt or the payment of the above transactions and
the translation of monetary asset and liability balances denominated in foreign currencies are recognized in the
income statement.
Revenue recognition
Revenues are recognized net of returns, discounts, allowances, rebates, taxes and directly related promotional
contributions. Revenues are recognized upon delivery of the goods to the final customer when all the risks and
rewards of ownership are transferred.
Sales of products
Revenues from the sale of products are recorded when all the following conditions are met:
the seller has transferred to the buyer the significant risks and rewards of ownership;
the seller retains neither continuing managerial involvement to the degree usually associated with ownership
nor effective control over the goods sold;
the amount of revenues can be determined with reliability;
it is probable that the economic benefits associated with the transaction will flow to the seller;
the costs incurred or to be incurred in respect of the transaction can be measured reliably.
In cases in which the nature or degree of involvement of the seller is such that the risks and rewards are not in fact
transferred, the time of recognition is deferred until the date in which the transfer can be considered to have taken
place.
Performance of services
Revenues from services are recorded only when the results of the transaction can be estimated reliably, with
reference to the stage of completion of the transaction and the reference date of the financial statements.
The results of a transaction can be estimated reliably when all the following conditions are met:
the amount of revenues can be determined with reliability;
it is probable that any future economic benefit associated with the item of revenue will flow to the entity;
the stage of completion at the balance sheet date can be measured reliably;
the costs incurred, or to be incurred, in respect of the transaction can be measured reliably.
Finance expenses
Finance expenses are recorded as expenses in the year incurred. They include interest on bank overdrafts and loans,
finance expenses on finance leases, actuarial losses and finance expenses on the actuarial valuation of employee
severance indemnities.
Income taxes
Current income taxes are determined on the basis of a realistic estimate of the tax expense to be paid under the
existing tax laws.

18
Deferred income taxes are calculated on temporary differences arising between the carrying amounts of assets and
liabilities in the financial statements and their tax bases (full liability method), except for goodwill. Deferred tax
assets, including those relating to the carryforward of unused tax losses, are recognized to the extent that it is
probable that future taxable profits will be available against which they can be utilized. Deferred tax liabilities are
determined based on enacted tax rates that are expected to apply to taxable income in the years in which those
temporary differences are expected to be recovered or settled.
Current and deferred income taxes are recognized in the income statement except to the extent that they relate to
items directly charged or credited to equity, in which case the related income tax effect is recognized in equity.
Current and deferred income taxes are offset when the income taxes are levied by the same taxing authority and
where there is a legally enforceable right of offset and there are expectations of settling the net balance.
In addition, the Company has adhered to the national tax consolidation procedure under articles 117-129 of
T.U.I.R. since 2008, renewed in 2011 for a three-year period, of the parent Intercos S.p.A. (formerly Intercos
Group S.r.l., “the consolidating company”) with the subsidiaries Interfila S.r.l. (in 2011 merged in Color Cosmetics
S.r.l. which was transformed at the same time into an S.p.A. and took the name of Intercos Europe S.p.A.) and
Marketing Projects S.r.l. (“consolidated companies”). Therefore, considering that the settlement for the current year
resulted in a tax loss, in accordance with the consolidation agreements, this was transferred to the consolidating
company and recorded by the Company as a receivable from the latter and the attributed remuneration of 27.5%
(IRES rate in force) recorded by the Company as a receivable due from the latter.
Intercos Europe S.p.A. is also responsible together with the consolidating company Intercos S.p.A. for additional
taxes, interest and fines assessed relating to the consolidated tax return referring to adjustments to the income on its
tax return, also as a result of formal control activities pursuant to art. 36-ter of DPR 600/1973 and the settlement
activity under art. 36-bis of the same decree.
As for IRAP, current income taxes continue to be shown in Taxes payable or Taxes receivable when the sum of the
advance payment made exceeds the tax due for the year.
3. DIRECTION AND COORDINATION ACTIVITIES
Pursuant to art. 2497 bis, paragraph 4 of the Italian Civil Code, since the Company is subject to the direction and
coordination of the parent Intercos S.p.A., the highlights of its latest approved financial statements are presented;
these have been prepared in conformity with IFRS adopted by the European Union. Intercos S.p.A. also prepares
the consolidated financial statements.
For a meaningful and complete understanding of the financial condition and cash flows of said company at
December 31, 2011, as well as the results of operations for the year then ended, reference should be made to the
financial statements which, accompanied by the independent auditors’ report, are available in the form and manner
established by law.

19
INTERCOS S.p.A. - IFRS FINANCIAL STATEMENTS AT DECEMBER 31, 2011
STATEMENT OF FINANCIAL POSITION
ASSETS IFRS
12/31/2011
NON-CURRENT ASSETS
Property, plant and equipment 41,456
Intangible assets 11,203
Goodwill 33,653
Investments in subsidiaries 71,988
Deferred tax assets 11,676
Other non-current receivables 4,124
TOTAL NON-CURRENT ASSETS 174,100
CURRENT ASSETS
Trade receivables 25,598
Taxes receivable 6,696
Other current assets 1,541
Loans receivable from Group companies – short-term 31,604
Cash and banks 10,989
TOTAL CURRENT ASSETS 76,428
TOTAL ASSETS 250,528
INTERCOS S.p.A. - IFRS FINANCIAL STATEMENTS AT DECEMBER 31, 2011
STATEMENT OF FINANCIAL POSITION
EQUITY AND LIABILITIES IFRS
12/31/2011
EQUITY
Share capital 10,710
Legal reserve 0
Other reserves 62,396
Retained earnings (Accumulated losses) (18,279)
TOTAL EQUITY 54,827
NON-CURRENT LIABILITIES
Borrowings from banks and other lenders 138,101
Other financial liabilities 2,520
Loans payable to Group companies – medium/long-term 650
Provisions 300
Deferred tax liabilities 8,701
Employee benefit obligations 1,335
TOTAL NON-CURRENT LIABILITIES 151,607
CURRENT LIABILITIES
Borrowings from banks and other lenders 29,496
Loans payable to Group companies – short-term 125
Other financial liabilities 1,589
Trade payables 6,960
Other payables 5,924
TOTAL CURRENT LIABILITIES 44,094
TOTAL EQUITY AND LIABILITIES 250,528
INTERCOS S.p.A. - IFRS FINANCIAL STATEMENTS AT DECEMBER 31, 2011

20
INCOME STATEMENT
IFRS
2011
Revenues 16,265
Other income 1,496
Purchases of raw materials, semifinished products and consumables (687)
Purchases of services and leases and rents (5,236)
Employee benefit expenses (13,804)
Accruals (300)
Other operating expenses (1,961)
Operating profit before depreciation, amortization, impairment reversals (losses)
and nonrecurring expenses
(4,227)
Depreciation, amortization and impairment reversals (losses) (8,328)
Nonrecurring operating income (expenses) 0
Operating loss (12,555)
Finance income 9,427
Finance expenses (10,034)
Income taxes (964)
LOSS FOR THE YEAR FROM CONTINUING OPERATIONS (14,126)
Profit for the year from discontinued operations 15,091
PROFIT FOR THE YEAR 965
4. RISK MANAGEMENT
Financial risk management is an integral part of the management of the assets of Intercos Europe S.p.A.
Intercos Europe S.p.A.’s activities are exposed to various types of risks: market risk (including exchange rate risk
and interest rate risk), credit risk and liquidity risk. Intercos Europe S.p.A.’s risk management strategy is focused
on the unpredictability of the markets and aimed at minimizing potential negative effects on earnings. Certain types
of risk are mitigated using derivative financial instruments.
The coordination and monitoring of major financial risks is centralized with management. The risk management
policies are approved, in concert with the board, by the Finance, Administration and Control Function, which
provides written policies for the management of the above risks and the use of suitable financial instruments.
Types of risks
Market risk
In the sensitivity analyses performed and described below, the effect on profit and equity was calculated without
considering the tax effect.
Exchange rate risk
Intercos Europe S.p.A. operates internationally and is exposed to foreign exchange risk arising from fluctuations in
the equivalent amount of commercial and financial flows denominated in currencies other than the functional
currency.
Intercos Europe S.p.A.’s exposure is mainly focused on the EUR/USD exchange rate with reference to commercial
and financial transactions entered into by the company in the North American market and vice versa.
The above risk is hedged by net currency positions or by using derivative contracts.
The following sensitivity analysis was performed which illustrates the effects on profit and equity produced by an
increase/decrease of 7.5% in exchange rates compared to the effective exchange rates at December 31, 2012.

21
(thousands of euros) 2012
-7.5% +7.5%
U.S. dollar (567) 659 Pound sterling (117) 136 Other currencies 22 (27) Total (662) 768
Interest rate risk
The Company is exposed to interest rate risk mainly from long-term borrowings. Such borrowings are at either
fixed or variable interest rates. Intercos Europe S.p.A. has no particular hedging policy regarding the risks arising
from fixed-rate contracts, maintaining that the risk is moderate in relation to the limited amount of fixed-rate loans.
The Administrative Function monitors interest rate risk exposure and proposes the most appropriate hedging
strategies to keep exposure within the limits established by the Finance, Administration and Control Function,
using derivative contracts, where necessary.
The following sensitivity analysis was performed which illustrates the effects on profit produced by an
increase/decrease of 50 basis points in interest rates compared to the effective interest rates at December 31, 2012,
with all other variables remaining constant.
The potential effects reported below were calculated by taking the liabilities which represent the most significant
part of the Company’s borrowings at the reference date and calculating, on that amount, the potential impact of a
change in the interest rates on an annual basis.
The liabilities in this analysis include variable-rate financial payables and receivables and also cash and cash
equivalents.
(thousands of euros) 2012
-0.5% +0.5%
Euros (Euro Libor) (173) 173 Total (173) 173
Credit risk
Credit risk is associated with trade receivables, cash and cash and equivalents, financial instruments, deposits at
banks and other financial institutions.
The credit risk related to trading counterparts is managed by the Group Administrative Function. Intercos Europe
S.p.A. does not have significant concentrations of credit risk. However, there are policies in place to ensure that
sales of products and services are made to customers with an appropriate credit history, taking into consideration
their financial position, past experience and other factors. Credit limits for major customers are based on internal
and external valuations based on ceilings approved by management. The use of credit limits is monitored
periodically.
As for credit risk relating to the management of financial resources and cash, the risk is monitored by the
Administrative Function which has policies in place to ensure that the Company enters into transactions with
independent high-credit-quality counterparts.
Trade accounts receivables, the provision for impairment of receivables and an ageing analysis of receivables from
third party customers are presented at December 31, 2012.

22
12/31/2012 Trade
receivables Current
Overdue 0 – 30 days
Overdue 30 – 60 days
Overdue +60 days
Provision for impairment of
receivables
Intercos Europe S.p.A.
26,713 21,795 2,775 662 1,481 801
Liquidity risk
Prudent management of liquidity risk arising from the normal operations of the Company implies maintaining
sufficient cash and funds obtainable through an adequate amount of committed credit lines.
The Finance Function of the parents monitors forecasts on the use of the liquidity reserves on the basis of estimated
cash flows.
The amount of liquid reserves at December 31, 2012 compared to the end of the prior year is as follows:
(thousands of euros) 2011 2012
Cash and cash equivalents 3,286 16,902 Unused committed credit lines 0 0 Total 3,286 16,902
The following table includes an analysis of the maturities of borrowings, other liabilities and derivatives, on a net
basis. Borrowings from banks in the following table are presented at their nominal amount:
TOTAL
Within 1 year
1 to 5 years
Beyond 5 years At December 31, 2012
Borrowings from banks and other lenders - m-l/term 71 35,127 - 35,198
Finance leases payable 0 0 - 0
Medium/long-term debt 71 35,127 - 35,198
Borrowings from banks and other lenders - s/term 14,224 14,224
Trade payables 53,428 53,494
Short-term debt 67,652 - 67. 718
Total 67,723 35,127 - 102,850
In order to complete the disclosure on financial risks, a reconciliation is presented below between the categories of
financial assets and liabilities as identified in the statement of financial position format of Intercos Europe S.p.A.
and the categories of assets and liabilities identified in accordance with the requirements of IFRS 7:

23
(thousands of euros)
at December 31, 2012
Financial assets at fair
value through
profit or loss
Receivables and loans
Available-for-sale
financial assets
Assets held to
maturity
Financial liabilities at
fair value through
profit or loss
Other liabilities at amortized
cost
Hedging derivatives
Available-for-sale financial assets
- - - - - - -
Derivatives (assets) - - - - - - - Loans receivable - - - - - - - Trade receivables - 31,318 - - - - - Other assets - 2,795 - - - - - Loans payable - - - - - 14,133 - Borrowings from banks and other lenders
- - - - - 35,289 -
Trade payables - - - - - 53,428 - Other payables - - - - - 5,272 - Derivatives (liabilities) - - - - - - - Total - 34,113 - - - 108,122 -
Cash and cash equivalents - 16,902 - - - - -
5. USE OF ESTIMATES AND ASSUMPTIONS
The preparation of the financial statements requires management to apply accounting principles and methods which
at times are based upon complex subjective judgments and estimates connected with past experience as well as
reasonable and realistic assumptions according to the relevant circumstances. The use of these estimates and
assumptions can affect the amounts reported in the financial statements, such as the statement of financial position,
the income statement and the statement of cash flows, in addition to the disclosure provided. Such estimates and
assumptions have an effect on the reported amounts in the financial statements due to the uncertainty characterizing
the assumptions and the conditions on which the estimates are based. Actual results could differ, even
significantly, from those estimates owing to possible changes in the factors considered in the determination of such
estimates.
The most important accounting estimates which require a high degree of subjective judgments and assumptions by
management are briefly described below.
Goodwill
In accordance with the accounting policies adopted for the preparation of the financial statements, the Company
tests goodwill annually for any impairment that requires recognition in the income statement. The test specifically
requires the allocation of goodwill to cash-generating units and the subsequent determination of the recoverable
amount, being the higher of the fair value and the value in use. When the value in use is lower than the carrying
amount of the cash-generating unit, an impairment of goodwill should be recognized. The allocation of goodwill to
the cash-generating unit and the determination of the value in use require the use of estimates that depend upon
subjective judgments and factors which over time could be different from management’s estimates and have
consequent effects that could be significant.
Impairment of property, plant and equipment and intangible assets
Property, plant and equipment and intangible assets are tested for any impairment that requires recognition of an
impairment loss, whenever there are indications that the carrying amount through use may not be recoverable.
Verification of the existence of such indications requires management to exercise subjective judgment based on
information available within the Company and from the market and from historical experience. Moreover,
whenever a potential impairment exists, the Company determines the impairment loss on the basis of appropriate

24
measurement techniques. The proper identification of the factors which indicate a potential impairment and the
estimates used depend on factors which could vary over time and affect management’s judgments and estimates.
Depreciation of property, plant and equipment
Depreciation of property, plant and equipment constitutes a significant cost for the Company. The cost of buildings,
plant and machinery is depreciated over the estimated useful lives of the assets on a straight-line basis. The
economic useful life of these assets is determined by management when the assets are purchased; it is based on the
historical experience of similar assets, market conditions and anticipation of future events which could have an
impact on the useful life, including changes in technology. Therefore, the effective economic life could differ from
the estimated useful life. The Company periodically reviews technological and sector changes, evaluates
decommissioning costs and the recoverable amount in order to update the residual useful life. This periodical
update could entail a change in the period of depreciation and therefore a change in the depreciation charge of
future years.
Deferred taxes
Deferred tax assets are recognized on the basis of expectations of future earnings. The estimate of future earnings
for purposes of the recognition of deferred taxes depends on factors which could vary over time and significantly
affect the amount of deferred taxes. In determining the adjusting entries, consideration has been given to the results
of budgets and plans consistent with those used for purposes of the impairment test and described in the preceding
paragraph relating to the recoverable amount of non-current assets. Moreover, it is believed that the adjusting
entries recorded are sufficient to cover the risk of a further deterioration in the assumptions of the plan, taking into
account the fact that net deferred tax assets as accrued refer to temporary differences/tax losses which, to a
significant degree, may be recovered over a very long period of time, thus compatible within a context where the
crisis situation and economic recovery extends beyond the time frame implicit in the above-mentioned plans
Provisions
Accruals are made to provisions for probable liabilities relating to disputes with employees, suppliers, third parties
and, generally, the expenses which the Company might be obliged to incur for obligations undertaken in the past.
These accruals also include an estimate of the liabilities which could arise from disputes concerning the terms of
fixed-term labor contracts used in the past, mainly for delivery activities. The determination of such accruals
requires the assumption of estimates which depend on the current knowledge of factors which could change over
time and which could produce effects that differ from the final outcomes estimated by management in preparing the
financial statements.
6. FIRST-TIME ADOPTION OF EU IFRS
First-time adoption of IFRS
The financial statements of Intercos Europe S.p.A. (hereinafter “the Company”) at December 31, 2012 have been
prepared for the first time in accordance with international reporting standards (herineafter “IAS/IFRS”) issued by
the International Accounting Standards Board and endorsed by the European Union, including all interpretations of
the International Financial Reporting Interpretations Committee (“hereinafter EU IFRS”)
IAS/IFRS have been adopted in the preparation of the financial statements for the year ended December 31, 2012
(date of reference of the financial statements), in the comparative data at December 31, 2011 presented in the above
financial statements and in the preparation of the opening IFRS financial statements at January 1, 2011 (hereinafter
“Date of Transition”).
The preparation of the IAS/IFRS opening financial statements prepared by the Company adjusted the amounts
reported in the financial statements previously drawn up in accordance with Italian accounting principles (Italian
GAAP).

25
This note describes the effects of the transition to IAS/IFRS on the previously published financial statements
(prepared in accordance with Italian GAAP) and present the reconciliations with the corresponding amounts
restated as a result of the adoption of IAS/IFRS.
The accounting policies adopted in the preparation of the opening statement of financial position at January 1,
2011, the statement of comprehensive income for the year ended December 31, 2011 and the statement of financial
position at December 31, 2011 drawn up in accordance with IAS/IFRS are reported in the relative part of the notes
to the financial statements. Here, instead, a description is provided of any accounting treatments elected under the
accounting options allowed by EU IFRS.
The statements of financial position at January 1, 2011 and at December 31, 2011 have been prepared in
accordance with IFRS 1 “First-time Adoption of International Reporting Standards” and with the IAS/IFRS
already applicable beginning January 1, 2012.
These notes present the information required by IFRS 1 and, in particular, the effects of the transition to EU IFRS
on the statement of financial position and statement of comprehensive income of the Company. To this end the
following have been prepared:
reconciliation between the statement of financial position of the Company at January 1, 2011 (transition date)
and at December 31, 2011 (closing date of the most recent financial statements prepared in accordance with the
Italian GAAP) prepared under Italian GAAP and under EU IFRS;
reconciliation between the statement of comprehensive income for the year ended 2011 prepared under Italian
GAAP and under EU IFRS;
reconciliation between equity at January 1, 2011 and December 31, 2011 prepared under Italian GAAP and
under EU IFRS;
notes presenting the effects of material adjustments and reclassifications in the above reconciliations due to the
transition, with regard to both the classification of the various items of the financial statements and their
different measurements and, therefore, the consequent effect on the financial position, earnings and cash flows;
notes presenting the effects of material adjustments made to the statement of cash flows.
The statement of financial position at the EU IFRS transition date was prepared according to the following criteria:
recognition of all assets and liabilities that are required to be recognized by EU IFRS;
derecognition of assets and liabilities that do not qualify for recognition under EU IFRS;
application of EU IFRS measurement to all recognized assets and liabilities.
Optional exemptions to the full retrospective application of EU IFRS
The companies that adopt EU IFRS for the first time may elect the application of some optional exemptions from
the full retrospective application of the same EU IFRS.
Adoption of IAS/IFRS subsequent to the adoption of EU IFRS by the parent Intercos S.p.A.
Intercos Europe S.p.A. is adopting IAS/IFRS for the first time at a date subsequent to the adoption of EU IFRS by
its parent, Intercos S.p.A., which took place in the year ended December 31, 2005; Intercos S.p.A. prepares
consolidated financial statements. The Company elected to measure the assets and liabilities in its individual
financial statements at the carrying amounts which would have been recognized in the consolidated financial
statements, at the date of transition to IAS/IFRS.
Investments in subsidiaries
Intercos Europe S.p.A. elected to assume as the carrying amount of its investment in Interfila Shanghai Co. Ltd. its
carrying amount determined according to Italian GAAP at the date of transition, or deemed cost.

26
Mandatory exemptions to the full retrospective application of EU IFRS
The only mandatory exemption applicable to Intercos Europe S.p.A. regards the estimates used at the date of
transition to IFRS. Such estimates must conform to those that had been used in the preparation of the financial
statements under Italian GAAP (after adjustments to reflect any differences in accounting policies).
Other mandatory exemptions required by IFRS 1 have not been applied since the situations described do not apply
to the Company.
Statement of financial position at January 1, 2011
Appendix 1 presents the reconciliation between the statement of financial position of Intercos Europe S.p.A. at
January 1, 2011 prepared under Italian GAAP and reclassified according to the elections made by the Company for
the EU IFRS financial statements, and the statement of financial position prepared under EU IFRS.
Statement of financial position at December 31, 2011
Appendix 2 presents the reconciliation between the statement of financial position of Intercos Europe S.p.A. at
December 31, 2011 prepared under Italian GAAP, and reclassified according to the elections made by the
Company for the EU IFRS financial statements, and the statement of financial position prepared under EU IFRS.
Statement of comprehensive income for the year ended December 31, 2011
Appendix 3 presents the reconciliation between the statement of comprehensive income of Intercos Europe S.p.A.
for the year ended December 31, 2011 prepared under Italian GAAP, and reclassified according to the elections
made by the Company for the EU IFRS financial statements, and the statement of comprehensive income prepared
under EU IFRS.
Equity at January 1, 2011 and December 31, 2011 and net comprehensive income for the year ended
December 31, 2011
Reconciliations between the equity of Intercos Europe S.p.A. at January 1, 2011 and December 31, 2011 and net
comprehensive income for the year ended December 31, 2011 prepared under Italian GAAP and the corresponding
equity and net comprehensive income under EU IFRS are presented below.
(in thousands of euros) Notes
Equity at
January 1,
2011
Interfila S.r.l.
merger
Intercos S.p.A.
business segment
contribution
Net profit (loss)
Year ended
December 31, 2011
Other
components of
comprehensive
income
Equity at
December 31,
2011
Intercos Europe S.r.l. (formerly Color
Cosmetics S.r.l.) financial statements -
Italian GAAP 357,008 5,099,930 19,744,707 (16,858,691) - 8,342,954
Elimination of intangible assets A (17,874) (22,272) - 12,157 - (27,989)
Accounting for leases under IAS 17 B (1,301) 155,403 - (27,151) - 126,951
Employee benefits IAS 19 C 99,190 123,250 - 57,520 133,986 413,946
Application of IAS 16 D - (436,304) - 20,352 - (415,952)
Adjustment of inventories E - 402,373 - (402,373) - 0
Elimination of goodwill amortization F - - - 2,030,000 - 2,030,000
Application of amortized cost method for
measurement of financial liabilities G - 7,740 - 1,742 - 9,482
Intercos Europe S.r.l. (formerly Color
Cosmetics S.r.l.) financial statements -
IAS/IFRS 437,023 5,330,221 19,744,707 (15,166,444) 133,986 10,479,391

27
Notes to the reconciliations of equity of Intercos Europe S.p.A. at January 1, 2011 and December 31, 2011
and net comprehensive income for the year ended December 31, 2011
A description of the adjustments made to equity at January 1, 2011 and December 31, 2011 and net comprehensive
income for the year ended December 31, 2011 for purposes of the adoption of EU IFRS is presented below.
The reconciliations also present the effects at January 1, 2011 of the adjustments to equity of the company Interfila
S.r.l., merged in Intercos Europe S.p.A. during 2011. Such effects have been determined as of January 1, 2011 and
not at the effective date of the merger (October 1, 2011), as indicated in OPI 2, since, being an operation “under
common control”, account was taken of the fact that the two companies had already merged during 2011 and that,
as a result, the effect on equity at December 31, 2011 would have nevertheless been the same.
It should be noted that the relative tax effect was recognized, where applicable, for each of the adjustments
described below.
A. Elimination of intangible assets
Intangible assets which do not meet the requirements of IAS 38 should be recorded in the income statement when
the relative cost of purchase is incurred. Therefore, on transition to EU IFRS, some costs that had been capitalized
in prior years or in 2011 were eliminated (mainly leasehold improvements). The relative amortization was also
eliminated.
B. Accounting for leases under IAS 17
The Company entered into leasing contracts, mainly for machinery and motor vehicles, pursuant to IAS 17. Such
contracts qualify as “finance leases”. Therefore, on transition to EU IFRS, the property, plant and equipment
acquired under lease contract were recognized in assets with a contra-entry for the liability connected with the
financial payable for the installments. The income statement thus reflects the effect of the depreciation and the
finance expenses connected with the transaction and the adjustment of the lease installments previously recorded in
the income statement under Italian GAAP.
C. Employee benefits
In accordance with Italian GAAP, post-employment benefits are recorded on the accrual basis over the service life
of the employee, in conformity with the law and applicable labor contracts.
Under IFRS (IAS 19), post-employment benefits (e.g. pension plans, life insurance and health insurance etc.) are
defined on the basis of “defined contribution” and “defined benefit” plans.
The provision for Employee severance indemnities is considered a defined benefit plan until December 31, 2006, to
be measured according to statistical and demographic assumptions, as well as actuarial valuation methods.
Following the change in Italian legislation, Employee severance indemnities accruing from January 1, 2007 are
considered, where the requisites existed as provided by the changed legislation, to a defined contribution plan.
On transition to IFRS, the value of the above provision for Employee severance indemnities, as well as the cost
relating to each year was recalculated. The actuarial gains and losses were recognized in other comprehensive
income under remeasurements of employee defined benefit plan, the service costs were recorded in “employee
benefit expenses” and the interest expense was allocated to “finance expenses.
In addition, the Company also proceeded to apply IAS 19R for all periods presented.
D. Application of IAS 16
IAS 16 provides that property, plant and equipment may be recognized at cost net of accumulated depreciation and
impairment losses, or periodically determining the fair value and adjusting the carrying amount to such value (so-
called “Revaluation model”). The Company decided to retain cost as the measurement criteria for property, plant
and equipment and intangible assets which, in this specific case, reflect the amounts which such assets assume in
the consolidated financial statements of the parent, Intercos S.p.A.

28
E. Adjustment of inventories
IAS 2” provides that inventories are valued using the FIFO or weighted average cost method. The criterion adopted
by the Company is weighted average cost.
The company Interfila S.r.l., prior to the effective date of the merger in Intercos Europe S.p.A. on October 1, 2012,
adopted the LIFO method.
Therefore, on transition to IFRS, the inventories were remeasured on the basis of the above valuation method,
taking into account also the effects produced on the average production cost of the adjustments due to the transition
to IFRS.
F. Elimination of goodwill amortization
Under IFRS goodwill is not amortized but is tested for impairment periodically in order to identify any impairment
losses. Therefore, the amortization of goodwill was eliminated and the value of goodwill was reinstated at the
transition date, which corresponds to the that of the contribution on the part of Intercos S.p.A.
G. Application of amortized cost method
The application of IAS 39 requires the use of amortized cost to record financial liabilities represented by existing
borrowings. Amortized cost is calculated using an effective interest rate method, that is, the rate which discounts
future inflows and outflows expected over the life of the financial instrument. For purposes of the calculation of the
effective interest rate all contractual aspects of the financial instrument must be considered, including all
commissions, transaction costs and any discounts or premiums.
On transition to EU IFRS, this method was applied to all existing borrowings at the reference date.
Details of the main reclassifications made to the statement of financial position at January 1, 2011
and December 31, 2011 and to the statement of comprehensive income for the year ended
December 31, 2011.
Statement of financial position
A. Reclassification of leasehold improvements Leasehold improvements, under Italian GAAP, were classified as intangible assets, whereas under EU IFRS they
have been reclassified to property, plant and equipment.
Notes presenting the effects of material adjustments made to the statement of cash flows
The Company has not deemed it necessary to present a reconciliation between the statement of cash flows under
Italian GAAP and under EU IFRS, as required by IFRS 1.25, since operating, investing and financing cash flows
under the two methods are basically aligned.
Appendix 1: Reconciliation between the statement of financial position of Intercos Europe S.p.A. at January
1, 2011 prepared under Italian GAAP and reclassified according to the elections made by the Company for
the EU IFRS financial statements and the statement of financial position prepared under EU IFRS

IAS/IFRS reclassifications
(in euros)
Statement of financial
position ITALIAN GAAP
at January 1, 2011
A) Elimination of
intangible assets
B) Accounting for leases
under IAS 17
C) Employee benefits IAS
19
D) Reclassification of
leasehold improvements
Statement of financial
position IAS/IFRS at
January 1, 2011
ASSETS
NON-CURRENT ASSETS
Property, plant and equipment 3,402,016 15,724 109,097 3,526,837
Intangible assets 145,187 (26,056) (109,097) 10,034
Goodwill 0 0
Investments in other companies 0 0
Loans receivable from Group companies - medium/long-term 0 0
Deferred tax assets 196,965 8,181 596 205,742
Other non-current assets 15 15
Other financial assets 0 0
TOTAL NON-CURRENT ASSETS 3,744,183 17,874 16,320 0 0 3,742,628
CURRENT ASSETS
Inventories 2,914,614 2,914,614
Trade receivables 11,666,137 11,666,137
Tax receivables 1,474,097 1,474,097
Other current assets 32,185 32,185
Loans receivable from Group companies - short-term 0 0
Cash and cash equivalents 2,353 2,353
TOTAL NON-CURRENT ASSETS 16,089,386 0 0 0 0 16,089,386
TOAL ASSETS 19,833,569 17,874 16,320 0 0 19,832,014
EQUITY AND LIABILITIES
EQUITY
Share capital 35,700 0 0 0 35,700
Legal reserve 7,140 0 0 0 7,140
Other reserves 0 0 0 0 0
Retained earnings 314,168 (17,874) (1,301) 99,190 394,183
Total equity 357,008 (17,874) (1,301) 99,190 0 437,023
Non-controlling interests
TOTAL EQUITY 357,008 (17,874) (1,301) 99,190 0 437,023
NON-CURRENT LIABILITIES
Borrowings from banks and other lenders 0 0
Other financial liabilities 0 0
Loans payable to Group companies - medium/long-term 0 0
Provisions 28,000 28,000
Deferred tax liabilities 30,278 37,624 67,902
Other non-current liabilities 0 0
Employee benefit obligations 1,283,114 (136,814) 1,146,300
TOTAL NON-CURRENT LIABILITIES 1,341,392 0 0 (99,190) 0 1,242,202
CURRENT LIABILITIES
Borrowings from banks and other lenders 3,720,453 17,621 3,738,074
Loans payable to Group companies - short-term 0 0
Other financial liabilities 0 0
Trade payables 13,145,215 13,145,215
Other payables 1,269,500 1,269,500
Taxes payable 0 0
TOTAL CURRENT LIABILITIES 18,135,169 0 17,621 0 0 18,152,789
TOTAL EQUITY AND LIABILITIES 19,833,569 (17,874) 16,319 0 0 19,832,014
IAS/IFRS adjustments
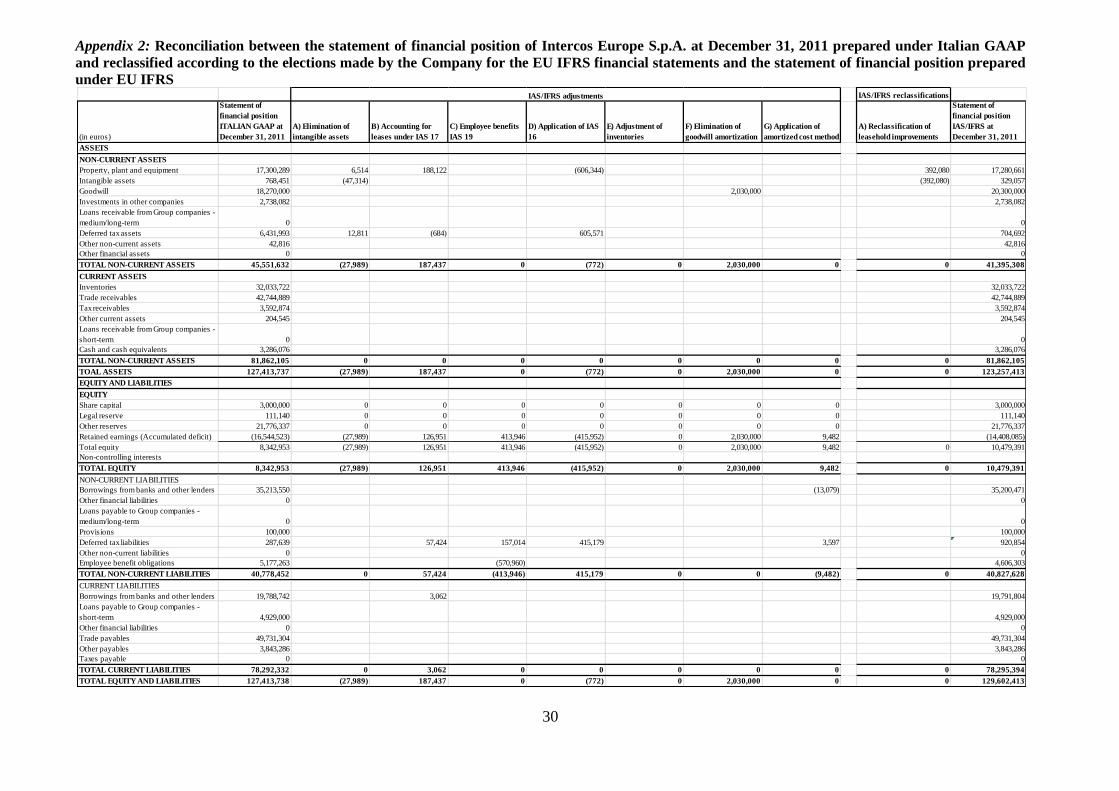
30
Appendix 2: Reconciliation between the statement of financial position of Intercos Europe S.p.A. at December 31, 2011 prepared under Italian GAAP
and reclassified according to the elections made by the Company for the EU IFRS financial statements and the statement of financial position prepared
under EU IFRS IAS/IFRS reclassifications
(in euros)
Statement of
financial position
ITALIAN GAAP at
December 31, 2011
A) Elimination of
intangible assets
B) Accounting for
leases under IAS 17
C) Employee benefits
IAS 19
D) Application of IAS
16
E) Adjustment of
inventories
F) Elimination of
goodwill amortization
G) Application of
amortized cost method
A) Reclassification of
leasehold improvements
Statement of
financial position
IAS/IFRS at
December 31, 2011
ASSETS
NON-CURRENT ASSETS
Property, plant and equipment 17,300,289 6,514 188,122 (606,344) 392,080 17,280,661
Intangible assets 768,451 (47,314) (392,080) 329,057
Goodwill 18,270,000 2,030,000 20,300,000
Investments in other companies 2,738,082 2,738,082
Loans receivable from Group companies -
medium/long-term 0 0
Deferred tax assets 6,431,993 12,811 (684) 605,571 704,692
Other non-current assets 42,816 42,816
Other financial assets 0 0
TOTAL NON-CURRENT ASSETS 45,551,632 (27,989) 187,437 0 (772) 0 2,030,000 0 0 41,395,308
CURRENT ASSETS
Inventories 32,033,722 32,033,722
Trade receivables 42,744,889 42,744,889
Tax receivables 3,592,874 3,592,874
Other current assets 204,545 204,545
Loans receivable from Group companies -
short-term 0 0
Cash and cash equivalents 3,286,076 3,286,076
TOTAL NON-CURRENT ASSETS 81,862,105 0 0 0 0 0 0 0 0 81,862,105
TOAL ASSETS 127,413,737 (27,989) 187,437 0 (772) 0 2,030,000 0 0 123,257,413
EQUITY AND LIABILITIES
EQUITY
Share capital 3,000,000 0 0 0 0 0 0 0 3,000,000
Legal reserve 111,140 0 0 0 0 0 0 0 111,140
Other reserves 21,776,337 0 0 0 0 0 0 0 21,776,337
Retained earnings (Accumulated deficit) (16,544,523) (27,989) 126,951 413,946 (415,952) 0 2,030,000 9,482 (14,408,085)
Total equity 8,342,953 (27,989) 126,951 413,946 (415,952) 0 2,030,000 9,482 0 10,479,391
Non-controlling interests
TOTAL EQUITY 8,342,953 (27,989) 126,951 413,946 (415,952) 0 2,030,000 9,482 0 10,479,391
NON-CURRENT LIABILITIES
Borrowings from banks and other lenders 35,213,550 (13,079) 35,200,471
Other financial liabilities 0 0
Loans payable to Group companies -
medium/long-term 0 0
Provisions 100,000 100,000
Deferred tax liabilities 287,639 57,424 157,014 415,179 3,597 920,854
Other non-current liabilities 0 0
Employee benefit obligations 5,177,263 (570,960) 4,606,303
TOTAL NON-CURRENT LIABILITIES 40,778,452 0 57,424 (413,946) 415,179 0 0 (9,482) 0 40,827,628
CURRENT LIABILITIES
Borrowings from banks and other lenders 19,788,742 3,062 19,791,804
Loans payable to Group companies -
short-term 4,929,000 4,929,000
Other financial liabilities 0 0
Trade payables 49,731,304 49,731,304
Other payables 3,843,286 3,843,286
Taxes payable 0 0
TOTAL CURRENT LIABILITIES 78,292,332 0 3,062 0 0 0 0 0 0 78,295,394
TOTAL EQUITY AND LIABILITIES 127,413,738 (27,989) 187,437 0 (772) 0 2,030,000 0 0 129,602,413
IAS/IFRS adjustments

31
Appendix 3: Reconciliation between the statement of comprehensive income of Intercos Europe S.p.A. for the year ended December 31, 2011 of prepared
under Italian GAAP and reclassified according to the elections made by the Company for the EU IFRS financial statements and the statement of
comprehensive income prepared under EU IFRS
IAS/IFRS reclassifications
(in euros)
Income statement
ITALIAN GAAP
Year ended
December 31, 2011
A) Elimination of
intangible assets
B) Accounting for
leases under IAS
17
C) Employee
benefits IAS 19
D) Application of
IAS 16
E) Adjustment of
inventories
F) Elimination of
goodwill
amortization
G) Application of
amortized cost
method
A) Reclassification of
leasehold improvements
Statement of
comprehensive
income IAS/IFRS
Year ended
December 31, 2011
Revenues 83,596,860 83,596,860
Capitalized internal construction costs 0 0
Other income 2,392,395 2,392,395
Purchases of raw materials, semifinished
products and consumables (26,878,465) (26,878,465)
Change in inventories of raw materials,
semifinished and finished products 1,891,444 (586,550) 1,304,894
Purchases of services and leases and rents (40,189,469) 68,289 (40,121,180)
Employee benefit expenses (23,551,406) 155,721 (23,395,685)
Accruals 0 0
Other operating expenses (1,641,683) (1,641,683)
Operating profit (loss) before
depreciation, amortization. Impairment
reversals (losses) and nonrecurring
expenses (4,380,324) 0 68,289 155,721 0 (586,550) 0 0 0 (4,742,864)
Depreciation, amortization and impairment
reversals (losses) (5,817,098) 17,721 (106,092) 29,668 2,030,000 (3,845,801)
Valuation adjustments to financial assets 0 0
Nonrecurring income (expenses) (10,569,819) (10,569,819)
Operating profit (loss) (20,767,240) 17,721 (37,803) 155,721 29,668 (586,550) 2,030,000 0 0 (19,158,483)
Finance income 135,579 135,579
Finance expenses (1,519,961) (1,776) (76,383) 2,403 0 (1,595,717)
Income taxes 5,292,931 (5,564) 12,428 (21,818) (9,316) 184,177 (661) 5,452,176
PROFIT (LOSS) FOR THE YEAR (16,858,691) 12,157 (27,151) 57,520 20,352 (402,373) 2,030,000 1,742 0 0 (15,166,444)
Other components of comprehensive
income
Remeasurements of employee defined
benefit plan 133,986 133,986
Total Other components of comprehensive
income 0 0 0 133,986 0 0 0 0 0 133,986
Total comprehensive income (loss) for the
year (16,858,691) 12,157 (27,151) 191,506 20,352 (402,373) 2,030,000 1,742 0 (15,032,459)
IAS/IFRS adjustments
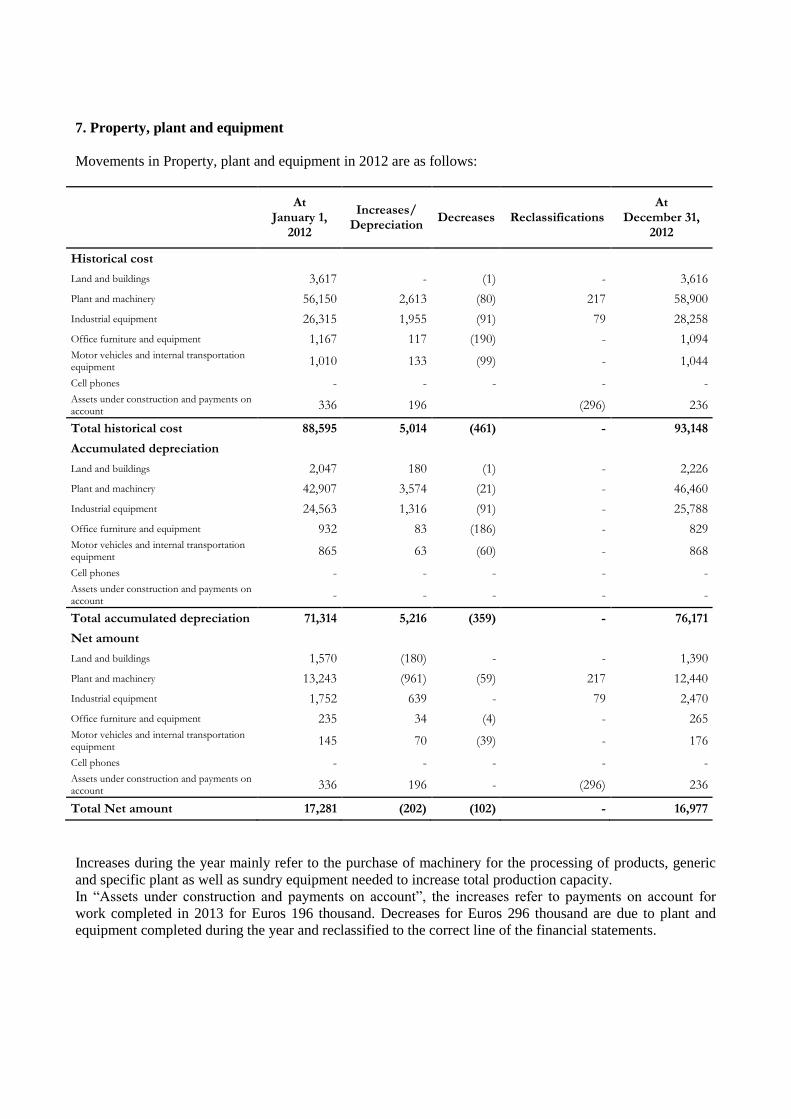
7. Property, plant and equipment
Movements in Property, plant and equipment in 2012 are as follows:
At
January 1, 2012
Increases/
Depreciation
Decreases Reclassifications At
December 31, 2012
Historical cost
Land and buildings 3,617 - (1) - 3,616
Plant and machinery 56,150 2,613 (80) 217 58,900
Industrial equipment 26,315 1,955 (91) 79 28,258
Office furniture and equipment 1,167 117 (190) - 1,094
Motor vehicles and internal transportation equipment
1,010 133 (99) - 1,044
Cell phones - - - - -
Assets under construction and payments on account
336 196 (296) 236
Total historical cost 88,595 5,014 (461) - 93,148
Accumulated depreciation
Land and buildings 2,047 180 (1) - 2,226
Plant and machinery 42,907 3,574 (21) - 46,460
Industrial equipment 24,563 1,316 (91) - 25,788
Office furniture and equipment 932 83 (186) - 829 Motor vehicles and internal transportation equipment
865 63 (60) - 868
Cell phones - - - - -
Assets under construction and payments on account
- - - - -
Total accumulated depreciation 71,314 5,216 (359) - 76,171
Net amount
Land and buildings 1,570 (180) - - 1,390
Plant and machinery 13,243 (961) (59) 217 12,440
Industrial equipment 1,752 639 - 79 2,470
Office furniture and equipment 235 34 (4) - 265
Motor vehicles and internal transportation equipment
145 70 (39) - 176
Cell phones - - - - - Assets under construction and payments on account
336 196 - (296) 236
Total Net amount 17,281 (202) (102) - 16,977
Increases during the year mainly refer to the purchase of machinery for the processing of products, generic
and specific plant as well as sundry equipment needed to increase total production capacity.
In “Assets under construction and payments on account”, the increases refer to payments on account for
work completed in 2013 for Euros 196 thousand. Decreases for Euros 296 thousand are due to plant and
equipment completed during the year and reclassified to the correct line of the financial statements.
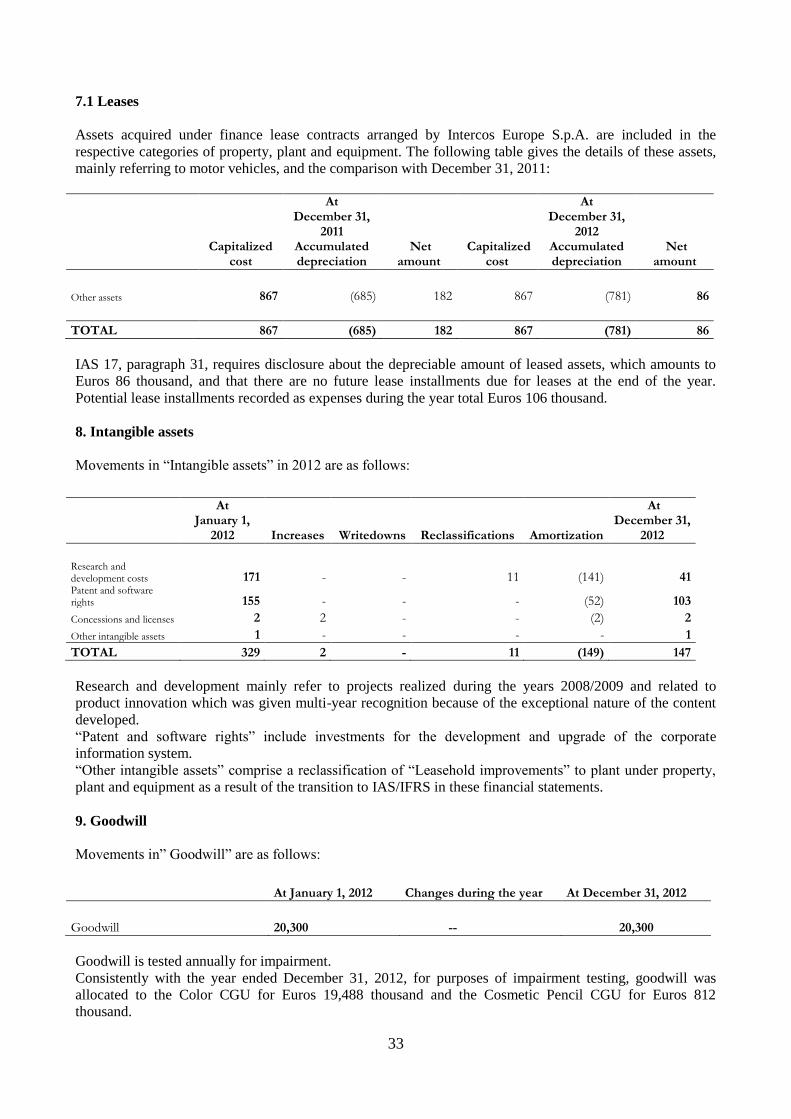
33
7.1 Leases
Assets acquired under finance lease contracts arranged by Intercos Europe S.p.A. are included in the
respective categories of property, plant and equipment. The following table gives the details of these assets,
mainly referring to motor vehicles, and the comparison with December 31, 2011:
Capitalized
cost
At December 31,
2011 Accumulated depreciation
Net amount
Capitalized cost
At December 31,
2012 Accumulated depreciation
Net amount
Other assets 867 (685) 182 867 (781) 86
TOTAL 867 (685) 182 867 (781) 86
IAS 17, paragraph 31, requires disclosure about the depreciable amount of leased assets, which amounts to
Euros 86 thousand, and that there are no future lease installments due for leases at the end of the year.
Potential lease installments recorded as expenses during the year total Euros 106 thousand.
8. Intangible assets
Movements in “Intangible assets” in 2012 are as follows:
At January 1,
2012 Increases Writedowns Reclassifications Amortization
At December 31,
2012
Research and development costs 171 - - 11 (141) 41 Patent and software rights 155 - - - (52) 103
Concessions and licenses 2 2 - - (2) 2
Other intangible assets 1 - - - - 1
TOTAL 329 2 - 11 (149) 147
Research and development mainly refer to projects realized during the years 2008/2009 and related to
product innovation which was given multi-year recognition because of the exceptional nature of the content
developed.
“Patent and software rights” include investments for the development and upgrade of the corporate
information system.
“Other intangible assets” comprise a reclassification of “Leasehold improvements” to plant under property,
plant and equipment as a result of the transition to IAS/IFRS in these financial statements.
9. Goodwill
Movements in” Goodwill” are as follows:
At January 1, 2012
Changes during the year At December 31, 2012
Goodwill 20,300 -- 20,300
Goodwill is tested annually for impairment.
Consistently with the year ended December 31, 2012, for purposes of impairment testing, goodwill was
allocated to the Color CGU for Euros 19,488 thousand and the Cosmetic Pencil CGU for Euros 812
thousand.

34
The impairment test was developed on the basis of the plan drawn up by company management. In
particular, management used the 2012 economic budget prepared by the Group at the end of 2012, approved
by the board of directors on March 10, 2013, and the net assets development plan 2014 with the 2010-2014
economic, financial position and cash flows plan approved on June 4, 2010, adjusted to take into account the
economic and financial effects of not having implemented a capital expenditures program initially included
in the above plan and future years’ growth.
The impairment test was conducted by comparing the total carrying amount of goodwill and the aggregate
net assets able to independently produce cash flows (CGU), to which goodwill can reasonably be allocated,
with the higher of the value in use of the CGU and the recoverable amount through sale. In particular, the
value in use was determined using the discounted cash flow method by discounting to present value the
operating flows from the economic and financial projections relative to a maximum period of three years
based on assumptions included in the plan officially approved by management. The valuation model
determines the value in use as the sum of operating cash flows (defined as the gross operating margin net of
implicit income tax on operating profit, in addition to changes in net working capital, changes in employee
severance indemnities and acquisitions and sales of fixed assets) for each year of the plan. The cash flows
were discounted at a WACC rate of 8.2% (Color CGU) and 8.41% (Cosmetic Pencil CGU). The terminal
value was determined by applying a perpetual growth factor that basically represents the expected inflation
rate of 2% to the operating cash flows for the last year of the normalized plan.
As at December 31, 2012, there were no impairment losses arising on recorded goodwill resulting from the
impairment tests conducted since the value in use determined for each CGU identified was higher than the
relative carrying amount.
10. Investments in subsidiaries
Movements in “Investments in subsidiaries” are as follows:
At December 31, 2012
Beginning balance 2,738
Disposals (2,738)
Writedowns 0
Contribution 0
Total 0
Following the resolution passed by the board of directors on October 3, 2011, as part of the operations for the
reorganization of the Company, during the year ended December 31, 2012 Intercos Europe finalized the sale
of its 100% investment held in Interfila Shanghai Co. Ltd. to the parent, Intercos S.p.A., at its carrying
amount of Euros 2.7 million.
11. Deferred tax assets
Deferred tax assets amount to Euros a 3,400 thousand at December 31, 2012, with a decrease of Euros 3,650
thousand compared to the prior year; the rates used were 27.5% for IRES and 3.90% for IRAP.
The following table gives the details by source of deferred tax assets at December 31, 2012 and 2011.
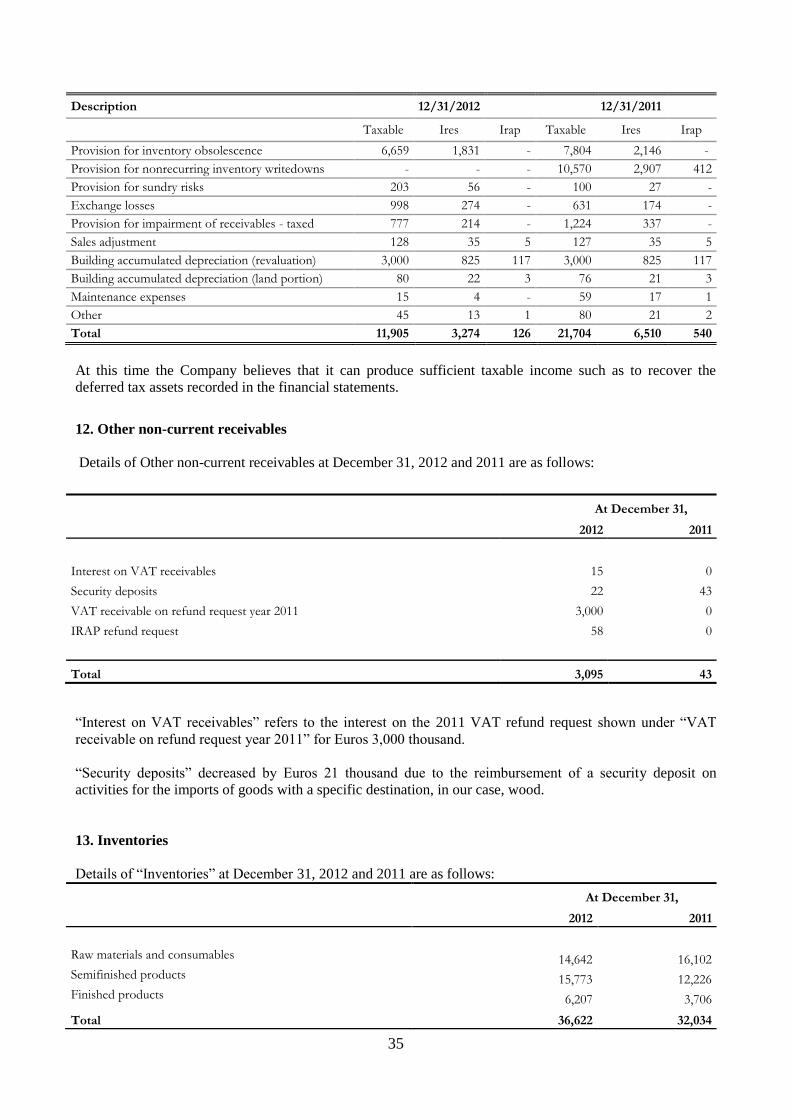
35
Description 12/31/2012 12/31/2011
Taxable Ires Irap Taxable Ires Irap
Provision for inventory obsolescence 6,659 1,831 - 7,804 2,146 -
Provision for nonrecurring inventory writedowns - - - 10,570 2,907 412
Provision for sundry risks 203 56 - 100 27 -
Exchange losses 998 274 - 631 174 -
Provision for impairment of receivables - taxed 777 214 - 1,224 337 -
Sales adjustment 128 35 5 127 35 5
Building accumulated depreciation (revaluation) 3,000 825 117 3,000 825 117
Building accumulated depreciation (land portion) 80 22 3 76 21 3
Maintenance expenses 15 4 - 59 17 1
Other 45 13 1 80 21 2
Total 11,905 3,274 126 21,704 6,510 540
At this time the Company believes that it can produce sufficient taxable income such as to recover the
deferred tax assets recorded in the financial statements.
12. Other non-current receivables
Details of Other non-current receivables at December 31, 2012 and 2011 are as follows:
At December 31,
2012 2011
Interest on VAT receivables 15 0
Security deposits 22 43
VAT receivable on refund request year 2011 3,000 0
IRAP refund request 58 0
Total 3,095 43
“Interest on VAT receivables” refers to the interest on the 2011 VAT refund request shown under “VAT
receivable on refund request year 2011” for Euros 3,000 thousand.
“Security deposits” decreased by Euros 21 thousand due to the reimbursement of a security deposit on
activities for the imports of goods with a specific destination, in our case, wood.
13. Inventories
Details of “Inventories” at December 31, 2012 and 2011 are as follows:
At December 31,
2012 2011
Raw materials and consumables 14,642 16,102 Semifinished products 15,773 12,226 Finished products 6,207 3,706
Total 36,622 32,034

36
The amount of inventories is influenced by the change in orders and relative deliveries at the year-end cutoff
date. This phenomenon is also affected by the type of service called for by such sale orders, which,
depending on the situation, are finished products in bulk, semifinished products and packaged products.
The above balance is net of the provision for inventory writedowns, which shows the following movements
during 2012:
At December 31, 2011 Accrual Utilization At December 31, 2012
Provision for raw materials writedowns 2,888 1,150 (2,170) 1,868
Provision for semifinished products writedowns 5,754 3,565 (6,268) 3,051
Provision for finished products writedowns 2,957 999 (2,216) 1,739
Total 11,599 5,714 (10,654) 6,658
14. Trade receivables
Details of “Trade receivables” at December 31, 2012 and 2011 are as follows:
At December 31,
2012 2011
Receivables from third party customers 27,514 34,168
Receivables from Group companies 4,605 10,147
Provision for impairment of receivables (801) (1,570)
Total 31,318 42,745
In order to provide an indication of estimated realizable value, the nominal amount of receivables is adjusted
by the recognition of a provision for impairment, based on an analysis of the balances, whose movement
during the year is analyzed in the following table:
At December 31, 2012
Beginning balance (1,570) Accrual (23)
Utilization 792
Total (801)
Additional details on credit risk are described in the introduction to the notes under “Risk Management” in
the basis of presentation of the financial statements.

37
15. Current taxes receivable
At December 31,
2012 2011
VAT receivable 1,054 3,450
IRAP receivable - 143
Total 1,054 3,593
16. Other current receivables
Details of “Other current receivables” at December 31, 2012 and 2011 are as follows:
At December 31,
2012 2011
Advances to suppliers 224 11
Sundry receivables 22 176
Accrued income and prepaid expenses 78 18
Receivables from parent under the consolidated tax procedure 1,418 -
Total 1,742 205
“Sundry receivables” include a receivable from an insurance company for the payment of a claim made at
the Dovera production site.
“Accrued income and prepaid expenses” at December 31, 2012 include prepaid rent, insurance, utilities and
hires for a total of Euros 78 thousand.
“Receivables from parent under the consolidated tax procedure” total Euros 1,418 thousand and include Ires
taxes receivable on the tax loss for the year (Euros 30 thousand) and on the excess Rol transferred to the
parent (Euros 445 thousand), withholding taxes (Euro 5 thousand), receivables on the claims filed (also on
behalf of the merged company Interfila S.r.l.) for the refund of tax payments of Ires made in excess in the
years 2007-2008-2009-2010-2011 (Euros 870 thousand) as a consequence of the non-deductibility of payroll
costs relating to Irap and the receivable for the refund of Ires following the deductibility of 10% of Irap ex
Legislative Decree 185/08 (Euros 68 thousand).
17. Cash and cash equivalents
Details of “Cash and cash equivalents” at December 31, 2012 and 2011 are as follows:
At December 31,
2012 2011
Bank and postal deposits 16,243 3,239 Cash on hand 658 47
Total 16,903 3,286
Cash and cash equivalents are available and can be immediately used; at this date there are no restricted cash
balances.
A complete financial analysis is presented in the statement of cash flows.

38
18. Equity
Equity amounts to Euros 17,535 thousand (Euros 10,479 thousand at December 31, 2011).
The composition and changes in equity are presented in the statement of changes in equity.
Share capital
As a result of the reorganization of the Group, during the year 2011 Intercos Europe S.p.A. (formerly Color
Cosmetics S.r.l.) increased its share capital to an amount equal to the share capital of the merged company
Interfila S.r.l., from Euros 35,700 to Euros 555,700 on the exchange from the merger.
The shareholders’ meeting of Color Cosmetics S.r.l. held on September 22, 2011, under the minutes filed by
the notary public in Milan, Manuela Agostini, passed a resolution, among other things, to further increase
share capital by Euros 2,444,300 – with additional paid-in capital of Euros 13,555,700 – from Euros 555,700
to Euros 3,000,000 to service the contribution of Intercos S.p.A.’s industrial business.
Share capital thus amounts to Euros 3,000,000 and consists of 3,000,000 shares of par value Euros 1 each.
The following table summarizes the individual items of equity according to their source and nature:
Nature/Description (thousands of euros)
Balance at December 31, 2012
Share capital 3,000
Additional paid-in capital (*) 756 A, B, C
Revaluation reserve 2,902 A,B
Reserve ex art 55 DPR 917/86 47 A,B
Other reserves (*) (**) 1,686 A,B,C
Legal reserve 111 B
Extraordinary reserve 1,527 A,B,C
Profit for the year (*) 7,506 -
Equity at 12/31/2012 17,535
A: Available for capital increase
B: Available to cover losses
C: Distributable to shareholders
(*) Pursuant to art. 2431 of the Italian Civil Code, the entire amount of this reserve can be distributed only on condition that the legal
reserve has reached the limit established by art. 2430 of the Italian Civil Code.
(**) These reserves were formed following the adoption of IFRS.
19. Borrowings from banks and other lenders
The shareholders’ meeting of Color Cosmetics S.r.l., now Intercos Europe S.p.A, held on September 22,
2011, under the minutes filed by the notary public in Milan, Manuela Agostini, passed a resolution, among
other things, to contribute a portion of the debt carried by Intercos S.p.A. regarding the loan contract in effect
with a syndicate of lending banks of which Banca IMI S.p.A. is the agent bank.
Specifically, the portion of the loan which Intercos Europe S.p.A. has assumed as a result of the contribution
amounts to Euros 35,000,000 of Tranche “D” of the loan contract; the debt was taken over and guaranteed by
a special lien on its assets. The parent, Intercos S.p.A. also pledged the shares representing the share capital
of our company.

39
Details of medium/long-term debt outstanding at December 31, 2012 together with the relative due dates
referring to the loan with the banking syndicate are as follows:
Bank Amount Internal rate of return
Intercos Europe S.p.A. Banking syndicate 35,000 4.38% Tranche D (EUR)
Total (*) 35,000
Intercos Europe S.p.A. Other lenders 127 3.75% Law 46 /82 grant 11051 /May
Total 127
(*) Debt secured by real guarantees (pledge on assets and special liens).
Details of Borrowings from banks and other lenders with an indication of the relative due dates are provided
in the following table:
December 31, 2011
Within 1 year 1 to 5 years Beyond 5 years
TOTAL
Bank overdrafts and advance accounts 18,832 0 0 0
Payable to Banca Intesa 0 35,000
Finance leases payables and factoring 891 35 0 0
Debt under Law 46/Mediocredito 69 166
Total 19,792 35,201 0 0
December 31, 2012
Within 1 year 1 to 5 years Beyond 5 years TOTAL
Bank overdrafts and advance accounts 18 0 0 0
Payable to Banca Intesa 0 35,000 0 0
Finance leases payables and factoring 73 0 0 0
Debt under Law 46/Mediocredito 71 56 0 0
Total 162 35,056 0 0
20. Provisions
Movements in “Provisions” in 2012 were as follows:

40
At December 31, 2012 At December 31, 2011
Beginning balance 100 28
Accrual 130
Utilization (27) (121)
Contribution 0 193
Total 203 100
The accrual for the year was made as a prudent measure to cover pending labor disputes at the end of the
year. The utilization of the provision account refers to the settlement of labor disputes during the course of
2012.
21. Deferred tax liabilities
Deferred tax liabilities amount to Euros 591 thousand, with a decrease of Euros 330 thousand compared to
the prior year. For a better understanding, details are provided in the following table of the temporary
differences which gave rise to the calculation of deferred income taxes at the rate of 27.5% for IRES tax and
3.90% for IRAP tax.
Description 12/31/2012 12/31/2011
Taxable Ires Irap Taxable Ires Irap
IAS differences on buildings, plant and machinery 1,103 303 43 1,322 363 52
PPE revaluation - - - 67 18 3
Exchange gains 501 138 - 853 235 -
Realized gains - - - 4 1 -
Elimination of tax effect on PPE 95 7 3 172 9 5
Difference on employee severance indemnities 179 49 - 571 157 -
Machinery leases (IAS 17) 87 24 3 183 50 7
IAS 39 effective interest 15 4 - 13 4 -
Other 59 17 - 59 17 -
Total 2,039 542 49 3,244 854 67
22. Employee benefit obligations
Movements in “Employee benefit obligations” in 2012 are as follows:
At December 31, 2012 At December 31, 2011
Beginning balance 4,607 4,931
Interest cost 215 76
Utilization (166) (216)
Actuarial gains/losses 450 (185)
Total 5,106 4,606
The assumptions used in determining the actuarial value of Employee benefit obligations for the year 2012
are as follows:
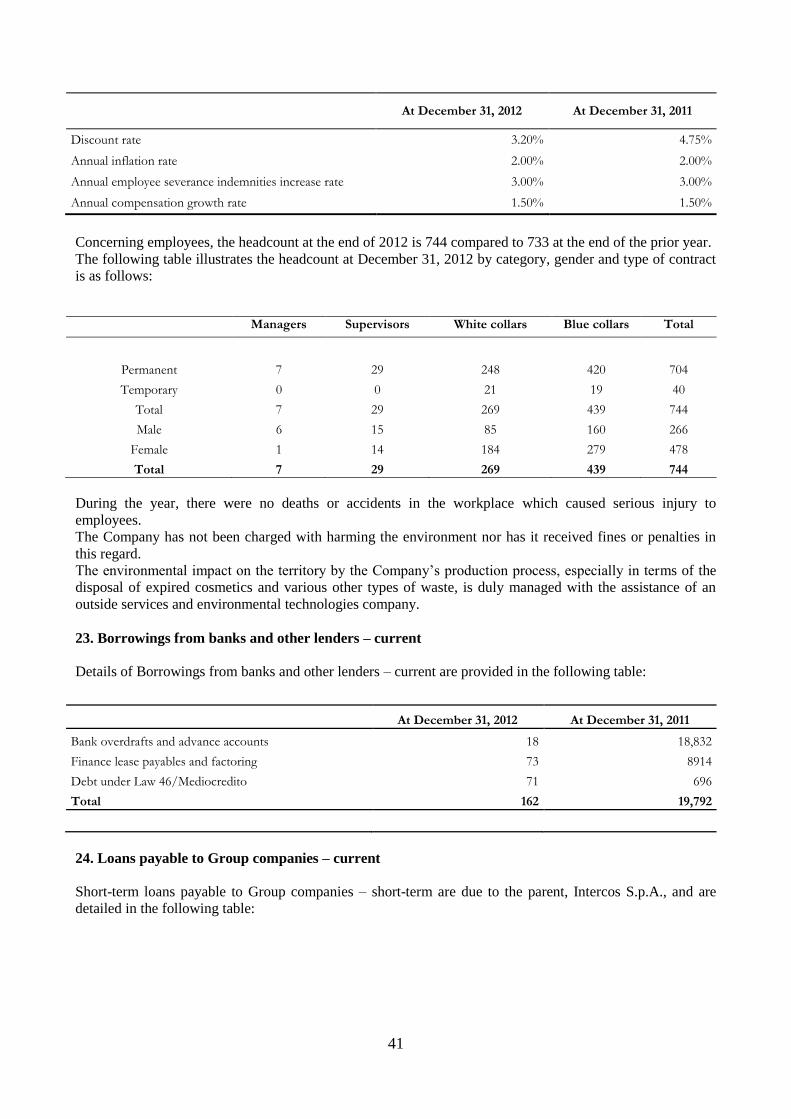
41
At December 31, 2012 At December 31, 2011
Discount rate 3.20% 4.75%
Annual inflation rate 2.00% 2.00%
Annual employee severance indemnities increase rate 3.00% 3.00%
Annual compensation growth rate 1.50% 1.50%
Concerning employees, the headcount at the end of 2012 is 744 compared to 733 at the end of the prior year.
The following table illustrates the headcount at December 31, 2012 by category, gender and type of contract
is as follows:
Managers Supervisors White collars Blue collars Total
Permanent 7 29 248 420 704
Temporary 0 0 21 19 40
Total 7 29 269 439 744
Male 6 15 85 160 266
Female 1 14 184 279 478
Total 7 29 269 439 744
During the year, there were no deaths or accidents in the workplace which caused serious injury to
employees.
The Company has not been charged with harming the environment nor has it received fines or penalties in
this regard.
The environmental impact on the territory by the Company’s production process, especially in terms of the
disposal of expired cosmetics and various other types of waste, is duly managed with the assistance of an
outside services and environmental technologies company.
23. Borrowings from banks and other lenders – current
Details of Borrowings from banks and other lenders – current are provided in the following table:
At December 31, 2012 At December 31, 2011
Bank overdrafts and advance accounts 18 18,832
Finance lease payables and factoring 73 8914
Debt under Law 46/Mediocredito 71 696
Total 162 19,792
24. Loans payable to Group companies – current
Short-term loans payable to Group companies – short-term are due to the parent, Intercos S.p.A., and are
detailed in the following table:

42
At December 31, 2012 At December 31, 2011
Intercos S.p.A. 14,133 4,929
Total 14,133 4,929
These are trade payables due to the parent which became an interest-bearing intercompany loan with
repayment due by the end of 2013.
25. Trade payables
Details of “Trade payables” at December 31, 2012 and 2011 are as follows:
At December 31,
2012 2011
Trade payables to third party suppliers 26,798 26,416
Trade payables to Group companies 26,630 23,315
Total 53,428 49,731
26. Other payables
Details of “Other payables” at December 31, 2012 and 2011 are as follows:
At December 31,
2012 2011
Taxes payable 560 351
Payables to employees 2,346 2,025
Social security agencies payable 1,349 1,220
Payables to tax authorities for withholdings 373 0
Accrued liabilities 106 186
Advances from customers 504 12
Sundry payables 35 49
Total 5,272 3,843
“Taxes payable” include Euros 557 thousand representing the balance of Irap payable for the year 2012, net
of advance payments, and Euros 3 thousand for the remaining substitute tax payable.
“Payables to employees” principally comprise the employee incentive plan for Euros 1,053 thousand,
including related social security contributions, vacation pay accrued and not taken and related social security
contributions for Euros 1,565 thousand, the thirteenth month salary and related social security contributions
for Euros 284 thousand and other minor payables to employees for Euros 47 thousand.
“Social security agencies payable” refer to social security costs on December compensation to employees,
paid in January for Euros 746 thousand.
“Payables to tax authorities for withholdings” refer for IRPEF withholding taxes on employee compensation
for Euros 370 thousand and advanced withholding taxes on self-employed compensation for the remaining
Euros 3 thousand.

43
“Accrued liabilities” include interest for Euros 86 thousand, insurance premiums for Euros 7 thousand and
other costs for Euros 12 thousand.
26 bis. Guarantees and other commitments
Guarantees provided by the Company refer to sureties and guarantees in favor of third parties (Customs
Office) and on its behalf for Euros 50 thousand at December 31, 2012.
27. Revenues
Details of revenues in 2012 and 2011 are the following:
2012 2011
Revenues from sales to third-party customers 154,741 59,393
Revenues from sales to Group companies 10,278 5,036
Processing and packaging - 16,800
Revenues from warehousing - 2,018
Other revenues - 350
Total 165,019 83,597
A comparison between the two years must obviously take into account the fact that the prior year included
revenues referring to the acquisition of the production business segment contributed by Intercos S.p.A. only
from the date of October 1, 2011.
As regards the analysis of sales to Group companies, reference should be made to “Related party
transactions”, whereas details of revenues divided by product line and commercial geographic area are
provided below as follows:
2012 2011
Color line 113,972 46,360
Cosmetic Pencils line 51,047 37,237
Total 165,019 83,597
2012 2011
Italy 20,795 26,666
France 42,227 16,944
U.S.A. 61,312 26,908
EMEA 36,402 12,028
Asia 4,283 1,051
Total 165,019 83,597
28. Other income
Details of “Other income” in 2012 and 2011 are as follows:

44
2012 2011
Expense recoveries 1,623 1,003
Other revenue from expenses recharged 2,034 798
Insurance compensation 47 11
Rent income 50 50
Prior period income, sundry allowances 336 416
Gain on disposal of property, plant and equipment 12 114
Total 4,102 2,392
“Expense recoveries” and “Other revenue from expenses recharged” include intercompany income for a total
of Euros 1,343 thousand.
29. Purchases of raw materials, semifinished products and consumables
Details of “Purchases of raw materials, semifinished products and consumables” in 2012 and in 2011 are as
follows:
2012 2011
Purchase of raw materials 18,220 6,817
Purchase of packaging materials 30,720 13,075
Purchase of semifinished products and consumables 3,963 1,427
Purchase of sundry materials 406 340
Purchase of finished products 456 4,571
Heating oil 608 328
Stationery and forms 111 72
Purchase of samples and sample lines 29 57
Pilot molds 70 61
Work clothing 149 130
Total 54,732 26,878
30. Change in inventories of raw materials, semifinished and finished products
The positive change in the balance of inventories of “Raw materials, semifinished and finished products” is
analyzed in the following table:
2012 2011
Raw materials (826) 458
Packaging materials (820) (1,312)
Consumables (185) (161)
Maintenance materials 0 (16)
Semifinished products 4,278 644
Finished products 1,771 (918)
Total 4,588 (1,305)

45
31. Purchases of services and leases and rents
Details of “Purchases of services and leases and rents” in 2012 and 2011 are as follows:
2012 2011
Shipping on sales 1,317 600
Shipping on purchases 2,088 898
Other shipping 1,321 656
Processing and packaging 24,275 18,927
Commissions and royalties 12,000 2,654
Sundry services from parent 8,542 8,728
Services, logistics and warehousing 930 821
Maintenance 2,373 1,064
Sundry utilities 2,758 1,282
Legal and notary fees 85 140
Board of statutory auditors’ compensation 36 39
Consulting fees 994 771
Insurance 248 146
Cleaning 728 408
Security 469 287
Rent expense 1,848 929
Waste disposal 662 326
Laboratory analyses 834 272
Hires 463 406
Bank/factoring commissions and fees 142 87
Other costs 1,085 680
Total 63,198 40,121
“Commissions and royalties” and “Sundry services from parent” include charges made by Intercos S.p.A. in
its function of providing direction and coordination as the parent under service agreements and regulating the
method used to reallocate corporate expenses (charged for Euros 8,507 thousand) and the license agreement,
covering the method used to reallocate license costs for the utilization of manufacturing formulae made
available to the Company (charged for Euros 7,654 thousand).
“Consulting fees” include fees for services rendered by outside personnel and highly qualified technical-
professional people and companies lending support in administration, tax, legal, IT and technical areas.
“Rent expense” includes rent referring to the year relating to the production facilities at Dovera and Agrate
Brianza, charged by Intercos S.p.A., owner of the buildings.
“Other costs” comprise the following expenses:
- employee-related for Euros 584 thousand;
- travel for Euros 377 thousand;
- security and surveillance for Euros 89 thousand;
- EDP for Euros 35 thousand.

46
32. Employee benefit expenses
Details of “Employee benefit expenses” in 2012 and 2011 are as follows:
2012 2011
Salaries and wages 21,066 14,099
Social security 6,951 4,744
Defined contribution plan costs 1,343 958
Temp work 5,724 3,277
Board of directors’ compensation 237 231
Coordinated and continual and occasional collaboration work 218 87
Total 35,539 23,396
For a more correct representation in the financial statements, employee benefit expenses now include the
board of directors’ compensation, coordinated and continual and occasional collaboration work and temp
work costs.
33. Accruals
Accruals amount to Euros 130 thousand and were set aside in respect of “Provisions” in the liabilities to
cover the potential risk of pending labor disputes.
34. Other operating expenses
Details of “Other operating expenses” in 2012 and 2011 are as follows:
2012 2011
Promotional expenses 162 81
Prior period expenses, sundry allowances, fines and penalties 660 1,330
Losses on disposals of fixed assets 28 63
Indirect taxes and duties 69 39
Association membership dues 81 89
Motor vehicle expenses 44 23
Other costs 52 16
Total 1,096 1,641
“Promotional expenses” mainly refer to costs for giveaways and entertainment for Euros 159 thousand and
advertising expenses for Euros 3 thousand.
“Prior period expenses” for the most part include revisions of accruals for costs referring to the prior year.
“Indirect taxes and duties” consist of the IMU property tax for Euros 29 thousand and the garbage tax,
government concession tax, Chamber of Commerce (CCIAA) taxes and registration tax for a total of Euros
40 thousand.
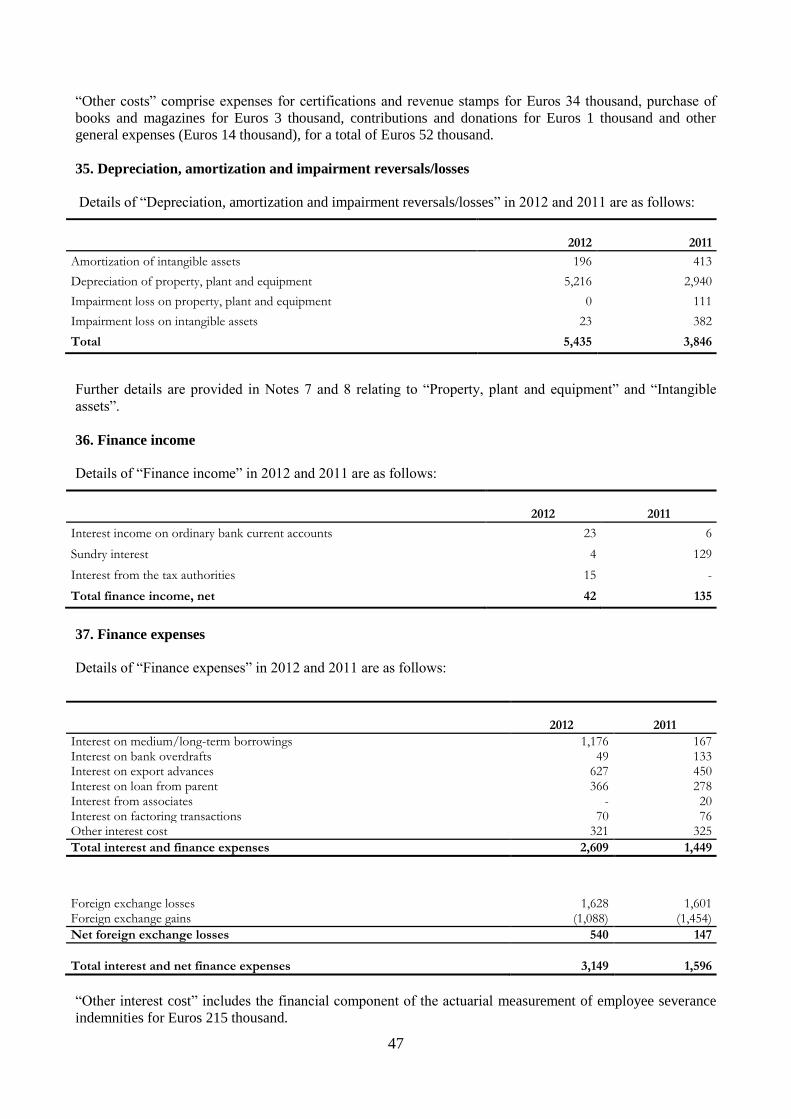
47
“Other costs” comprise expenses for certifications and revenue stamps for Euros 34 thousand, purchase of
books and magazines for Euros 3 thousand, contributions and donations for Euros 1 thousand and other
general expenses (Euros 14 thousand), for a total of Euros 52 thousand.
35. Depreciation, amortization and impairment reversals/losses
Details of “Depreciation, amortization and impairment reversals/losses” in 2012 and 2011 are as follows:
2012 2011
Amortization of intangible assets 196 413
Depreciation of property, plant and equipment 5,216 2,940
Impairment loss on property, plant and equipment 0 111
Impairment loss on intangible assets 23 382
Total 5,435 3,846
Further details are provided in Notes 7 and 8 relating to “Property, plant and equipment” and “Intangible
assets”.
36. Finance income
Details of “Finance income” in 2012 and 2011 are as follows:
2012 2011
Interest income on ordinary bank current accounts 23 6
Sundry interest 4 129
Interest from the tax authorities 15 -
Total finance income, net 42 135
37. Finance expenses
Details of “Finance expenses” in 2012 and 2011 are as follows:
2012 2011
Interest on medium/long-term borrowings 1,176 167 Interest on bank overdrafts 49 133 Interest on export advances 627 450 Interest on loan from parent 366 278 Interest from associates - 20 Interest on factoring transactions 70 76 Other interest cost 321 325
Total interest and finance expenses 2,609 1,449
Foreign exchange losses 1,628 1,601 Foreign exchange gains (1,088) (1,454)
Net foreign exchange losses 540 147
Total interest and net finance expenses 3,149 1,596
“Other interest cost” includes the financial component of the actuarial measurement of employee severance
indemnities for Euros 215 thousand.

48
“Interest on loan from parent” only includes interest expense accrued during the year on the loan granted to
Intercos Europe S.p.A. by the parent Intercos S.p.A.
38. Income taxes
Details of “Income taxes” in 2012 and 2011 are as follows:
2012 2011
Current income taxes 512 (1,638)
Deferred income taxes 3,319 (3,814)
Prior years’ taxes (864) -
Total 2,967 (5,452)
“Current income taxes” include the tax charge for 2012 IRAP for Euros 986 thousand net of the Ires tax due
on the tax loss and on the excess Rol transferred, equal to Euros 474 thousand, transferred to the parent under
the tax consolidation procedure in force.
As for deferred taxes, reference should be made to Notes 11 and 21.
“Prior years’ taxes” include for Euros 870 thousand for the extraordinary gain relating to the claims filed
(also on behalf of the merged company Interfila S.r.l.) for the refund of tax payments of Ires made in excess
in the years 2007-2008-2009-2010-2011 as a consequence of the non-deductibility of payroll costs relating to
Irap net of the extraordinary expense, equal to Euros 6 thousand, due to a higher Irap tax balance referring to
the prior year.
The reconciliation between the theoretical and effective tax rate is as follows.
(thousands of euros)
IRES
Pre-tax profit 10,473
Theoretical IRES (27.5%) 2,880
Temporary differences deductible in future years 8,267
Non-deductible costs 1,275
Temporary differences taxable in future years (1,132)
Reversal of temporary differences of prior years (18,109)
Other deductions and recoveries (884)
Tax loss (110)
IRES on tax loss (30)
IRAP
Difference production value and costs 13,580
Theoretical IRAP (3.9%) 530
Costs not considered for IRAP purposes 11,704
Taxable for IRAP purposes 25,284
IRAP 986

49
39. Remeasurements of employee defined benefit plan
The remeasurements of employee defined benefit plan include the actuarial gains and losses in the year-end
measurement of employee severance indemnities in accordance with IAS 19 for Euros 450 thousand.
40. Related party transactions
Related party transactions do not qualify as either atypical or unusual but fall under the ordinary course of
the business operations. Such transactions, when not concluded at standard conditions or dictated by specific
laws, are nevertheless carried out on an arm’s length basis.
The effect of related party transactions on the income statement in 2012 and the statement of financial
position at December 31, 2012 are as follows, (amounts in thousands of euros).
Transactions with Group companies
Revenues
10,278 They mainly include revenues from sales
analyzed as follows:
- Intercos America Inc. 4,645
- Crb S.A. 284
- Intercos UK 2,159
- Intercos Technology 625
- Interfila Shanghai 805
- Intercos Asia Pacific 1,635
- Intercos Cosmetics Suzhou 51
- Marketing Projects S.r.l. 74
Other revenues and income
1,343
They mainly include revenues from expenses recharged and sundry income from sales
analyzed as follows:
- Intercos S.p.A. 1,055
- Intercos America Inc. 83
- Crb S.A. 182
- Intercos UK 3
- Intercos Technology 2
- Interfila Shanghai 1
- Intercos Cosmetics Suzhou 16
- Kit Productions S.r.l. 1
Finance expenses
366
They refer to interest expenses on loan secured from the parent
due entirely to:
- Intercos S.p.A. 366

50
Purchases of raw materials, semifinished products and consumables
2,541
They mainly refer to purchases of raw materials, packaging, consumables and finished products
analyzed as follows:
- Intercos America Inc. 957
- Crb S.A. 130
- Intercos Technology 161
- Interfila Shanghai 13
- Marketing Projects S.r.l. 508
- Kit Productions S.r.l. 772
Costs for services and leases and rents
26,893
They refer to Service and License Fees, laboratory analyses, processing costs, commissions, rent expenses and other sundry costs
analyzed as follows:
- Intercos America Inc. 1,976
- Crb S.A. 74
- Intercos S.p.A. 18,158
- Intercos Marketing 497
- Ager S.r.l. 602
- Intercos Cosmetics Suzhou 796
- Intercos Paris Sarl 1,342
- Interfila Shanghai 3,358
- Kit Productions S.r.l. 90
Other operating expenses
279
They mainly regard expenses recharged and prior period items
analyzed as follows:
- Intercos S.p.A. 11
- Intercos America Inc. 268
Trade receivables
analyzed as follows:
- Intercos S.p.A. 426
4,605
- Intercos America Inc. 2,706
- Intercos Asia Pacific 1,082
- Interfila Shanghai 26
- Crb S.A. 7 They mainly regard receivables in connection with the Company’s main business
- Kit Productions S.r.l. 13
- Intercos Technology 142
- Intercos Cosmetics Suzhou 24
- Crb Benelux 1
- Intercos UK 178

51
Trade payables
analyzed as follows:
- Intercos S.p.A. 21,273
26,630
- Intercos America Inc. 1,895
- Crb S.A. 80
They mainly include payables in connection with the supply of goods and services
- Intercos Asia Pacific 26
- Interfila Shanghai 969
- Intercos Cosmetics Suzhou 275
- Intercos Technology 6
- Intercos Marketing 273
- Intercos Paris Sarl 1,218
- Kit Productions S.r.l. 450
- Ager S.r.l. 165
Other receivables
1,417
For tax consolidation
entirely due from:
- Intercos S.p.A. 1,417
Financial payables 14,133 14,133 For loan from Intercos S.p.A.
In addition, it should be noted that following the resolution passed by the board of directors on October 3,
2011, as part of the operations for the reorganization of the Company, during the year ended December 31,
2012 Intercos Europe finalized the sale of its 100% investment held in Interfila Shanghai Co. Ltd. to the
parent Intercos S.p.A. at its carrying amount of Euros 2.7 million.
41. Corporate boards at December 31, 2012 and compensation for the year:
Number of members Compensation
(€/1000)
Board of Directors 5 237
Board of Statutory Auditors 3 36
Total 8 273
The persons identified as “key managers” are mainly the Company directors.
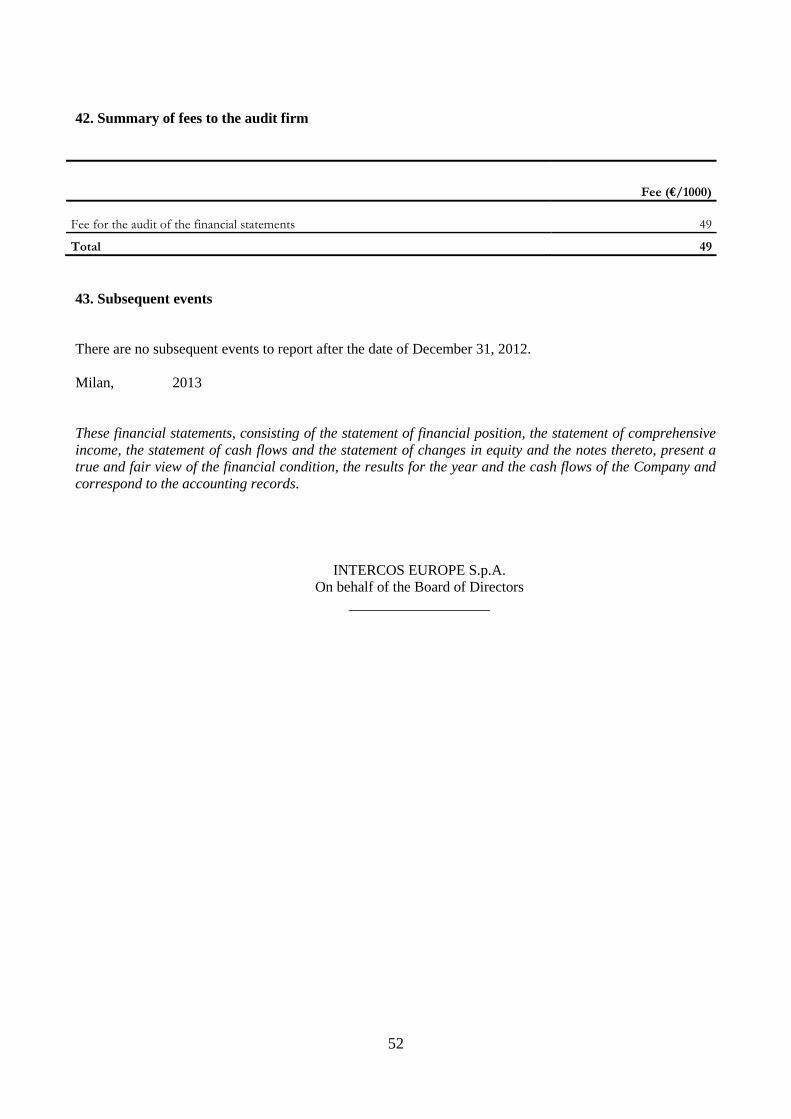
52
42. Summary of fees to the audit firm
Fee (€/1000)
Fee for the audit of the financial statements 49
Total 49
43. Subsequent events
There are no subsequent events to report after the date of December 31, 2012.
Milan, 2013
These financial statements, consisting of the statement of financial position, the statement of comprehensive
income, the statement of cash flows and the statement of changes in equity and the notes thereto, present a
true and fair view of the financial condition, the results for the year and the cash flows of the Company and
correspond to the accounting records.
INTERCOS EUROPE S.p.A.
On behalf of the Board of Directors