Interagency Study on Cocaine Trafficking & Consumption in Brazil Presented to Embassy Country Team...
26
Interagency Study on Cocaine Trafficking & Consumption in Brazil Presented to Embassy Country Team 19 August 2002
-
Upload
kory-mccoy -
Category
Documents
-
view
219 -
download
1
Transcript of Interagency Study on Cocaine Trafficking & Consumption in Brazil Presented to Embassy Country Team...

Interagency Study on Cocaine Trafficking & Consumption in Brazil
Presented to Embassy Country Team
19 August 2002

Background• Study requested by Linear
Committee and US Interdiction Committee fall 1999.
• Over one hundred consultations with law enforcement officers, health officials, academics, and addicts; many meetings engaged scores of participants.
• Participating agencies: CNC, ONI, NAS, DIA, DEA HQ/Brasilia/Sao Paulo.
Cargo ship at Base Anzol, near Tabatinga Brazil
Brazilian Piper Saratoga

Areas of Brazil Visited
• April-May 2000, team visited Brazil’s Northeast, Amazon Basin, & West.
• July 2000, team visited Brazil’s Central West, South, and Southeast.
• During 1998 & 1999, team members visited a number of BR/BO and BR/PA border towns.
Team visited 25 cities throughout Brazil.

Trafficking Conclusions
90 – 110 MT of pure Cocaine base and HCl entered Brazil in 2000.
• Brazilian traffickers quickly adapted to lower Bolivian supplies by developing new routes.
• New shipments from Colombia (of HCl) and Peru (mostly base) largely compensated for slashed supplies from Bolivia.
Brazilian traffickers often fly cocaine into the country via the Amazon to its dry border with Paraguay.
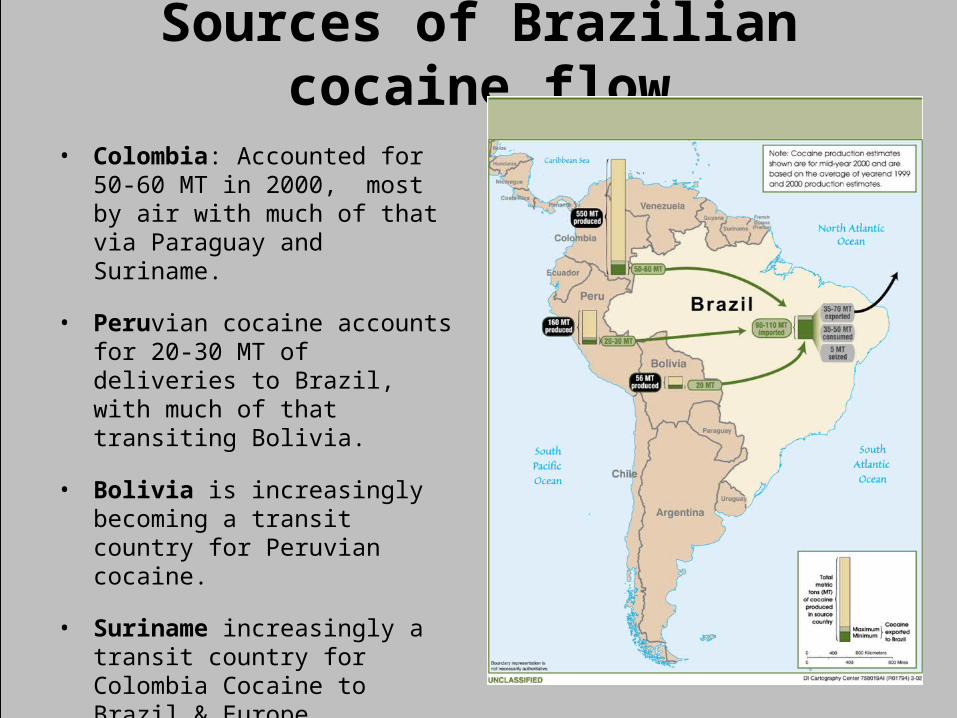
Sources of Brazilian cocaine flow
• Colombia: Accounted for 50-60 MT in 2000, most by air with much of that via Paraguay and Suriname.
• Peruvian cocaine accounts for 20-30 MT of deliveries to Brazil, with much of that transiting Bolivia.
• Bolivia is increasingly becoming a transit country for Peruvian cocaine.
• Suriname increasingly a transit country for Colombia Cocaine to Brazil & Europe
• Some of the flow through Paraguay: involves arms-for-cocaine swaps.
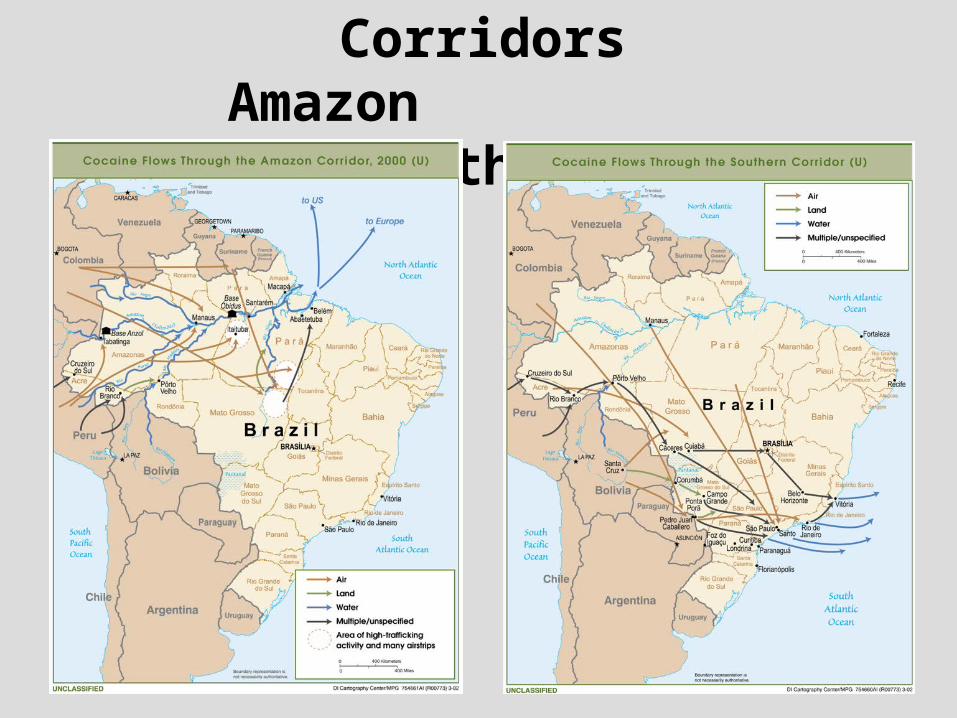
Brazilian Cocaine Movement Corridors Amazon Southern

Sao Paulo: Hub of Brazilian Trafficking
• Most cocaine moves to the major markets in Sao Paulo and Rio.
• Cocaine arrives in Sao Paulo by air and land mainly from Paraguay, Mato Grosso do Sul, or Mato Grosso.
• Hub for both international trafficking—onward though Southeastern ports—and to supply large domestic markets.

Average annual Federal Police seizures1997-2000 (5.9 MT per year)
Remaining 23 states
38%
Amazonas9% Rondonia
9%
Mato Grosso 10%
Mato Grosso do Sul14%
Sao Paulo20%
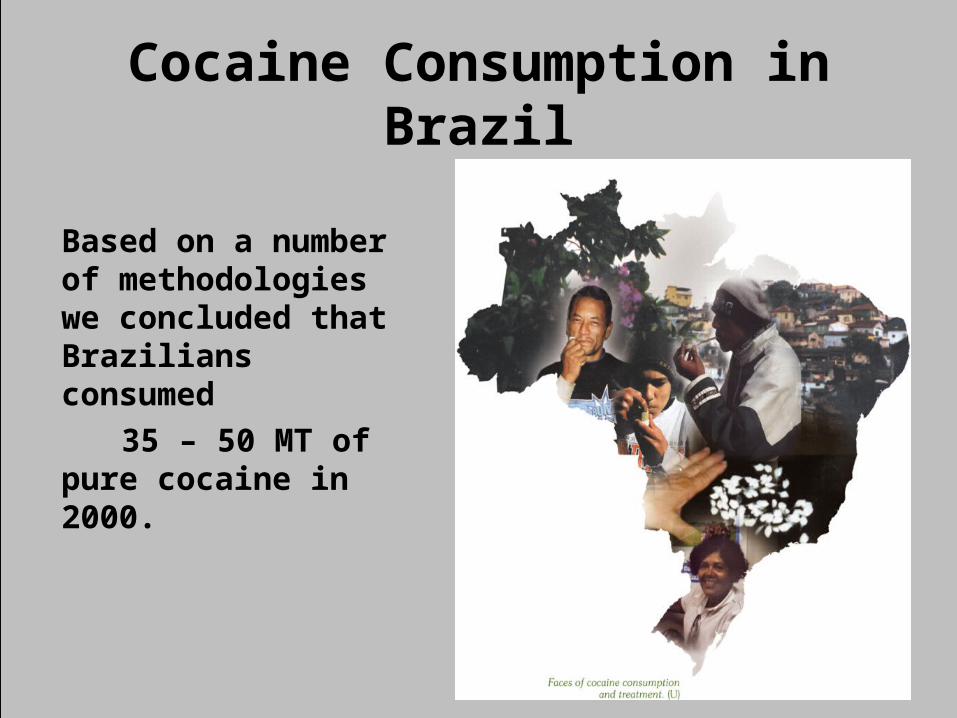
Cocaine Consumption in Brazil
Based on a number of methodologies we concluded that Brazilians consumed
35 – 50 MT of pure cocaine in 2000.

Consumption Conclusions
Cocaine use has increased steadily since 1980.
– Cocaine use is particularly heavy along the traditional trafficking corridor.
– Cocaine use accelerated in the 1990s with the popularization of crack beginning in Sao Paulo.
– Since 1995 crack use has spread south to Paraná, Santa Catarina, and Rio Grande do Sul.
– Crack use has not spread to Rio de Janeiro, but Rio is the second largest market in Brazil.

Cocaine use by region, metric tons 2000
0
10
20
30
40
50
60
All Brazil SouthEast
South NorthEast
CentralWest
North
Baseline estimate Conservative estimate
Cocaine Use by State, metric tons 2000
0
10
20
30
40
50
60
Sao Paulo Rio deJaneiro
Rio Grandedo Sul
Minas Gerais Parana SantaCatarina
Baseline Estimate Conservative Estimate
Cocaine Use
By Region By State

Trends in cocaine consumption
• Crack use is up, but cocaine HCl is still the most popular way to use cocaine.
– Most Brazilians choose HCl over crack because they have the education and personal support systems to understand the enormous risks of using crack.
– Crack is more socially destructive because it is so highly addictive and leads to violent behavior.
• The good news is cocaine injecting is off sharply, because of increased AIDS awareness and the growing crack abuse.

Lesson Learned from the Collapse of the Bolivian Coca Crop in 2000
The cocaine supply was down in 2000 but very difficult to detect because it was masked by changes in purity
1998 Situation: Most Cocaine from Bolivia

Cocaine Use Patterns

Exports from Brazil
• Of the 90 to 110 MT of cocaine entering Brazil, we assess 35 to 70 MT per year are exported.
– Up to 10 metric tons is exported to the United States.
• Most cocaine leaves Brazil via maritime conveyance, with some of that leaving via the Amazon.
Containerized port facilities, Manaus, Brazil
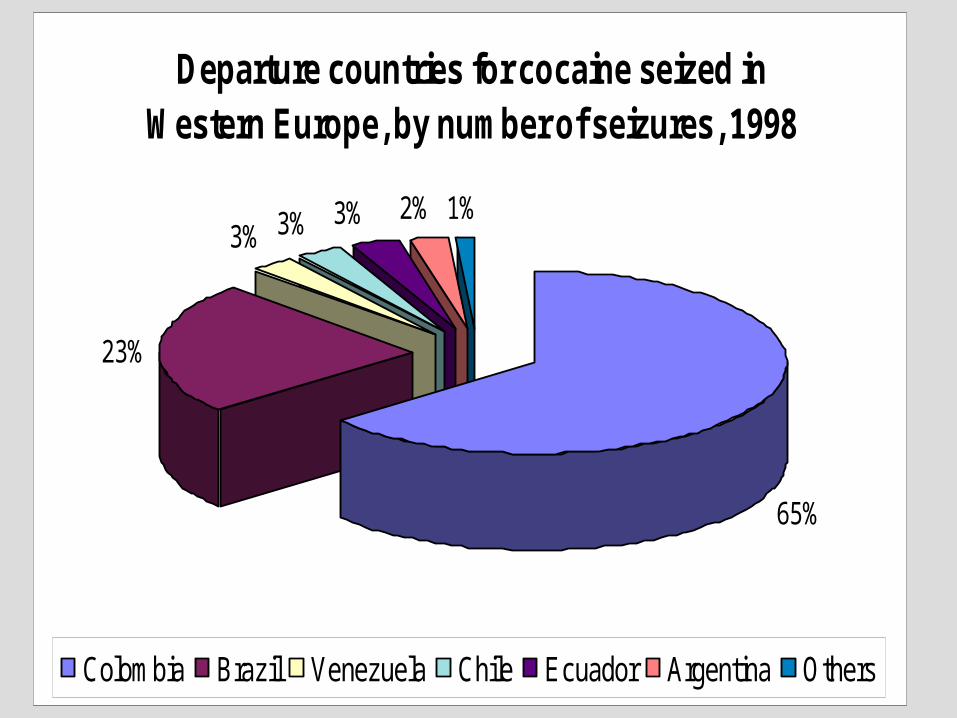
Departure countries for cocaine seized in Western Europe, by number of seizures, 1998
23%
3% 3% 3% 2% 1%
65%
Colombia Brazil Venezuela Chile Ecuador Argentina Others

Brazilian mobile inspection station, Base Anzol, Amazon River, Brazil
Key Findings
• Brazil faces a substantial cocaine threat:
– 90-110 MT Flow
– 35-50 MT Consumption
– 35-70 MT Exports
• Large by any account!

Sunset over port in Rio, Brazil
No Quick Fixes
• Improvements in interdiction in Colombia and the Caribbean will encourage more exports through Brazil.
• As we learned from the emergence of Beira Mar, the domestic market will continue to be fed.
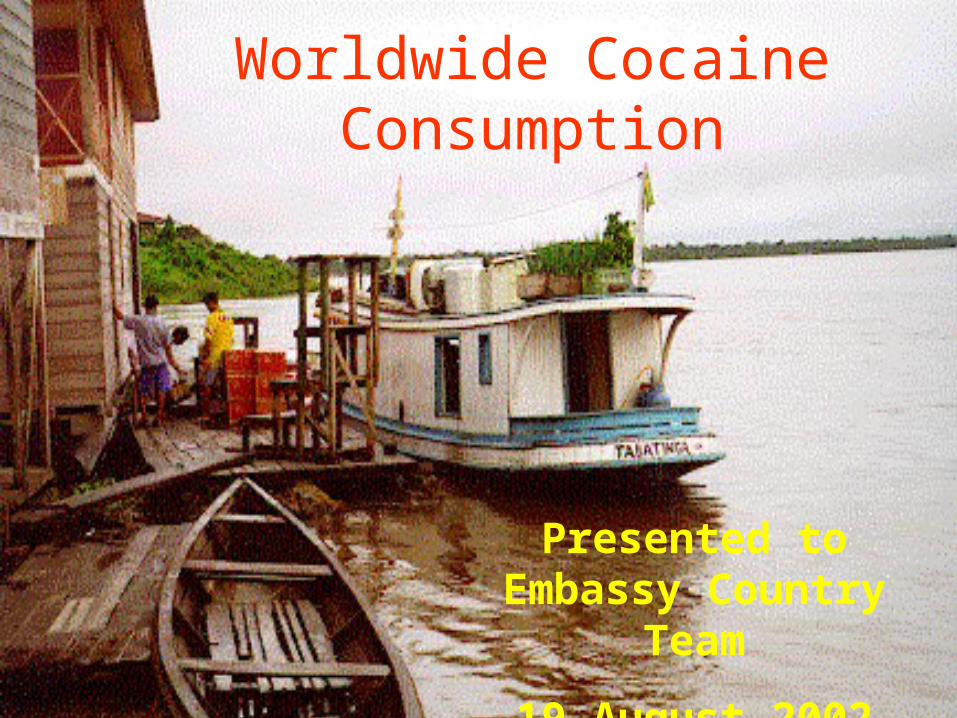
Worldwide Cocaine Consumption
Presented to Embassy Country Team
19 August 2002

0
2
4
6
8
10
12
US Cocaine Consumption
Source: US National Household Survey, SAMSHA
Persons twelve and older who have used cocaine in the last month, or last year, 1979-2000Millions
Last year
Last month
US Cocaine Consumption

European Market Maturing
The dramatic increase in cocaine seizures in non-US markets outside of the Source Zone indicates a growing world markets outside the US.
– Press and other estimates indicate that Europeans consume 100 to 150 metric tons of cocaine
each year.
– There is also substantial cocaine consumption in Canada, Australia, South Africa, and Nigeria, with at least small amounts in virtually every country in the world.
Non-US Arrival/Transit Zone Seizures (U)
0
10
20
30
40
50
60
1986
1987
1988
1989
1990
1991
1992
1993
1994
1995
1996
1997
1998
1999
2000
2001
Met
ric to
ns
European Market Maturing

UK: Cocaine HCl and crack use, 1994-2000, percent of adult use past year
00.20.40.60.8
11.21.41.61.8
1994 1996 1998 2000
Cocaine HCl use,adults last year
Crack use, adults lastyear
Spain: Share of Emergency Room visits by Primary Drug of Use
0
20
40
60
80
100
1996 1997 1998 1999
Cocaine
Heroin
Growing Cocaine Abuse in Europe

Latin America, Most Dynamic Market
Survey data indicate the past-month consumption of cocaine more than doubled in Bolivia and Peru during 1992-98.
CNC estimates that Latin Americans consume over a 190 metric tons of cocaine and another 40 metric tons of HCl equivalent in coca leaf.
0
0.2
0.4
0.6
0.8
1
1.2
1.4
1.6
Bolivia Chile Colombia Peru US Argentina
Cocaine HCl Cocaine Base/Crack
Percent of adults who used cocaine HCl or base/crack within the past year, by country.

Countries with highest annual prevalence for cocaine HCl use
0
0.5
1
1.5
2
2.5
United
Sta
tes
Domin
can
Repub
licSpa
in
Austra
liaChil
e
Bolivia
Irelan
d
Argen
tina
United
King
don
1998
2000

0
0.2
0.4
0.6
0.8
1
1.2
1.4
1998
2000
Countries with highest annual prevalence for cocaine base/crack use

0
50
100
150
200
250
300
1998
2000
Countries with highest annual Cocaine
Consumption (Metric Tons; 1998, 2000)