Scalab le Isosurface Visualization of Massive Datasets on ...
Upload
continuum-analyticsCategory
view
938download
1
© 2016 Continuum Analytics - Confidential & Proprietary© 2016 Continuum Analytics - Confidential & Proprietary
Interactive Visual Statistics on Massive Datasets
Peter Wang CTO, Co-founder Continuum Analytics @ContinuumIO @pwang

© 2016 Continuum Analytics - Confidential & Proprietary© 2016 Continuum Analytics - Confidential & Proprietary
What’s the Problem?

© 2016 Continuum Analytics - Confidential & Proprietary
Big data magnifies small problems
3
• Of course, big data presents storage and computation problems • More importantly, standard plotting tools have problems that are
magnified by big data: • Overdrawing/Overplotting • Saturation • Undersaturation • Binning issues
• We’ll first explain these problems, and then present a new technique called datashading to address them head-on.

© 2016 Continuum Analytics - Confidential & Proprietary
Overdrawing
4
• For a scatterplot, the order in which points are drawn is very important
• The same distribution can look entirely different depending on plotting order
• Last data plotted overplots

© 2016 Continuum Analytics - Confidential & Proprietary
Overdrawing
5
• Underlying issue is just occlusion
• Same problem happens with one category, but less obvious
• Can prevent occlusion using transparency

© 2016 Continuum Analytics - Confidential & Proprietary
Saturation
6
• E.g. for alpha = 0.1, up to 10 points can overlap before saturating the available brightness
• Now the order of plotting matters less
• After 10 points, first-plotted data still lost
• For one category, 10, 20, or 2000 points overlapping will look identical

© 2016 Continuum Analytics - Confidential & Proprietary
Saturation
7
• Same alpha value, more points:
• Now is highly misleading
• alpha value depends on size, overlap of dataset
• Difficult-to-set parameter, hard to know when data is misrepresented

© 2016 Continuum Analytics - Confidential & Proprietary
Saturation
8
• Can try to reduce point size to reduce overplotting and saturation
• Now points are hard to see, with no guarantee of avoiding problems
• Another difficult-to-set parameter
• For really big data, scatterplots start to become very inefficient, because there are many datapoints per pixel — may as well be binning by pixel

© 2016 Continuum Analytics - Confidential & Proprietary
Binning issues
9
• Can use heatmap instead of scatter
• Avoids saturation by auto-ranging on bins
• Result independent of data size
• Here two merged normal distributions look very different at different binning
• Another difficult-to-set parameter

© 2016 Continuum Analytics - Confidential & Proprietary
Plotting big data
10
• When exploring really big data, the visualization is all you have — there’s no way to look at each of the individual data points
• Common plotting problems can lead to completely incorrect conclusions based on misleading visualizations
• Slow processing makes trial and error approach ineffective
When data is large, you don’t know when the viz is lying.
© 2016 Continuum Analytics - Confidential & Proprietary© 2016 Continuum Analytics - Confidential & Proprietary
Datashading

© 2016 Continuum Analytics - Confidential & Proprietary
Datashading
12
• Flexible, configurable pipeline for automatic plotting • Provides flexible plugins for viz stages, like in graphics shaders • Completely prevents overplotting, saturation, and undersaturation • Mitigates binning issues by providing fully interactive exploration in web
browsers, even of very large datasets on ordinary machines • Statistical transformations of data are a first-class aspect of the
visualization • Allows rapid iteration of visual styles & configs, interactive selections and
filtering, to support data exploration
© 2016 Continuum Analytics - Confidential & Proprietary
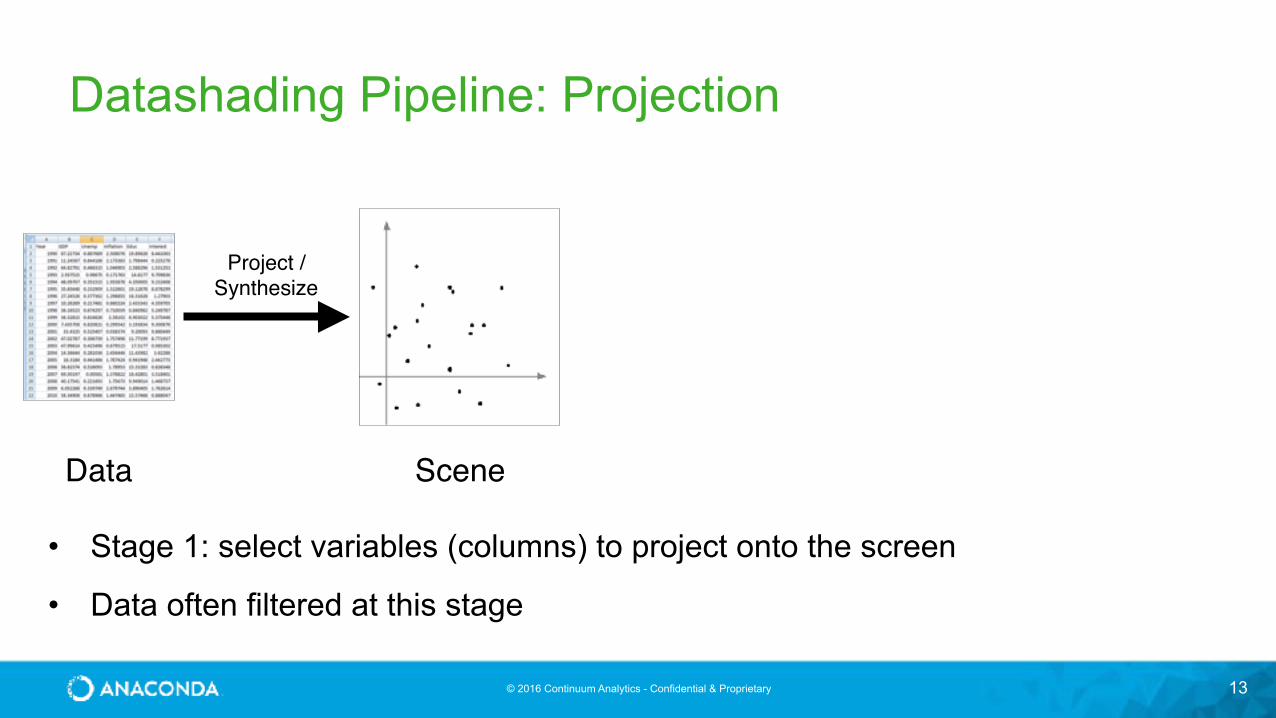
Datashading Pipeline: Projection
13
Data
Project /Synthesize
Scene
• Stage 1: select variables (columns) to project onto the screen
• Data often filtered at this stage

© 2016 Continuum Analytics - Confidential & Proprietary
Datashading Pipeline: Aggregation
14
Data
Project /Synthesize
Scene Aggregates
Sample / Raster
• Stage 2: Aggregate data into a fixed set of bins
• Each bin yields one or more scalars (total count, mean, stddev, etc.)

© 2016 Continuum Analytics - Confidential & Proprietary
Datashading Pipeline: Transfer
15
Data
Project /Synthesize
Scene Aggregates
Sample / Raster Transfer
Image
• Stage 3: Transform data using one or more transfer functions, culminating in a function that yields a visible image
• Each stage can be replaced and configured separately

© 2016 Continuum Analytics - Confidential & Proprietary© 2016 Continuum Analytics - Confidential & Proprietary
Demos
© 2016 Continuum Analytics - Confidential & Proprietary
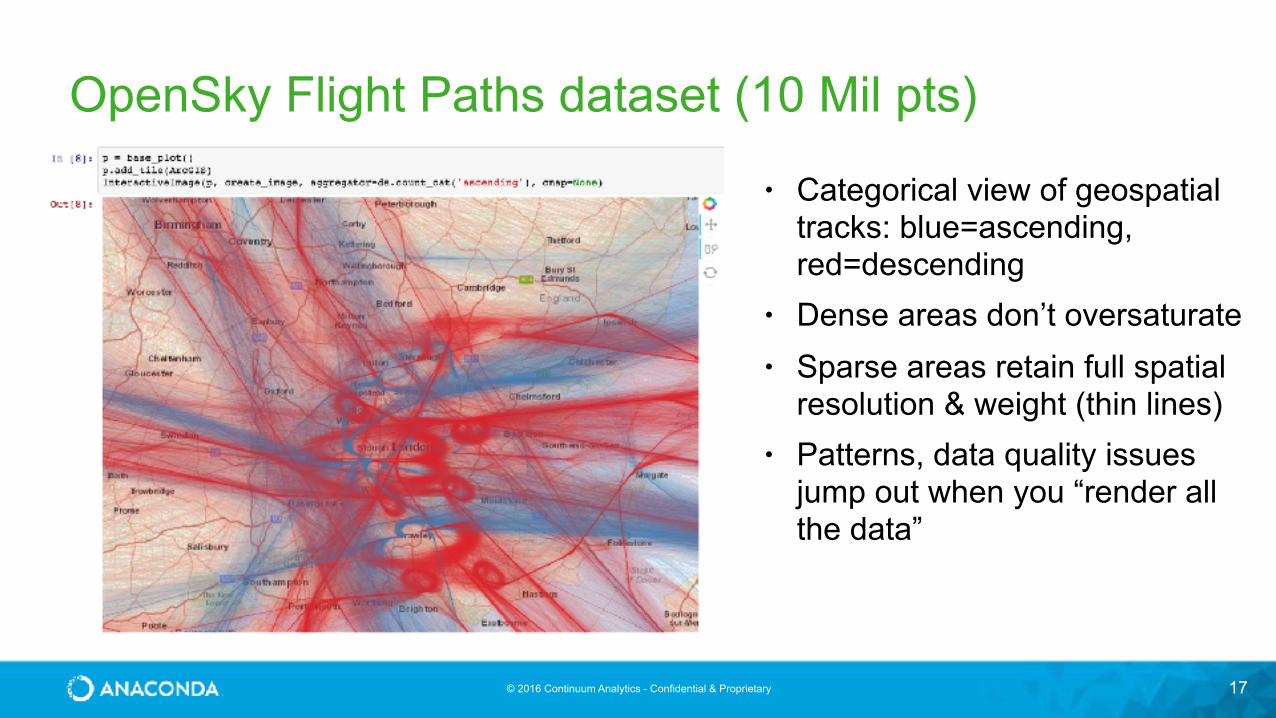
OpenSky Flight Paths dataset (10 Mil pts)
17
• Categorical view of geospatial tracks: blue=ascending, red=descending
• Dense areas don’t oversaturate • Sparse areas retain full spatial
resolution & weight (thin lines) • Patterns, data quality issues
jump out when you “render all the data”

© 2016 Continuum Analytics - Confidential & Proprietary
NYC Taxi Subset (12 Mil rides)
18
Comparing pickup locations vs drop-offs; pattern-of-life pops out instantly
Perceptually accurate colormaps prevents over-saturation

© 2016 Continuum Analytics - Confidential & Proprietary
Flexible Statistics
19
Normalized Difference Vegetation Index
© 2016 Continuum Analytics - Confidential & Proprietary
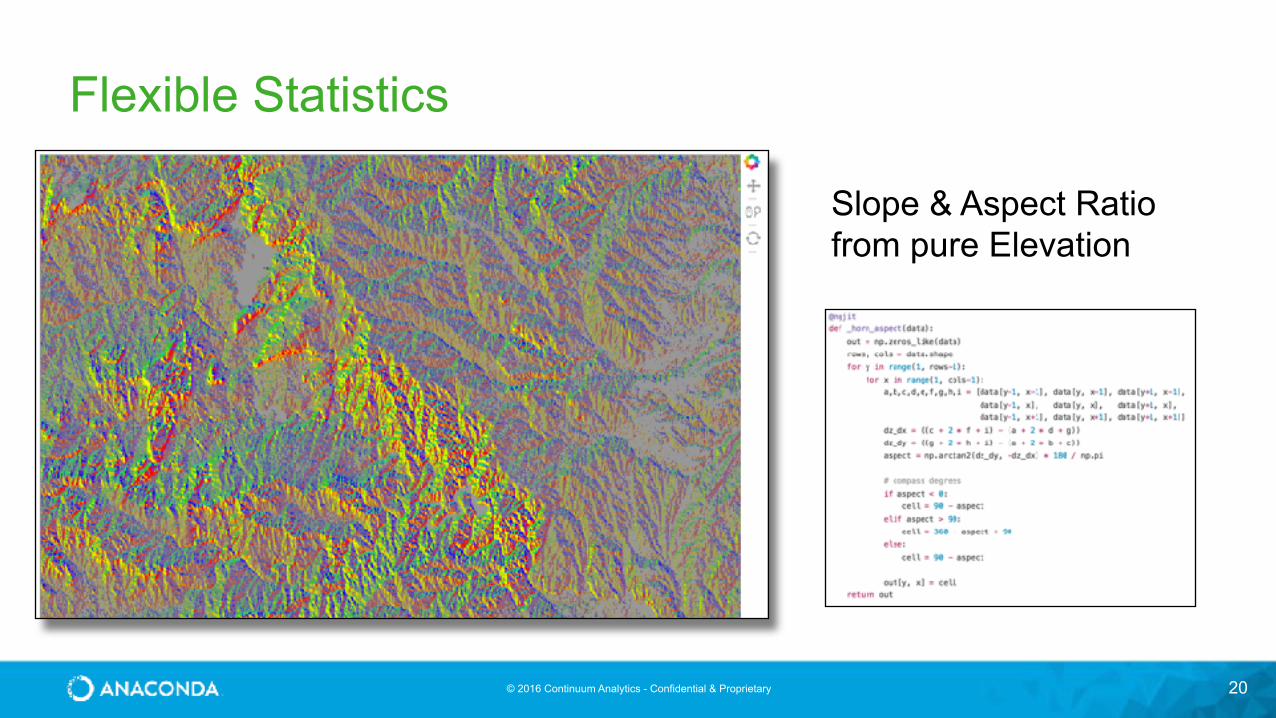
Flexible Statistics
20
Slope & Aspect Ratio from pure Elevation

© 2016 Continuum Analytics - Confidential & Proprietary
HoloViews/GeoViews + Datashader
21
tiles * datashade(hv.Points(dataset), x_range=x_range, y_range=y_range, cmap=color_key, aggregator=ds.count_cat('race'), x_sampling=10, y_sampling=10) * color_points * districts
© 2016 Continuum Analytics - Confidential & Proprietary 22
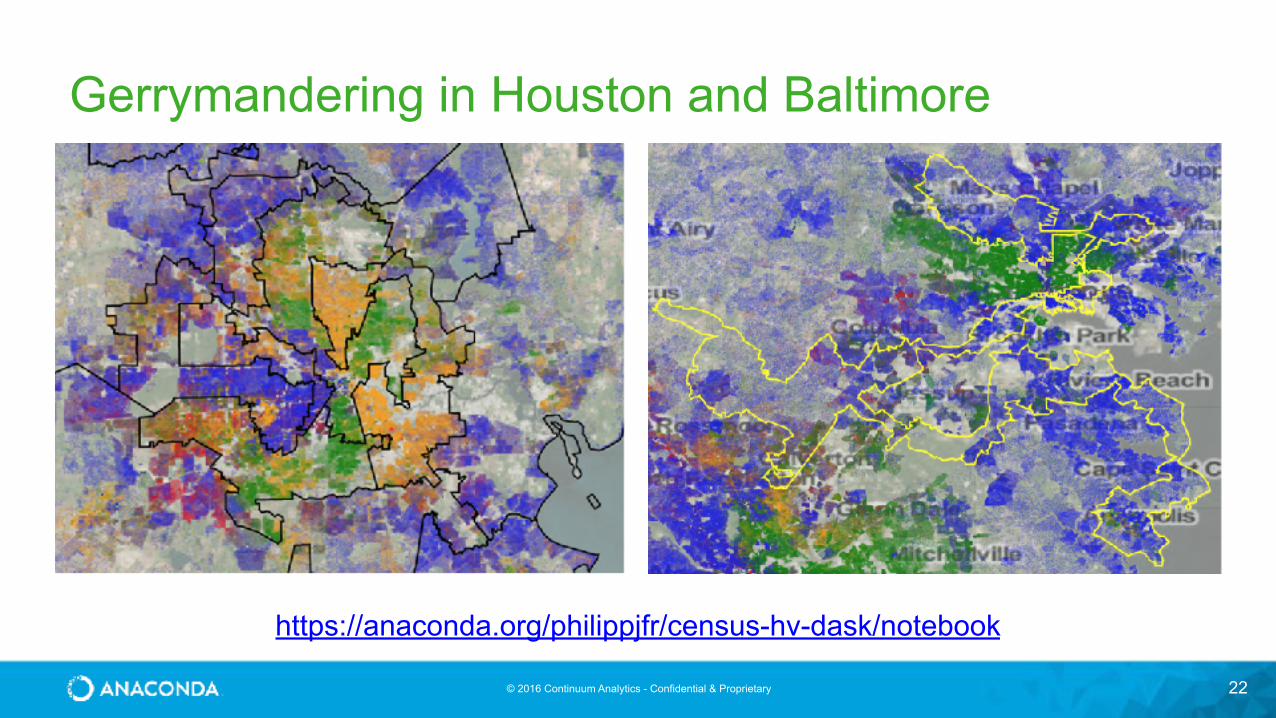
Gerrymandering in Houston and Baltimore
https://anaconda.org/philippjfr/census-hv-dask/notebook
© 2016 Continuum Analytics - Confidential & Proprietary© 2016 Continuum Analytics - Confidential & Proprietary
Anaconda
© 2016 Continuum Analytics - Confidential & Proprietary 24
• Simplify setup for non-engineers
• Enable easy development on and deployment to multiple platforms.
• Enable data scientists to experiment and iterate even more rapidly
• Eliminate the pains associated with package and dependency management
Why Did We Create Anaconda?To Enhance Python and Enable Data Scientist to Quickly Engage with Their Data

© 2016 Continuum Analytics - Confidential & Proprietary 25
Anaconda
Modern, Open-Source Analytics Platform powered by Python
Quickly Engage w/ Your Data
• 500+ Popular Python Packages
• Optimized & Compiled
• Free for Everyone
• Extensible via Conda Package Manager
• Sandbox Packages & Libraries
• Cross-Platform – Windows, Linux, Mac
• Not just Python - over 230 R packages
• Foundation of our Enterprise Products

© 2016 Continuum Analytics - Confidential & Proprietary 26
On-premises package repository and sharing platform • Governance for your analytics environment - maintain
control of the packages used by your analysts
• Easily replicate and share analysts’ environments
• Centrally store proprietary libraries and manage versioning
Cluster environment management • Manages Python, R, Java, Scala packages
across the cluster
• Easily replicate analysts’ environments for different jobs/users/groups
• Strong support for Hadoop & Spark
Anaconda Enterprise
© 2016 Continuum Analytics - Confidential & Proprietary 27
Anaconda EnterpriseScalable Computing and Collaboration
• Multi-user notebook deployments
• Scalable notebook deployment model • Project-based management • Notebook versioning and locking
• Extended support for Hadoop Stack (Storm, Spark Streaming, Kafka)
• Single sign-on support(PKI, Kerberos etc.) • Burst Compute support

© 2016 Continuum Analytics - Confidential & Proprietary 28
Consulting
Customers include: • JPL • DARPA • Sandia National Labs • AMD • Bank of America • Bloomberg
We Will Help Design, Architect, and Build the Right Analytics For You
Leverage our Open-Source Projects
© 2016 Continuum Analytics - Confidential & Proprietary
Want to schedule an Anaconda Enterprise demo? Interested in how Anaconda can help your Data Science team?
We can help—let’s get your organization started on the path to Open Data Science.
Contact us at [email protected]
Learn More About Anaconda
29