Interactive Image Processing for Meteorological Applications at NASA/Goddard Space Flight Center
13
Purdue University Purdue e-Pubs LARS Symposia Laboratory for Applications of Remote Sensing 1-1-1975 Interactive Image Processing for Meteorological Applications at NASA/Goddard Space Flight Center James B. Billingsley Frederick A. Hasler Follow this and additional works at: hp://docs.lib.purdue.edu/lars_symp is document has been made available through Purdue e-Pubs, a service of the Purdue University Libraries. Please contact [email protected] for additional information. Billingsley, James B. and Hasler, Frederick A., "Interactive Image Processing for Meteorological Applications at NASA/Goddard Space Flight Center" (1975). LARS Symposia. Paper 77. hp://docs.lib.purdue.edu/lars_symp/77
Transcript of Interactive Image Processing for Meteorological Applications at NASA/Goddard Space Flight Center
Purdue UniversityPurdue e-Pubs
LARS Symposia Laboratory for Applications of Remote Sensing
1-1-1975
Interactive Image Processing for MeteorologicalApplications at NASA/Goddard Space FlightCenterJames B. Billingsley
Frederick A. Hasler
Follow this and additional works at: http://docs.lib.purdue.edu/lars_symp
This document has been made available through Purdue e-Pubs, a service of the Purdue University Libraries. Please contact [email protected] foradditional information.
Billingsley, James B. and Hasler, Frederick A., "Interactive Image Processing for Meteorological Applications at NASA/Goddard SpaceFlight Center" (1975). LARS Symposia. Paper 77.http://docs.lib.purdue.edu/lars_symp/77

Reprinted from Symposium on
Machine Processing of Remotely Sensed Data
June 3 - 5, 1975
The Laboratory for Applications of
Remote Sensing
Purdue University West Lafayette
Indiana
IEEE Catalog No. 75CH1009-0 -C
Copyright © 1975 IEEE
The Institute of Electrical and Electronics Engineers, Inc. Copyright © 2004 IEEE. This material is provided with permission of the IEEE. Such permission of the IEEE does not in any way imply IEEE endorsement of any of the products or services of the Purdue Research Foundation/University. Internal or personal use of this material is permitted. However, permission to reprint/republish this material for advertising or promotional purposes or for creating new collective works for resale or redistribution must be obtained from the IEEE by writing to [email protected]. By choosing to view this document, you agree to all provisions of the copyright laws protecting it.

, I
INTERACTIVE IMAGE PROCESSING FOR
METEOROLOGICAL APPLICATIONS AT
NASA/GODDARD SPACE FLIGHT CENTER
James B. Billingsley Dr. A. Frederick Hasler
NASA/Goddard Space Flight Center Greenbelt, Maryland
I. ABSTRACT
Interactive image data processing has greatly improved the capability to extract scientific information from satellite image data. Previous methods of batch processing did not allow the scientist to interpret intermediate results on a short enough time scale to effectively modify either the data or processes as required for efficient data extraction.
A primary Goddard Space Flight Center meteorological program objective is to develop methods to improve detection and prediction of severe storms using geostationary satellite measurements. Interactive data processing systems can perform many tasks towards meeting this objective.
The development of interactive image processing techniques which have led to meteorological data processing systems at the Goddard Space Flight Center are discussed. Hardware and software functions of the existing Image Display and Manipulation System (lOAMS) and the special purpose METPAK software package which has been developed for performing meteorology operations on lOAMS are described. A second generation interactive image processing system, the Atmospheric and Oceanographic Information Processing System (AOIPS), which is under development, is also outlined. These systems are being designed to provide the necessary high throughput required for analysis of geostationary satellite data in the time domain.
II. INTRODUCTION
For over ten years, meteorologists at the Goddard Space Flight Center (GSFC) have analyzed satellite data with computer assistance. The ability to modify and analyze data interactively is relatively new and offers to the user rapid step-by-step analysis with intermediate result presentation. Hardware and software systems discussed in this paper are specifically designed to interactively assist the meteorologist with the extraction and analysis of his data.
III. GSFC METEOROLOGY PROGRAM OBJECTIVES
Meteorological image data processing program objectives at Goddard Space Flight Center are centered on the analysis of geostationary satellite data to obtain a qualitative understanding of and derive quantitative parameters for the following: 1) the detection and prediction of severe storms, 2) the improvement of short term and long term global atmospheric numerical prediction models, and 3) the development of improved satellite systems. The driving requirement for a qualitative understanding is the multispectral display of a series of time lapsed enhanced images of a rapidly developing severe local storm. The principal requirement of the quantitative parameter derivation is the measurement of cloud motions for the determination of wind velocity. Wind velocity measurements are essential for all types of analysis from the small scale severe storm to the global atmospheric model.
I
3B-21

Iii , ,
i
2
IV. BACKGROUND
In January of 1971, an in-house developed image processing system was completed at Goddard Space Flight Center. This system was designated IDAMS (Image Display and Manipulation System). IDAMS was developed to interactively perform geometric and radiometric modification to digital image data and to display the results on color I and black and white television monitors. Operator interaction with the computer software and display hardware is achieved through a computer graphics terminal, a joystick, and function control switches (see Figure 1). Early in 1974, the potential of using IDAMS for meteorological image data processing was explored and the decision made to implement meteorological data processing functions on IDAMS. Methods used by universities and other research organizations for processing of meteorological data were evaluated prior to IOAMS software implementation.
Two approaches to wind velocity (speed and direction) determination using television and computer systems have been developed under NASA meteorology study contracts,. one by Stanford Research Institute and the other by the University of Wisconsin. Both methods are based on the premise that wind vectors relate directly to change in cloud position over a period of time. Satellite image data received at known intervals provides a data base from which cloud sets are selected for tracking.
The Stanford Research Institute system (SRI/NASA cloud study console) records photographic hard copy imagery on an analog television "instant replay" disk recorder. Time lapse viewing of the recorded image series, using conventional television monitors, enables the operator to select cloud sets which can be tracked to generate the cloud motion wind estimates. A cursor is positioned, by the operator, on each cloud to be tracked and the cursor position is. transferred to punched paper tape for input to the computer. This process is repeated on each successive image to establish cloud motion. Landmark data is assembled in a like manner and transferred to the computer to be used as a geometric standard for image data registration and geographic location. Cloud and landmark positions are computer processed to produce an output tabulation and vector plot of the wind vectors.
The University of Wisconsin system, designated McIDAS (Man-Computer Interactive Data Access System), is similar in function to the SRI wind vector generation; however, in this case, the processing computer is an integral part of the system. This system approach offers considerably improved operator interaction, system accuracy, and flexibility. The MCIDAS input data base is from direct recorded satellite digital data. Digital data from approximately 30 SMS (Synchronous Meteorological Satellite) visible spectrum images (15,288 6-bit picture elements per line by 14,568 lines on each image) and 30 infrared images (3,822 a-bit picture elements per line by 1,821 lines per image) are stored On a single 14 inch reel of magnetic tape. Image data are merged with orbit, landmark,' and sensor related measurements in a preprocessing mode to establish the geographic location of picture elements.
Once geographic location of the picture elements are known, precise positions of clouds selected to establish wind vectors are also known. Interactive cloud selection is followed by vector generation, which yields an image display on the television monitors of the original image data overlaid with arrows which represent the wind vectors.
A cloud height preprocessing algorithm is being tested at the University of Wisconsin to determine the altitude of clouds used for wind vector generation thus providing wind vector data for several altitudes. The construction of three dimensional wind vector sets will be possible using this approach.
V. DEVELOPMENT OF FACILITIES
A. IDAMS SYSTEM DEVELOPMENT
Design of the Image Display and Manipulation System (IDAMS) was initiated in early 1970 to provide an image data manipulation capability primarily for earth resources satellite data processing. Basic system guidelines required the use of an existing computer manufactured by Control Data Corporation (CDC 3200) and the d~velopment of an interactive television terminal to be connected to the computer.
The lDAMS interactive terminal was designed around a digital disk recording system which is used to refresh the television monitor screen 30 times per second.
3B-22

i I
j
~
Approximately six miilion bits or three television images (500 x 700 x 5 bits) are stored in digital form on the disk. Figure 2 is a simple block diagram of the IOAMS display terminal and computer system.
Image data is t~ansferred from computer tape or disk through the computer interface and a buffer memory to the IOAMS television refresh disk. Transfer time is 13 seconds per image. The three stored images may be displayed in true color, false color, pseudo color, or black and white as the operator chooses. Oigital inversion capabilities allow a mixture of positive and negative image data for false color presentation and image subtraction. A fade control is used to view two images simultaneously. Image alternation for time lapse viewing and split screen presentations are included in the terminal hardware. Selection of image alternation rates and the sequence which the stored images are to be shown in time lapse is under either computer or manual control. A video disk recorder is available as the image storage media for time lapse viewing of up to 600 images. The video recorder is an analog system and therefore modification of image data must be performed prior to recording. An IOAMS hardware digital level slice function is used to divide the image gray scale into three color display boundaries. The lower gray scale values are displayed in shades of red, the middle values in shades -of green, and the upper levels in shades of blue. Two thumbwheel switches are used to select the dividing points between colors at any point on the 32-level gray scale.
Graphic overlay hardware functions include a crosshair or cursor and a variable sized rectangle. The position of the cursor and the rectangle's position, size and shape are under direct computer control. The operator can position or modify rectangle size by either typing his input requirements or by using the joystick and switches on the terminal console. The joystick and switches are linked back to the computer so that their functions may be determined by software assignment. The IOAMS software package is very broad and encompasses most image data manipulation operations being performed at image processing facilities around the country. Image display software is based on image reduction or zoom of input image data to television sized images. Image data sets which are larger than approximately 500 X 700 picture elements are reduced for television monitor display by linear interpolation between adjacent elements. Smaller data sets are either displayed one-to-one or the zoom function is performed by repeating picture elements to fill the 500 X 700 dimension. Normal operations of the reduce and zoom functions are as follows:
1. Reduce large image data set for viewing. 2. Select an area of interest from the displayed image with the graphic
rectangle. 3. Zoom selected image area to television screen dimensions and display.
In each case of reduce and zoom, original image data is used in the process to present the highest quality display and to preserve data integrity.
Other IOAMS software functions may be used in a similar manner. An area is operator selected from a reduced image for radiometric or geometric manipulation of the corresponding image data. The reverse of this approach is also a normal operation; that is, a television sized image may be used for interactive manipulation and then, upon command, the same manipulation is applied to a larger image data set.
Some of the significant general purpose IDAMS software includes: linear and nonlinear contrast modification: histogram development; image ratioing; image subtraction; image data filtering; geometric rotation, projection, and correction.
The general purpose IOAMS radiometric and geometric image data manipulation software has been augmented with several special purpose software systems. These special software systems are discipline related composites of existing image manipulation software and special function software necessary to perform the user's operation. The lOAMS multispectral classification and the meteorology cloud tracking wind vector software systems fall into this category.
B. rDAMS METEOROLOGICAL DATA PROCESSING
The special purpose software package developed for performing meteorology operations on IDAMS is called METPAK. METPAK is an enhanced combination of modified McIDAS
3B-23

cloud tracking and wind vector generation functions and IOAMS special purpose image processing functions. The METPAK design is predicated on grouping of image manipulation functions and the elimination or minimization of housekeeping requirements such as tape assignments, file numbering and other non-meteorology functions.
The software system communicates with the operator by means of menus and questions which require responses. Most responses are in the form of pressing a single button' to express operator decisions.
METPAK functions for cloud tracking to generate wind vectors are as follows:
1. Establish latitude and longitude of selected clouds to accurately measure cloud position change from one image to another.
2. Compute wind vectors from the displacement of the selected clouds.
3. Display the wind vector field for evaluation and interactive modification.
4. Provide printer output for direct analysis and magnetic tapes of wind vectors for plotters and hard copy image generation systems.
The following paragraphs describe a typical cloud tracking - wind vector generation operation on lDAMS.
prior to a session, the meteorologist selects a working image data set by indicating data acquisition date, time, and the acquiring satellite. Data tapes are selected from the tape archive and sent to the IOAMS facility for processing. Image data set size reduction to television display dimensions is either done as a non-prime time batch operation or may be accomplished using METPAK.
The initial METPAK menu presented to the operator, on the alphanumeric display, is shown in Figure 3. The image data reduction sequence for television display is initiated when the operator types the number 1. The METPAK menu is replaced with the image processing menu also shown in Figure 3. The image reduce function is selected by the operator to proceed. The image processing menu is replaced on the keyboard display with a series of instructions. The first instruction is to have the computer operator mount the master data tape on a specific tape drive. The second instruction requests the operator to name the reduced image. During each operation, informative statements are displayed to indicate to the user what is in process and where data is being stored. The reduced image data is automatically transferred to the lDAMS television refresh disk for display.
The reduce function is repeated for three image data sets which were acqUired from the satellite at selected intervals. More data sets may be used for wind vector generation, however, the first image reductions are performed to allow the user to select landmarks and areas of meteorological interest. The three images are viewed by the operator in a time lapse moving picture display to note position of viewable land, storms, and weather feature motion. The IOAMS graphic rectangle is used as a locator to outline the areas~of interest for ~nlarge or zoom functions.
The zoom function is first performed on areas the operator had selected to establish geographic earth reference. The dperator selects the landmark register function from the METPAK menu to begin the landmark zoom sequence. The METPAK menu is replaced with the landmark registration menu from which the landmark zoom function is selected. Inquiries such as zoom ratio, number of images to increase, and name of each image are responded to by the operator and the processes are performed based on operator responses.
Zoom ratios of either 1:1 or 4:1 are typical for locating landmarks. The 1:1 zoom ratio transfers one original data picture element to one television display element. The 4:1 zoom transfers original data picture elements and lines four times for a magnified image display.
After landmark zoom the operator continues the landmark registration sequence by typing the number 3 (see Figure 3). The operator positions the cursor over a known landmark on each zoomed image and aSSigns latitude and longitude coordinates to the
3B-24

I
selected point or points. An accurate map facility must be maintained for this purpose. A landmark data file is accumulated in the computer as the operator locates landmarks on an image series. When landmark selection is complete, the METPAK master menu is again displayed. The operator types the number 3 to initiate the navigation process.
The navigation program performs the computations necessary to precisely locate earth coordinates of any clouds which will be selected for wind vector generation. Inputs to the navigation programs are satellite orbit parameters and landmark coordinates from the landmark data file. The quality of navigation is tested and a navigation quality report is presented on the alphanumeric display. Poor navigation quality indicates improper landmark selection or incorrect orbit parameters. corrections are made by the op'erator, if required, before proceeding to the cloud tracking function.
Cloud tracking is the foundation upon which wind vector generation from satellite data is based.' Accuracy of wind vector sets generated by this method is based on the quality of available navigation data and the ability of the user to select clouds which move with the wind. The operator types the number 4 to begin cloud tracking.
The original reduced images are viewed in time lapse motion to select an area of meteorological interest. Area selection and zoom are performed as previously described. The zoomed images are displayed in time lapse motion for selection of good cloud tracers which will be used for wind vector generation.
Two modes of cloud 'selection are possible using IDAMS METPAK. One mode is single point tracking in which the operator selects the center or an identifiable feature on a cloud with the cursor on three successive images. Point selection accuracy is enhanced by alternately switching between images to display the point selected on the previous image and allowing the operator to modify the position of selected points on any of the images. Viewing the three images in time lapse motion with the selected points on each cloud displayed assures good single point selection. The second mode of cloud selection is performed in a similar manner to single point tracking except that a rectangle is used to outline selected cloud areas on each of the three images. Cloud displacements are computed by best fit cross correlation between the three cloud image data sets. This method requires less effort by the operator and is more precise than single point tracking but requires more computer time.
As cloud selection progresses in either mode, the operator is kept aware of selected clouds by the cursor momentarily flashing at each point previously selected. This function is necessary to eliminate duplicate selection and to insure complete cloud selection coverage over the displayed area. Upon completion of cloud selection, wind vector programs are initiated by typing the number 5.
Wind vectors are calculated by applying the previously determined navigation coordinate transform to the picture coordinates of a selected cloud set and establishing true earth displacement (distance and direction) of the clouds. Cloud displacement is divided by the time interval between images to calculate cloud velocity. Arrows are generated to present wind vector information to the user with arrow length proportional to wind speed. Arrow position and pointing direction relate wind direction as established from a particular cloud set.
Wind vectors are the output product of the IDAMS METPAK and are presented in several forms for use by the meteorologist. The display mode is used to observe wind flow and to edit out any obvious erroneous vectors. Display options include: vector field display, or vector display overlaid on selected images. Time lapse motion viewing of the vector overlaid image sets may be used for dynamic analysis of atmospheric motion.
3B-25

1,' \
Another information. selected and
wind vector output product is a computer printout of the wind vector The printout lists date, time, latitude and longitude of each cloud
the wind speed and direction from each cloud set.
Magnetic tapes of the vector and image overlaid vector data are another output product. These tapes are used to produce hard copy products such as: ink plot vectors for map overlay and photographic outputs of the vector sets overlaid on the I original image series. The choice of output products is made by the operator from a menu similar to other METPAK operations.
A utility program set has been included as part of the METPAK system to allow an operator to manipulat~ image data prior to, or during a processing session. The utility programs are intended to remove some of the rigidity imposed by the user oriented METPAK programs. Use of the utility programs is monitored to determine new system requirements in order to implement new METPAK and utility operations.
Data management programs are used throughout the METPAK software system to track image operations and stored results. Other routines within the data management programs allow an operator to stop and restart from any point in the METPAK operation. This provision is made to eliminate duplication of effort from session to session. The operator may terminate an operation at the end of a session and reinitiate at the same point in his next session. Saved and restart data is preserved on digital magnetic tape for re-entry.
IDAMS is being used as a technique development system for meteorology and earth resources applications. The METPAK software package has enabled the meteorology users to easily extract scientific data interaqtively with minimal system knowledge. The system must be limited to technique development, however, since an operational system requires much higher data throughput than is possible on lOAMS. lDAMS will be used for continued meteorology data processing technique development through early 1976. An operational system, the Atmospheric and Oceanographic Information Processing System (AOIPS), is currently under development. AOIPS will perform meteorology and earth resources data processing as well as new technique development on a much larger scale than the current IDAMS effort. The estimated starting date of operation is November 1975. '
C. THE ATMOSPHERIC AND OCEANOGRAPHIC INFORMATION PROCESSING SYSTEM (AOIPS)
AOIPS is a dual terminal multiprocessor image data processing system with much greater data manipulation and throughput capacity than the IOAMS facility. Meteorology and earth resources applications users share AOIPS for their interactive data manipulation analysis functions.
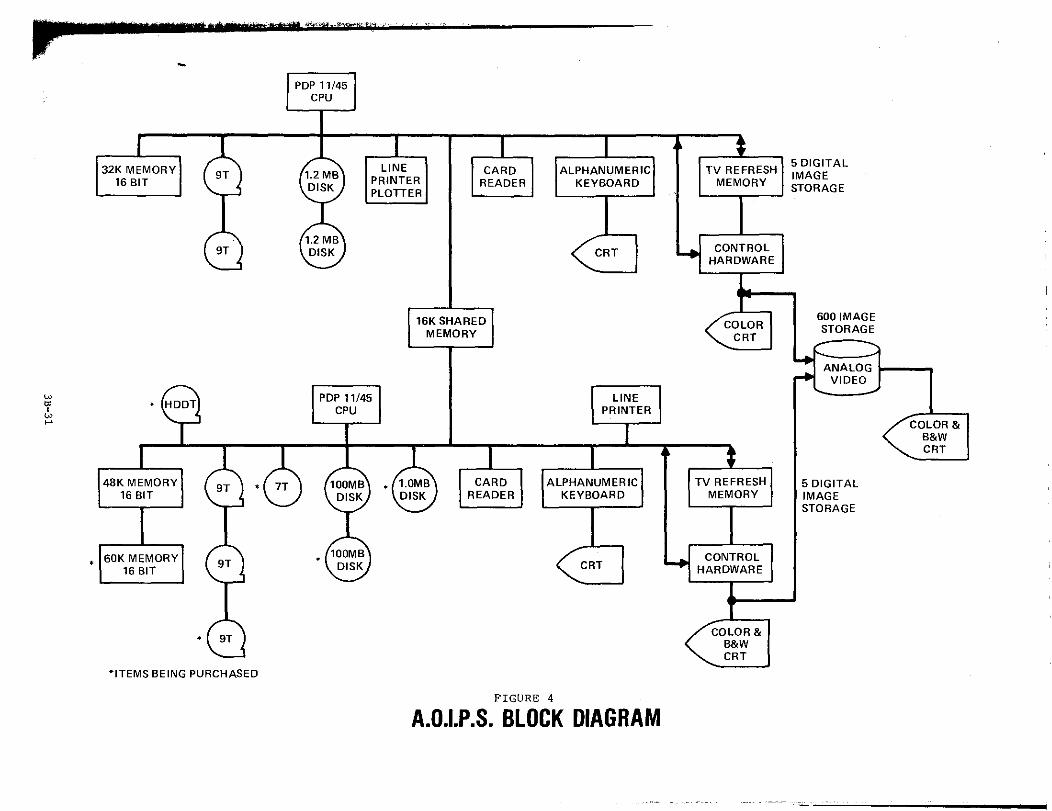
Central processing and control are performed by two Digital Equipment Corporation PDP 11/45 computers interconnected as dual multiprocessors. Either computer may use any of the peripheral equipments in both foreground and background modes of operation. System management software is used to assign equipment priorities for optimum data throughput. The system block diagram shown in Figure 4 illustrates interconnection of the AOIPS terminals, computers and related equipment. One of the terminals is currently in operation. The other terminal is to be delivered in late 1975. Several other items shown in the block diagram are also under development with anticipated delivery in late 1975 or early 1976. The present configuration has a modified General Electric Image-lOO serving as the interactive terminal.
The Image-IOO system has been modified to allow sequence viewing of an image series and to incorporate computer control of all hardware functions necessary for image manipulation. Digital image data is stored in th~ Image-lOO terminal for television screen refreshing and hardware manipulation. Five solid state memories provide storage for five television sized images. Each memory can store one eight-bit image with dimensions of 512 picture elements per line and 512 lines per image. The Image-lOO terminal is directly connected to one of the PDP 11/45 computers. Data linkage between computers is accomplished by interconnecting the computer data buses and certain control functions.
Data tape archives are maintained to provide users with an accessible data base. Standard 9-track digital magnetic tapes and high density digital tapes are stored in close proximity to the AOIPS facility and in the Goddard central tape
3B-26

storage. Operations personnel are responsible for acquiring data tapes prior to a user session and returning them to the appropriate storage after use.
The AOIPS high density digital tape recorder will be used for image data input. A large data compression ratio is achieved by using high density tapes rather than standard 9-track computer tapes. Image data from 250 9-track tapes may be stored on one high density tape. Savings of tape, storage space, and data acquisition time are considerable.
Television sized images generated during an operating session are stored for rapid recall on the two large computer disk systems. Accumulation of over 600 digital television sized images is possible. Data management software allocates storage area to each user for later recall of his image data. Larger image data sets may be stored should a user want to manipulate more than the viewed image area.
AOIPS system software has been under development since early 1975: The meteorology software package equivalent to METPAK will be ready by November 1975. Data management software is also being developed to provide data acquisition and storage operations on a large scale.
Upon delivery of the s~cond interactive terminal, the system will be fully linked for multiterminal and multiprocessor operation. The facility will provide the users with continuous 24-hour service. Preparatory operations will be performed at night to allow the users full utilization of their allocated time for application oriented data manipulations. A staff of system specialists will optimize data flow based on user needs to further facilitate system use for scientific analysis.
VI. SUMMARY AND FUTURE WORK
Interactive image data manipulation has allowed effective analysis of meteorological satellite data in the time domain which would otherwise be impossible. Future efforts will concentrate on the following:
1. Refinement of data processing techniques and meteorological analysis functions.
2. The development of new meteorological analysis functions.
3. The addition of a large on-line computer to allow the retrieval of data from large data banks and to perform analysis functions on a larger scale.
4. The development of a real time facility for severe storm forecasting research.
3B-27

•
I 3B-28

-. JIl"
w 'l' '" '"
~~~,--,,~.~ ---- --~----.-- .. -
-
TELETYPE KEYBOARD
,CONTROL CONTROL
CARD READER 1200 CPM
CARD PUNCH 250 CPM
MEMORY 16 K WORDS 24 BIT = 64K PIXELS (6 BIT PIXELS)
7T 800
CDC 3200 CPU
24 x 106 PIXELS
FIGURE 2
ALPHA NUMERIC CRT +
KEYBOARD
3 TV SIZE IMAGES DIGITAL I (1 x 10⁶ PIXELS)
VIDEO --.--
HARDWARE SELECTABLE FUNCTIONS
COLOR & B&W CRTS
ANALOG VIDEO -.--
600 TV IMAGES
B&W CRT
IMAGE DISPLAY AND MANIPULATION SYSTEM (IDAMS)
'!II

Figure 3 METPAK master menu and sub-menu examples
3B-30
, ,1 ee '7 m ibillkw t1W)
w
'" , w ~
~
PDP 11/45 CPU
I cj I I I 32K MEMORY LINE CARD ALPHANUMERIC
16 BIT 172MB PRINTER DISK READER KEYBOARD
PLOTTER
1.2MB 9T DISK CRT
16K SHARED MEMORY
'E? PDP 11/45 LINE
CPU PRINTER
I
8-0 48K MEMORY 100MB -@ CARD ALPHANUMERIC 16 BIT DISK DISK READER KEYBOARD
• 60K MEMORY 9T • 100MB
16 BIT DISK CRT
","'-.
ITEMS BEING PURCHASED
FIGURE 4
A.O.l.P.S. BLOCK DIAGRAM
t TV REFRESH
5 I~
MEMORY S·
L..t CONTROL HARDWARE
COLOR CRT
~ ANALOG VIDEO
COLOR & B&W
: CRT
TV REFRESH MEMORY
4 CONTROL HARDWARE
/COLOR& B&W
"'- CRT